Embed Size (px)
Citation preview

Expansion of the Panama CanalPotential Impact on Asia – East Coast/Golf TradeExpansion of the Panama CanalPotential Impact on Asia – East Coast/Golf Trade
Rodolfo SabongeVice-President, Market Research and Analysis Office
Panama Canal Authority
Rodolfo SabongeVice-President, Market Research and Analysis Office
Panama Canal Authority

DISCLAIMER. The information, documents, reports, maps and photographs displayed in
this PowerPoint presentation is sole proprietary of the ACP or used with the
authors’ authorization; therefore its modification, reproduction, distribution or
publication for any purpose is prohibited. Its use requires previous authorization of the
ACP.
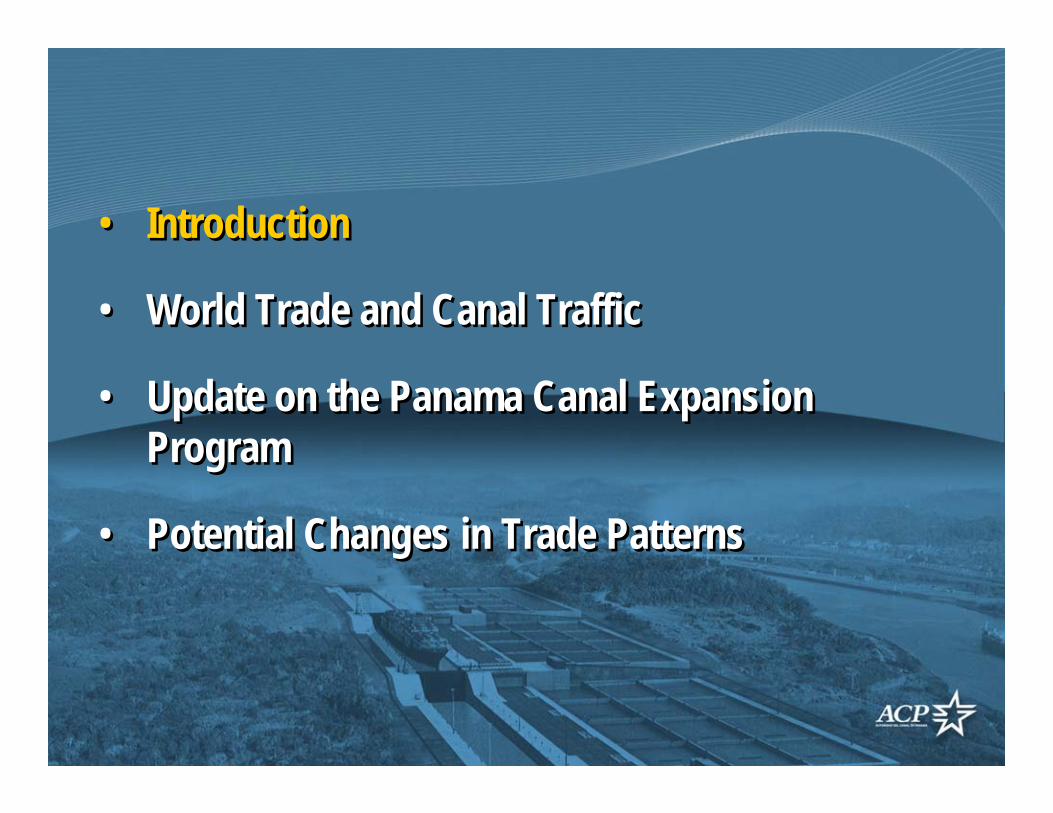
• Introduction
• World Trade and Canal Traffic
• Update on the Panama Canal Expansion Program
• Potential Changes in Trade Patterns
• Introduction
• World Trade and Canal Traffic
• Update on the Panama Canal Expansion Program
• Potential Changes in Trade Patterns

Gatun Lake
Atlantic Ocean
Pacific Ocean
MirafloresLake
Gatun Locks
Pedro Miguel Locks
Miraflores Locks
The Panama CanalThe Panama CanalApprox. 50 miles (80 km) long between the Atlantic and Pacific OceansGatun Lake is 85 feet (26 m) above sea levelThe water used to raise and lower vessels in each set of locks comes from Gatun Lake by gravity (approx. 52 million of gallons per transit)Transferred to the Republic of Panama at noon, Dec. 31, 1999.
Approx. 50 miles (80 km) long between the Atlantic and Pacific OceansGatun Lake is 85 feet (26 m) above sea levelThe water used to raise and lower vessels in each set of locks comes from Gatun Lake by gravity (approx. 52 million of gallons per transit)Transferred to the Republic of Panama at noon, Dec. 31, 1999.
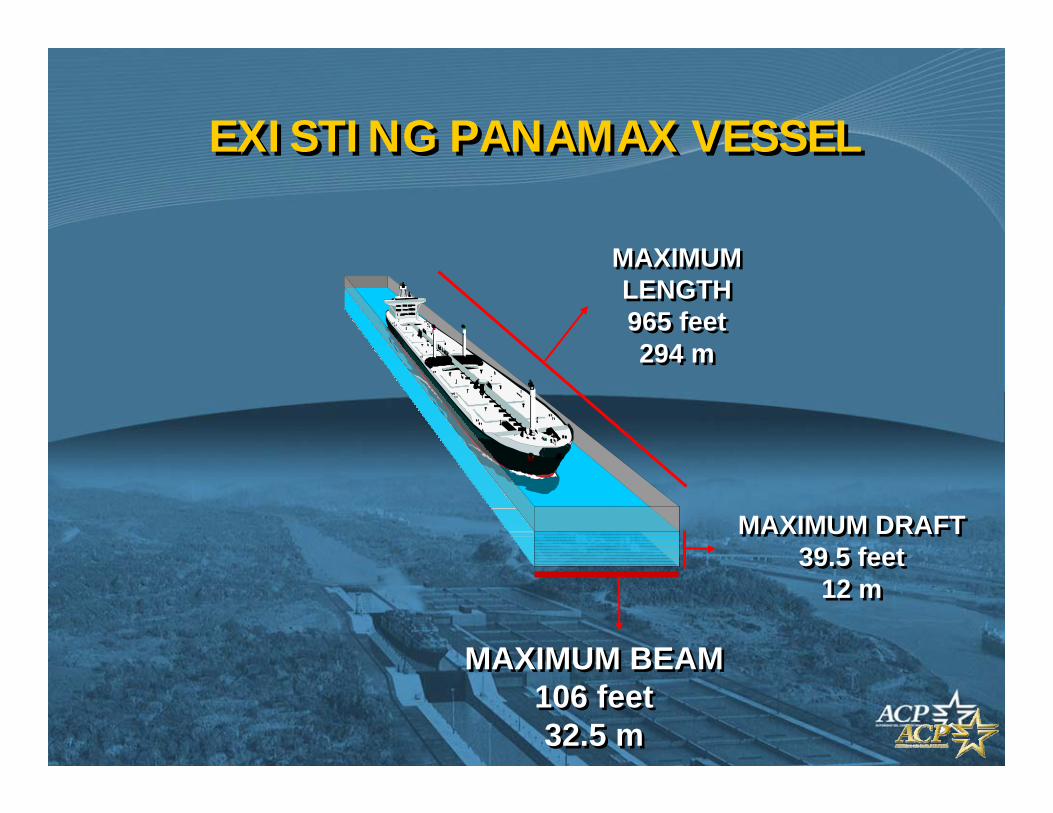
MAXIMUM DRAFT 39.5 feet
12 m
MAXIMUM DRAFT 39.5 feet
12 m
MAXIMUM BEAM 106 feet32.5 m
MAXIMUM BEAM 106 feet32.5 m
MAXIMUM LENGTH 965 feet294 m
MAXIMUM LENGTH 965 feet294 m
EXISTING PANAMAX VESSELEXISTING PANAMAX VESSEL


The Panama Canal in 1914The Panama Canal in 1914 The Panama Canal todayThe Panama Canal today

EVOLUTION OF SUPPLY CHAIN MANAGEMENT AND LOGISTICSEVOLUTION OF SUPPLY CHAIN MANAGEMENT AND LOGISTICS

In the relevant routes (Asia-east coast of the United States) the Panama Canal transported 43.0% of the Panama Canal trade cargo in 2008.
The Panama Canal Trade and Main UsersThe Panama Canal Trade and Main Users
* Measured in Million of Long TonsTotal Cargo Movement FY 2008
64% of Canal cargo traffic originates in or is destined to the United States
714.113.1Peru
817.317.3South Korea
1224.729.2Japan
1226.126.5European Union
1326.722.0Chile
2143.743.7China
64133.7136.8United States
2008 (%)
FY 2008*FY 2007*USERS

• World Trade and Canal Traffic
• Update on the Panama Canal Expansion Program
• Potential Changes in Trade Patterns
• World Trade and Canal Traffic
• Update on the Panama Canal Expansion Program
• Potential Changes in Trade Patterns

Tonnage growth 2006 2007 2008 2009 2010Airborne 7.9% 9.5% -4.6% -18.6% 6.6%Seaborne 5.1% 4.6% 3.4% -3.8% 3.9%Overland/other -1.3% 8.2% 3.0% -6.3% 4.0%
0
10002000
30004000
5000
60007000
80009000
1000020
00
2001
2002
2003
2004
2005
2006
2007
2008
2009
2010
2011
2012
2013
Airborne Seaborne Overland/other
(mill
ions
-m
etric
tons
)
Total World Trade by ModeTotal World Trade by Mode
Source: Global Navigator IHS Global Insight, June 09Source: Global Navigator IHS Global Insight, June 09

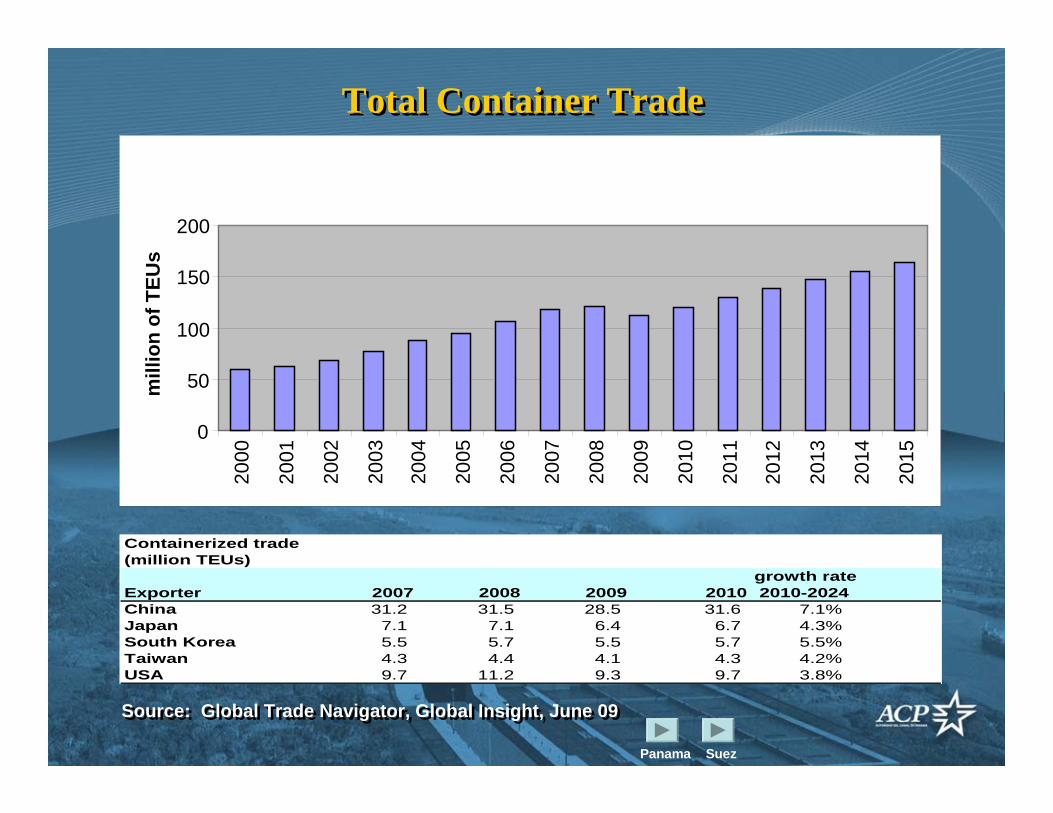
Containerized trade(million TEUs)
growth rateExporter 2007 2008 2009 2010 2010-2024China 31.2 31.5 28.5 31.6 7.1%Japan 7.1 7.1 6.4 6.7 4.3%South Korea 5.5 5.7 5.5 5.7 5.5%Taiwan 4.3 4.4 4.1 4.3 4.2%USA 9.7 11.2 9.3 9.7 3.8%
Total Container TradeTotal Container Trade
0
50
100
150
20020
00
2001
2002
2003
2004
2005
2006
2007
2008
2009
2010
2011
2012
2013
2014
2015
mill
ion
of T
EUs
Source: Global Trade Navigator, Global Insight, June 09Source: Global Trade Navigator, Global Insight, June 09
Panama Suez

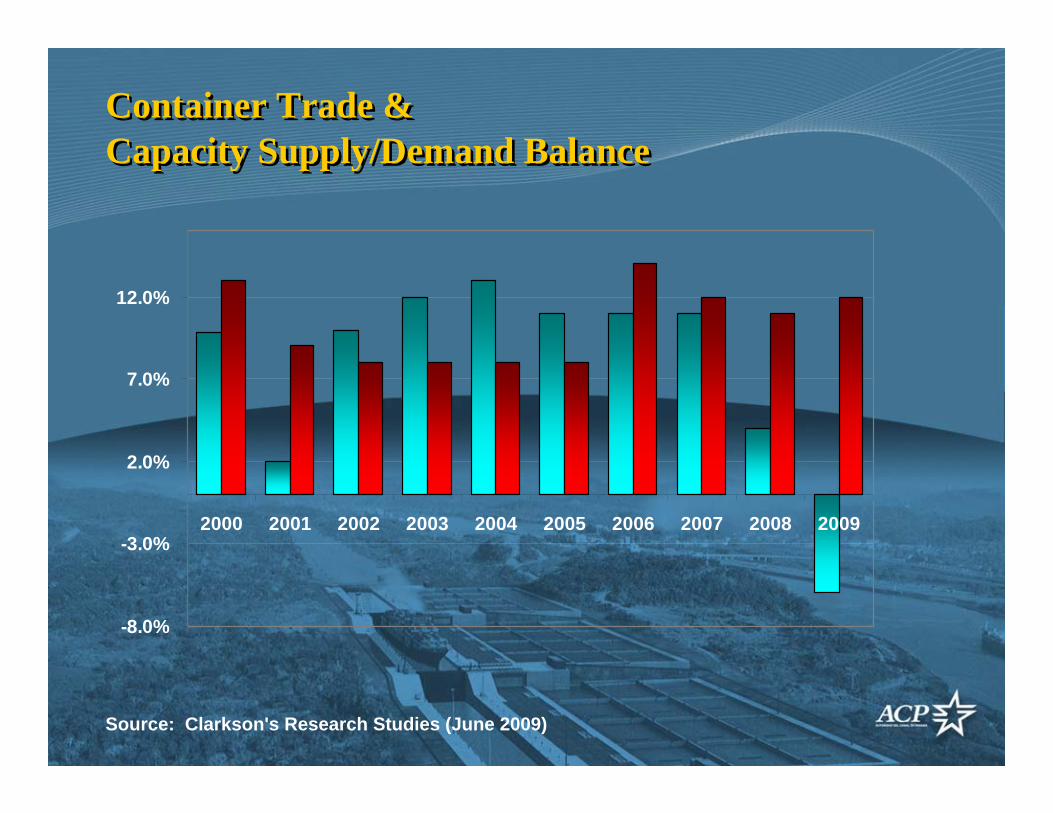
Container Trade & Capacity Supply/Demand BalanceContainer Trade & Capacity Supply/Demand Balance
Source: Clarkson's Research Studies (June 2009)
-8.0%
-3.0%
2.0%
7.0%
12.0%
2000 2001 2002 2003 2004 2005 2006 2007 2008 2009

0
50
100
150
200
250
300
350
400
25+ 20-24 15-19 10-14 5-9 0-4 OrderbookFeeder Handy Sub-Panamax Panamax Post-Panamax
Num
ber o
f Ves
sels
Age of Full Container Fleetby Size and Orderbook
Age of Full Container Fleetby Size and Orderbook
Source: Clarkson’s Reaserch Studies – August 2009

Post-Panamax FleetFull Container VesselsPost-Panamax Fleet
Full Container Vessels
Maersk Line 1/ 727,724 3,700-13,500 94 218,200 4,500-7,450 38 132 945,924Mediterranean Shipping (MSC) 404,308 4,469 - 13,800 47 133,400 12,400-13,800 10 57 537,708CMA-CMG 213,702 5,700 - 11,356 27 331,553 3,600-13,300 37 64 545,255Evergreen 200,478 5,364 - 7,024 33 N/A N/A N/A 33| 200,478Hapag Lloyd Cont. 97,613 7,719 - 8,750 12 122,500 8,750 14 26 220,113China Shipping 143,522 5,618 - 9,580 21 106,368 13,296 8 29 249,890Hanjin Shipping Co. 90,366 5,302 - 6,655 15 92,900 8,580-10,000 10 25 183,266Coscon 165,238 5250 - 10,050 24 108,000 13,500 8 32 273,238Nippon Yusen Kaisha (NYK) 171,348 6,148 - 9,012 24 46,500 9,300 5 29 217,848Mitsui O.S.K. 172,698 4,708 -9,100 26 53,600 6,700 8 34 226,298OOCL 152,467 4,583 -8,063 23 83,852 8,063-8,600 10 33 236,319K"Line" 157,632 5,500 -8,120 25 61,870 4,400-8,120 11 36 219,502Yang Ming 140,144 5,500 -8,236 21 90,700 4,500-8,200 15 36 230,844Hamburg Sud 84,712 5,550 - 5,905 15 37,405 5,905-6,300 6 21 122,117CSAV 32,705 6541 5 58,948 6,316 - 8,000 8 13 91,653Zim Integrated Shpg. 18270 8,200 - 10,070 2 198,420 8,200-12,600 18 20 210,440Otros 1,919,204 3700 -13,800 285 2,016,823 3,600 -14,000 203 488 3,936,027Total 4,892,131 699 3,761,039 409 1,108 8,653,170 Source: Shipping Intelligence Network, September 2009, Clarkson Research Services
Total Post-Panamax
Total TEU Capacity
Total Fleet - 2012
In order Post-Panamax Vessels
Shipping LineExisting
Post-Panamax TEU Range TEU Capacity
Post-Panamax Existing Fleet Full Container Vessels (Sept. 2009)
Orderbook - Post-Panamax Full Container Vessels
TEU Capacity in order TEU Range
4,892,131 3,761,039 8,653,170
• World Trade and Canal Traffic
• Update on the Panama Canal Expansion Program
• Potential Changes in Trade Patterns
• World Trade and Canal Traffic
• Update on the Panama Canal Expansion Program
• Potential Changes in Trade Patterns
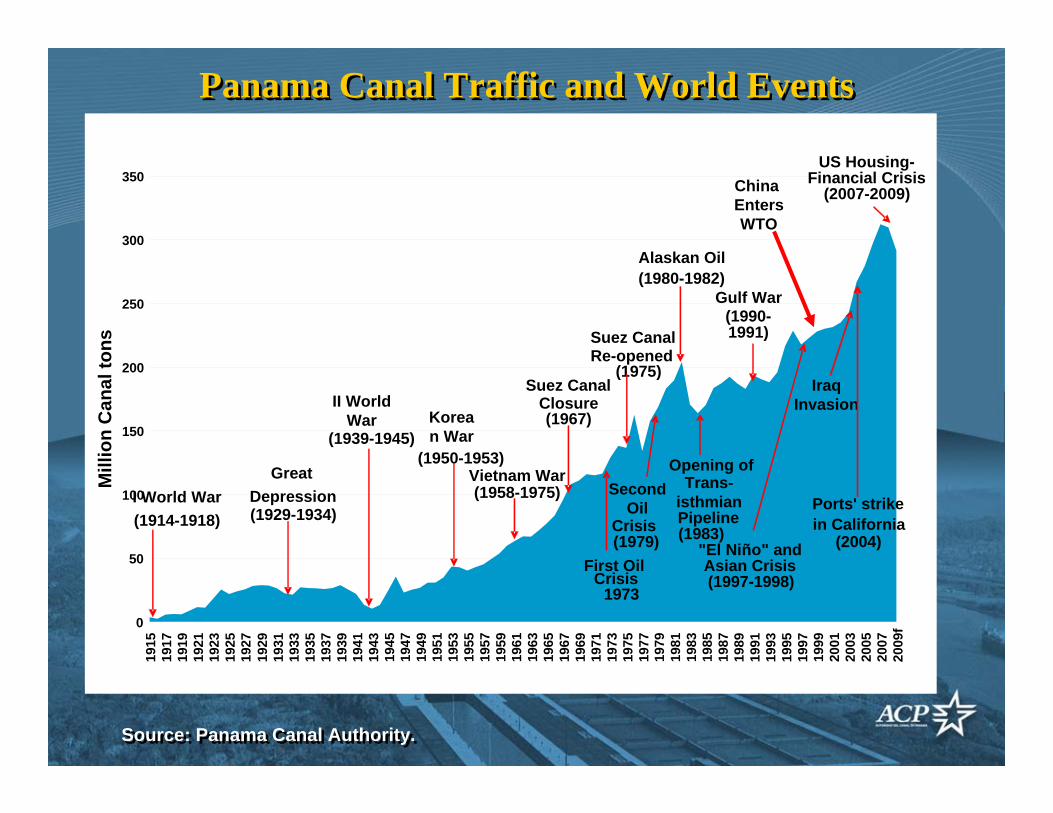
Source: Panama Canal Authority.Source: Panama Canal Authority.
Panama Canal Traffic and World EventsPanama Canal Traffic and World Events
0
50
100
150
200
250
300
350
1915
1917
1919
1921
1923
1925
1927
1929
1931
1933
1935
1937
1939
1941
1943
1945
1947
1949
1951
1953
1955
1957
1959
1961
1963
1965
1967
1969
1971
1973
1975
1977
1979
1981
1983
1985
1987
1989
1991
1993
1995
1997
1999
2001
2003
2005
2007
2009
f
Mill
ion
Can
al to
ns
I World War(1914-1918)
Great Depression(1929-1934)
Korean War
(1950-1953)Vietnam War(1958-1975)
Suez Canal Closure(1967)
"El Niño" and Asian Crisis (1997-1998)
Suez CanalRe-opened
(1975)
First Oil Crisis
1973
Trans-isthmian Pipeline (1983)
Gulf War(1990-1991)
Second Oil
Crisis(1979)
II World War
(1939-1945)
Iraq Invasion
Alaskan Oil(1980-1982)
Ports' strike in California
(2004)
US Housing-Financial Crisis
(2007-2009)
Opening of
China EntersWTO

Total PCUMS Vessel TonnageTotal PCUMS Vessel TonnageFiscal Years 2001-2009Fiscal Years 2001-2009
242.9
267.1
298.0313.2 309.9
231.8235.3
279.5299.1
0.0
50.0
100.0
150.0
200.0
250.0
300.0
350.0
2001 2002 2003 2004 2005 2006 2007 2008 2009
Mill
ion
Tons

Growth of container traffic throughthe Panama Canal (1998 – 2009 Est.)Growth of container traffic through
the Panama Canal (1998 – 2009 Est.)
Based on the capacity of transiting vessels – Source: ComPair Data - April 2009.
00
500500
10001000
15001500
20002000
25002500
30003000
35003500
40004000
FY98 FY99 FY00 FY01 FY02 FY03 FY04 FY05 FY06 FY07 FY08 FY09(Est)
Tran
sits
Tran
sits
00
22
44
66
88
1010
1212
1414
1616
Mill
ion
of T
EUs
Mill
ion
of T
EUs
Transits (1,644 - 3,485)
TEU Capacity (4.1M-12.6M)
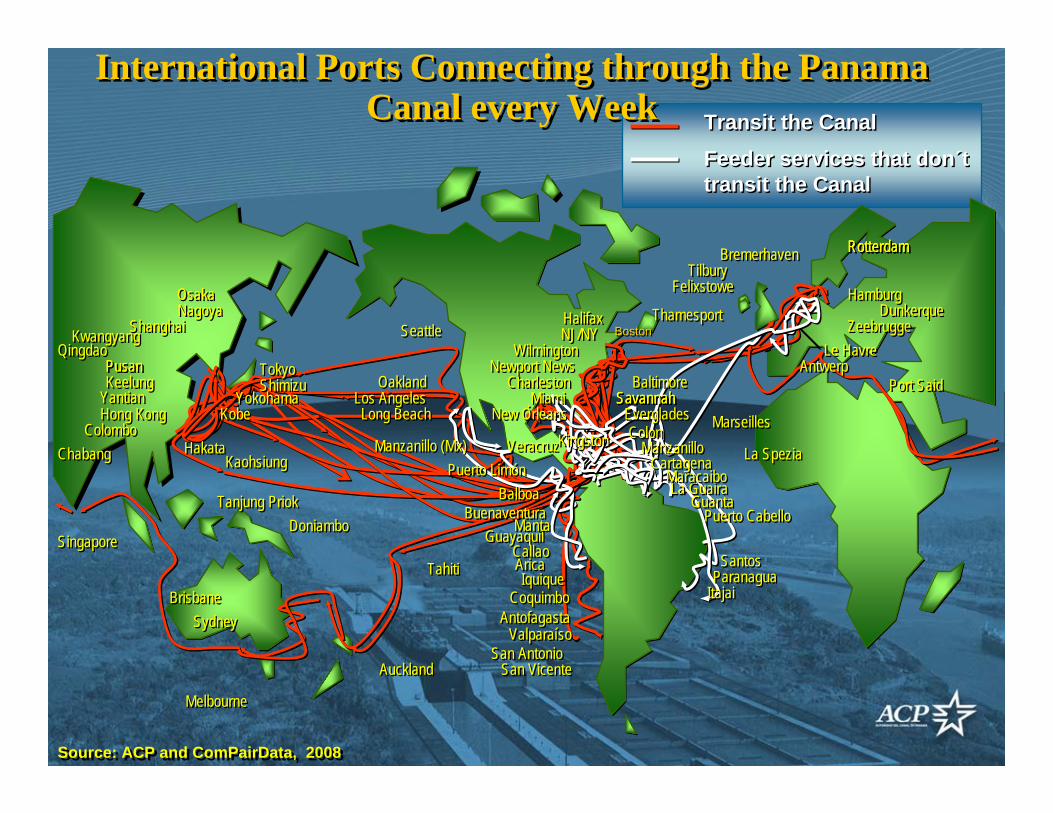
International Ports Connecting through the Panama Canal every Week
International Ports Connecting through the Panama Canal every Week
Source: ACP and ComPairData, 2008Source: ACP and ComPairData, 2008
SavannahSavannahYantianYantian
KwangyangKwangyang
Hong KongHong Kong
PusanPusan
SavannahSavannahKeelungKeelung
WilmingtonWilmingtonPusanPusan
NJ/NYNJ/NY
RotterdamRotterdam
Le HavreLe Havre
HalifaxHalifax
FelixstoweFelixstowe
Long BeachLong BeachLos AngelesLos Angeles
BremerhavenBremerhaven RotterdamRotterdam
KaohsiungKaohsiung
CharlestonCharleston
NagoyaNagoya ThamesportThamesport
OaklandOakland
SeattleSeattle
TokyoTokyo
ColomboColombo
ShanghaiShanghai
YokohamaYokohama
Newport NewsNewport News
HakataHakata Manzanillo (Mx)Manzanillo (Mx)
RotterdamRotterdam
KobeKobe
OsakaOsaka HamburgHamburg
ShimizuShimizu Port SaidPort Said
ZeebruggeZeebrugge
ChabangChabang
TahitiTahiti
AucklandAuckland
DoniamboDoniambo
BrisbaneBrisbaneSydneySydney
MelbourneMelbourne
Tanjung PriokTanjung Priok
SingaporeSingapore
MarseillesMarseilles
La SpeziaLa Spezia
TilburyTilbury
DunkerqueDunkerque
QingdaoQingdao
BuenaventuraBuenaventuraGuayaquilGuayaquil
CallaoCallaoAricaArica
CoquimboCoquimbo
San AntonioSan AntonioSan VicenteSan Vicente
Puerto LimónPuerto Limón
IquiqueIquique
MantaManta
AntofagastaAntofagastaValparaísoValparaíso
..
BalboaBalboa
AntwerpAntwerp
ItajaiItajai
SavannahSavannahBaltimoreBaltimore
New OrleansNew Orleans
ParanaguaParanaguaSantosSantos
Puerto CabelloPuerto Cabello
VeracruzVeracruz ManzanilloManzanilloColon Colon
CartagenaCartagenaLa GuairaLa Guaira
GuantaGuantaMaracaiboMaracaibo
EvergladesEverglades
KingstonKingston
MiamiMiami
Transit the CanalTransit the Canal
Feeder services that don´t transit the CanalFeeder services that don´t transit the Canal
BostonBoston
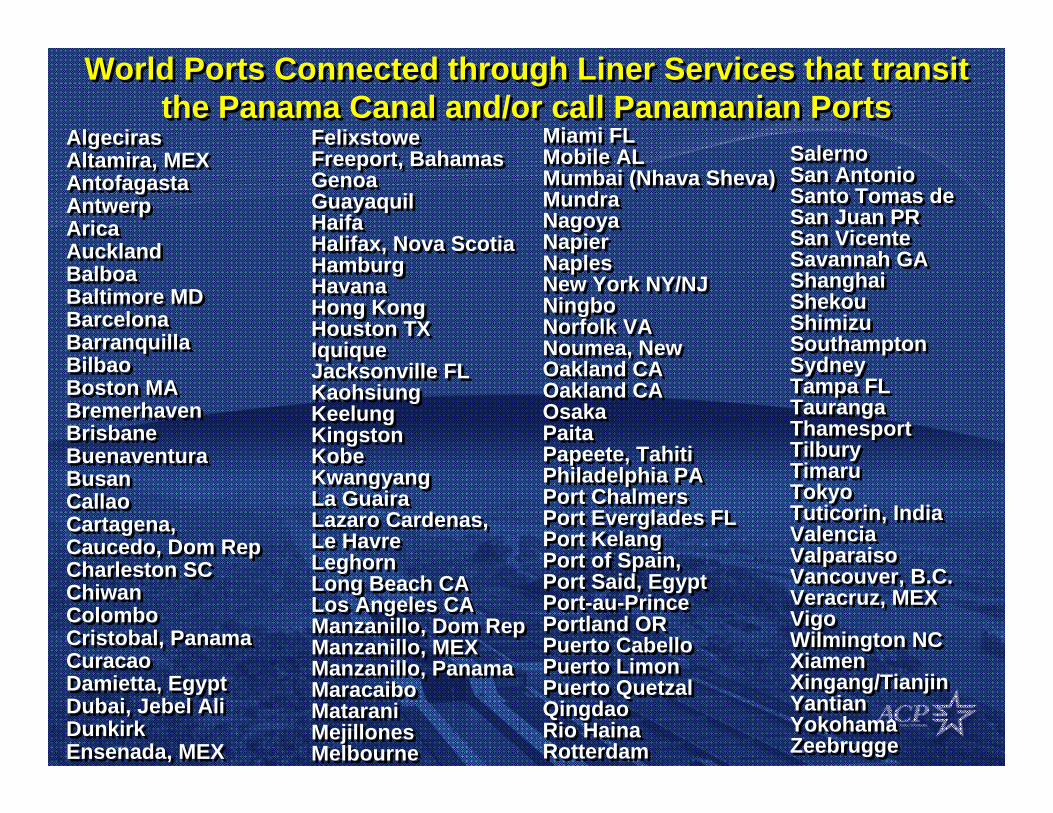
World Ports Connected through Liner Services that transit the Panama Canal and/or call Panamanian Ports
World Ports Connected through Liner Services that transit the Panama Canal and/or call Panamanian Ports
AlgecirasAlgecirasAltamira, MEXAltamira, MEXAntofagastaAntofagastaAntwerpAntwerpAricaAricaAucklandAucklandBalboaBalboaBaltimore MDBaltimore MDBarcelonaBarcelonaBarranquillaBarranquillaBilbaoBilbaoBoston MABoston MABremerhavenBremerhavenBrisbaneBrisbaneBuenaventuraBuenaventuraBusanBusanCallaoCallaoCartagena, Cartagena, Caucedo, Dom RepCaucedo, Dom RepCharleston SCCharleston SCChiwanChiwanColomboColomboCristobal, PanamaCristobal, PanamaCuracaoCuracaoDamietta, EgyptDamietta, EgyptDubai, Jebel AliDubai, Jebel AliDunkirkDunkirkEnsenada, MEXEnsenada, MEX
FelixstoweFelixstoweFreeport, BahamasFreeport, BahamasGenoaGenoaGuayaquilGuayaquilHaifaHaifaHalifax, Nova ScotiaHalifax, Nova ScotiaHamburgHamburgHavanaHavanaHong KongHong KongHouston TXHouston TXIquiqueIquiqueJacksonville FLJacksonville FLKaohsiungKaohsiungKeelungKeelungKingstonKingstonKobeKobeKwangyangKwangyangLa GuairaLa GuairaLazaro Cardenas, Lazaro Cardenas, Le HavreLe HavreLeghornLeghornLong Beach CALong Beach CALos Angeles CALos Angeles CAManzanillo, Dom RepManzanillo, Dom RepManzanillo, MEXManzanillo, MEXManzanillo, PanamaManzanillo, PanamaMaracaiboMaracaiboMataraniMataraniMejillonesMejillonesMelbourneMelbourne
Miami FLMiami FLMobile ALMobile ALMumbai (Nhava Sheva)Mumbai (Nhava Sheva)MundraMundraNagoyaNagoyaNapierNapierNaplesNaplesNew York NY/NJNew York NY/NJNingboNingboNorfolk VANorfolk VANoumea, New Noumea, New Oakland CAOakland CAOakland CAOakland CAOsakaOsakaPaitaPaitaPapeete, TahitiPapeete, TahitiPhiladelphia PAPhiladelphia PAPort ChalmersPort ChalmersPort Everglades FLPort Everglades FLPort KelangPort KelangPort of Spain, Port of Spain, Port Said, EgyptPort Said, EgyptPort-au-PrincePort-au-PrincePortland ORPortland ORPuerto CabelloPuerto CabelloPuerto LimonPuerto LimonPuerto QuetzalPuerto QuetzalQingdaoQingdaoRio HainaRio HainaRotterdamRotterdam
SalernoSalernoSan AntonioSan AntonioSanto Tomas de Santo Tomas de San Juan PRSan Juan PRSan VicenteSan VicenteSavannah GASavannah GAShanghaiShanghaiShekouShekouShimizuShimizuSouthamptonSouthamptonSydneySydneyTampa FLTampa FLTaurangaTaurangaThamesportThamesportTilburyTilburyTimaruTimaruTokyoTokyoTuticorin, IndiaTuticorin, IndiaValenciaValenciaValparaisoValparaisoVancouver, B.C.Vancouver, B.C.Veracruz, MEXVeracruz, MEXVigoVigoWilmington NCWilmington NCXiamenXiamenXingang/TianjinXingang/TianjinYantianYantianYokohamaYokohamaZeebruggeZeebrugge

1996: 235 Thousands TEUs2008: 4.6 Millions TEUs1996: 235 Thousands TEUs2008: 4.6 Millions TEUs
Source: Panama Maritime Authority (AMP).
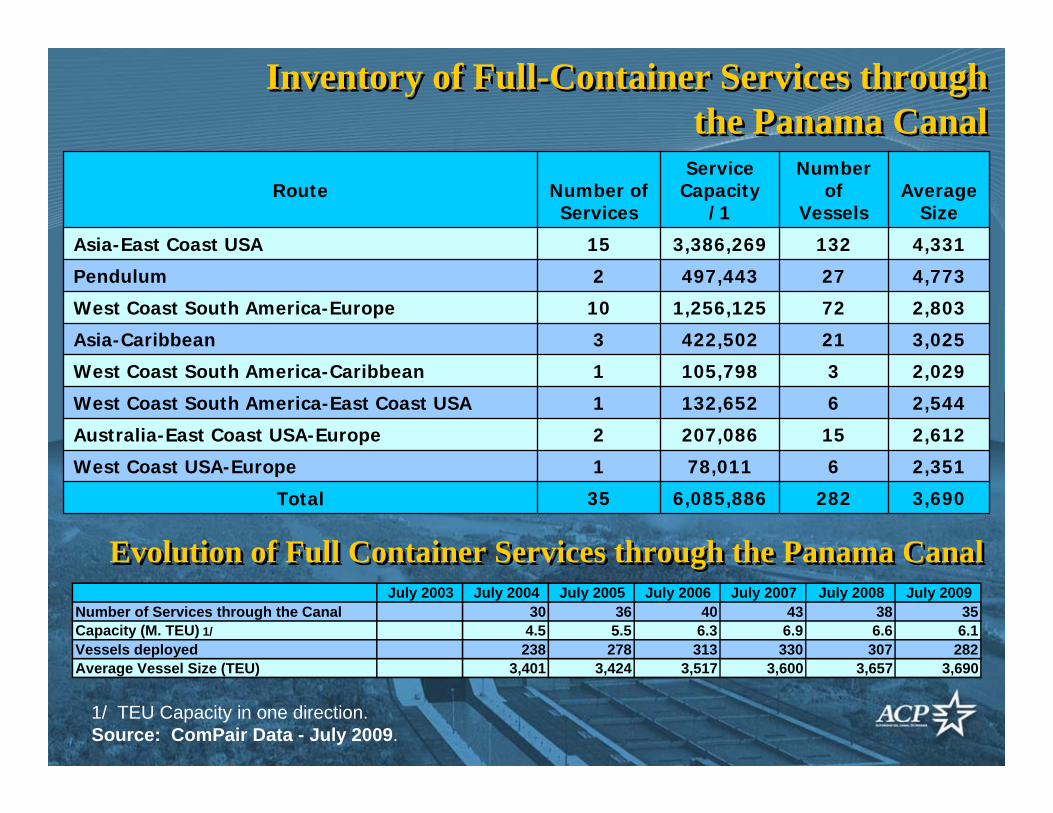
Inventory of Full-Container Services through the Panama Canal
Inventory of Full-Container Services through the Panama Canal
1/ TEU Capacity in one direction.Source: ComPair Data - July 2009.
Evolution of Full Container Services through the Panama CanalEvolution of Full Container Services through the Panama Canal
3,6902826,085,88635Total
2,351678,0111West Coast USA-Europe
2,61215207,0862Australia-East Coast USA-Europe
2,5446132,6521West Coast South America-East Coast USA
2,0293105,7981West Coast South America-Caribbean
3,02521422,5023Asia-Caribbean
2,803721,256,12510West Coast South America-Europe
4,77327497,4432Pendulum
4,3311323,386,26915Asia-East Coast USA
Average Size
Number of
Vessels
Service Capacity
/1Number of Services
Route
July 2003 July 2004 July 2005 July 2006 July 2007 July 2008 July 2009Number of Services through the Canal 30 36 40 43 38 35Capacity (M. TEU) 1/ 4.5 5.5 6.3 6.9 6.6 6.1Vessels deployed 238 278 313 330 307 282Average Vessel Size (TEU) 3,401 3,424 3,517 3,600 3,657 3,690

Source: PIERS, Global Container Report 1Q 2009 Source: PIERS, Global Container Report 1Q 2009
United States PortsImports from Northeast Asia (TEU)
United States PortsImports from Northeast Asia (TEU)
Source: ACP with information of IHS Global Insight, June 2009.Source: ACP with information of IHS Global Insight, June 2009.
2007 Q1 2008 Q1 2009 Q1 % 07-08 % 08-09East Coast 610,427 627,015 525,780 2.7% -16.1%Gulf 40,831 44,744 37,756 9.6% -15.6%West Coast 1,952,482 1,766,833 1,351,785 -9.5% -23.5%

• World Trade and Canal Traffic
• Update on the Panama Canal Expansion Program
• Potential Changes in Trade Patterns
• World Trade and Canal Traffic
• Update on the Panama Canal Expansion Program
• Potential Changes in Trade Patterns

Expansion Program ComponentsExpansion Program Components
Increase the Maximum Operating Level of Gatún Lake
Increase the Maximum Operating Level of Gatún Lake
26.7 m 26.7 m 27.1 m 27.1 m
Deepening & widening of the Gatun lake
navigational channels
Deepening & widening of the Gatun lake
navigational channels
Pacific Post PanamaxLocks
Pacific Post PanamaxLocksPost Panamax Locks Pacific Access Channel
46 M m3
Deepening & widening of the Pacific entrance
Deepening & widening of the Pacific entrance
9.1 M m39.1 M m3
3.7 M m3
4.1 M m3
Deepening of the Culebra Cut navigational channels
Deepening of the Culebra Cut navigational channels
14 M m314 M m3
Deepening & widening of the
Atlantic entrance
Deepening & widening of the
Atlantic entrance
Atlantic Post PanamaxLocks
Atlantic Post PanamaxLocks

The $2.3 billion financing package will cover a portion of the $5.25 billion total cost of the project and will be allocated as follows: The $2.3 billion financing package will cover a portion of the $5.25 billion total cost of the project and will be allocated as follows:
Secured Financing for Program – December 9, 2008Secured Financing for Program – December 9, 2008
FINANCING:FINANCING: European Investment Bank (EIB) European Investment Bank (EIB) $ 500 M$ 500 MJapan Bank for International Cooperation (JBIC)Japan Bank for International Cooperation (JBIC) $ 800 M$ 800 M
Inter‐American Development Bank (IDB)Inter‐American Development Bank (IDB) $ 400 M$ 400 MInternational Finance Corporation (IFC) International Finance Corporation (IFC) $ 300 M$ 300 MCorporación Andina de Fomento (CAF)Corporación Andina de Fomento (CAF) $ 300 M$ 300 M
Subtotal:Subtotal: $2,300 M$2,300 MACP:ACP: $ 2,950 M$ 2,950 M
Total:Total: $ 5,250 M$ 5,250 M
The negotiated financing structure includes favorable provisions for the ACP including a 20-year amortizing period with a 10-year grace period. The negotiated financing structure includes favorable provisions for the ACP including a 20-year amortizing period with a 10-year grace period.

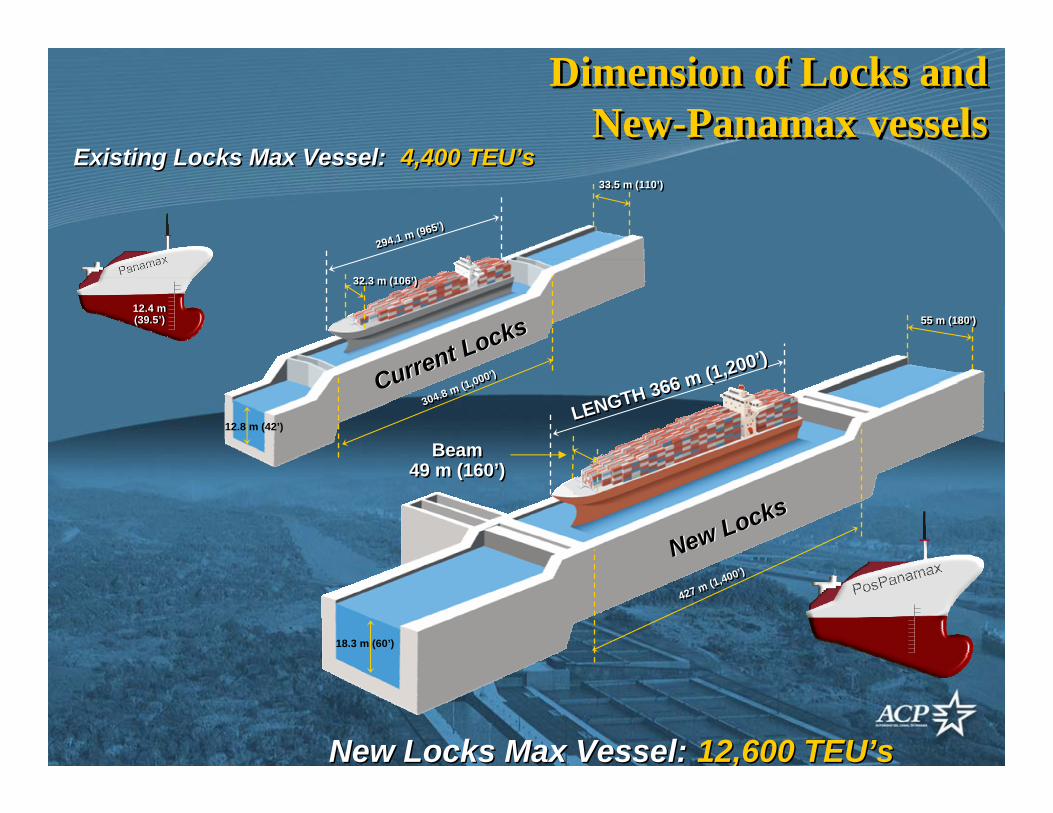
Dimension of Locks andNew-Panamax vessels
Dimension of Locks andNew-Panamax vessels
294.1 m (965’)294.1 m (965’)
33.5 m (110’)33.5 m (110’)
32.3 m (106’)32.3 m (106’)
304.8 m (1,000’)
304.8 m (1,000’)
12.8 m (42’)LENGTH 366 m (1,200’)
LENGTH 366 m (1,200’)
55 m (180’)55 m (180’)
Beam49 m (160’)
Beam49 m (160’)
427 m (1,400’)
427 m (1,400’)
18.3 m (60’)
12.4 m(39.5’)12.4 m(39.5’)
Existing Locks Max Vessel:Existing Locks Max Vessel: 4,400 TEU’s4,400 TEU’s
New Locks Max Vessel:New Locks Max Vessel: 12,600 TEU’s12,600 TEU’s
New LocksNew Locks
Current Locks
Current Locks

Post-Panamax Locks Operation
Post-Panamax Locks Operation
With the water saving basinsthe new locks will use 7% less water than the existing locks
With the water saving basinsthe new locks will use 7% less water than the existing locks
WSB 1 WSB 2 WSB 3
Existing LocksExisting LocksNew LocksNew Locks
Wat
er U
tiliz
atio
nW
ater
Uti
lizat
ion

Pacific Access Channel – Phase 1Pacific Access Channel – Phase 1Progress
Scheduled
97%97%97%
Relocation of 230 KV Transmission Towers and LinesRelocation of 230 KV Transmission Towers and Lines
0% 10% 20% 30% 40% 50% 60% 70% 80% 90% 100%
Progress
Scheduled
100%100%100%100%
89%94%94%Scheduled
ProgressPacific Access Channel – Phase 2Pacific Access Channel – Phase 2
Progress
Scheduled
48%48%
44%44%
Pacific Access Channel – Phase 3Pacific Access Channel – Phase 3
Pacific EntranceDredging and WideningPacific EntranceDredging and Widening
Progress
Scheduled
35%
26%26%
Gatun Lake and Culebra CutDredgingGatun Lake and Culebra CutDredging Progress
Scheduled
23%24%24%
Panama Canal Expansion ProgramPanama Canal Expansion Program

Recently Awarded Projects
Locks Design - BuildLocks Design - Build
0% 10% 20% 30% 40% 50% 60% 70% 80% 90% 100%
Pacific Access Channel – Phase 4Pacific Access Channel – Phase 4
Atlantic EntranceDeepening and WideningAtlantic EntranceDeepening and Widening
Major Contracts Under BidMajor Contracts Under Bid
Progress
Scheduled
1.2%
1.2%
0% 10% 20% 30% 40% 50% 60% 70% 80% 90% 100%
Progress
Scheduled
0.6%
0.6%
Progress
Scheduled
2%
2%
Panama Canal Expansion ProgramPanama Canal Expansion Program

149%
190%
102%
186%
108%
118%
219%
242%
273%
204%
186%
219%181%
133%
126%
146%
161%
151%
50% 100% 150% 200% 250% 300%
CAP1
CAP2
Dragado del Pacífico
CAP3
Esclusas
Dragado del Atlántico
Lowest Price Average Price Highest Price Budget
Prices for Canal Expansion ProgramMajor Projects
Lowest, Average and Highest Prices and Alloted Sums
Prices for Canal Expansion ProgramMajor Projects
Lowest, Average and Highest Prices and Alloted Sums
$177,500,677$258,851,577
$485,453,336Jan De Nul N.V/Van Oord Dredging and Marine Contractors BVBoskalis International BV Dredging Int.
$36,659,852
$46,049,339$74,654,322
Constructora Santa Fe, Ltd. Constructora MECO
$25,489,200$40,986,400
$61,745,339International Undergroup CorpConsorcio M&S MECO SANTA FÉCilsa Minera María
$41,094,000$61,930,269
$89,968,160Jay Cashman, Inc.ASTALDI – GHELLA SPAConstructura Urbana
$3,221,631,384$4,279,819,670
$5,981,020,333BTMGUPC
CANALBudget
Budget
Budget
Budget
Budget
$3,481,000,000
$61,208,966
$48,459,296
$181,096,000
$68,067,623
$89,617,317$162,182,828
$195,943,129Van Ord DredgingJan de Nul
Great Lakes Dredging and Dock Co.Budget $105,821,000
Cilsa Minera María
Atlantic Dredging
Locks
PAC-3
Pacific Dredging
PAC-1
PAC-2

• World Trade and Canal Traffic
• Update on the Panama Canal Expansion Program
• Potential Changes in Trade Patterns
• World Trade and Canal Traffic
• Update on the Panama Canal Expansion Program
• Potential Changes in Trade Patterns

+++ Container Trade Potential Game Changer
+ Dry Bulk Carriers
+ Liquid Bulks
+/- Vehicle Carriers
+/- Refrigerated Vessels
+ Cruise
+/- Others
+++ Container Trade Potential Game Changer
+ Dry Bulk Carriers
+ Liquid Bulks
+/- Vehicle Carriers
+/- Refrigerated Vessels
+ Cruise
+/- Others
Dimension of Locks andNew-Panamax vessels
Dimension of Locks andNew-Panamax vessels
294.1 m (965’)294.1 m (965’)
33.5 m (110’)33.5 m (110’)
32.3 m (106’)32.3 m (106’)
304.8 m (1,000’)
304.8 m (1,000’)
12.8 m (42’)LENGTH 366 m (1,200’)
LENGTH 366 m (1,200’)
55 m (180’)55 m (180’)
Beam49 m (160’)
Beam49 m (160’)
427 m (1,400’)
427 m (1,400’)
18.3 m (60’)
12.4 m(39.5’)12.4 m(39.5’)
Existing Locks Max Vessel:Existing Locks Max Vessel: 4,400 TEU’s4,400 TEU’s
New Locks Max Vessel:New Locks Max Vessel: 12,600 TEU’s12,600 TEU’s
New LocksNew Locks
Current Locks
Current Locks

U.S. Port DepthsU.S. Port Depths
39’39’MiamiMiami38’38’JacksonvilleJacksonville42’42’SavannahSavannah47’47’CharlestonCharleston42’42’WilmingtonWilmington48’48’NorfolkNorfolk40’40’BaltimoreBaltimore38’38’PhiladelphiaPhiladelphia43’43’New York / New JerseyNew York / New Jersey38’38’BostonBoston
MLWMLWU.S. East CoastU.S. East Coast
45’45’New OrleansNew Orleans
40’40’HoustonHoustonMLWMLWU.S. GulfU.S. Gulf
50’50’Seattle / TacomaSeattle / Tacoma
35’35’PortlandPortland
50’50’OaklandOakland
50’50’Los Angeles / Long BeachLos Angeles / Long Beach
MLWMLWU.S. West CoastU.S. West Coast
Depths at Mean Low Water (MLW)Depths at Mean Low Water (MLW)
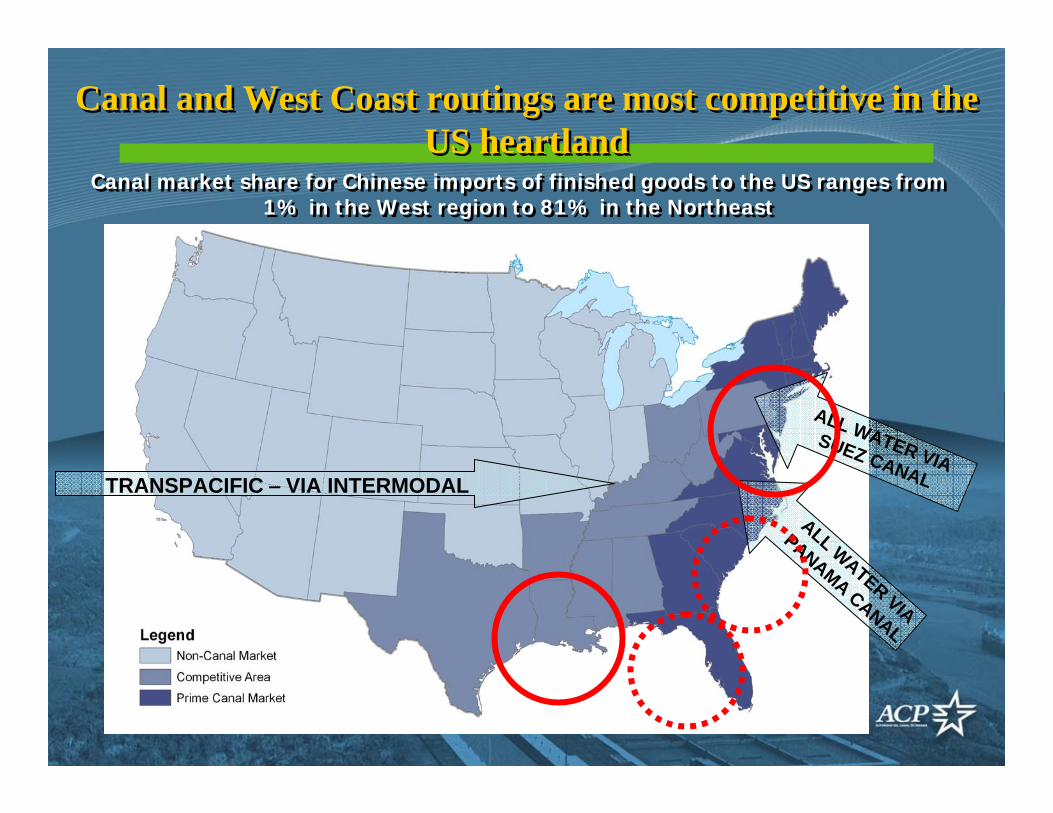
Canal market share for Chinese imports of finished goods to the US ranges from 1% in the West region to 81% in the Northeast
Canal market share for Chinese imports of finished goods to the US ranges from 1% in the West region to 81% in the Northeast
Canal and West Coast routings are most competitive in the US heartland
Canal and West Coast routings are most competitive in the US heartland
TRANSPACIFIC – VIA INTERMODALALL WATER VIA
PANAMA CANAL
ALL WATER VIA SUEZ CANAL

NS’ Intermodal Network
Norfolk Southern System
Intermodal Terminal
Market Expansions thru 2011
New Facilities/Markets
IM Port Terminal
TCS Terminals

NS Is Currently Engaged in Over $3 billion in Network improvements Targeting IntermodalNS Is Currently Engaged in Over $3 billion in Network improvements Targeting Intermodal
• Meridian Speedway: $300mm– Complete 2010
• Heartland Corridor: $250mm– Complete 2010
• Patriot Corridor: $140mm– Complete 2010*
• Crescent Corridor: $2.4bb– Completion tbd
• Meridian Speedway: $300mm– Complete 2010
• Heartland Corridor: $250mm– Complete 2010
• Patriot Corridor: $140mm– Complete 2010*
• Crescent Corridor: $2.4bb– Completion tbd
*Still under review by STB
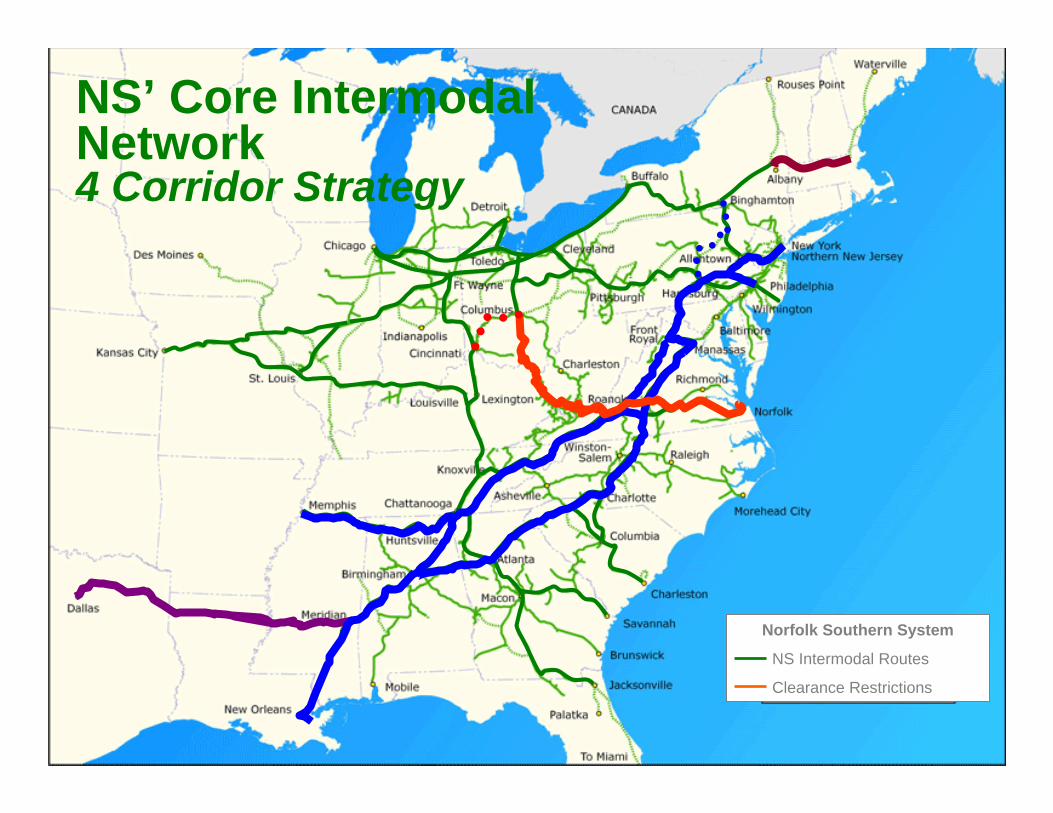
Norfolk Southern System
NS Intermodal Routes
Clearance Restrictions
NS’ Core Intermodal Network4 Corridor Strategy
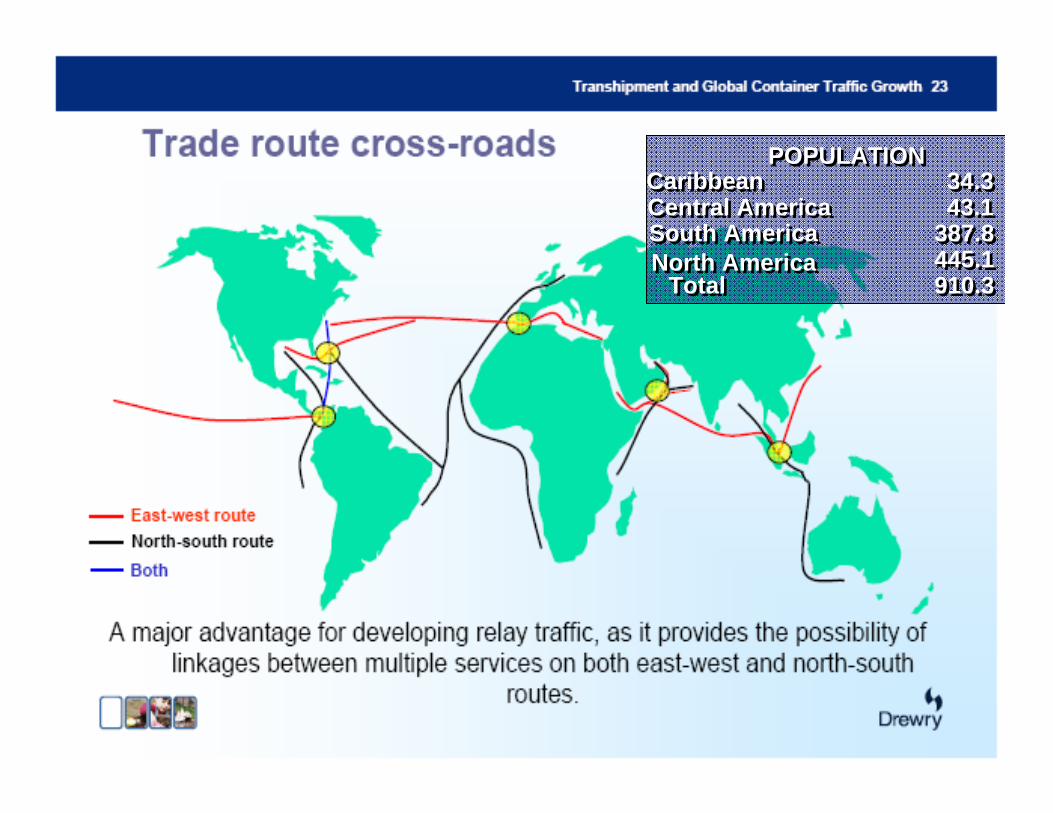
POPULATIONPOPULATIONCaribbeanCaribbeanCentral AmericaCentral AmericaSouth AmericaSouth AmericaNorth AmericaNorth America
TotalTotal
34.334.343.143.1
387.8387.8445.1445.1910.3910.3

EAST-WEST POST-PANAMAX MOVEMENT
CO
NN
ECTI
NG
PO
RTS
CO
NN
ECTI
NG
PO
RTS
MANZANILLOLAZARO CARDENAS
ACAPULCOSALINACRUZ
SAN JOSEPUERTO QUETZAL
ACAJUTLALA LIBERTAD
CORINTOPUERTO SANDINO
PUNTARENASCALDERAGOLFITO
PUERTO ARMUELLESBALBOA
BUENAVENTURATUMACO
ESMERALDASGUAYAQUIL
PAITACALLAO
ANTOFAGASTAVENTANAS
VALPARAISOSAN ANTONIOTALCAHUANO
TAMPICOVERACRUZCOATZACUALCOSBELICE CITYPUERTO CORTESPUERTO CASTILLAPUERTO CABEZASEL BLUFFPUERTO LIMONCHIRIQUI BRANDECRISTOBAL-MIT-EVERGREENCARTAGENABARRANQUILLAPUERTO BOLIVARPUERTO CABELLOLA GUAIRASUAP / PCEMRECIFEVITORIA TUBARAURIO DE JANEIROSEPETIBASANTOSPARANAGUAMONTEVIDEOBUENOS AIRESBAHIA BLANCA
Short Sea Shipping NetworkShort Sea Shipping Network

Forecast2010: 6.6 millions TEUs2015: 8.4 millions TEUs
Forecast2010: 6.6 millions TEUs2015: 8.4 millions TEUs
Source: Panama Maritime Authority (AMP).

PSA Panama International TerminalPSA Panama International Terminal• ½ million TEUs capacity
• USD$ 70 million investment
• 20 yr concession agreement

Dry Bulk Carriers Additional Cargo Capacity in the Expanded Panama Canal
Dry Bulk Carriers Additional Cargo Capacity in the Expanded Panama Canal
Existing Canal
Vessel data:
Cargo carrying Capacity ( tons) 80,238 100,000 -119,000
120,000 –150,000
151,000 –169,000
170,000 –200,000
Utilization rate via the Panama Canal 78% 98% 78% 76% 74%
Cargo (Metric Tons) 62,430 107,310 105,300 121,600 136,900Length (meters) 272.5 260.5 273 289 292Beam (meters) 32.3 43.9 43 43.1 48Salt Water Draft (meters) 14.1 13.8 17.5 17.4 18
Length (meters) 294.1 365.8 365.8 365.8 365.8Beam (meters) 32.3 48.8 48.8 48.8 48.8Tropical Fresh Water Draft (meters) 12 15.3 15.3 15.3 15.3
Utilization rate via the Panama Canal without restrictions 100% 100% 100% 100% 100%
Cargo without restrictions (Metric Tons) 80,238 107,310 132,300 156,800 181,300
Expanded Canal
Typical Panamaxvessel
Maximum size
ConceptSize Range for Dry Bulkers carrying Coal in the expanded canal
Panama Canal Restrictions:

Tankers Additional Cargo Capacity in the Expanded Panama Canal
Tankers Additional Cargo Capacity in the Expanded Panama Canal
Existing CanalTanker Vessel with Maximum
DimensionsVessel Data Aframax Suezmax VLCCTotal Cargo Capacity of vessel 88,170 100 - 119,999 120 - 199,999 > 200,000Utilization percentage of vessel through the Canal 70.0% 94.7% 89.6% 73.9%
Cargo in metric tons 64,257 107,520 146,316 226,205 LOA (m) 272.5 269 267 326Beam (m) 32.2 39.3 46.3 49Fresh water draft (m) 15.5 16.0 17.02 20.64Dimensions allowed by the Panama CanalLOA (m) 294.2 366 366 366Beam (m) 32.2 49 49 49Fresh water draft (m) 12 15.2 15.2 15.2Unrestricted vessel utilization percentage 100% 100% 100% 100%
Cargo carrying capacity with maximum draft of 15.2 m 88,170 101,818 131,107 167,064
Additional cargo allowed with expanded Canal (in MT) 23,913
Expanded CanalSize Range for Tanker Vessels in
Expanded Canal
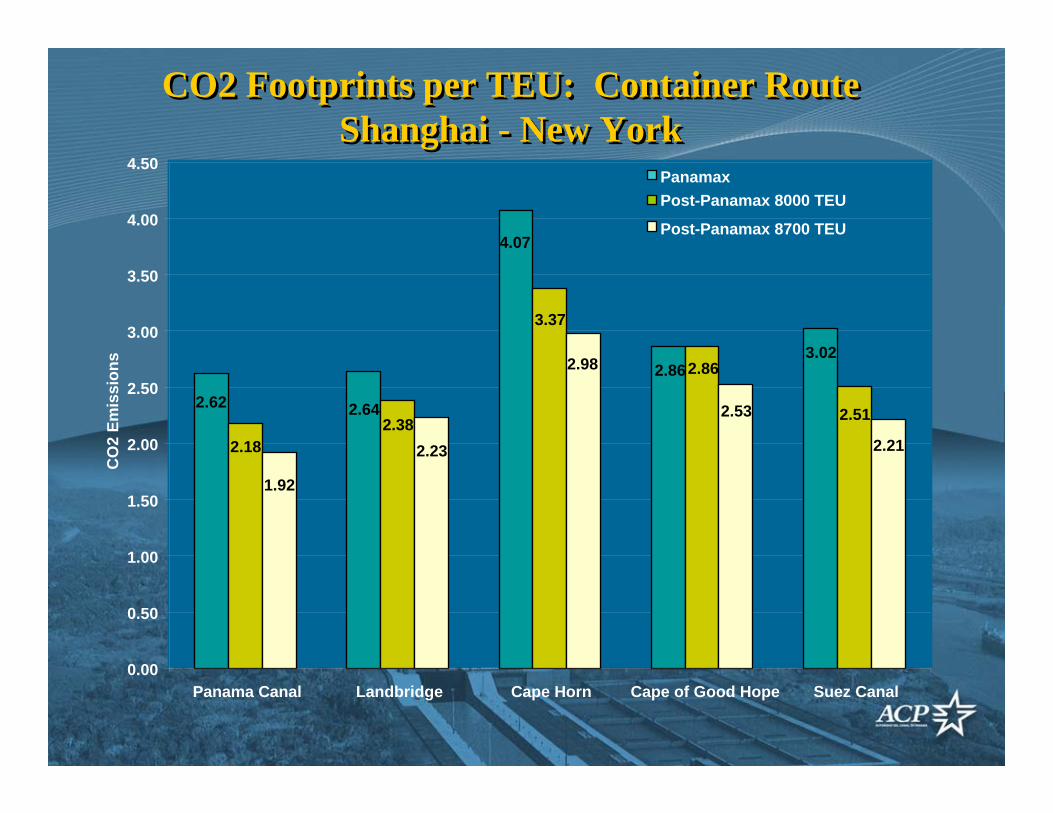
CO2 Footprints per TEU: Container Route Shanghai - New York
CO2 Footprints per TEU: Container Route Shanghai - New York
2.62 2.64
4.07
2.863.02
2.182.38
3.37
2.86
2.51
1.92
2.23
2.98
2.53
2.21
0.00
0.50
1.00
1.50
2.00
2.50
3.00
3.50
4.00
4.50
Panama Canal Landbridge Cape Horn Cape of Good Hope Suez Canal
CO
2 Em
issi
ons
PanamaxPost-Panamax 8000 TEU
Post-Panamax 8700 TEU

SINGAPORESINGAPORE
SHANGHAISHANGHAI BUSANBUSAN
ROTTERDAMROTTERDAM
HAMBURGHAMBURG
DUBAIDUBAI
LA/LBLA/LBNY/NJNY/NJ
SHENZHENSHENZHEN ALGECIRASALGECIRAS
PANAMAPANAMA
Main Logistics Hubs Main Logistics Hubs
SAVANNAHSAVANNAH
KINGSTONKINGSTONFREEPORTFREEPORT
HAMPTON RDS.
HAMPTON RDS.
HOUSTONHOUSTON
CHARLESTONCHARLESTON GENOAGENOA
HONG KONGHONG KONG
SANTOSSANTOS
SAN ANTONIO
SAN ANTONIO

Expansion of the Panama CanalPotential Impact on Asia – East Coast/Golf TradeExpansion of the Panama CanalPotential Impact on Asia – East Coast/Golf Trade
Rodolfo SabongeVice-President, Market Research and Analysis Office
Panama Canal Authority
Rodolfo SabongeVice-President, Market Research and Analysis Office
Panama Canal Authority