Embed Size (px)
Citation preview
Expanding your business to the United StatesMalaysian SME Delegation
October 16, 2014
Aaron BrickmanDeputy Executive DirectorSelectUSA
© International Trade Administration 2014 1
Agenda
I. Introductions II. Overview of FDI TrendsIII. U.S. Business ClimateIV. About SelectUSA ServicesV. Q&A
2© International Trade Administration 2014
I. IntroductionsSelectUSA
3© International Trade Administration 2014
II. Overview of FDI TrendsSelectUSA
4© International Trade Administration 2014
United St
ates
United Kingd
om
China, Hong K
ong SAR
France
China
Belgium
German
y
Singa
pore
Switz
erland
Brazil
Spain
Netherla
nds
Canad
a
Australi
a
Russian
Federation
British
Virgin Is
lands
Italy
Mexic
o
Sweden
Irelan
d
Poland
IndonesiaIndia
$0
$1,000,000
$2,000,000
$3,000,000
$4,000,000
$5,000,000
$6,000,000
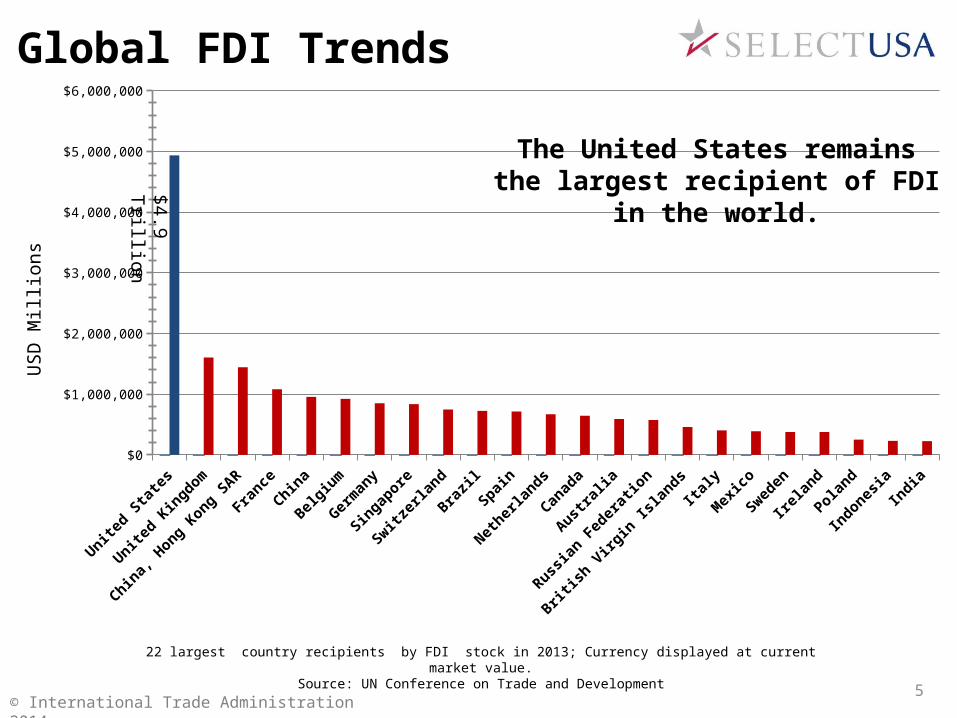
Global FDI Trends
22 largest country recipients by FDI stock in 2013; Currency displayed at current market value.Source: UN Conference on Trade and Development
The United States remains the largest recipient of FDI in the world.
USD
Mill
ions
$4.9 Trillion
© International Trade Administration 20145
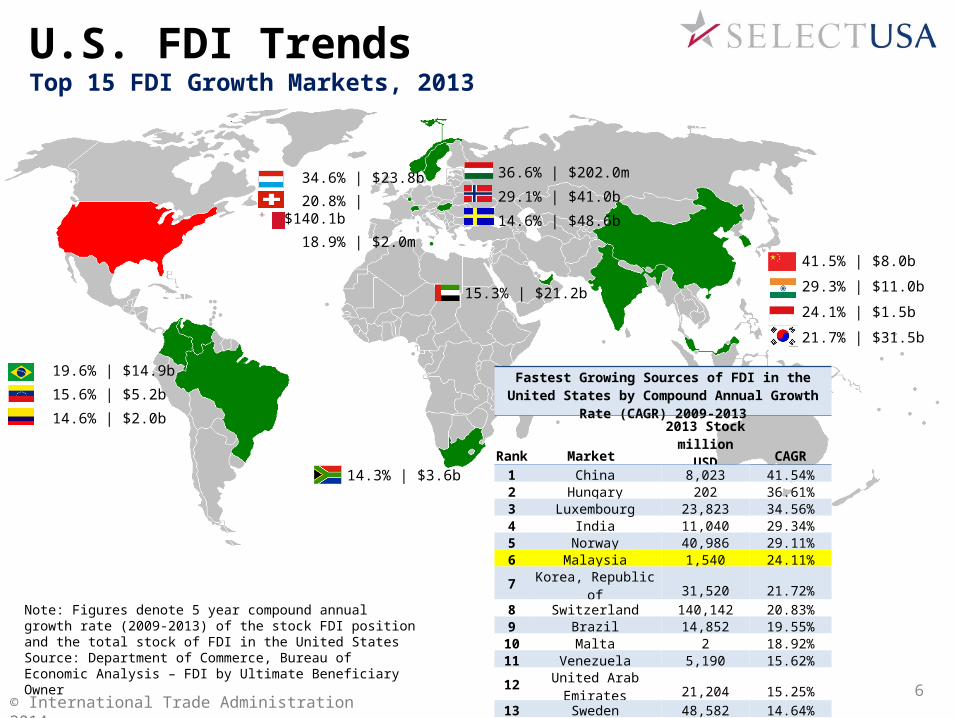
U.S. FDI TrendsTop 15 FDI Growth Markets, 2013
Note: Figures denote 5 year compound annual growth rate (2009-2013) of the stock FDI position and the total stock of FDI in the United StatesSource: Department of Commerce, Bureau of Economic Analysis – FDI by Ultimate Beneficiary Owner
© International Trade Administration 2014
36.6% | $202m
29.1% | $41.0b
14.7% | $48.6b
41.54% | $8.0b
29.34% | $11.0b
24.11% | $1.5b
21.72% | $31.5b
19.6% | $14.9b
15.6% | $5.2b
14.6% | $2.0b
14.3% | $3.6b
34.6% | $23.8b
20.8% | $140.1b
18.9% | $2.0m
15.2% | $21.2b
36.6% | $202m
29.1% | $41.0b
14.7% | $48.6b
41.54% | $8.0b
29.34% | $11.0b
24.11% | $1.5b
21.72% | $31.5b
19.6% | $14.9b
15.6% | $5.2b
14.6% | $2.0b
14.3% | $3.6b
34.6% | $23.8b
20.8% | $140.1b
18.9% | $2.0m
15.2% | $21.2b
36.6% | $202.0m
29.1% | $41.0b
14.6% | $48.6b
41.5% | $8.0b
29.3% | $11.0b
24.1% | $1.5b
21.7% | $31.5b
19.6% | $14.9b
15.6% | $5.2b
14.6% | $2.0b
14.3% | $3.6b
34.6% | $23.8b
20.8% | $140.1b
18.9% | $2.0m
15.3% | $21.2b
Fastest Growing Sources of FDI in the United States by Compound Annual Growth Rate (CAGR) 2009-2013
Rank Market 2013 Stock million USD CAGR
1 China 8,023 41.54%2 Hungary 202 36.61%3 Luxembourg 23,823 34.56%4 India 11,040 29.34%5 Norway 40,986 29.11%6 Malaysia 1,540 24.11%7 Korea, Republic of 31,520 21.72%8 Switzerland 140,142 20.83%9 Brazil 14,852 19.55%
10 Malta 2 18.92%11 Venezuela 5,190 15.62%12 United Arab Emirates 21,204 15.25%13 Sweden 48,582 14.64%14 Colombia 2,022 14.63%15 South Africa 3,647 14.31%
6
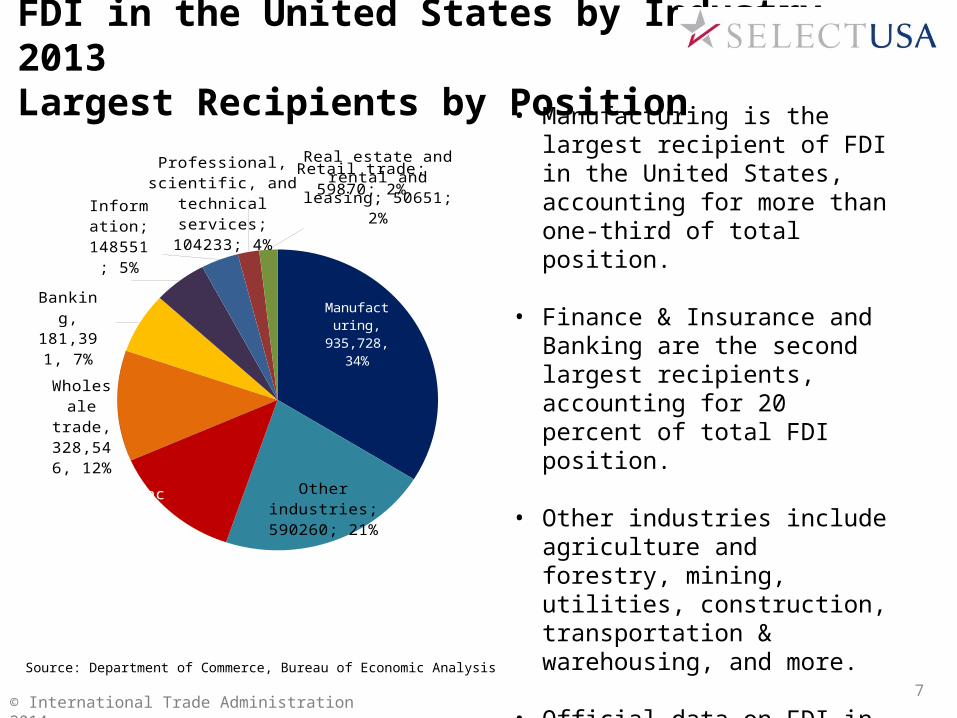
FDI in the United States by Industry, 2013Largest Recipients by Position
© International Trade Administration 2014
Manu-facturing, 935,728,
34%
Other industries; 590260; 21%
Finance and in-
surance*; 364727;
13%
Whole-sale
trade, 328,546,
12%
Banking, 181,391,
7%
Informa-tion;
148551; 5%
Professional, scientific, and technical services;
104233; 4%
Retail trade; 59870; 2%Real estate and rental and leasing; 50651; 2%
• Manufacturing is the largest recipient of FDI in the United States, accounting for more than one-third of total position.
• Finance & Insurance and Banking are the second largest recipients, accounting for 20 percent of total FDI position.
• Other industries include agriculture and forestry, mining, utilities, construction, transportation & warehousing, and more.
• Official data on FDI in the United States now showcases real estate and rental/leasing as an independent category, accounting for two percent of total position.Source: Department of Commerce, Bureau of Economic Analysis
7
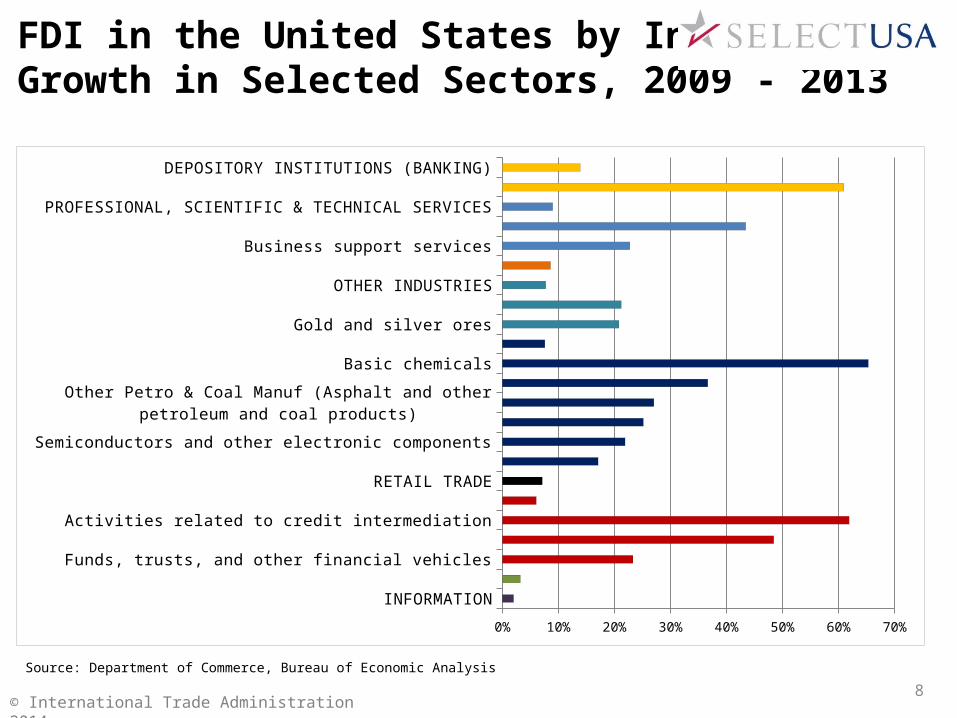
FDI in the United States by IndustryGrowth in Selected Sectors, 2009 - 2013
© International Trade Administration 2014
Source: Department of Commerce, Bureau of Economic Analysis
INFORMATIONREAL ESTATE
Funds, trusts, and other financial vehiclesAccounting, tax preparation, bookkeeping, and payroll services
Activities related to credit intermediationFINANCE & INSURANCE
RETAIL TRADEFood
Semiconductors and other electronic componentsManuf (Chemical and allied products)
Other Petro & Coal Manuf (Asphalt and other petroleum and coal products)Electrical equipment
Basic chemicalsMANUFACTURING
Gold and silver oresMetal ore mining
OTHER INDUSTRIESWHOLESALE TRADE
Business support servicesMgmt, sci, & tech consulting
PROFESSIONAL, SCIENTIFIC & TECHNICAL SERVICESBanking (branches and agencies)
DEPOSITORY INSTITUTIONS (BANKING)
0% 10% 20% 30% 40% 50% 60% 70%
8
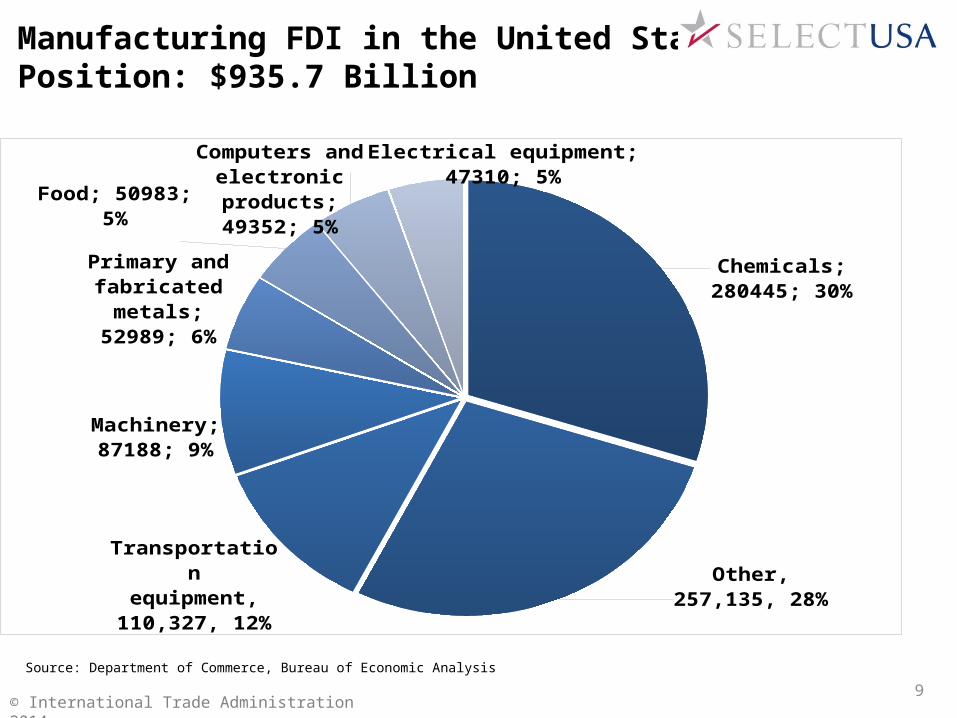
Manufacturing FDI in the United States, 2013Position: $935.7 Billion
© International Trade Administration 2014
Chemicals; 280445; 30%
Other, 257,135, 28%
Transportationequipment,
110,327, 12%
Machinery; 87188; 9%
Primary and fab-ricated metals;
52989; 6%
Food; 50983; 5%
Computers and electronic products;
49352; 5%Electrical equipment; 47310; 5%
Source: Department of Commerce, Bureau of Economic Analysis
9
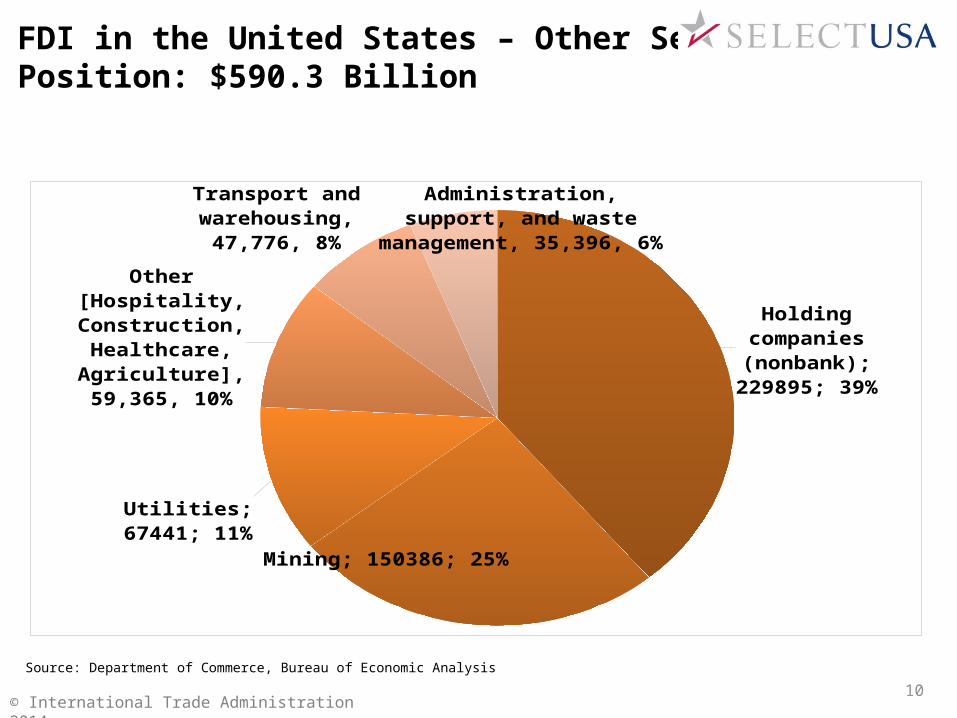
FDI in the United States – Other Sectors, 2013Position: $590.3 Billion
© International Trade Administration 2014
Source: Department of Commerce, Bureau of Economic Analysis
Holding companies (nonbank); 229895;
39%
Mining; 150386; 25%
Utilities; 67441; 11%
Other [Hospitality, Construction,
Healthcare, Agri-culture], 59,365,
10%
Transport and warehousing,
47,776, 8%
Administration, support, and waste management, 35,396, 6%
10
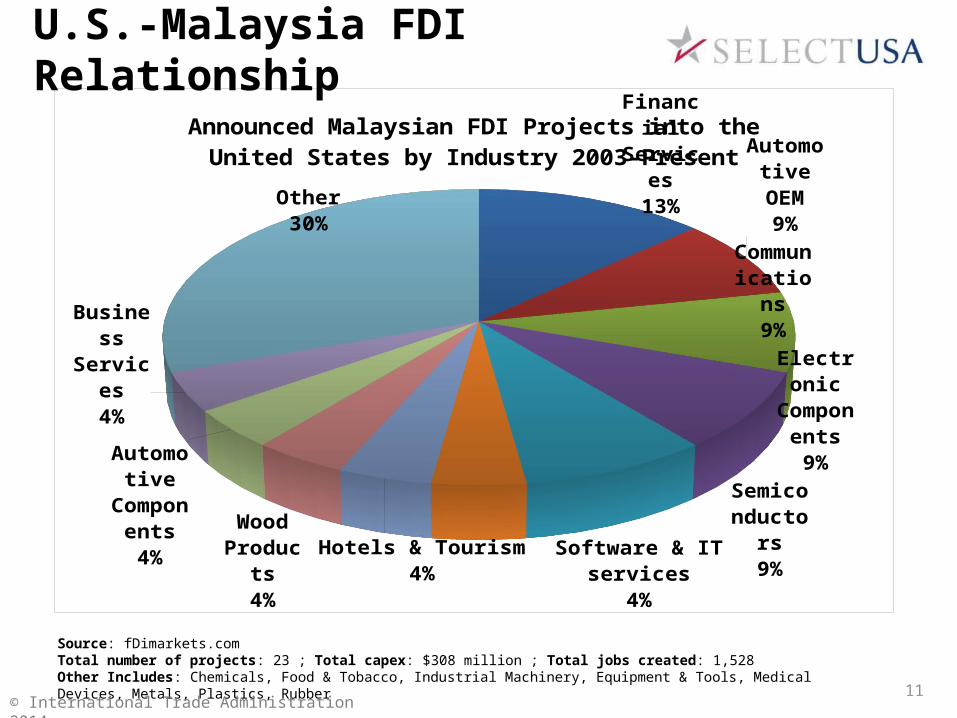
Financial Services
13%Automo-tive OEM
9%Com-munica-
tions9%
Electronic Compo-nents
9%Semi-
conduc-tors9%Software & IT services
4%Hotels & Tourism
4%
Wood Products
4%
Automo-tive
Compo-nents
4%
Business Services
4%
Other30%
Announced Malaysian FDI Projects into the United States by Industry 2003-Present
Source: fDimarkets.com Total number of projects: 23 ; Total capex: $308 million ; Total jobs created: 1,528Other Includes: Chemicals, Food & Tobacco, Industrial Machinery, Equipment & Tools, Medical Devices, Metals, Plastics, Rubber
U.S.-Malaysia FDI Relationship
© International Trade Administration 201411
III. U.S. Business ClimateSelectUSA
12© International Trade Administration 2014
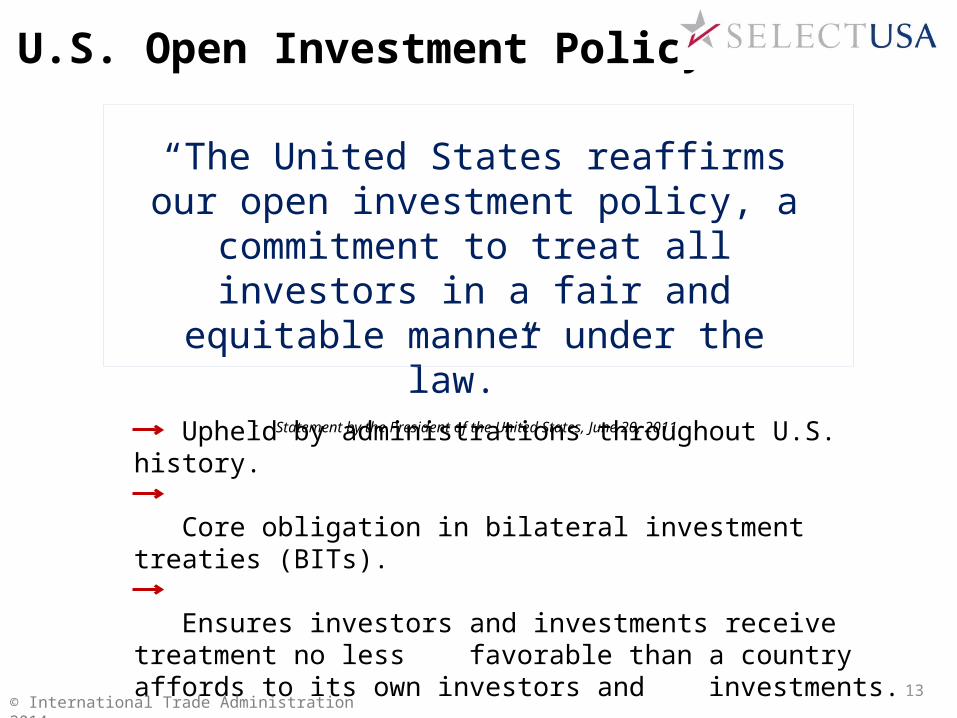
U.S. Open Investment Policy
Upheld by administrations throughout U.S. history.
Core obligation in bilateral investment treaties (BITs).
Ensures investors and investments receive treatment no less favorable than a country affords to its own investors and investments.
© International Trade Administration 2014
“The United States reaffirms our open investment policy, a commitment to treat all
investors in a fair and equitable manner under the law.”
- Statement by the President of the United States, June 20, 2011
13
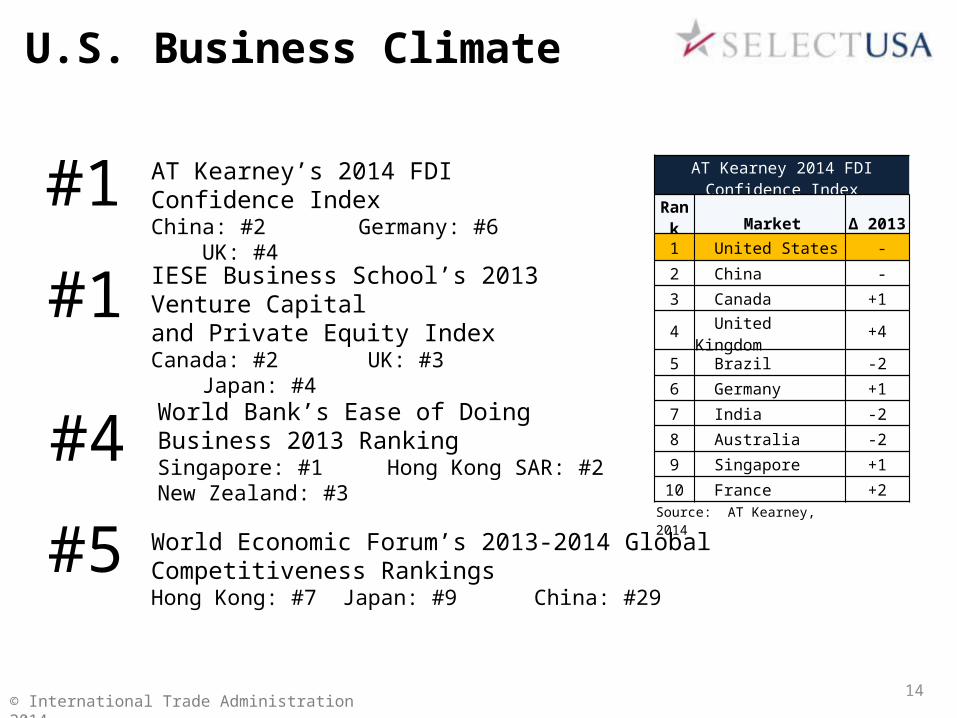
World Economic Forum’s 2013-2014 Global Competitiveness RankingsHong Kong: #7 Japan: #9 China: #29
AT Kearney’s 2014 FDI Confidence IndexChina: #2 Germany: #6 UK: #4#1
#5
IESE Business School’s 2013 Venture Capital and Private Equity IndexCanada: #2 UK: #3 Japan: #4
World Bank’s Ease of Doing Business 2013 RankingSingapore: #1 Hong Kong SAR: #2 New Zealand: #3
U.S. Business Climate
AT Kearney 2014 FDI Confidence Index
Rank Market Δ 20131 United States -
2 China -
3 Canada +1
4 United Kingdom +4
5 Brazil -2
6 Germany +1
7 India -2
8 Australia -2
9 Singapore +1
10 France +2
Source: AT Kearney, 2014
#1
#4
14© International Trade Administration 2014
1. Office of the U.S. Trade Representative; Central Intelligence Agency – The World Factbook; and Credit Suisse survey; 2 National Science Foundation Science and Engineering Indicators 2010; Kauffman Index of Entrepreneurial Activity 1996-2009; 3. U.S. Patent and Trademark Office; 4. The Times Higher Education Report 2010-2011 (U.K.); 5. OECD Labor Productivity Statistics
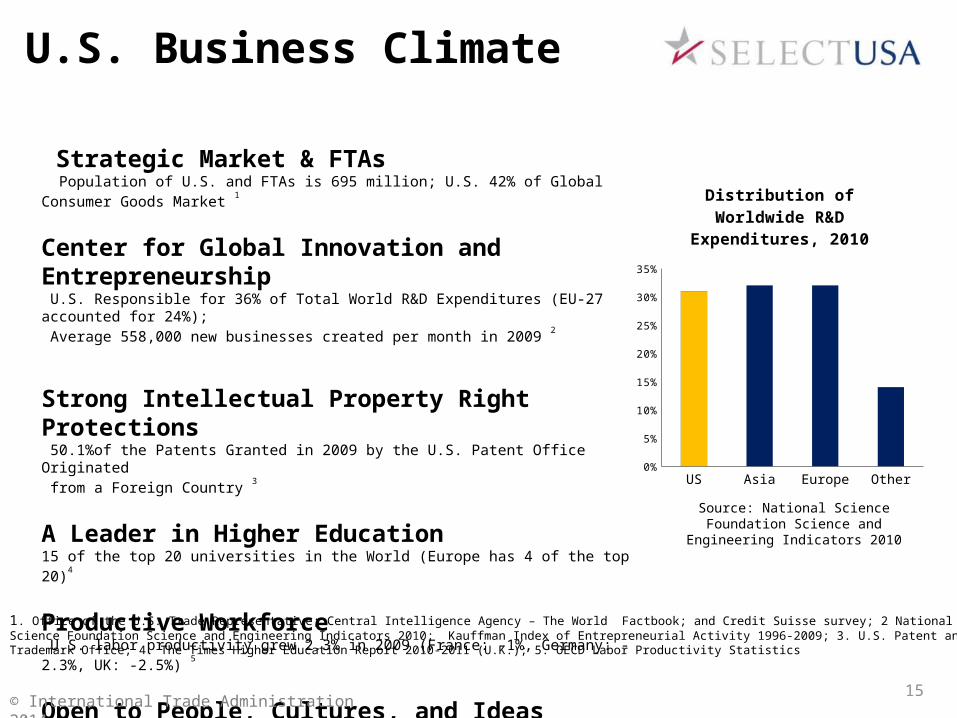
Source: National Science Foundation Science and Engineering Indicators 2010
Strategic Market & FTAs Population of U.S. and FTAs is 695 million; U.S. 42% of Global Consumer Goods Market 1
Center for Global Innovation and Entrepreneurship U.S. Responsible for 36% of Total World R&D Expenditures (EU-27 accounted for 24%); Average 558,000 new businesses created per month in 2009 2
Strong Intellectual Property Right Protections 50.1%of the Patents Granted in 2009 by the U.S. Patent Office Originated from a Foreign Country 3
A Leader in Higher Education15 of the top 20 universities in the World (Europe has 4 of the top 20)4
Productive Workforce U.S. labor productivity grew 2.3% in 2009 (France: -1%, Germany: -2.3%, UK: -2.5%) 5
Open to People, Cultures, and Ideas
US Asia Europe Other0%
5%
10%
15%
20%
25%
30%
35%
Distribution of Worldwide R&D Expenditures, 2010
© International Trade Administration 2014 15
U.S. Business Climate
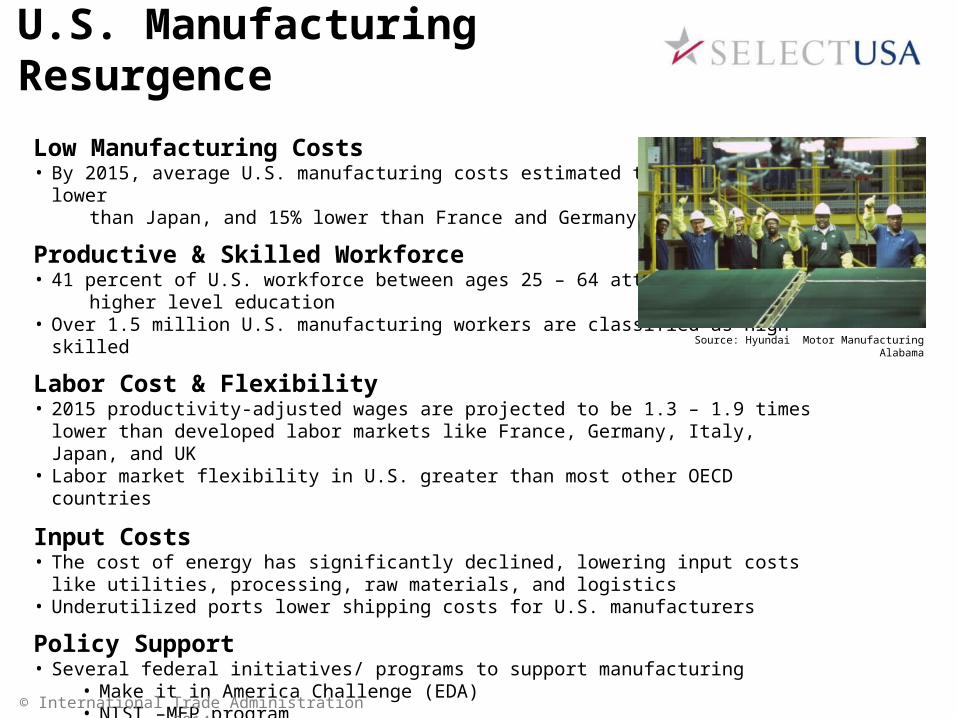
Low Manufacturing Costs• By 2015, average U.S. manufacturing costs estimated to be 21 percent lower than Japan, and 15% lower than France and Germany
Productive & Skilled Workforce• 41 percent of U.S. workforce between ages 25 – 64 attain higher level education• Over 1.5 million U.S. manufacturing workers are classified as high-skilled
Labor Cost & Flexibility• 2015 productivity-adjusted wages are projected to be 1.3 – 1.9 times lower than developed labor
markets like France, Germany, Italy, Japan, and UK• Labor market flexibility in U.S. greater than most other OECD countries
Input Costs• The cost of energy has significantly declined, lowering input costs like utilities, processing, raw
materials, and logistics• Underutilized ports lower shipping costs for U.S. manufacturers
Policy Support• Several federal initiatives/ programs to support manufacturing
• Make it in America Challenge (EDA)• NIST –MEP program
Sources: Boston Consulting Group, September 2012; U.S. Department of Commerce Office of Manufacturing and Services
Source: Hyundai Motor Manufacturing Alabama
U.S. Manufacturing Resurgence
© International Trade Administration 2014
© International Trade Administration 2014
Sources: 1. Boston Consulting Group 2. IEA—World Energy Outlook 2012 3. Business Day Live (SA Newspaper) 4. SelectUSA
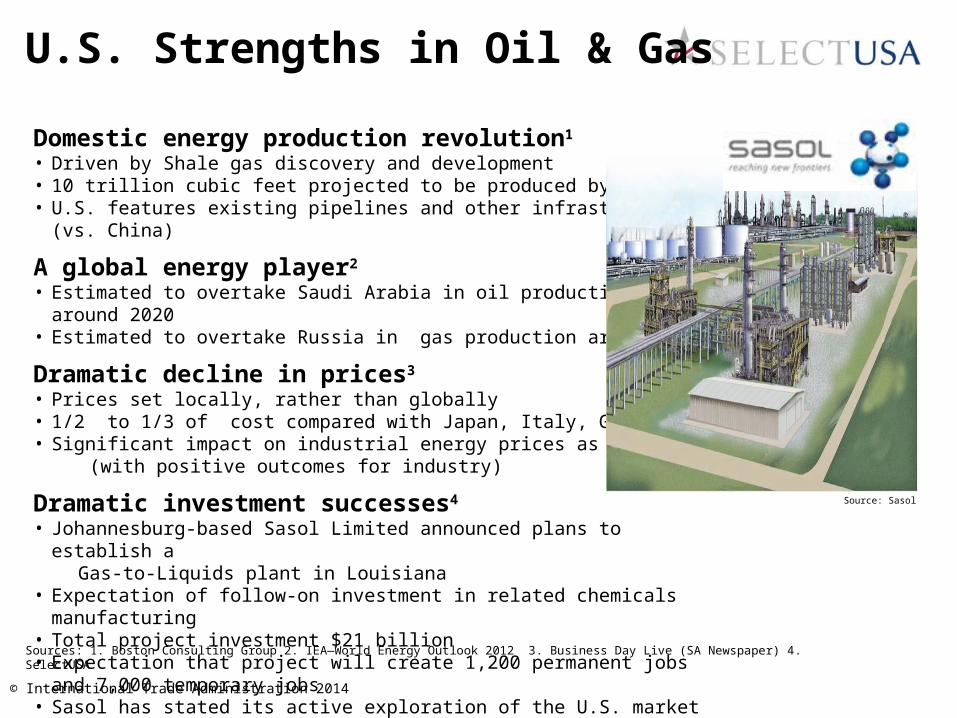
Source: Sasol
Domestic energy production revolution1
• Driven by Shale gas discovery and development• 10 trillion cubic feet projected to be produced by 2030• U.S. features existing pipelines and other infrastructure (vs. China)
A global energy player2
• Estimated to overtake Saudi Arabia in oil production by around 2020• Estimated to overtake Russia in gas production around 2015
Dramatic decline in prices3
• Prices set locally, rather than globally• 1/2 to 1/3 of cost compared with Japan, Italy, Germany• Significant impact on industrial energy prices as well (with positive outcomes for industry)
Dramatic investment successes4
• Johannesburg-based Sasol Limited announced plans to establish a Gas-to-Liquids plant in Louisiana• Expectation of follow-on investment in related chemicals manufacturing• Total project investment $21 billion• Expectation that project will create 1,200 permanent jobs and 7,000 temporary jobs• Sasol has stated its active exploration of the U.S. market for the company’s future
growth in areas like petrochemicals and fertilizer manufacturing.
Distribution of Worldwide R&D Expenditures, 2010
U.S. Strengths in Oil & Gas
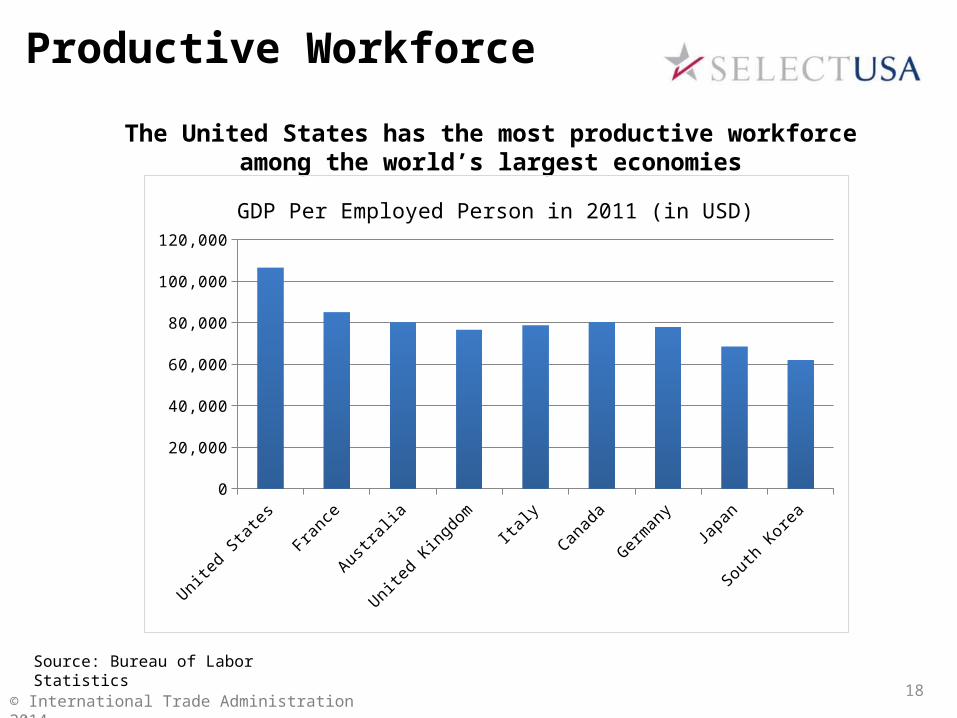
The United States has the most productive workforce among the world’s largest economies
Source: Bureau of Labor Statistics
United States
France Australia United Kingdom
Italy Canada Germany Japan South Korea
0
20,000
40,000
60,000
80,000
100,000
120,000
GDP Per Employed Person in 2011 (in USD)
© International Trade Administration 2014 18
Productive Workforce
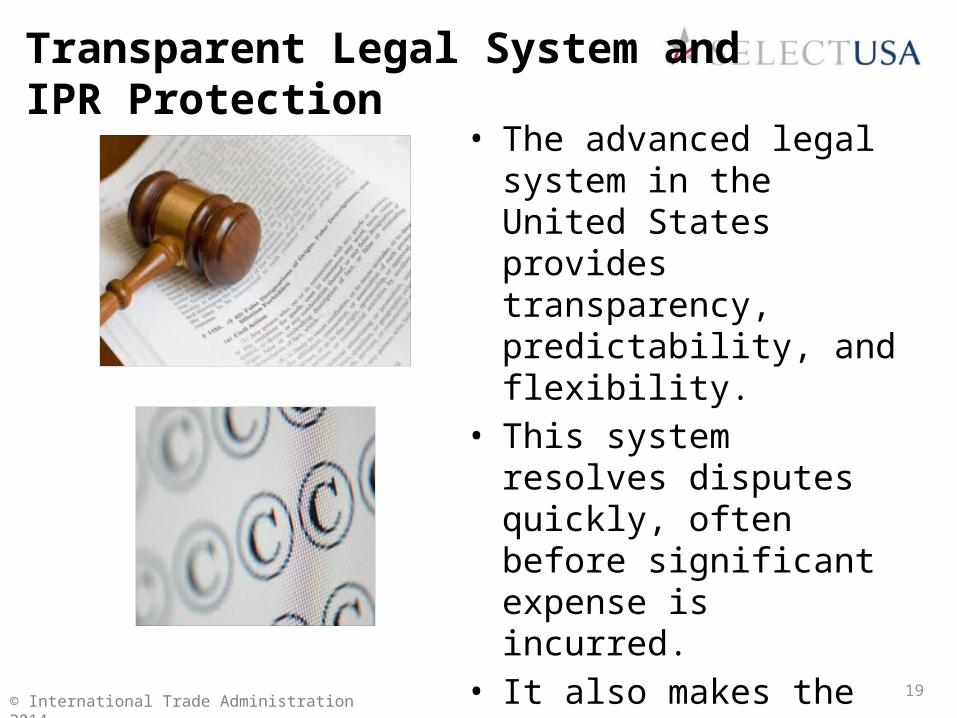
• The advanced legal system in the United States provides transparency, predictability, and flexibility.
• This system resolves disputes quickly, often before significant expense is incurred.
• It also makes the United States the world’s leader in protecting intellectual property rights.
© International Trade Administration 2014 19
Transparent Legal System and IPR Protection
IV. About SelectUSASelectUSA
20© International Trade Administration 2014
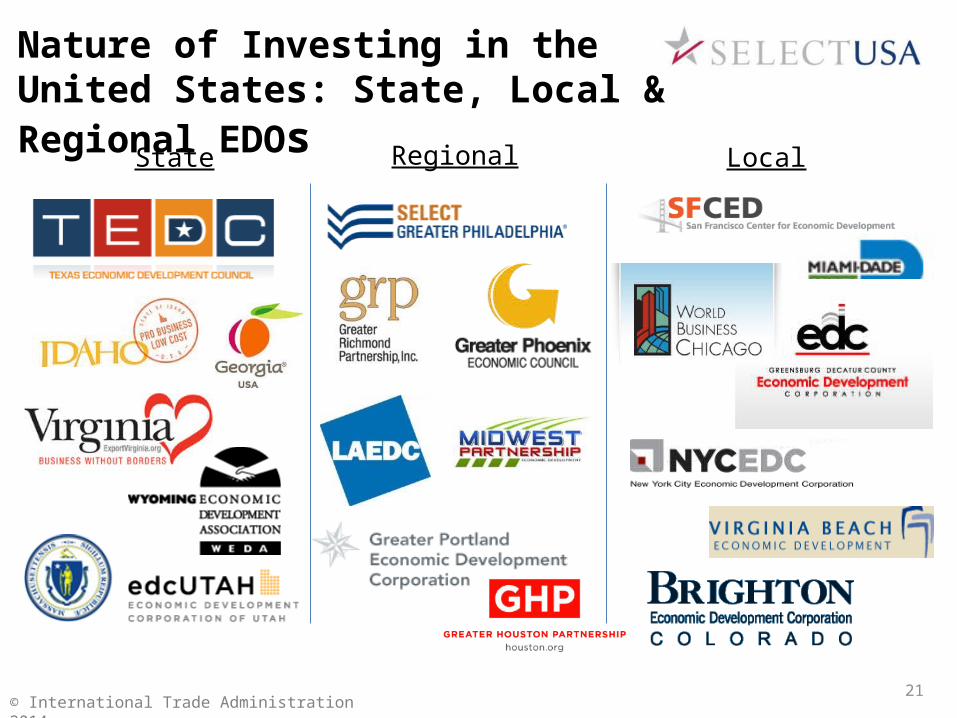
Nature of Investing in the United States: State, Local & Regional EDOs
Regional LocalState
© International Trade Administration 201421
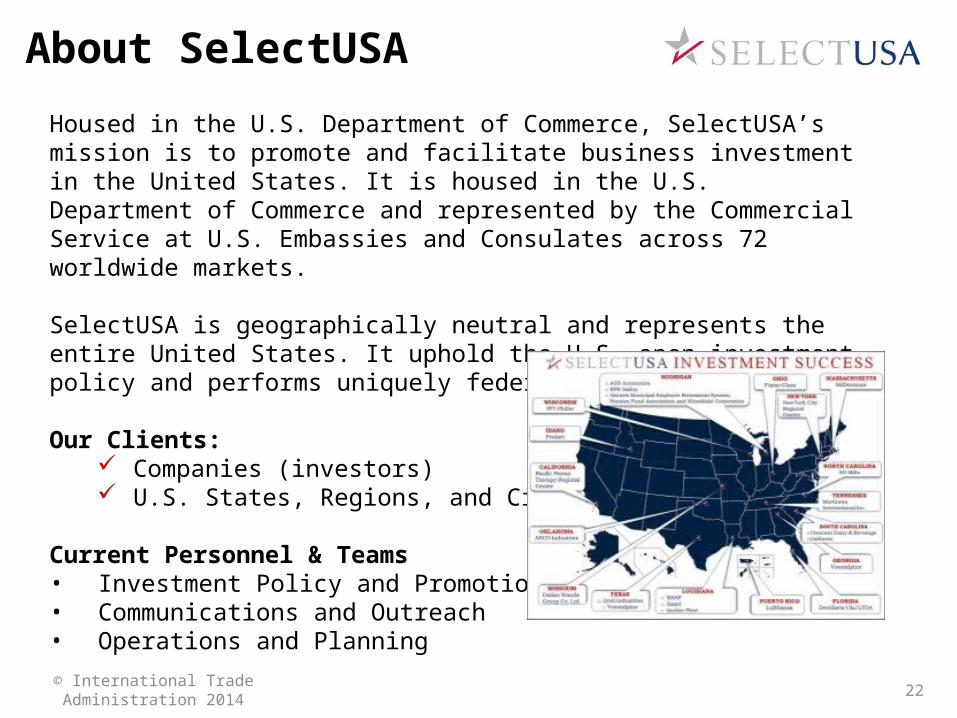
About SelectUSA
Housed in the U.S. Department of Commerce, SelectUSA’s mission is to promote and facilitate business investment in the United States. It is housed in the U.S. Department of Commerce and represented by the Commercial Service at U.S. Embassies and Consulates across 72 worldwide markets.
SelectUSA is geographically neutral and represents the entire United States. It uphold the U.S. open investment policy and performs uniquely federal functions.
Our Clients: Companies (investors) U.S. States, Regions, and Cities
Current Personnel & Teams• Investment Policy and Promotion• Communications and Outreach• Operations and Planning
22© International Trade Administration 2014
SelectUSA Can Help
Key SelectUSA Services Offered to Companies:
Information and Counseling: We provide subject-matter expertise to companies on business investment in the United States.
Connections: We assist companies with industry information, analysis, and points of contact and connect them with U.S. cities and states.
Ombudsman Assistance: We help companies with questions or concerns about U.S. federal rules and regulations.
© International Trade Administration 201423
SelectUSA Services for Firms:
Information & Counseling
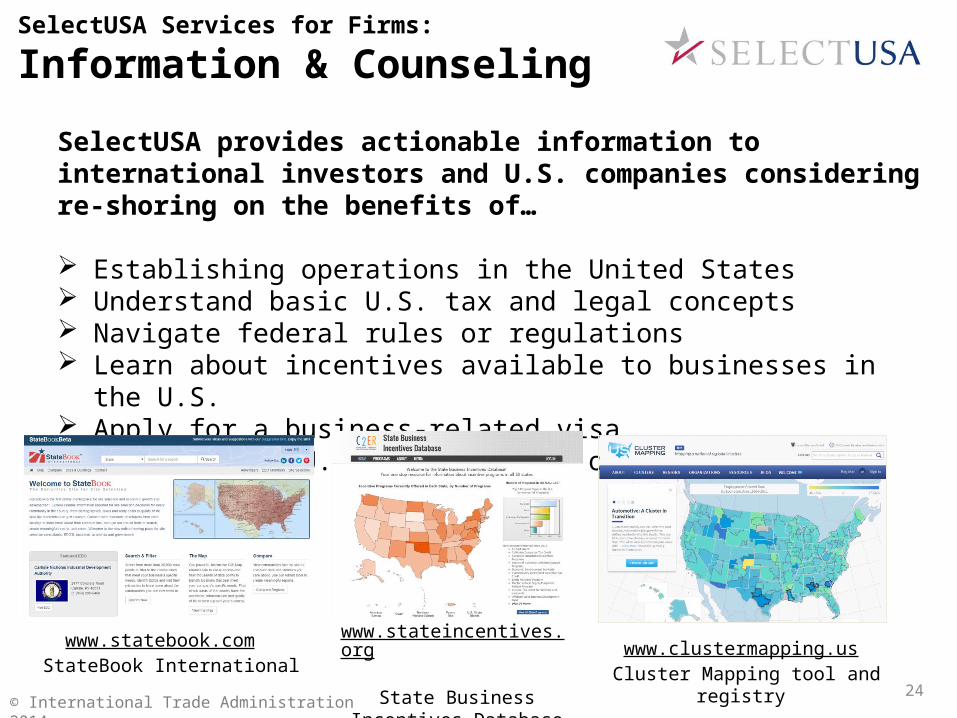
SelectUSA provides actionable information to international investors and U.S. companies considering re-shoring on the benefits of…
Establishing operations in the United States Understand basic U.S. tax and legal concepts Navigate federal rules or regulations Learn about incentives available to businesses in the U.S. Apply for a business-related visa Connect with U.S. state, city, or regional EDOs
© International Trade Administration 201424
www.clustermapping.us Cluster Mapping tool and registry
www.stateincentives.org State Business Incentives
Database
www.statebook.com StateBook International
SelectUSA Services for Firms:
Ombudsman Assistance SelectUSA coordinates federal agencies through the Interagency
Investment Working Group to address investor questions and concerns related to a wide range of federal regulatory issues.
Select USA aims to ensure investors understand the U.S. system and receive answers in a timely manner. Ombudsman services are conducted by SelectUSA headquarters.
Examples: Connect with a federal agency/ office to seek insight into a specific case Offer to facilitate direct communication between the relevant federal agency and the
client, as appropriate Identify federal regulations or processes to U.S. policy makers, that may negatively
impact the U.S. business climate
© International Trade Administration 201425
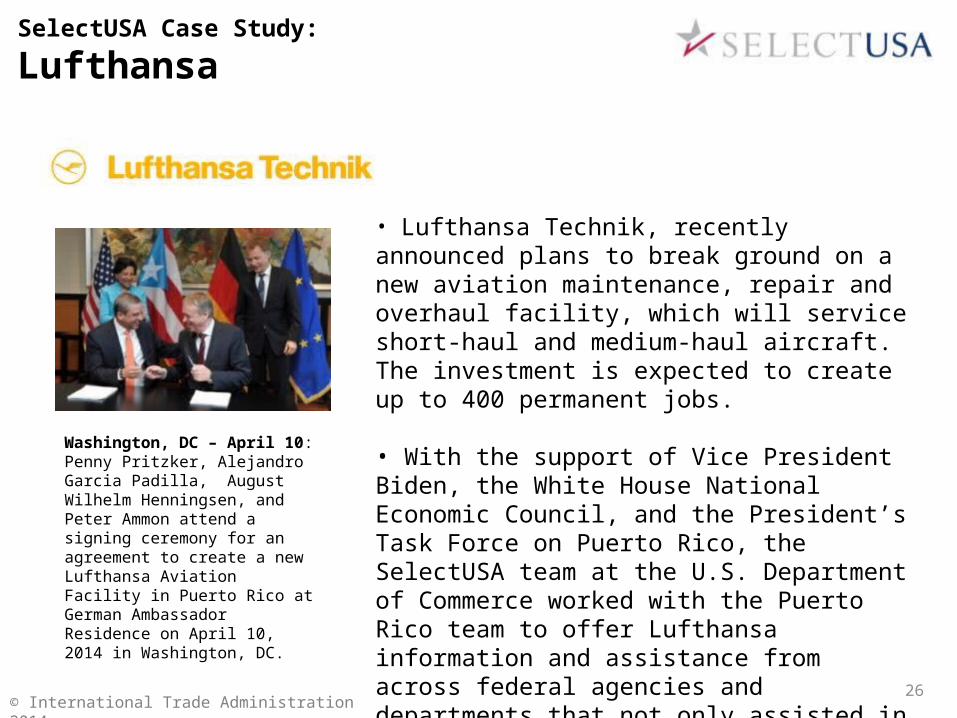
• Lufthansa Technik, recently announced plans to break ground on a new aviation maintenance, repair and overhaul facility, which will service short-haul and medium-haul aircraft. The investment is expected to create up to 400 permanent jobs.
• With the support of Vice President Biden, the White House National Economic Council, and the President’s Task Force on Puerto Rico, the SelectUSA team at the U.S. Department of Commerce worked with the Puerto Rico team to offer Lufthansa information and assistance from across federal agencies and departments that not only assisted in making their decision but demonstrated why the United States is the top destination for foreign direct investment.
Washington, DC – April 10: Penny Pritzker, Alejandro Garcia Padilla, August Wilhelm Henningsen, and Peter Ammon attend a signing ceremony for an agreement to create a new Lufthansa Aviation Facility in Puerto Rico at German Ambassador Residence on April 10, 2014 in Washington, DC.
SelectUSA Case Study:
Lufthansa
© International Trade Administration 201426
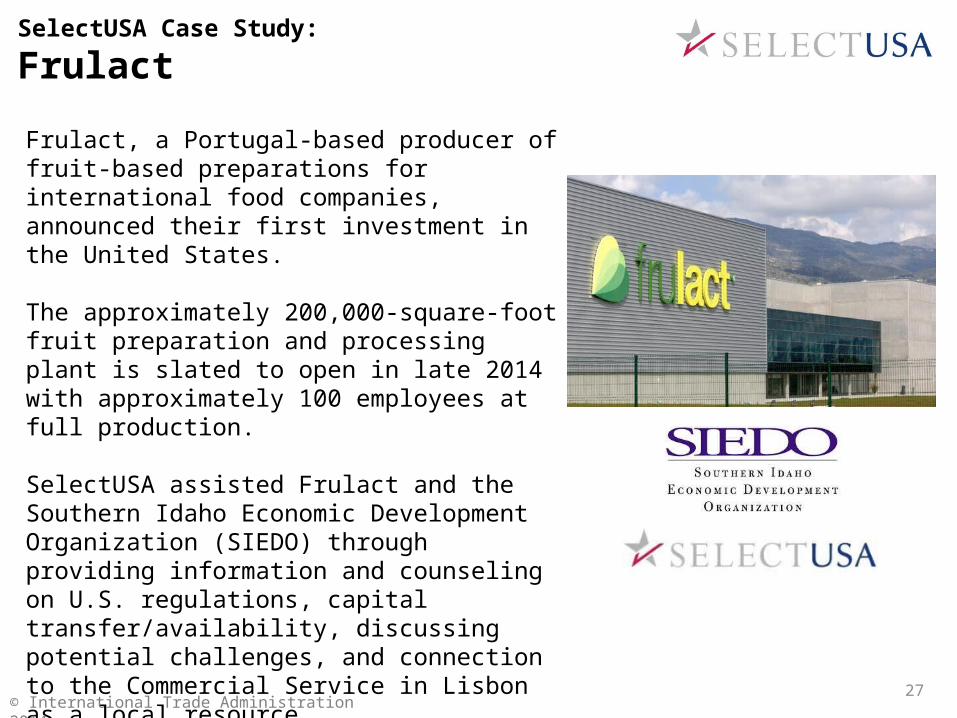
Frulact, a Portugal-based producer of fruit-based preparations for international food companies, announced their first investment in the United States.
The approximately 200,000-square-foot fruit preparation and processing plant is slated to open in late 2014 with approximately 100 employees at full production.
SelectUSA assisted Frulact and the Southern Idaho Economic Development Organization (SIEDO) through providing information and counseling on U.S. regulations, capital transfer/availability, discussing potential challenges, and connection to the Commercial Service in Lisbon as a local resource.
SelectUSA Case Study:
Frulact
© International Trade Administration 201427
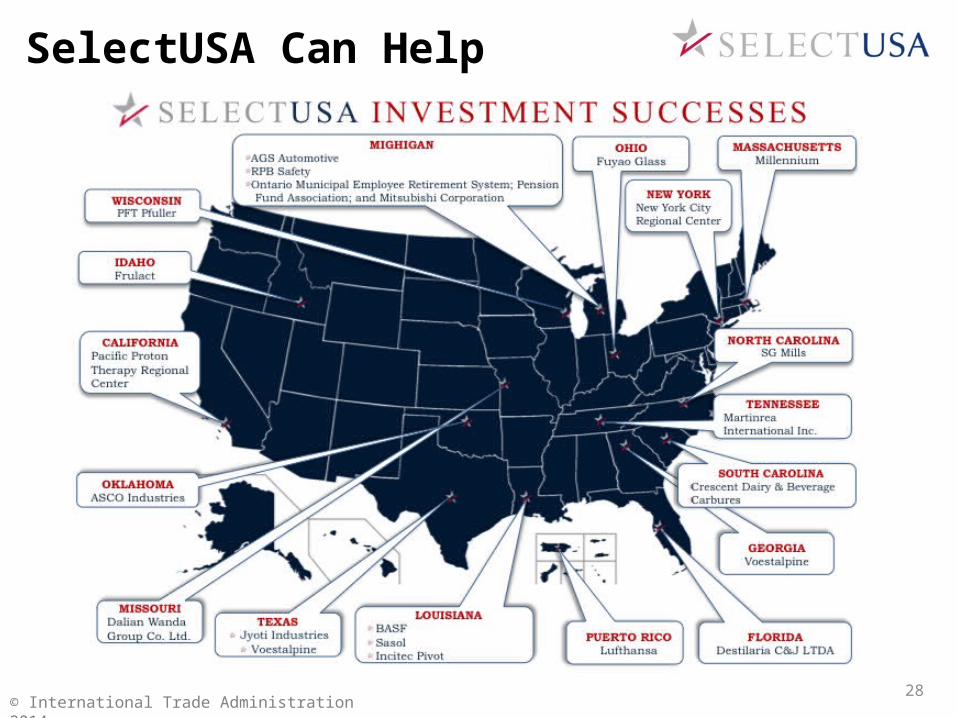
SelectUSA Can Help
© International Trade Administration 201428
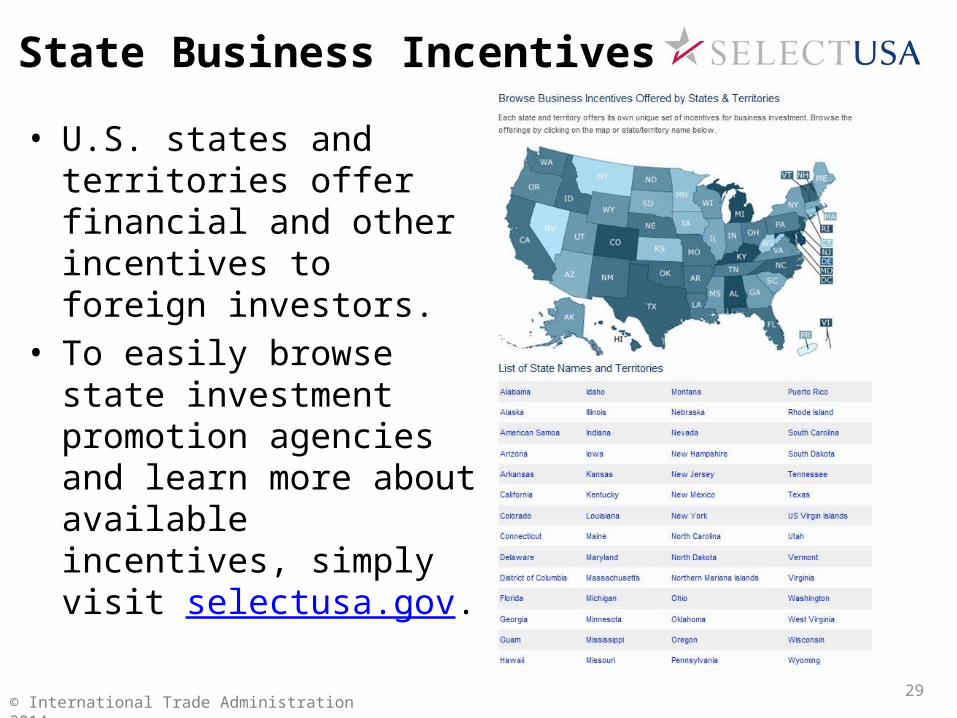
• U.S. states and territories offer financial and other incentives to foreign investors.
• To easily browse state investment promotion agencies and learn more about available incentives, simply visit selectusa.gov.
State Business Incentives
© International Trade Administration 201429
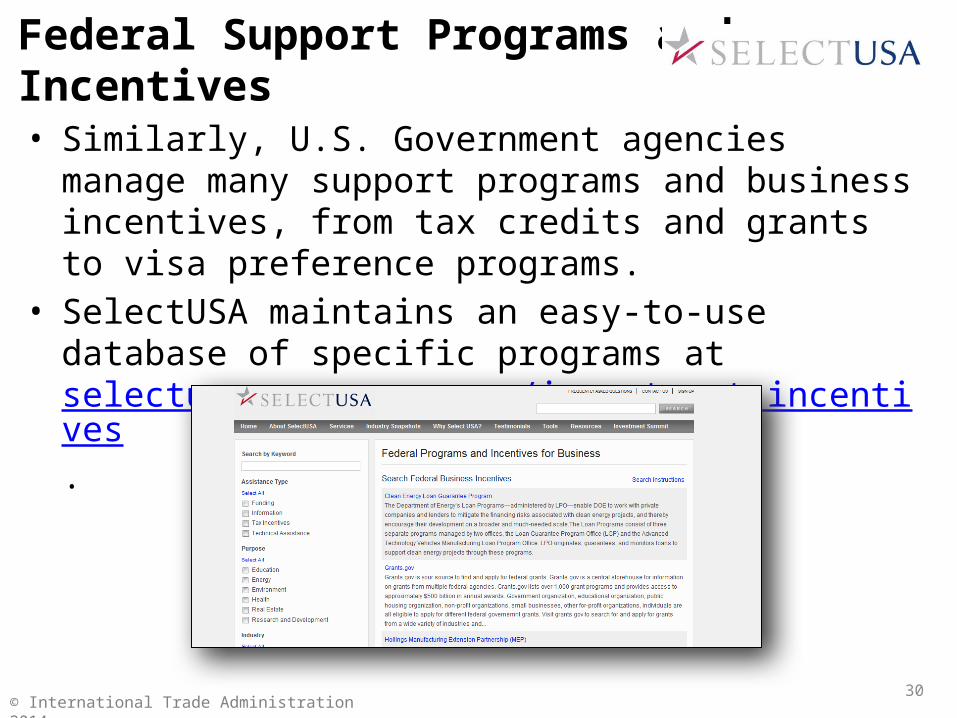
• Similarly, U.S. Government agencies manage many support programs and business incentives, from tax credits and grants to visa preference programs.
• SelectUSA maintains an easy-to-use database of specific programs at selectusa.commerce.gov/investment-incentives.
Federal Support Programs and Incentives
© International Trade Administration 201430
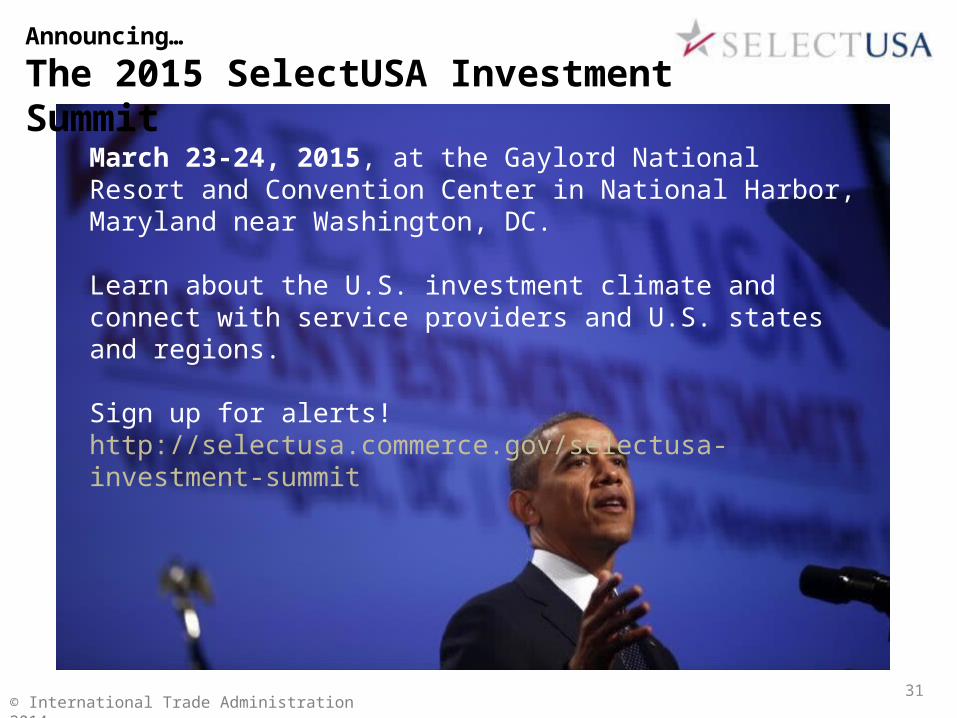
Announcing…
The 2015 SelectUSA Investment Summit
March 23-24, 2015, at the Gaylord National Resort and Convention Center in National Harbor, Maryland near Washington, DC.
Learn about the U.S. investment climate and connect with service providers and U.S. states and regions.
Sign up for alerts! http://selectusa.commerce.gov/selectusa-investment-summit
© International Trade Administration 201431
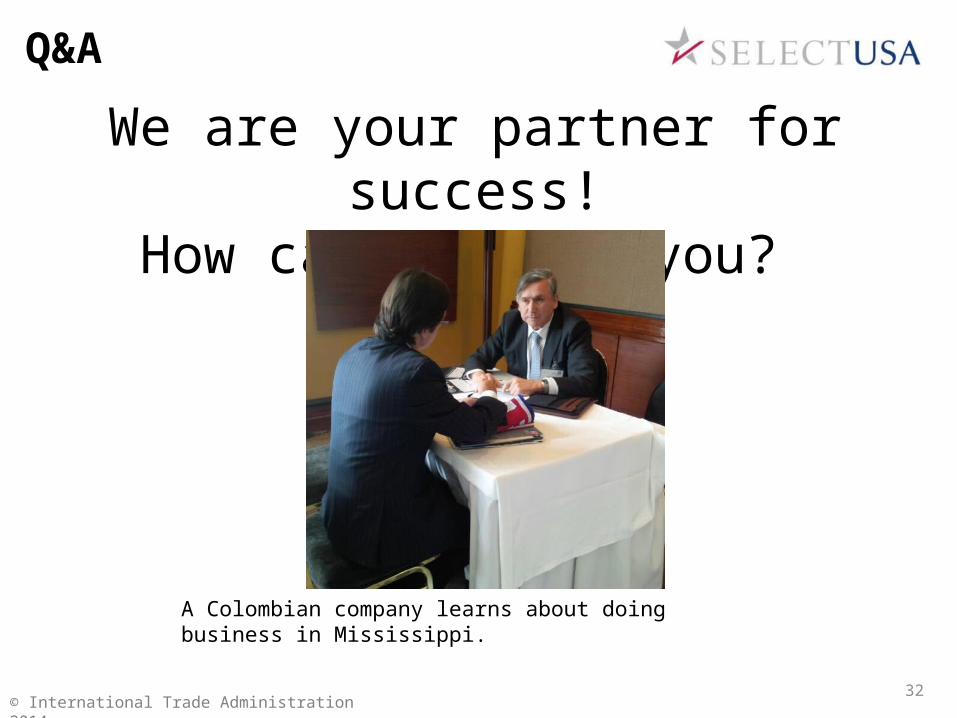
We are your partner for success!How can we help you?
© International Trade Administration 2014
A Colombian company learns about doing business in Mississippi.
32
Q&A
Thank You
© International Trade Administration 2014
@SelectUSA & #SelectUSA on Twitter
33
Aaron BrickmanDeputy Executive DirectorSelectUSAU.S. Department of CommerceTel: [email protected] SelectUSA.gov
Appendix:Additional Data and
Information
© International Trade Administration 201434
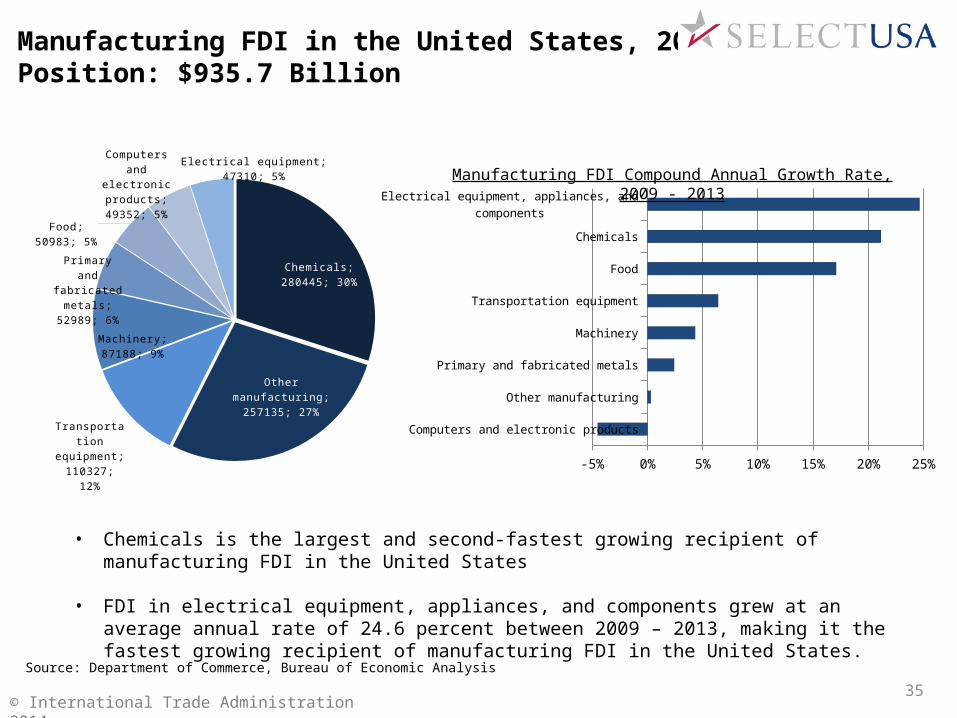
Manufacturing FDI in the United States, 2013Position: $935.7 Billion
© International Trade Administration 2014
Chemicals; 280445; 30%
Other manufacturing; 257135; 27%
Transportation equipment;
110327; 12%
Machinery; 87188; 9%
Primary and fabricated
metals; 52989; 6%
Food; 50983; 5%
Computers and electronic products;
49352; 5%
Electrical equipment; 47310; 5%
Source: Department of Commerce, Bureau of Economic Analysis
Computers and electronic products
Other manufacturing
Primary and fabricated metals
Machinery
Transportation equipment
Food
Chemicals
Electrical equipment, appliances, and components
-5% 0% 5% 10% 15% 20% 25%
• Chemicals is the largest and second-fastest growing recipient of manufacturing FDI in the United States
• FDI in electrical equipment, appliances, and components grew at an average annual rate of 24.6 percent between 2009 – 2013, making it the fastest growing recipient of manufacturing FDI in the United States.
Manufacturing FDI Compound Annual Growth Rate, 2009 - 2013
35
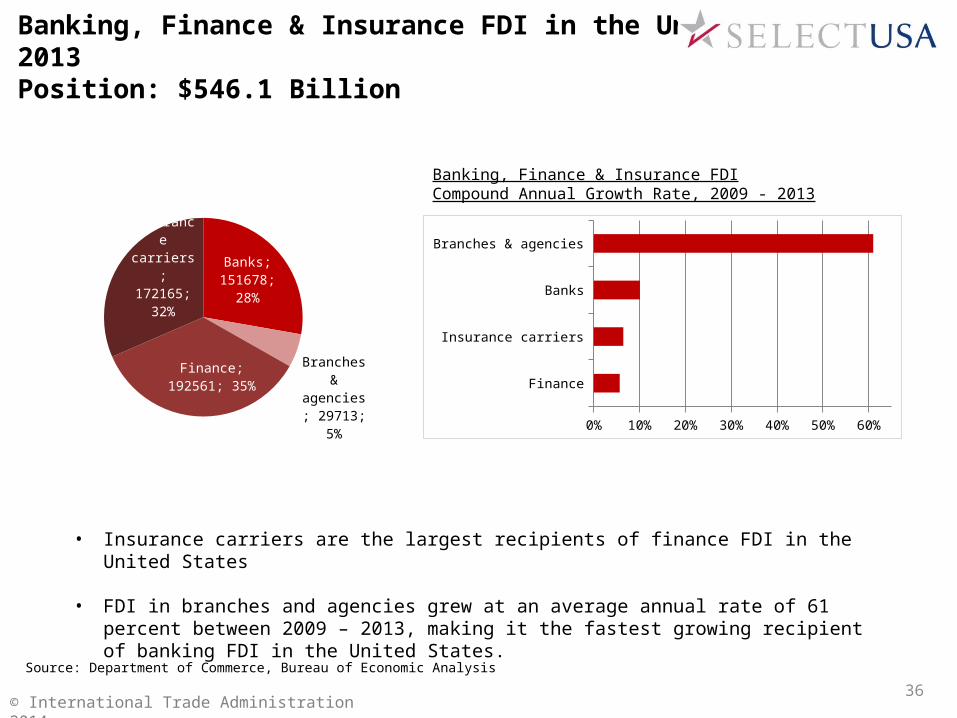
Banking, Finance & Insurance FDI in the United States, 2013Position: $546.1 Billion
© International Trade Administration 2014
Source: Department of Commerce, Bureau of Economic Analysis
• Insurance carriers are the largest recipients of finance FDI in the United States
• FDI in branches and agencies grew at an average annual rate of 61 percent between 2009 – 2013, making it the fastest growing recipient of banking FDI in the United States.
Banking, Finance & Insurance FDICompound Annual Growth Rate, 2009 - 2013
Banks; 151678; 28%
Branches & agencies;
29713; 5%
Finance; 192561; 35%
Insurance carriers; 172165;
32%
Finance
Insurance carriers
Banks
Branches & agencies
0% 10% 20% 30% 40% 50% 60%
36
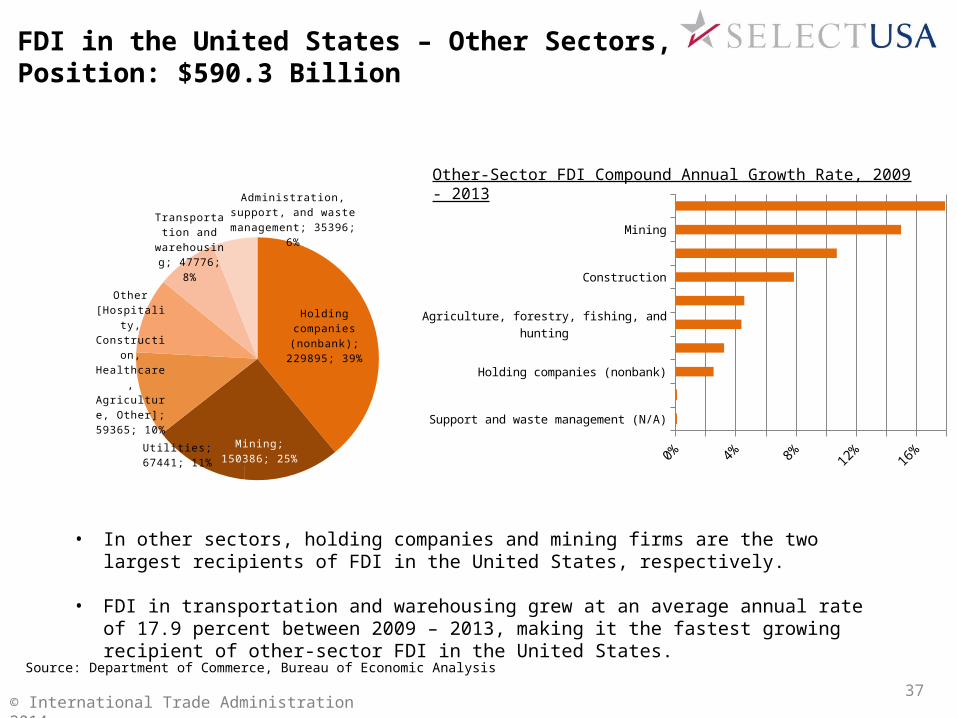
FDI in the United States – Other Sectors, 2013Position: $590.3 Billion
© International Trade Administration 2014
Source: Department of Commerce, Bureau of Economic Analysis
• In other sectors, holding companies and mining firms are the two largest recipients of FDI in the United States, respectively.
• FDI in transportation and warehousing grew at an average annual rate of 17.9 percent between 2009 – 2013, making it the fastest growing recipient of other-sector FDI in the United States.
Other-Sector FDI Compound Annual Growth Rate, 2009 - 2013
Holding companies (nonbank); 229895; 39%
Mining; 150386; 25%
Utilities; 67441;
11%
Other [Hospi-tality, Con-
struc-tion,
Health-care, Agri-cul-
ture, Other]; 59365;
10%
Trans-porta-
tion and ware-
housing; 47776;
8%
Administration, support, and waste management; 35396;
6%
Support and waste management (N/A)
Health care and social assistance (N/A)
Holding companies (nonbank)
Utilities
Agriculture, forestry, fishing, and hunting
Accommodation and food services
Construction
Miscellaneous services
Mining
Transportation and warehousing
0% 2% 4% 6% 8% 10% 12% 14% 16% 18%
37