Embed Size (px)
Citation preview
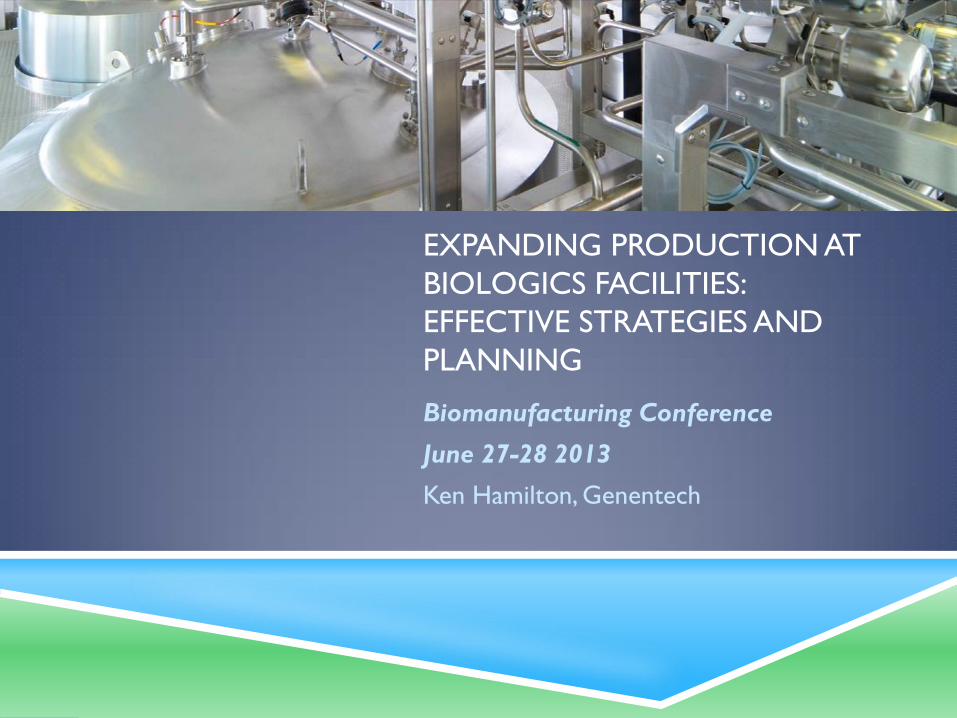
EXPANDING PRODUCTION AT
BIOLOGICS FACILITIES:
EFFECTIVE STRATEGIES AND
PLANNING
Biomanufacturing Conference
June 27-28 2013
Ken Hamilton, Genentech
AGENDA
Business Drivers
Strategic Considerations
Business Objectives
Financial Considerations
Processes and Tools
Risks & “Watch outs”
Summary
BUSINESS DRIVERS Required available, operating & planned capacity
Capacity is both titer &yield and runs per year
“Surge capacity” – who owns this? Network or site?
Duration of shutdown for plant changes
Capital cost v shutdown cost
Lost capacity – impact to network supply
Coordinate shutdown with other network shutdowns
Time to implement capacity increase
Scope v network capacity needs
Cost
Opportunity cost to network – can capacity be gained elsewhere in network?
Project cost & start up cost
STRATEGIC CONSIDERATIONS
Impact of changes on long range product demand:
Target fixed run rate increase or account for change in future demand?
Increase capacity for all products?
Operational reliability: Degree of redundancy for critical systems versus
lean based reliability engineering programs
Total cost of ownership:
Evaluate capital cost for new equipment versus cost of instituting operational
methods & increase to operations staffing levels
Prioritize, in advance, between scope of improvements, schedule and cost
Change Management for changes to GMP systems; account for partner
notifications during planning – impact to project timeline
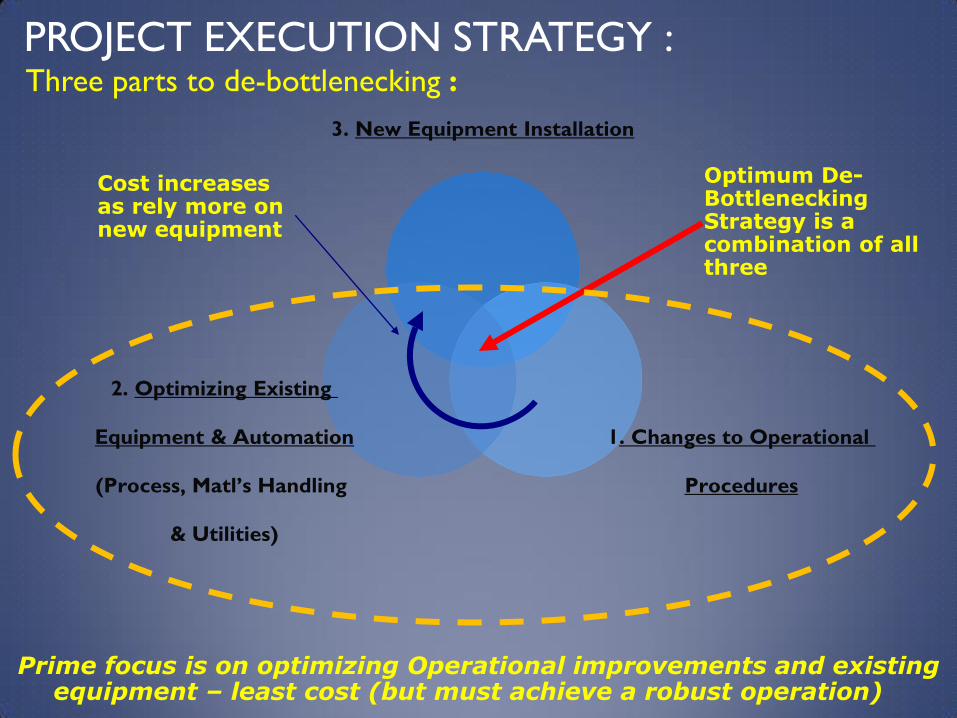
PROJECT EXECUTION STRATEGY :
3. New Equipment Installation
1. Changes to Operational
Procedures
2. Optimizing Existing
Equipment & Automation
(Process, Matl’s Handling
& Utilities)
Optimum De-Bottlenecking Strategy is a combination of all three
Prime focus is on optimizing Operational improvements and existing equipment – least cost (but must achieve a robust operation)
Cost increases as rely more on new equipment
Three parts to de-bottlenecking :
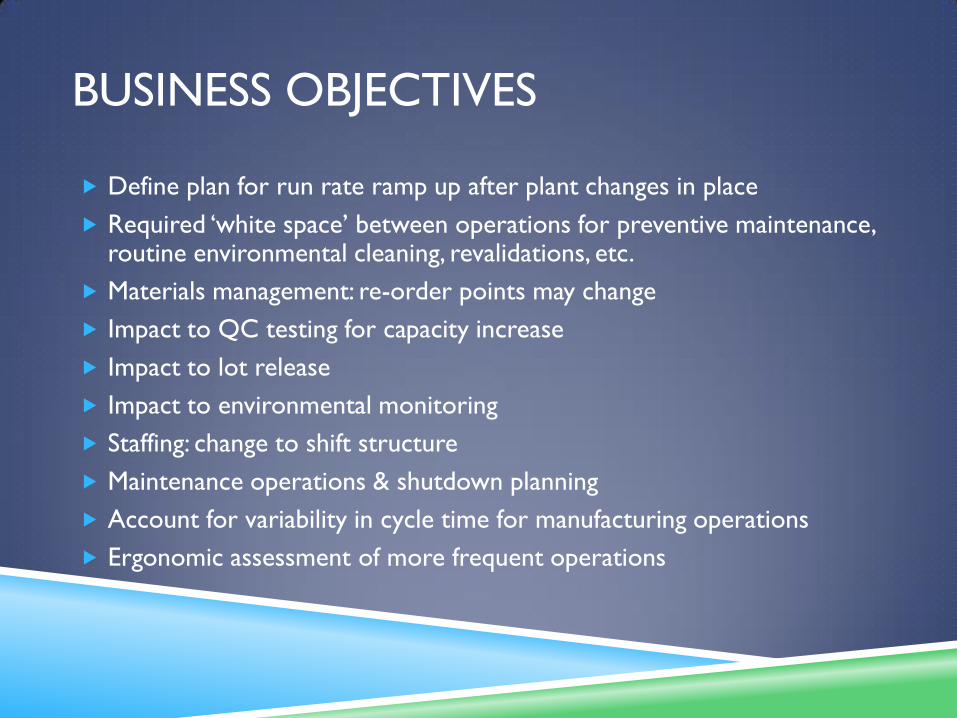
BUSINESS OBJECTIVES
Define plan for run rate ramp up after plant changes in place
Required ‘white space’ between operations for preventive maintenance, routine environmental cleaning, revalidations, etc.
Materials management: re-order points may change
Impact to QC testing for capacity increase
Impact to lot release
Impact to environmental monitoring
Staffing: change to shift structure
Maintenance operations & shutdown planning
Account for variability in cycle time for manufacturing operations
Ergonomic assessment of more frequent operations
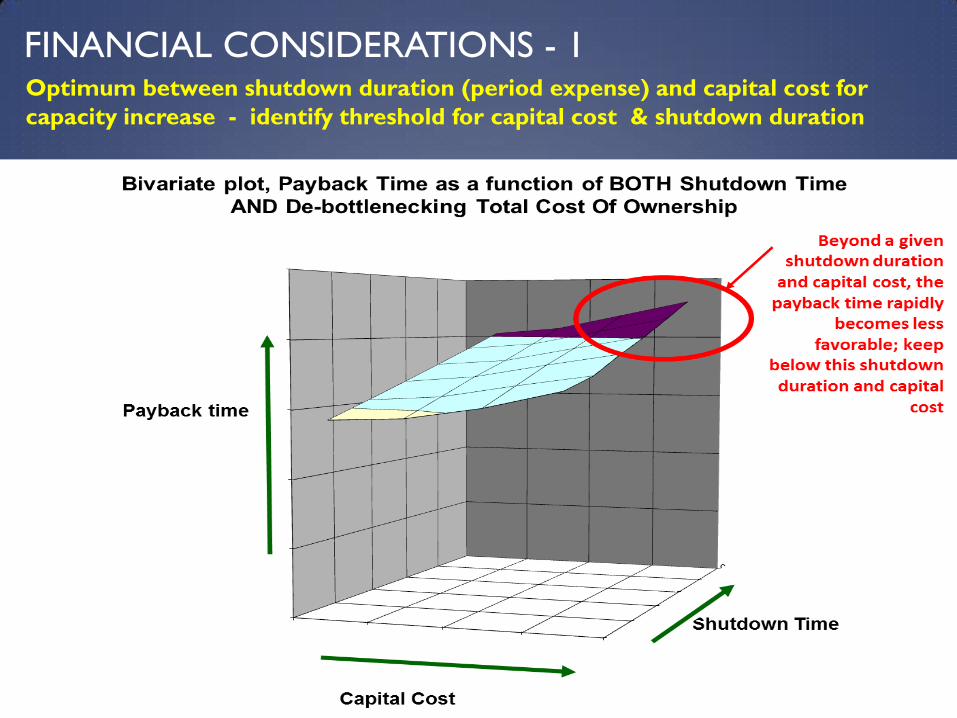
FINANCIAL CONSIDERATIONS - 1 Optimum between shutdown duration (period expense) and capital cost for
capacity increase - identify threshold for capital cost & shutdown duration
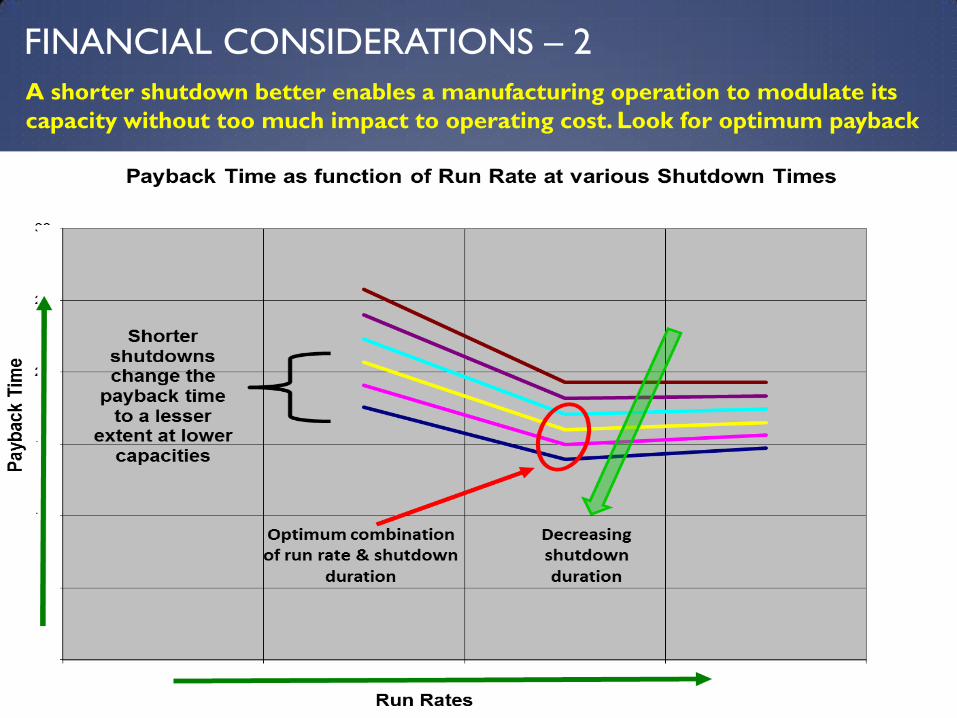
FINANCIAL CONSIDERATIONS – 2 A shorter shutdown better enables a manufacturing operation to modulate its
capacity without too much impact to operating cost. Look for optimum payback
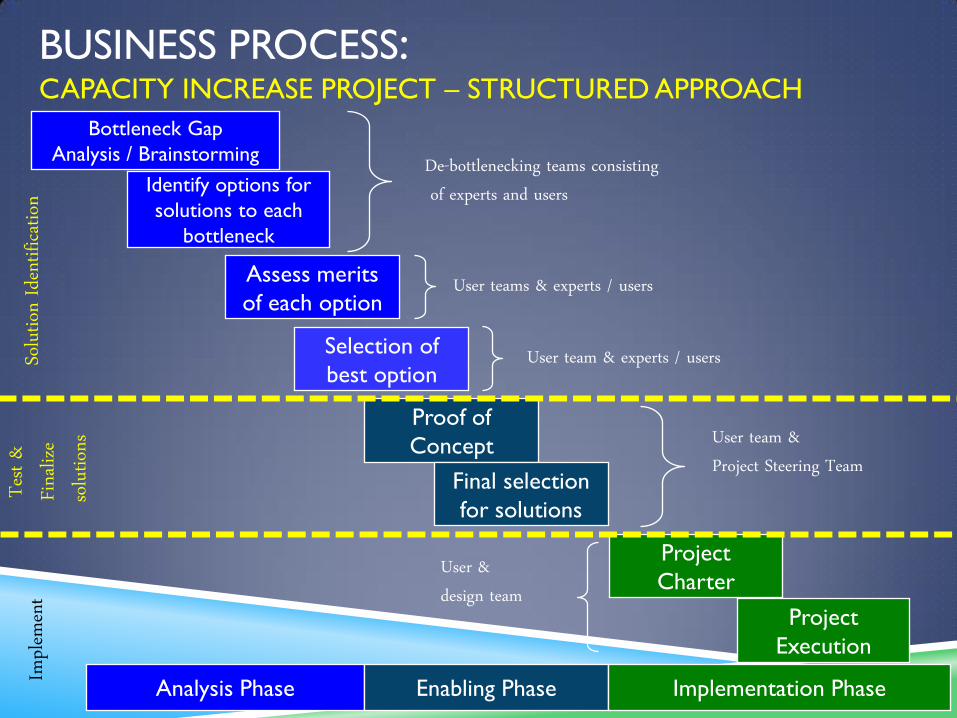
BUSINESS PROCESS: CAPACITY INCREASE PROJECT – STRUCTURED APPROACH
Assess merits
of each option
Selection of
best option
Identify options for
solutions to each
bottleneck
Proof of
Concept
Final selection
for solutions
Project
Charter
Bottleneck Gap
Analysis / Brainstorming
Analysis Phase Enabling Phase Implementation Phase
De-bottlenecking teams consisting of experts and users
User team & experts / users
User team & Project Steering Team
User & design team
User teams & experts / users
Solut
ion Id
entifi
cation
Te
st &
Fin
alize
solut
ions
Project
Execution
Imple
ment
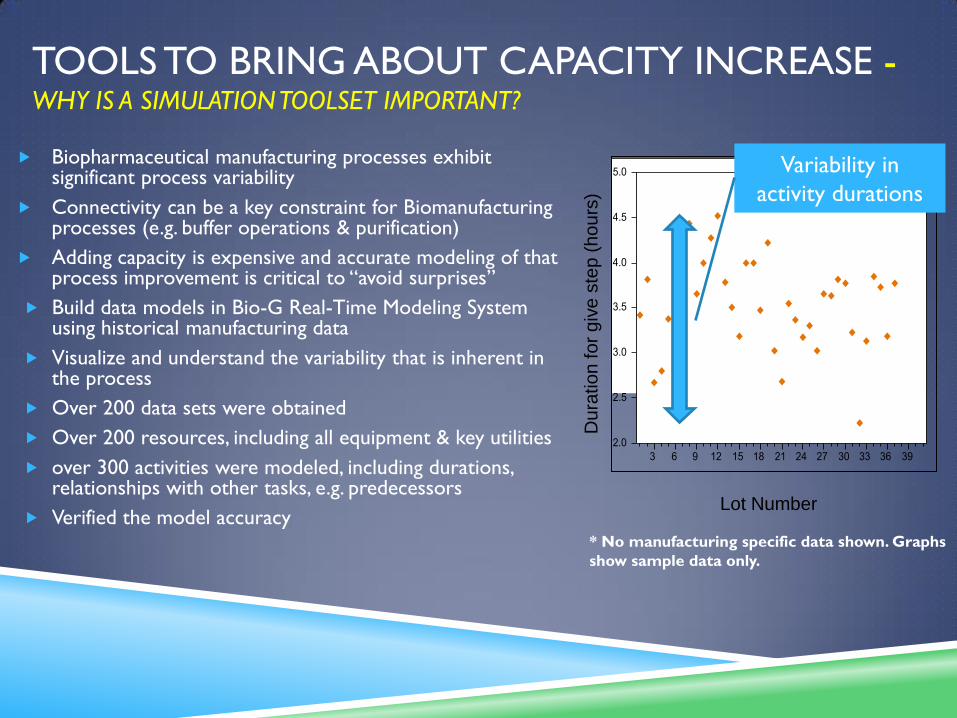
TOOLS TO BRING ABOUT CAPACITY INCREASE - WHY IS A SIMULATION TOOLSET IMPORTANT?
Biopharmaceutical manufacturing processes exhibit significant process variability
Connectivity can be a key constraint for Biomanufacturing processes (e.g. buffer operations & purification)
Adding capacity is expensive and accurate modeling of that process improvement is critical to “avoid surprises”
Build data models in Bio-G Real-Time Modeling System using historical manufacturing data
Visualize and understand the variability that is inherent in the process
Over 200 data sets were obtained
Over 200 resources, including all equipment & key utilities
over 300 activities were modeled, including durations, relationships with other tasks, e.g. predecessors
Verified the model accuracy
* No manufacturing specific data shown. Graphs
show sample data only.
Variability in
activity durations
Lot Number
Du
ratio
n fo
r g
ive
ste
p (
ho
urs
)
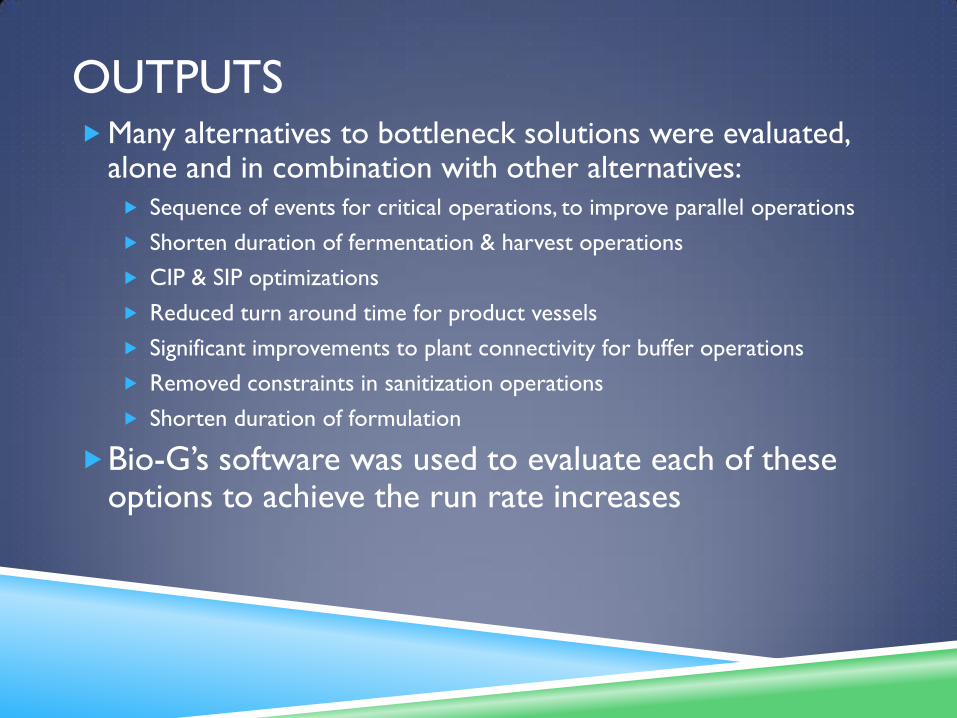
OUTPUTS Many alternatives to bottleneck solutions were evaluated,
alone and in combination with other alternatives:
Sequence of events for critical operations, to improve parallel operations
Shorten duration of fermentation & harvest operations
CIP & SIP optimizations
Reduced turn around time for product vessels
Significant improvements to plant connectivity for buffer operations
Removed constraints in sanitization operations
Shorten duration of formulation
Bio-G’s software was used to evaluate each of these options to achieve the run rate increases
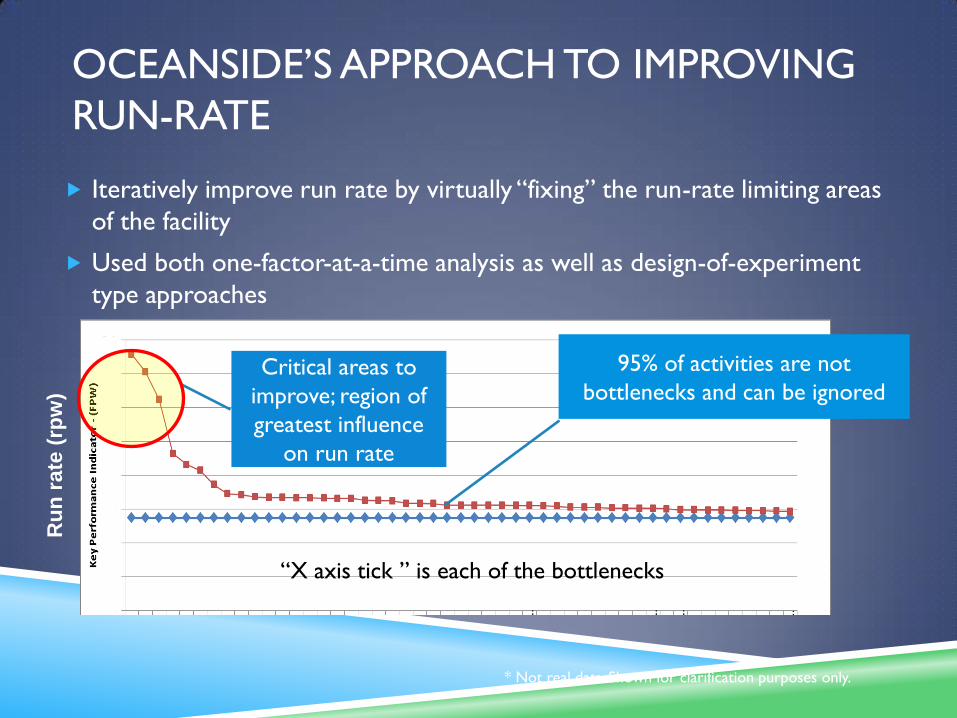
OCEANSIDE’S APPROACH TO IMPROVING
RUN-RATE
Iteratively improve run rate by virtually “fixing” the run-rate limiting areas
of the facility
Used both one-factor-at-a-time analysis as well as design-of-experiment
type approaches
Critical areas to
improve; region of
greatest influence
on run rate
95% of activities are not
bottlenecks and can be ignored
* Not real data. Shown for clarification purposes only.
“X axis tick ” is each of the bottlenecks
Ru
n r
ate
(rp
w)
0
1
2
3
4
5
6
7
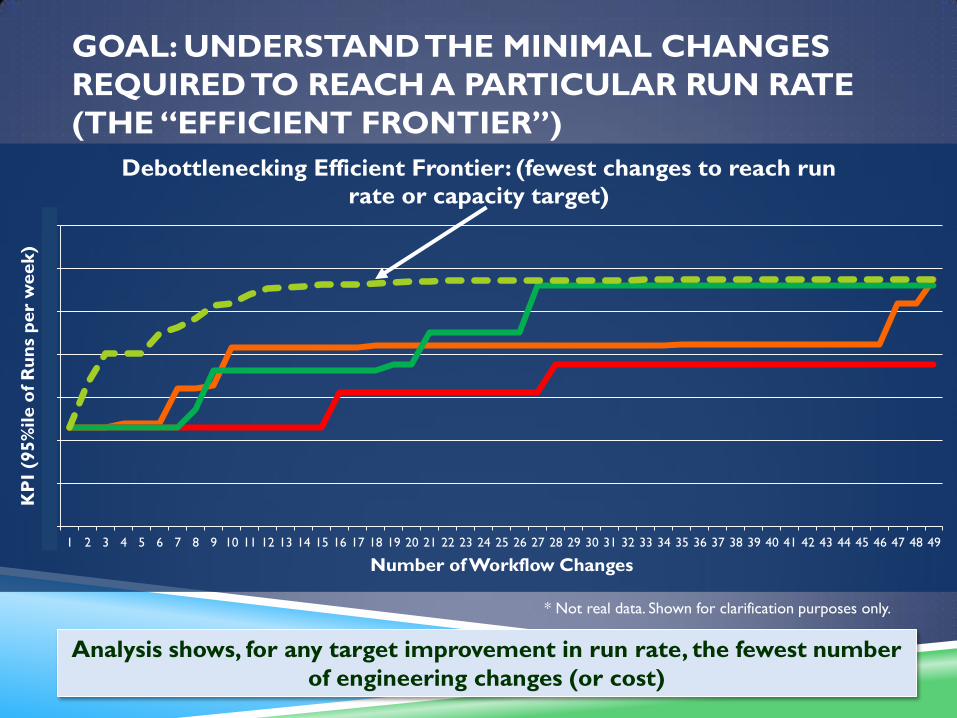
1 2 3 4 5 6 7 8 9 10 11 12 13 14 15 16 17 18 19 20 21 22 23 24 25 26 27 28 29 30 31 32 33 34 35 36 37 38 39 40 41 42 43 44 45 46 47 48 49
KP
I (9
5%
ile o
f R
un
s p
er
week)
Number of Workflow Changes
Debottlenecking Efficient Frontier: (fewest changes to reach run
rate or capacity target)
GOAL: UNDERSTAND THE MINIMAL CHANGES
REQUIRED TO REACH A PARTICULAR RUN RATE
(THE “EFFICIENT FRONTIER”)
Analysis shows, for any target improvement in run rate, the fewest number
of engineering changes (or cost)
* Not real data. Shown for clarification purposes only.
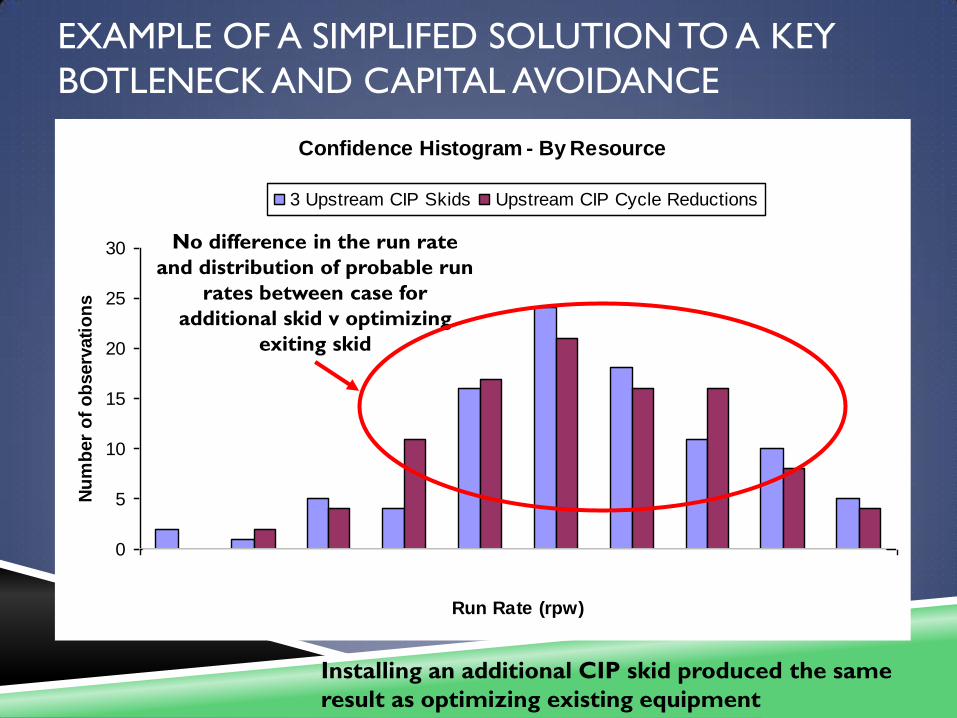
Confidence Histogram - By Resource
0
5
10
15
20
25
30
3.355 3.379 3.402 3.426 3.450 3.478 3.503 3.528 3.554 3.580
Run Rate (rpw)
Nu
mb
er
of
ob
serv
ati
on
s
3 Upstream CIP Skids Upstream CIP Cycle Reductions
EXAMPLE OF A SIMPLIFED SOLUTION TO A KEY
BOTLENECK AND CAPITAL AVOIDANCE
Installing an additional CIP skid produced the same
result as optimizing existing equipment
No difference in the run rate
and distribution of probable run
rates between case for
additional skid v optimizing
exiting skid
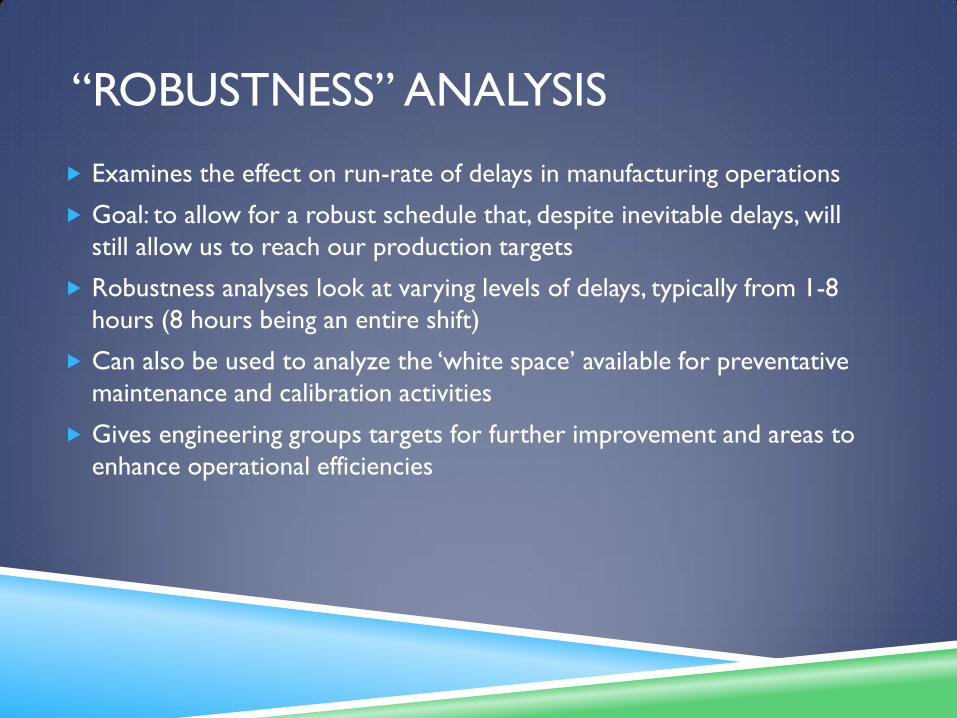
“ROBUSTNESS” ANALYSIS
Examines the effect on run-rate of delays in manufacturing operations
Goal: to allow for a robust schedule that, despite inevitable delays, will
still allow us to reach our production targets
Robustness analyses look at varying levels of delays, typically from 1-8
hours (8 hours being an entire shift)
Can also be used to analyze the ‘white space’ available for preventative
maintenance and calibration activities
Gives engineering groups targets for further improvement and areas to
enhance operational efficiencies
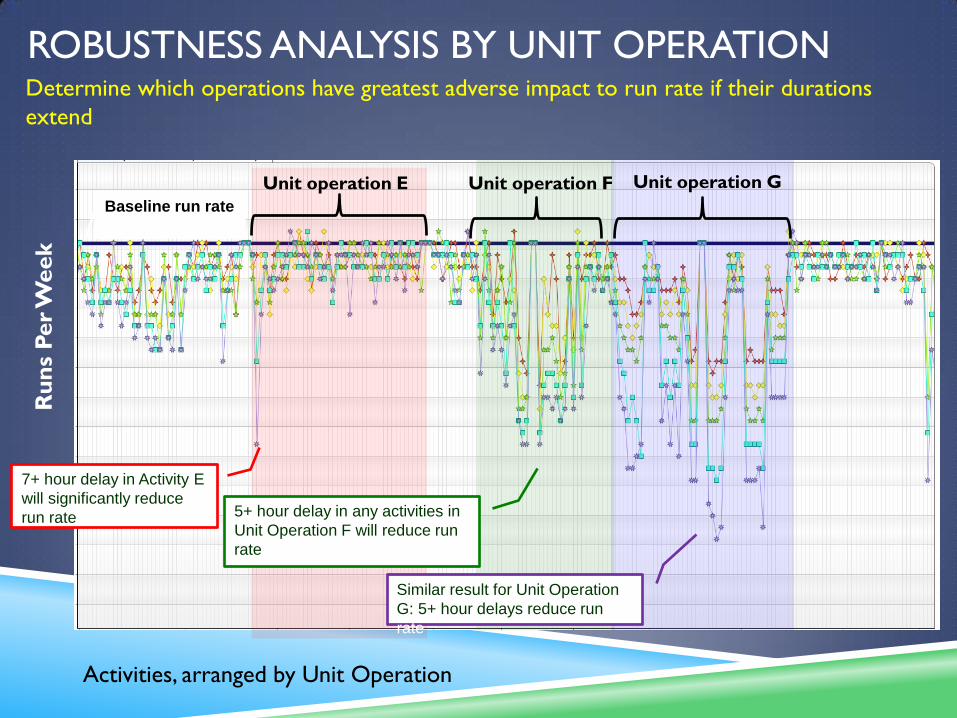
ROBUSTNESS ANALYSIS BY UNIT OPERATION
7+ hour delay in Activity E
will significantly reduce
run rate 5+ hour delay in any activities in
Unit Operation F will reduce run
rate
Similar result for Unit Operation
G: 5+ hour delays reduce run
rate
Baseline run rate
Ru
ns
Per
Week
Activities, arranged by Unit Operation
Determine which operations have greatest adverse impact to run rate if their durations
extend
Unit operation E Unit operation F Unit operation G
RISKS AND “WATCH OUTS” Finding the optimum of likelihood of attaining target sustained capacity
increase, cost and any shutdown durations is key
Find balance between optimizing existing equipment versus installing back up
systems
Ensure capacity increase projects are always linked back to business needs
Business needs could change thru life of the project
Ensure scope of changes is thoroughly defined at the outset
Need to ensure operations groups and teams remain fully engaged thru
life of project
Ideally transition project to an operations group toward end of
implementation phase
Develop accurate cost estimates early in the project
Avoids recycle
SUMMARY
Seek alignment between business drivers and project execution
Ensure project continues to align to business drivers even once project
execution starts – capacity demands can change
Develop and apply a model to carefully identify solutions to bottlenecks
Account for variability in the manufacturing operation

ACKNOWLEDGEMENTS
Special recognition to:
Tiffany Barbour - Lead for BioG modeling at Genentech Oceanside site
Rick Johnson , Ph.D. – Principal, Bioproduction Group
David Zhang - Bioproduction Group