Embed Size (px)
Citation preview
Exopolysaccharides and Antimicrobial BiosurfactantsProduced by Paenibacillus macerans TKU029
Tzu-Wen Liang & Chia-Chen Wu & Wei-Ting Cheng &
Yu-Chi Chen & Chuan-Lu Wang & I-Li Wang &
San-Lang Wang
Received: 16 July 2013 /Accepted: 30 September 2013 /Published online: 15 October 2013# Springer Science+Business Media New York 2013
Abstract Paenibacillus macerans TKU029 can produce exopolysaccharides (EPSs;3.46 g/L) and a biosurfactant (1.78 g/L) in a medium with 2 % (w/v) squid pen powder asthe sole carbon/nitrogen source. The biosurfactant can reduce the surface tension of waterfrom 72.30 to 35.34 mN/m at a concentration of 2.76 g/L and reach an emulsification indexof 56 % after a 24-h reaction with machine oil. This biosurfactant is stable at 121 °C for20 min, over a pH range from 3 to 11, and in <5 % salt solutions. It also shows significantantimicrobial activity, which remains active after treatment at 121 °C and at pH values from4 to 10, against Escherichia coli BCRC13086, Staphylococcus aureus BCRC10780, Fusar-ium oxysporum BCRC32121 and Aspergillus fumigatus BCRC30099. Furthermore, humanskin shows from 37.3 to 44.3 % hydration after being treated with TKU029 EPSs for180 min. These results imply that EPSs and the biosurfactant from this strain have potentialin cosmetics, for removal of oil contamination, and as antimicrobial agents.
Keywords Paenibacillus macerans . Exopolysaccharides . Biosurfactant . Antimicrobialactivity . Skin hydration . Squid pen
Appl Biochem Biotechnol (2014) 172:933–950DOI 10.1007/s12010-013-0568-5
T.<W. Liang : S.<L. WangLife Science Development Center, Tamkang University, New Taipei City 25137, Taiwan
T.<W. Liang : C.<C. Wu :W.<T. Cheng : S.<L. Wang (*)Department of Chemistry, Tamkang University, New Taipei City 25137, Taiwane-mail: [email protected]
Y.<C. ChenDepartment of Cosmetic Science, Vanung University, Chung-Li 320, Taiwan
C.<L. WangDepartment of Cosmetic Science and Application, Lan-Yang Institute of Technology, I-Lan 261, Taiwan
I.<L. WangDepartment of Chemical and Materials Engineering, Tamkang University, New Taipei City 25137,Taiwan
Present Address:S.-L. WangNo. 151, Yingchuan Rd., Tamsui Dist., New Taipei City 25137, Taiwan
Introduction
Biosurfactants are a class of surfactants mainly produced by microorganisms [1]. Mostbiosurfactant-producing bacteria are isolated from oil-containing media such as waste oil,oil-contaminated soil and sludge [2–9]. Biosurfactants can increase the availability ofinsoluble carbon sources. Organisms produce biosurfactants to dissolve and utilise insolublecarbon for survival [10]. The action of surfactants is due to a combination of active surfacemolecules with different chemical moieties; therefore, most surfactants are produced bychemical synthesis. In recent years, interest in the advantages of biosurfactants has in-creased. These advantages include low toxicity, high biodegradability, good environmentalcompatibility, high foaming capacity, high selectivity and stability in extreme environments[11]. Over the last decade, biosurfactants have been under investigation as potential replace-ments for synthetic surfactants and are expected to have many potential industrial andenvironmental applications related to emulsification, foaming, detergency, wetting, disper-sion and solubilisation of hydrophobic compounds [12]. Additionally, over the past fewdecades, the number of known exopolysaccharides (EPSs) produced by microbial fermen-tation has been gradually increasing. In recent years, microbial EPSs have found manyapplications in the food, pharmaceutical and other industries as they have different physi-ological activities from natural gums and synthetic polymers [13,14]. Moreover, they arehighly susceptible to natural biodegradation and are less harmful than synthetic polymers.
Microbial communities of Acinetobacter, Arthrobacter, Pseudomonas, Halomonas, Ba-cillus, Rhodococcus, Enterobacter and yeast have been reported to produce biosurfactantsand EPSs [12]. Most biosurfactants are produced by the metabolic activities of yeast orbacteria on substrates such as sugars, lipids, alkanes and waste material [15]. Molecularstructures of biosurfactants include chemical groups such as glycolipids, lipopeptides,phospholipids, neutral lipids and other materials [16–18]. The lipopeptides are an interestingclass of microbial surfactants because of their manifold attractive properties, such asantibiotic activity [19]. Few reports are available about the simultaneous production ofbiosurfactants and EPSs from the same microorganisms [12]. The present study reportsthe production of an antimicrobial biosurfactant and moisturising EPSs by Paenibacillusmacerans TKU029 with squid pen powder (SPP) as the sole C/N source. The annual catch ofthe swordtip squid is approximately 10,000 mt, according to Japanese and Chinese fishingdata [20]. Of that, approximately 100 mt (or 1 %) was squid pen. The price of SPP is verylow (about US $0.30 per kilogram). The production of inexpensive biosurfactant and EPSsis an important factor in the utilisation of fishery processing wastes. The discovery ofinexpensive biosurfactant and EPSs not only solves environmental problems but alsopromotes the economic value of marine wastes. In this study, media and culture conditionsfor production are optimised, and the characterisation of the biosurfactant and EPSs isdiscussed. We also report the stability and the potential applications of the biosurfactantand EPSs for removal of oil, antimicrobial activity and moisture retention by human skin.
Methods and Materials
Materials
SPP and shrimp head powder (SHP) were prepared as described previously [21]. Squid penand shrimp head were purchased from the Shin-Ma Frozen Food Co. (I-Lan, Taiwan),washed thoroughly with tap water and then dried. The dried materials were ground to a
934 Appl Biochem Biotechnol (2014) 172:933–950
powder for use as the carbon/nitrogen source in the production of biosurfactants. All otherreagents used were of the highest grade available.
Identification of Microorganism
The bacterial strain TKU029 was identified on the basis of morphological, physiological andbiochemical parameters and on the basis of 16S rDNA-based sequence analysis after PCRamplification and cloning. The DNA sequences obtained were compiled and compared withsequences in the GenBank database using the BLAST program. Further identification ofstrain TKU029 was performed using the analytical profile index (API).
Strain TKU029 was grown on nutrient agar plates. Bacterial cells on the agar surfacewere resuspended by gentle mechanical agitation in 2 mL of sterile distilled water. Thisbacterial suspension was used to inoculate API 50 CHB strips (identification of Bacillus;ATB System, bioMérieux SA, Marcy-I’Etoile, France) following the manufacturer’s instruc-tions. The strips were incubated at 30 °C and observed after 16, 24, 40 and 48 h to checkthem against the API identification index and database.
Culture Conditions for Biosurfactant and EPS Production
Concentration of Carbon/Nitrogen Source
SPP (0.5–2 g) was added to 100 mL of basal medium (containing 0.1 % K2HPO4 and 0.05 %MgSO4⋅7H2O). P. macerans TKU029 was inoculated and the bacteria were cultured at 37 °Cand 150 rpm for 7 days. The centrifuged fermentation broth was measured for surfacetension and total sugar content. After analysis, the carbon/nitrogen source concentration thatenabled maximal production of biosurfactants and EPSs was selected. The effect of differentculture volumes on the production of biosurfactants and EPSs was then investigated.
Culture Volume
The degree of aeration in the culture medium affects cell growth, and the culture volume isrelated to the aeration of the medium. Thus, medium containing 2 % (w/v) SPP, 0.1 %K2HPO4 and 0.05 % MgSO4⋅7H2O was used to investigate the influence of medium volumeon the production of biosurfactants and EPSs. Different volumes (50, 100 and 200 mL) ofmedium were poured into individual 250-mL flasks. Bacterial liquid cultures were grown at37 °C and 150 rpm for 6 days to study the effect of medium volume on TKU029biosurfactant and EPS production. The culture volumes that were most favourable for theproduction of biosurfactants and EPSs were selected.
Culture Temperature and Medium pH
Conical flasks containing 100 mL of medium (consisting of 2 % (w/v) SPP, 0.1 % K2HPO4
and 0.05 % MgSO4⋅7H2O) were used to investigate the influence of various temperatures(25, 30, or 37 °C) on TKU029 biosurfactant and EPS production. The temperatures mostfavourable for biosurfactant and EPS production were selected. To determine the optimuminitial medium pH for TKU029 biosurfactant and EPS production, the medium was adjustedto the appropriate pH by the addition of 1 N HCl or 1 N NaOH prior to sterilisation. A timecourse experiment was performed in a 250-mL flask containing the optimised culturemedium based on the results of the single-factor experiments.
Appl Biochem Biotechnol (2014) 172:933–950 935
Measurement of Surface Tension
Surface tension was measured at room temperature using a contact angle goniometer(Sindatek Model 100SB) with the pendant drop method. Model 100SB is an instrumentwith a compact design for the contact angle measuring technique and drop shape analysis.For software-controlled measurement and analysis of the drop shape according to thependant drop method, the surface tension is determined by analysis of the drop shape.
Measurement of Total Sugar
To evaluate total sugar in the medium, the phenol-sulphuric acid method was used [22].Briefly, 25 μL of 5 % phenol was added to 1 mL of sample. After shaking, 2.5 mL ofconcentrated H2SO4 was added. The mixture was left to stand for 10 min and absorbancewas read at 490 nm. Pure D-glucose was employed as a standard.
Isolation of TKU029 Biosurfactant
The culture broth was centrifuged at 10,400×g for 15 min to obtain a cell-free supernatant.The TKU029 biosurfactant was precipitated by adjusting the pH of the cell-free supernatantto 12 using 2 N NaOH and by incubating overnight at 4 °C. The precipitate thus formed wasremoved by centrifugation (10,400×g, 15 min, 4 °C). The supernatant was lyophilised andextracted with methanol. The insoluble substances were removed, concentrated by vacuumdrying and used for further analysis.
Isolation of EPSs
After fermentation, the sample was immediately autoclaved for 20 min to reduce the ropycondition of the culture and centrifuged (12,000×g for 20 min) to remove the remaining SPPand biomass. The supernatant was filtered through a 0.45-μm membrane filter, mixed withtwo volumes of methanol, stirred vigorously and kept overnight at 4 °C. The precipitate fromthe methanol dispersion was collected by centrifugation at 12,000×g for 15 min, re-dissolvedin distilled water and lyophilised to yield the crude EPSs.
Deproteinisation of EPSs
The crude EPSs were re-dissolved in distilled water and stirred vigorously at 80 °C for 30 min,mixed with four volumes of anhydrous ethanol, stirred vigorously and kept overnight at 4 °C.The precipitate from the ethanol dispersion was collected by centrifugation at 12,000×g for15min, re-dissolved in distilled water and deproteinised with one fifth volume of Sevag reagent(CHCl3–BuOH, 5:1, v/v) seven times [23]. The deproteinised solution was then dialysed againstdistilled water, concentrated and lyophilised to yield deproteinised EPSs.
Critical Micelle Concentration
The critical micelle concentration is defined as the minimal surfactant concentration needed toform micelles [24]. The critical micelle concentration was determined by measuring surfacetension. The test sample was divided into various concentrations: 50, 40, 30, 20, 10, 5, 4, 3, 2, 1,0.5, 0.1, 0.05 and 0 g/L. Surface tension was measured and graphed against the biosurfactantconcentration to observe the changes in surface tension due to surfactant addition.
936 Appl Biochem Biotechnol (2014) 172:933–950
Emulsification Index
The purified biosurfactant was obtained and 2 mL of the test sample (with variousbiosurfactant concentrations) was combined with 3 mL of machine oil in a test tube (16×150 mm). The mixture was oscillated by vortex for 2 min and left at room temperature for24 h. The ratio of the height of the emulsion layer to the total solution was measured andmultiplied by 100 to obtain the emulsification index of the tested sample [3]. The emulsi-fication capacities of oils are indicated by the emulsification index, E24.
Emulsification index; E24 %ð Þ ¼ The height of the total solution
The height of the emulsion layer� 100
Characterisation of TKU029 Biosurfactant
Thermal Stability
The purified biosurfactant at a concentration of 1 mg/mL was subjected to autoclaving at121 °C for 20 min. Prior to and after autoclaving, surface tension and capacity foremulsification were measured. These measurements were made to investigate the influenceof high-pressure sterilisation on the biosurfactant properties.
Saline Stability
To investigate the salt tolerance of the biosurfactant, the biosurfactant solution (1 mg/mL) wasdivided into samples and NaCl solution was added to 0, 1, 2, 3, 4 and 5 %. After mixing, eachconcentration was left standing for 1 h before surface tension was measured by measuring thecontact angle. The capacity for emulsification was measured by oil oscillation.
pH Stability
To study pH stability, the pH of a TKU029 biosurfactant solution (1 mg/mL) was adjusted todifferent pH values (3, 4, 5, 6, 7, 8, 9, 10 and 11) with 1 N NaOH or 1 N HCl. After 1 h, thesurface tension was measured. Capacity for emulsification was measured by oil oscillation.
Antimicrobial Analysis of the Biosurfactant
In Vitro Antibacterial Activity Tests
The antibacterial activity of the biosurfactant was assayed as follows: the test samples weredissolved in sterilised water and added to 10 mL of nutrition broth (NB; Difco Laboratories,Detroit, MI) to give a final concentration of 0–5 mg/mL. To the above solutions, 0.05 mL(105 CFU/mL) of each tested strain (Escherichia coli BCRC13086 and Staphylococcus aureusBCRC10780) was added and then incubated at 30 °C for 24 h with shaking at 150 rpm. Afterincubation, the number of viable cells was estimated by measuring the optical density at 660 nm.
In Vitro Antifungal Activity Tests
Petri plates were filled with 5 mL of molten PDA pre-cooled to 45 °C and dividedinto two groups (triplicate for each). To each plate in the experimental group (E),
Appl Biochem Biotechnol (2014) 172:933–950 937
biosurfactant (5 mL) was added to give a final concentration of 0–10 mg/mL. To thecontrol plates (C), an equal volume of sterile water instead of the test solution wasadded. After the plates had been cooled, fungal spores (20 μL) were placed onto theagar surface. Both groups were incubated for 72 h at 25 °C. The diameters of thelargest and smallest fungal colonies were recorded and their averages were calculated.The inhibition ratios were calculated with the formula
Inhibition ratio %ð Þ ¼ C − Eð Þ=C � 100
where C is the average diameter of the largest and smallest colonies of the controlgroup and E is the average diameter of the largest and smallest colonies of theexperimental group. Generally, if the inhibitory ratio was >20 %, the tested strains(Fusarium oxysporum BCRC32121 and Aspergillus fumigatus BCRC30099) would beconsidered as inhibited.
Assessment of Skin Hydration with EPSs
Skin hydration was investigated using a Corneometer® CM 825 (Courage and Khazaka,Germany) that was mounted on a Multi Probe Adapter® MPA 5 (Courage and Khazaka).Analysis of the moisture retention capacity of the skin is a simple procedure based on thedielectric constant of the water; it is measured in the superficial layers of the stratumcorneum as deep as 10–20 μm to ensure that the measurement is not influenced by capillaryblood vessels. Capacitance changes depending almost solely upon the water content in thestratum corneum are detected and evaluated. The mean value of five single measurements atfive different locations within the test and control areas was calculated. The obtained datawere statistically analysed using the Wilcoxon test (p=0.05).
The products studied were propylene glycol/butylene glycol/water (1.5:1.5:1, v/v), 5 %(w/v) purified TKU029 EPSs dissolved in propylene glycol/butylene glycol/water (1.5:1.5:1,v/v) and hyaluronic acid. Fifteen female volunteers of Asian descent (21±1 years) withhealthy skin in the test and control areas participated in this study. Products were applied to2-cm2 test sites located on the volar forearm, with 0.1 mL for each application. An adjacentuntreated skin area served as a control. Skin hydration was evaluated every 30 min for180 min. Before the measurements, the volunteers were acclimated for 30 min in anenvironment-controlled room at 20±1 °C and 40–50 % relative humidity.
Results and Discussion
Identification of Strain TKU029
To characterise strain TKU029, 16S rDNA sequencing and phylogenetic analyses wereutilised. According to the analysis of the 16S rDNA gene sequence, TKU029 was mostclosely aligned to Paenibacillus spp. To further characterise strain TKU029, standardmorphological, physiological and biochemical plate analysis showed that strain TKU029was a Gram-positive and endospore-forming bacillus that grows in both aerobic andanaerobic environments. According to the API 50 CHB identification, TKU029 was mostclosely related to P. macerans, with 99.9 % similarity. The phylogenetic identification andAPI 50 CHB analysis indicated that strain TKU029 belongs to the species P. macerans.
938 Appl Biochem Biotechnol (2014) 172:933–950
Culture Conditions for Biosurfactant and EPS Production
In our preliminary experiments, SPP and SHP were each used as the solecarbon/nitrogen source to investigate the production of biosurfactant and EPSs fromP. macerans TKU029. The surface tensions of the media after culturing at 37 °C for3 days were 39.51 and 45.89 mN/m for media containing 1 % (w/v) SPP and 1 %(w/v) SHP, respectively. The total sugar contents of the media after culturing at 37 °Cfor 3 days were 952 and 535 μg/mL for media containing 1 % (w/v) SPP and 1 %(w/v) SHP, respectively. These results indicated that SPP was a better substrate for theproduction of biosurfactant and EPSs by strain TKU029. The effects of variousfactors, such as concentrations of the carbon source, medium aeration, culture tem-perature and culture pH, were consecutively evaluated, in single-factor experiments, toestablish the best conditions for the production of biosurfactant and EPSs from P.macerans TKU029.
Effect of SPP Concentration
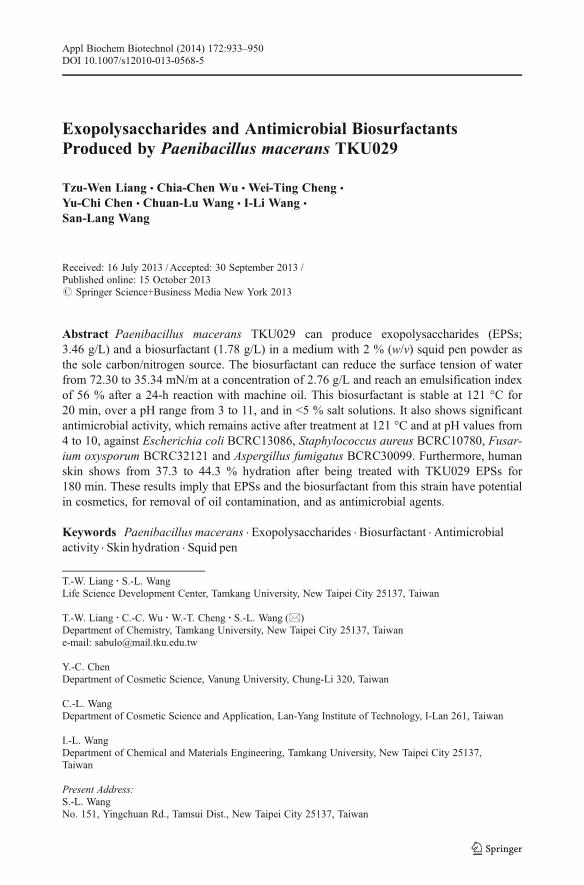
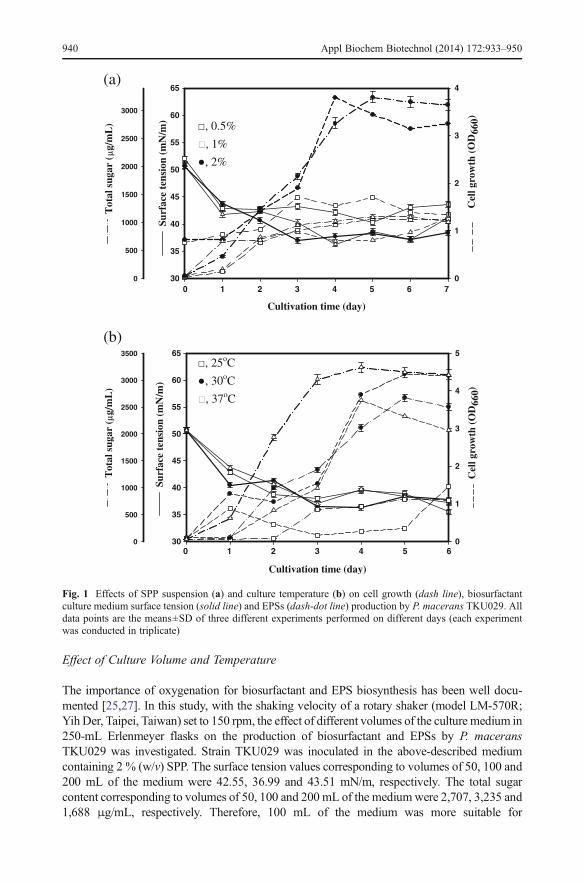
Studies of biosurfactants and EPSs have indicated that the medium composition playsa critical role in biosurfactant and EPS production [25–27]. To select the optimal SPPconcentration for biosurfactant and EPS production, 0.5–2 % (w/v) SPP was added tothe basal medium. Bacteria were cultured with medium containing 0.5–2 % (w/v) SPPat 37 °C for 7 days. As shown in Fig. 1a, the surface tension of the mediumcontaining 1 % (w/v) SPP was 36.35 mN/m at day 4; the surface tension of themedium containing 2 % (w/v) SPP was 36.99 mN/m at day 3. The surface tension ofthe medium containing 1 % (w/v) SPP at day 4 was only slightly lower than that of2 % (w/v) SPP at day 3 (Fig. 1a). The medium containing 2 % (w/v) SPP at day 3exhibited a low surface tension (36.99 mN/m), and the surface tension was consis-tently more stable than that of the medium containing 1 % (w/v) SPP (Fig. 1a).Because SPP is a very cheap biomaterial and longer culture times consume moreenergy, 2 % (w/v) SPP was most suitable for the production of biosurfactant from P.macerans TKU029. Moreover, increased SPP concentration in the medium led toincreased total sugar content. The highest amount of total sugar (3,235 μg/mL) wasobtained at 2 % (w/v) SPP (Fig. 1a). The bacteria grew rapidly during the first 4 days,and we also found that biosurfactant and total sugar production was closely related tocell growth (Fig. 1a). The surface tension of the culture medium reached its maximumlevel (on the third day) after cell growth had reached the exponential phase. The totalsugar yield reached its maximum level (on the fifth day) after cell growth had reachedthe stationary phase. Interestingly, strain TKU029 secreted a biosurfactant during theexponential phase, and the total sugar markedly increased afterwards (Fig. 1a). Theseresults indicate that the production of biosurfactant and EPSs is cell growth-dependentand that P. macerans TKU029 is a promising source of biosurfactant and EPSs. Afterfermentation, the relative weight of the recovered SPP decreased with increasedcultivation time (data not shown). The relative weight of the recovered squid penwas 62 % on the third day. The relative weight of the recovered squid pen decreasedto 3 % on the fifth day. The percentage of the relative weight of the recovered squidpen reached its minimum value (0.2 %) on the seventh day. During the 7 days ofcultivation, the SPP concentration decreased gradually in the medium, indicating thatmost of the SPP in the medium had been utilised for biosurfactant and EPSproduction.
Appl Biochem Biotechnol (2014) 172:933–950 939
Effect of Culture Volume and Temperature
The importance of oxygenation for biosurfactant and EPS biosynthesis has been well docu-mented [25,27]. In this study, with the shaking velocity of a rotary shaker (model LM-570R;YihDer, Taipei, Taiwan) set to 150 rpm, the effect of different volumes of the culture medium in250-mL Erlenmeyer flasks on the production of biosurfactant and EPSs by P. maceransTKU029 was investigated. Strain TKU029 was inoculated in the above-described mediumcontaining 2 % (w/v) SPP. The surface tension values corresponding to volumes of 50, 100 and200 mL of the medium were 42.55, 36.99 and 43.51 mN/m, respectively. The total sugarcontent corresponding to volumes of 50, 100 and 200 mL of the mediumwere 2,707, 3,235 and1,688 μg/mL, respectively. Therefore, 100 mL of the medium was more suitable for
Cultivation time (day)
Surf
ace
tens
ion
(mN
/m)
30
35
40
45
50
55
60
65
Cel
l gro
wth
(O
D66
0)
0
1
2
3
4
Tot
al s
ugar
(g/
mL
)
0
500
1000
1500
2000
2500
3000
Cultivation time (day)
Surf
ace
tens
ion
(mN
/m)
30
35
40
45
50
55
60
65
Cel
l gro
wth
(O
D66
0)
0
1
2
3
4
5
Tot
al s
ugar
(g/
mL
)
0
500
1000
1500
2000
2500
3000
3500
, 0.5%
, 1%
, 2%
, 25oC
, 30oC
, 37oC
(a)
(b)
0 1 2 3 4 5 6 7
0 1 2 3 4 5 6
Fig. 1 Effects of SPP suspension (a) and culture temperature (b) on cell growth (dash line), biosurfactantculture medium surface tension (solid line) and EPSs (dash-dot line) production by P. macerans TKU029. Alldata points are the means±SD of three different experiments performed on different days (each experimentwas conducted in triplicate)
940 Appl Biochem Biotechnol (2014) 172:933–950
biosurfactant and EPS production than 50 or 200 mL. These results indicated that P. maceransTKU029 is a microaerophile that requires oxygen to survive, but requires environmentscontaining lower levels of oxygen than are present in the atmosphere (~20 %). Under anaerobicconditions, P. macerans TKU029 cannot produce biosurfactant (data not shown).
Incubation temperature is another critical factor for biosurfactant and EPS biosynthesis[25,27]. Bacteria were cultured in conical flasks under the conditions described above (2 %(w/v) SPP, 100 mL, 150 rpm) for 6 days at various temperatures (25, 30 and 37 °C). Asshown in Fig. 1b, the third day of culture at 30 °C resulted in the optimal and most stablesurface tension value (36.43 mN/m). However, the optimal temperature for EPS productionwas 37 °C, at which total sugar reached 3,235 μg/mL (Fig. 1b).
Effect of Initial pH
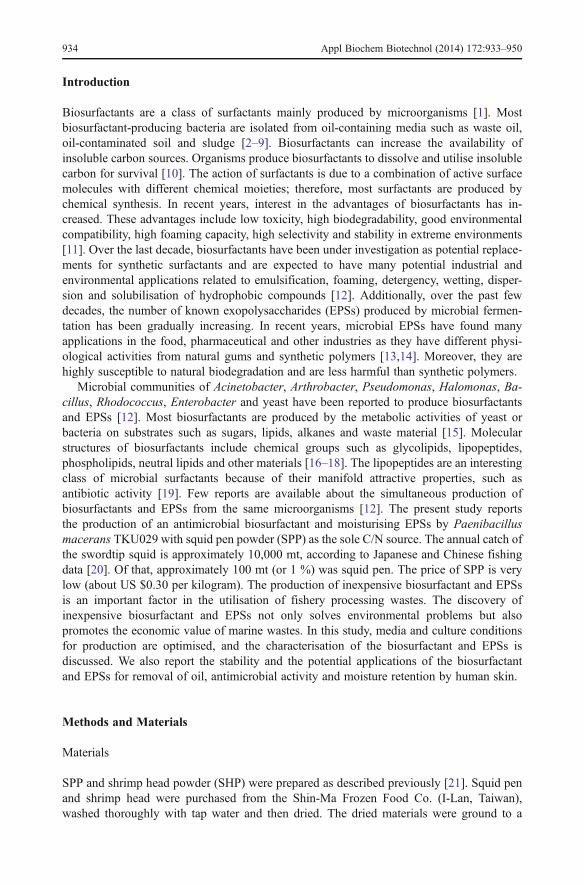
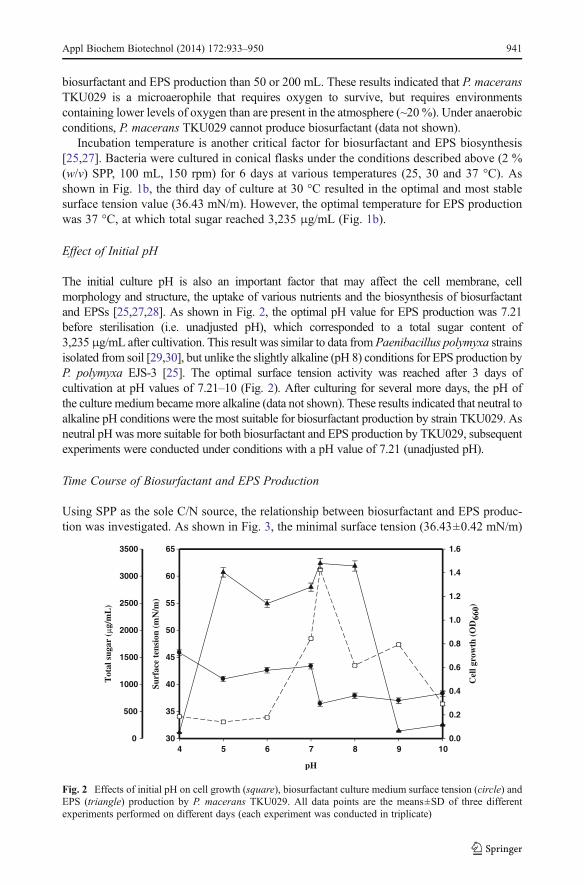
The initial culture pH is also an important factor that may affect the cell membrane, cellmorphology and structure, the uptake of various nutrients and the biosynthesis of biosurfactantand EPSs [25,27,28]. As shown in Fig. 2, the optimal pH value for EPS production was 7.21before sterilisation (i.e. unadjusted pH), which corresponded to a total sugar content of3,235μg/mL after cultivation. This result was similar to data from Paenibacillus polymyxa strainsisolated from soil [29,30], but unlike the slightly alkaline (pH 8) conditions for EPS production byP. polymyxa EJS-3 [25]. The optimal surface tension activity was reached after 3 days ofcultivation at pH values of 7.21–10 (Fig. 2). After culturing for several more days, the pH ofthe culture medium becamemore alkaline (data not shown). These results indicated that neutral toalkaline pH conditions were the most suitable for biosurfactant production by strain TKU029. Asneutral pH was more suitable for both biosurfactant and EPS production by TKU029, subsequentexperiments were conducted under conditions with a pH value of 7.21 (unadjusted pH).
Time Course of Biosurfactant and EPS Production
Using SPP as the sole C/N source, the relationship between biosurfactant and EPS produc-tion was investigated. As shown in Fig. 3, the minimal surface tension (36.43±0.42 mN/m)
pH
4 5 6 7 8 9 10
Surf
ace
tens
ion
(mN
/m)
30
35
40
45
50
55
60
65
Cel
l gro
wth
(O
D66
0)
0.0
0.2
0.4
0.6
0.8
1.0
1.2
1.4
1.6
Tot
al s
ugar
(g/
mL
)
0
500
1000
1500
2000
2500
3000
3500
Fig. 2 Effects of initial pH on cell growth (square), biosurfactant culture medium surface tension (circle) andEPS (triangle) production by P. macerans TKU029. All data points are the means±SD of three differentexperiments performed on different days (each experiment was conducted in triplicate)
Appl Biochem Biotechnol (2014) 172:933–950 941
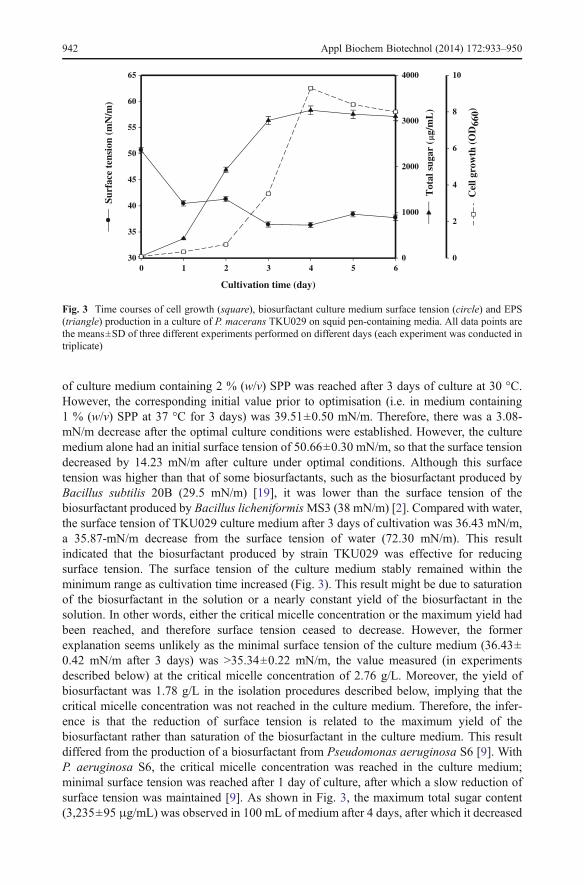
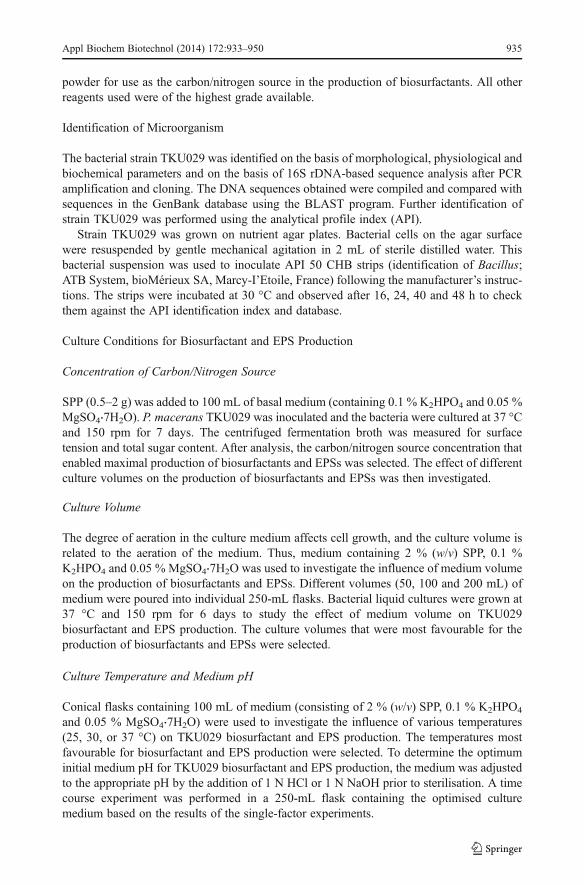
of culture medium containing 2 % (w/v) SPP was reached after 3 days of culture at 30 °C.However, the corresponding initial value prior to optimisation (i.e. in medium containing1 % (w/v) SPP at 37 °C for 3 days) was 39.51±0.50 mN/m. Therefore, there was a 3.08-mN/m decrease after the optimal culture conditions were established. However, the culturemedium alone had an initial surface tension of 50.66±0.30 mN/m, so that the surface tensiondecreased by 14.23 mN/m after culture under optimal conditions. Although this surfacetension was higher than that of some biosurfactants, such as the biosurfactant produced byBacillus subtilis 20B (29.5 mN/m) [19], it was lower than the surface tension of thebiosurfactant produced by Bacillus licheniformisMS3 (38 mN/m) [2]. Compared with water,the surface tension of TKU029 culture medium after 3 days of cultivation was 36.43 mN/m,a 35.87-mN/m decrease from the surface tension of water (72.30 mN/m). This resultindicated that the biosurfactant produced by strain TKU029 was effective for reducingsurface tension. The surface tension of the culture medium stably remained within theminimum range as cultivation time increased (Fig. 3). This result might be due to saturationof the biosurfactant in the solution or a nearly constant yield of the biosurfactant in thesolution. In other words, either the critical micelle concentration or the maximum yield hadbeen reached, and therefore surface tension ceased to decrease. However, the formerexplanation seems unlikely as the minimal surface tension of the culture medium (36.43±0.42 mN/m after 3 days) was >35.34±0.22 mN/m, the value measured (in experimentsdescribed below) at the critical micelle concentration of 2.76 g/L. Moreover, the yield ofbiosurfactant was 1.78 g/L in the isolation procedures described below, implying that thecritical micelle concentration was not reached in the culture medium. Therefore, the infer-ence is that the reduction of surface tension is related to the maximum yield of thebiosurfactant rather than saturation of the biosurfactant in the culture medium. This resultdiffered from the production of a biosurfactant from Pseudomonas aeruginosa S6 [9]. WithP. aeruginosa S6, the critical micelle concentration was reached in the culture medium;minimal surface tension was reached after 1 day of culture, after which a slow reduction ofsurface tension was maintained [9]. As shown in Fig. 3, the maximum total sugar content(3,235±95 μg/mL) was observed in 100 mL of medium after 4 days, after which it decreased
Cultivation time (day)
0 1 2 3 4 5 6
Surf
ace
tens
ion
(mN
/m)
30
35
40
45
50
55
60
65
Tot
al s
ugar
(g/
mL
)
0
1000
2000
3000
4000
Cel
l gro
wth
(O
D66
0)
0
2
4
6
8
10
Fig. 3 Time courses of cell growth (square), biosurfactant culture medium surface tension (circle) and EPS(triangle) production in a culture of P. macerans TKU029 on squid pen-containing media. All data points arethe means±SD of three different experiments performed on different days (each experiment was conducted intriplicate)
942 Appl Biochem Biotechnol (2014) 172:933–950
gradually. The bacterium grew rapidly during the first 4 days of culture, and we alsofound that total sugar content was closely related to cell growth. The EPS yield(3.46 g/L) reached its maximum level after 4 days and after cell growth reached thestationary phase (Fig. 3). This result indicates that the production of EPSs is cellgrowth-dependent and that P. macerans TKU029 is a promising EPS producer.Among Paenibacillus spp., P. polymyxa EJS-3 produced EPSs when growing on16 % sucrose and 1 % yeast extract as the carbon and nitrogen source [25].Compared to P. polymyxa EJS-3, EPS production by P. macerans TKU029 used acheaper medium. Moreover, in most previous reports, the effect of sugars on theproduction of biosurfactant was investigated, and it was found that the biosurfactantwas quickly produced by adding glucose to the medium [5,7–9,19,31]. However, inthis study, P. macerans TKU029 adjusted to the culture conditions and could use fishwaste SPP as a C/N source to produce biosurfactants and EPSs.
Monosaccharide Composition of EPSs
To determine the monosaccharide composition and estimate the glycosidic bond character-istics of the purified EPSs, the purified EPSs were hydrolysed with 0.5 U/mL cellulase,pectinase or α-amylase at 45 °C for 24 h. The hydrolysates obtained were separated withTLC. No hydrolysis was observed for EPSs treated with pectinase and α-amylase, whereasEPSs treated with cellulase showed two bands on the TLC plates (data not shown). Thedifference in hydrolysis of the EPSs by cellulase and α-amylase implies that the glycosidicbond is most likely a β-1,4 glycosidic bond rather than an α-1,4 glycosidic bond.
Isolation of Biosurfactant
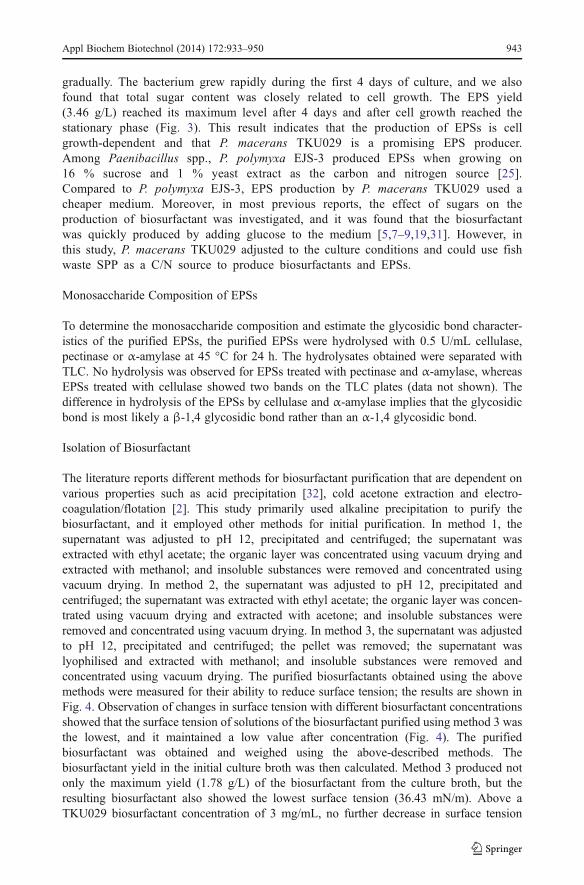
The literature reports different methods for biosurfactant purification that are dependent onvarious properties such as acid precipitation [32], cold acetone extraction and electro-coagulation/flotation [2]. This study primarily used alkaline precipitation to purify thebiosurfactant, and it employed other methods for initial purification. In method 1, thesupernatant was adjusted to pH 12, precipitated and centrifuged; the supernatant wasextracted with ethyl acetate; the organic layer was concentrated using vacuum drying andextracted with methanol; and insoluble substances were removed and concentrated usingvacuum drying. In method 2, the supernatant was adjusted to pH 12, precipitated andcentrifuged; the supernatant was extracted with ethyl acetate; the organic layer was concen-trated using vacuum drying and extracted with acetone; and insoluble substances wereremoved and concentrated using vacuum drying. In method 3, the supernatant was adjustedto pH 12, precipitated and centrifuged; the pellet was removed; the supernatant waslyophilised and extracted with methanol; and insoluble substances were removed andconcentrated using vacuum drying. The purified biosurfactants obtained using the abovemethods were measured for their ability to reduce surface tension; the results are shown inFig. 4. Observation of changes in surface tension with different biosurfactant concentrationsshowed that the surface tension of solutions of the biosurfactant purified using method 3 wasthe lowest, and it maintained a low value after concentration (Fig. 4). The purifiedbiosurfactant was obtained and weighed using the above-described methods. Thebiosurfactant yield in the initial culture broth was then calculated. Method 3 produced notonly the maximum yield (1.78 g/L) of the biosurfactant from the culture broth, but theresulting biosurfactant also showed the lowest surface tension (36.43 mN/m). Above aTKU029 biosurfactant concentration of 3 mg/mL, no further decrease in surface tension
Appl Biochem Biotechnol (2014) 172:933–950 943
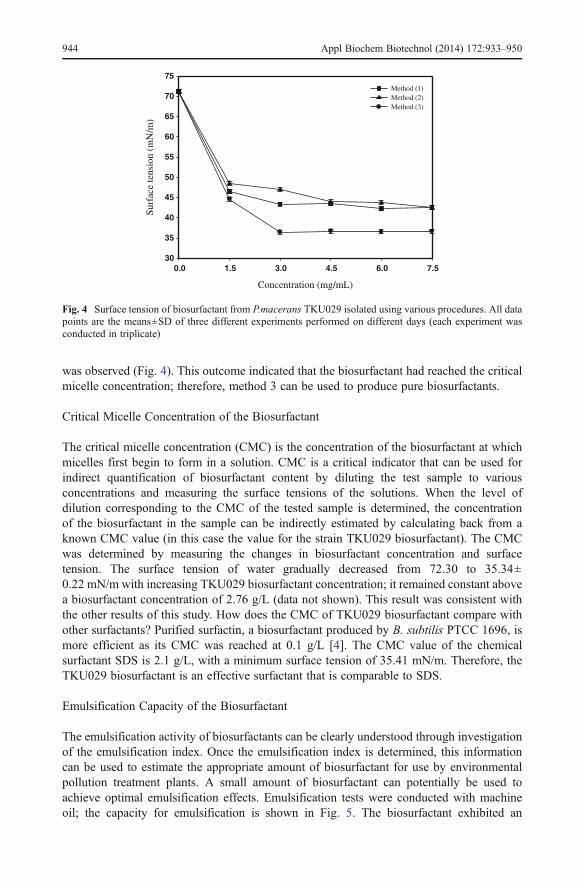
was observed (Fig. 4). This outcome indicated that the biosurfactant had reached the criticalmicelle concentration; therefore, method 3 can be used to produce pure biosurfactants.
Critical Micelle Concentration of the Biosurfactant
The critical micelle concentration (CMC) is the concentration of the biosurfactant at whichmicelles first begin to form in a solution. CMC is a critical indicator that can be used forindirect quantification of biosurfactant content by diluting the test sample to variousconcentrations and measuring the surface tensions of the solutions. When the level ofdilution corresponding to the CMC of the tested sample is determined, the concentrationof the biosurfactant in the sample can be indirectly estimated by calculating back from aknown CMC value (in this case the value for the strain TKU029 biosurfactant). The CMCwas determined by measuring the changes in biosurfactant concentration and surfacetension. The surface tension of water gradually decreased from 72.30 to 35.34±0.22 mN/m with increasing TKU029 biosurfactant concentration; it remained constant abovea biosurfactant concentration of 2.76 g/L (data not shown). This result was consistent withthe other results of this study. How does the CMC of TKU029 biosurfactant compare withother surfactants? Purified surfactin, a biosurfactant produced by B. subtilis PTCC 1696, ismore efficient as its CMC was reached at 0.1 g/L [4]. The CMC value of the chemicalsurfactant SDS is 2.1 g/L, with a minimum surface tension of 35.41 mN/m. Therefore, theTKU029 biosurfactant is an effective surfactant that is comparable to SDS.
Emulsification Capacity of the Biosurfactant
The emulsification activity of biosurfactants can be clearly understood through investigationof the emulsification index. Once the emulsification index is determined, this informationcan be used to estimate the appropriate amount of biosurfactant for use by environmentalpollution treatment plants. A small amount of biosurfactant can potentially be used toachieve optimal emulsification effects. Emulsification tests were conducted with machineoil; the capacity for emulsification is shown in Fig. 5. The biosurfactant exhibited an
Concentration (mg/mL)
0.0 1.5 3.0 4.5 6.0 7.5
Surf
ace
tens
ion
(mN
/m)
30
35
40
45
50
55
60
65
70
75Method (1)Method (2)Method (3)
Fig. 4 Surface tension of biosurfactant from P.macerans TKU029 isolated using various procedures. All datapoints are the means±SD of three different experiments performed on different days (each experiment wasconducted in triplicate)
944 Appl Biochem Biotechnol (2014) 172:933–950
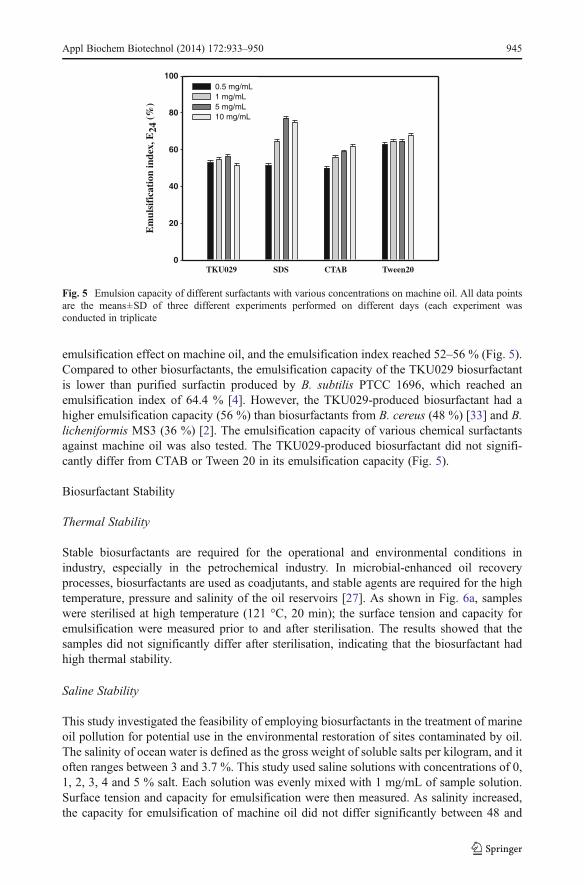
emulsification effect on machine oil, and the emulsification index reached 52–56 % (Fig. 5).Compared to other biosurfactants, the emulsification capacity of the TKU029 biosurfactantis lower than purified surfactin produced by B. subtilis PTCC 1696, which reached anemulsification index of 64.4 % [4]. However, the TKU029-produced biosurfactant had ahigher emulsification capacity (56 %) than biosurfactants from B. cereus (48 %) [33] and B.licheniformis MS3 (36 %) [2]. The emulsification capacity of various chemical surfactantsagainst machine oil was also tested. The TKU029-produced biosurfactant did not signifi-cantly differ from CTAB or Tween 20 in its emulsification capacity (Fig. 5).
Biosurfactant Stability
Thermal Stability
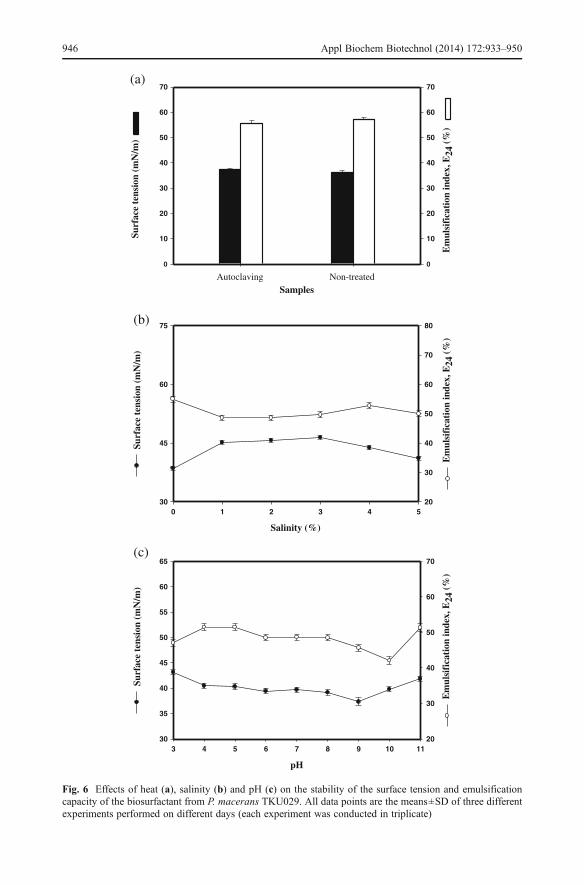
Stable biosurfactants are required for the operational and environmental conditions inindustry, especially in the petrochemical industry. In microbial-enhanced oil recoveryprocesses, biosurfactants are used as coadjutants, and stable agents are required for the hightemperature, pressure and salinity of the oil reservoirs [27]. As shown in Fig. 6a, sampleswere sterilised at high temperature (121 °C, 20 min); the surface tension and capacity foremulsification were measured prior to and after sterilisation. The results showed that thesamples did not significantly differ after sterilisation, indicating that the biosurfactant hadhigh thermal stability.
Saline Stability
This study investigated the feasibility of employing biosurfactants in the treatment of marineoil pollution for potential use in the environmental restoration of sites contaminated by oil.The salinity of ocean water is defined as the gross weight of soluble salts per kilogram, and itoften ranges between 3 and 3.7 %. This study used saline solutions with concentrations of 0,1, 2, 3, 4 and 5 % salt. Each solution was evenly mixed with 1 mg/mL of sample solution.Surface tension and capacity for emulsification were then measured. As salinity increased,the capacity for emulsification of machine oil did not differ significantly between 48 and
Em
ulsi
fica
tion
inde
x, E
24 (
%)
0
20
40
60
80
1000.5 mg/mL1 mg/mL5 mg/mL10 mg/mL
TKU029 SDS CTAB Tween20
Fig. 5 Emulsion capacity of different surfactants with various concentrations on machine oil. All data pointsare the means±SD of three different experiments performed on different days (each experiment wasconducted in triplicate
Appl Biochem Biotechnol (2014) 172:933–950 945
Samples
Surf
ace
tens
ion
(mN
/m)
0
10
20
30
40
50
60
70
Em
ulsi
fica
tion
inde
x, E
24 (
%)
0
10
20
30
40
50
60
70
Salinity (%)
0 1 2 3 4 5
Surf
ace
tens
ion
(mN
/m)
30
45
60
75
Em
ulsi
fica
tion
inde
x, E
24 (
%)
20
30
40
50
60
70
80
(c)
(b)
Autoclaving
(a)
Non-treated
pH
3 4 5 6 7 8 9 10 11
Surf
ace
tens
ion
(mN
/m)
30
35
40
45
50
55
60
65
Em
ulsi
fica
tion
inde
x, E
24 (
%)
20
30
40
50
60
70
Fig. 6 Effects of heat (a), salinity (b) and pH (c) on the stability of the surface tension and emulsificationcapacity of the biosurfactant from P. macerans TKU029. All data points are the means±SD of three differentexperiments performed on different days (each experiment was conducted in triplicate)
946 Appl Biochem Biotechnol (2014) 172:933–950
55 %, and the surface tension increased from 38.60 to 46.45 mN/m (Fig. 6b). The reason forthese results is presumably the structure of the biosurfactant molecule interacting withphysicochemical factors such as salinity to affect micelle formation and shape, thereforeaffecting the solubility of the biosurfactant and decreasing its activity. The saline stability ofthe TKU029 biosurfactant is comparable to various types of synthetic surfactants in thatthere are no differences among the SDS, CTAB, Tween20 and TKU029 biosurfactants (datanot shown).
pH Stability
Studies on the surface tension and emulsification capacity of the TKU029 biosurfactantshowed that it was stable over a wide pH range. An increase in the surface tension wasobserved at pH extremes of 3 and 11, suggesting some alteration in the surfactant structure atthese pH values. The emulsification capacity of the TKU029 biosurfactant for machine oilwas not significantly different at different pH values (Fig. 6c). These results showed that theTKU029 biosurfactant is stable in this pH range for related applications in the future.
Antimicrobial Effects of the TKU029 Biosurfactant
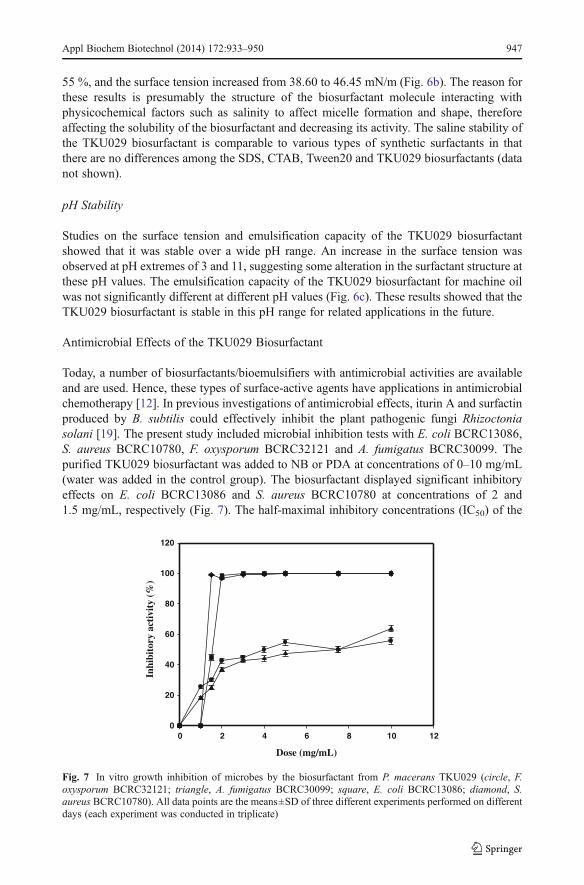
Today, a number of biosurfactants/bioemulsifiers with antimicrobial activities are availableand are used. Hence, these types of surface-active agents have applications in antimicrobialchemotherapy [12]. In previous investigations of antimicrobial effects, iturin A and surfactinproduced by B. subtilis could effectively inhibit the plant pathogenic fungi Rhizoctoniasolani [19]. The present study included microbial inhibition tests with E. coli BCRC13086,S. aureus BCRC10780, F. oxysporum BCRC32121 and A. fumigatus BCRC30099. Thepurified TKU029 biosurfactant was added to NB or PDA at concentrations of 0–10 mg/mL(water was added in the control group). The biosurfactant displayed significant inhibitoryeffects on E. coli BCRC13086 and S. aureus BCRC10780 at concentrations of 2 and1.5 mg/mL, respectively (Fig. 7). The half-maximal inhibitory concentrations (IC50) of the
Dose (mg/mL)
0 2 4 6 8 10 12
Inhi
bito
ry a
ctiv
ity
(%)
0
20
40
60
80
100
120
Fig. 7 In vitro growth inhibition of microbes by the biosurfactant from P. macerans TKU029 (circle, F.oxysporum BCRC32121; triangle, A. fumigatus BCRC30099; square, E. coli BCRC13086; diamond, S.aureus BCRC10780). All data points are the means±SD of three different experiments performed on differentdays (each experiment was conducted in triplicate)
Appl Biochem Biotechnol (2014) 172:933–950 947
biosurfactant against F. oxysporum BCRC32121 and A. fumigatus BCRC30099 were 4 and7.5 mg/mL, respectively (Fig. 7). Additionally, the antimicrobial activity of the biosurfactantwas also unaffected after high-temperature treatment (121 °C) and in different pH (pH 4–10)conditions. Thus, such biosurfactants can serve as potential new drugs in antimicrobialchemotherapy.
In Vivo Skin Hydration Effect of TKU029 EPSs
Polysaccharides of bacterial origin are very important in the cosmetic and pharmaceuticalindustries [12]. One important criterion for the evaluation of cosmetic products is their effecton skin hydration. The aim of this study was to evaluate whether TKU029 EPSs cansignificantly increase skin hydration after application.
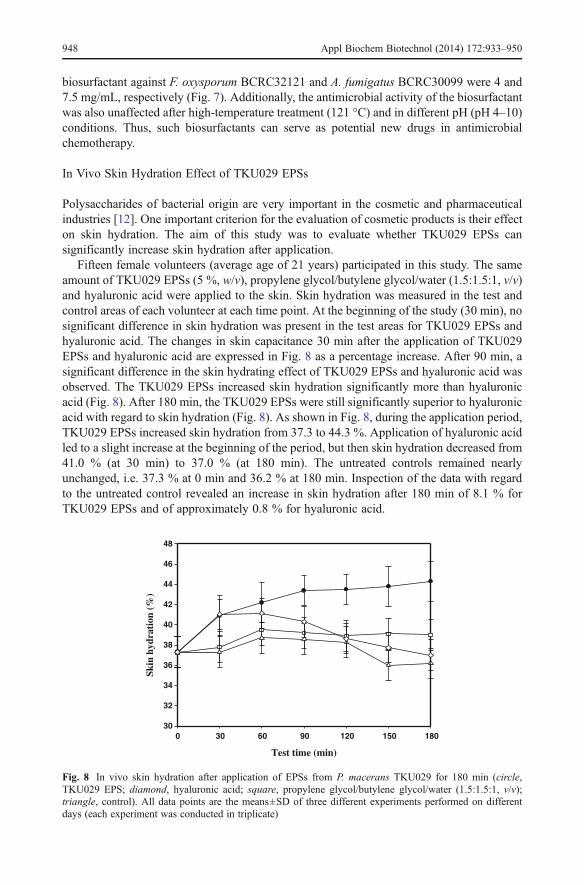
Fifteen female volunteers (average age of 21 years) participated in this study. The sameamount of TKU029 EPSs (5 %, w/v), propylene glycol/butylene glycol/water (1.5:1.5:1, v/v)and hyaluronic acid were applied to the skin. Skin hydration was measured in the test andcontrol areas of each volunteer at each time point. At the beginning of the study (30 min), nosignificant difference in skin hydration was present in the test areas for TKU029 EPSs andhyaluronic acid. The changes in skin capacitance 30 min after the application of TKU029EPSs and hyaluronic acid are expressed in Fig. 8 as a percentage increase. After 90 min, asignificant difference in the skin hydrating effect of TKU029 EPSs and hyaluronic acid wasobserved. The TKU029 EPSs increased skin hydration significantly more than hyaluronicacid (Fig. 8). After 180 min, the TKU029 EPSs were still significantly superior to hyaluronicacid with regard to skin hydration (Fig. 8). As shown in Fig. 8, during the application period,TKU029 EPSs increased skin hydration from 37.3 to 44.3 %. Application of hyaluronic acidled to a slight increase at the beginning of the period, but then skin hydration decreased from41.0 % (at 30 min) to 37.0 % (at 180 min). The untreated controls remained nearlyunchanged, i.e. 37.3 % at 0 min and 36.2 % at 180 min. Inspection of the data with regardto the untreated control revealed an increase in skin hydration after 180 min of 8.1 % forTKU029 EPSs and of approximately 0.8 % for hyaluronic acid.
Test time (min)
0 30 60 90 120 150 180
Skin
hyd
rati
on (
%)
30
32
34
36
38
40
42
44
46
48
Fig. 8 In vivo skin hydration after application of EPSs from P. macerans TKU029 for 180 min (circle,TKU029 EPS; diamond, hyaluronic acid; square, propylene glycol/butylene glycol/water (1.5:1.5:1, v/v);triangle, control). All data points are the means±SD of three different experiments performed on differentdays (each experiment was conducted in triplicate)
948 Appl Biochem Biotechnol (2014) 172:933–950
Conclusion
The EPSs produced by strain TKU029 can increase in vivo skin hydration and may be a newsource of natural moisturisers with potential value in cosmetics. The biosurfactant produced byP. macerans TKU029 can reduce the surface tension of water to 35.34 mN/m, exhibits anemulsification index (E24) of 56 % and is stable at high temperature, over a wide pH range, andat <5 % salinity. Strain TKU029 thus has potential for the removal of oil from contaminatedocean shores for bioremediation. The TKU029 biosurfactant also has inhibitory effects onmicrobial growth and thus can potentially be developed as an antimicrobial agent in the future.
Acknowledgments This work was supported in part by a grant of the National Science Council, Taiwan(NSC 101-2621-M-032-005- and NSC 101-2811-M-032-015-).
References
1. Fiechter, A. (1992). Trends in Biotechnology, 10, 208–217.2. Biria, D., Maghsoudi, E., Roostaazad, R., Dadafarin, H., Sahebghadam Lotfi, A., & Amoozegar, M. A.
(2009). World Journal of Microbiology and Biotechnology, 26, 871–878.3. Cooper, D. G., & Goldenberg, B. G. (1987). Applied and Environmental Microbiology, 53, 224–229.4. Ghojavand, H., Vahabzadeh, F., Roayaei, E., & Shahraki, A. K. (2008). Journal of Colloid and Interface
Science, 324, 172–176.5. Haddad, N. I., Liu, X., Yang, S., & Mu, B. (2008). Protein and Peptide Letters, 15, 265–269.6. Haddad, N. I., Wang, J., & Mu, B. (2008). Journal of Industrial Microbiology & Biotechnology, 35,
1597–1604.7. Kim, H. S., Yoon, B. D., Lee, C. H., Suh, H. H., Oh, H. M., Katsuragi, T., & Tani, Y. (1997). Journal of
Fermentation and Bioengineering, 84, 41–46.8. Pansiripat, S., Pornsunthorntawee, O., Rujiravanit, R., Kitiyanan, B., Somboonthanate, P., & Chavadej, S.
(2010). Biochemical Engineering Journal, 49, 185–191.9. Yin, H., Qiang, J., Jia, Y., Ye, J., Peng, H., Qin, H., Zhang, N., & He, B. (2009). Process Biochemistry, 44,
302–308.10. Gutierrez, J. R., & Erickson, L. E. (1977). Biotechnology and Bioengineering, 19, 1331–1349.11. Desai, J. D., & Banat, I. M. (1997). Microbiology and Molecular Biology Reviews, 61, 47–64.12. Satpute, S. K., Banat, I. M., Dhakephalkar, P. K., Banpurkar, A. G., & Chopade, B. A. (2010).
Biotechnology Advances, 28, 436–450.13. Kumar, A. S., Mody, K., & Jha, B. (2007). Journal of Basic Microbiology, 47, 103–117.14. Freitas, F., Alves, V. D., Pais, J., Costa, N., Oliveira, C., Mafra, L., Hilliou, L., Oliveir, R., & Reis, M. A.
M. (2009). Bioresource Technology, 100, 859–865.15. Lin, S. C. (1996). Journal of Chemical Technology and Biotechnology, 66, 109–120.16. Horowitz, S., Gilbert, J. N., & Griffin, W. M. (1990). Journal of Industrial Microbiology & Biotechnol-
ogy, 6, 243–248.17. Lin, S. C., Minton, M. A., Sharma, M. M., & Georgiou, G. (1994). Applied and Environmental
Microbiology, 60, 31–38.18. Youssef, N. H., Duncan, K. E., Nagle, D. P., Savage, K. N., Knapp, R. M., & Mclnerney, M. J. (2004).
Journal of Microbiological Methods, 56, 339–347.19. Joshi, S., Bharucha, C., & Desai, A. J. (2008). Bioresource Technology, 99, 4603–4608.20. Wang, K. Y., Lee, K. T., & Liao, C. H. (2010). Journal of Marine Science and Technology, 18, 99–105.21. Wang, S. L., Wu, P. C., & Liang, T. W. (2009). Carbohydrate Research, 344, 979–984.22. Dubois, M., Gilles, K. A., Hamilton, J. K., Rebers, P. A., & Smith, F. (1956). Analytical Chemistry, 28,
350–356.23. Staub, A. M. (1965). Methods in Carbohydrate Chemistry, 5, 5–6.24. Becher, P. (1965). Emulsions: theory and practice, 2nd ed. (pp. 267–325). New York: Reinhold.25. Liu, J., Luo, J., Ye, H., Sun, Y., Lu, Z., & Zeng, X. (2009). Carbohydrate Polymers, 78, 275–281.
Appl Biochem Biotechnol (2014) 172:933–950 949
26. Park, N. H., Choi, H. J., & Oh, D. K. (2005). Biotechnology Letters, 27, 495–497.27. Silva, S. N., Farias, C. B., Rufino, R. D., Luna, J. M., & Sarubbo, L. A. (2010). Colloids and Surfaces B:
Biointerfaces, 79, 174–183.28. Kim, H. O., Lim, J. M., Joo, J. H., Kim, S. W., Hwang, H. J., Choi, J. W., & Yun, J. W. (2005).
Bioresource Technology, 96, 1175–1182.29. Han, Y. W., & Clarke, M. A. (1990). Journal of Agricultural and Food Chemistry, 38, 393–396.30. Lee, I. Y., Seo, W. T., Kim, G. J., Kim, M. K., Ahn, S. G., Kwon, G. S., & Park, Y. H. (1997). Bioprocess
Engineering, 16, 71–75.31. Arutchelvi, J., Bhaduri, S., Uppara, P. V., & Doble, M. (2009). Journal of Applied Sciences, 9, 3151–
3155.32. Sobrinho, H. B. S., Rufino, R. D., Luna, J. M., Salgueiro, A. A., Campos-Takaki, G. M., Leite, L. F. C., &
Sarubbo, L. A. (2008). Process Biochemistry, 43, 912–917.33. Velázquez-Aradillas, J. C., Toribio-Jiménez, J., del Carmen Ángeles González-Chávez, M., Bautista, F.,
Cebrián, M. E., Esparza-García, F. J., & Rodríguez-Vázquez, R. (2011). World Journal of Microbiologyand Biotechnology, 27, 907–913.
950 Appl Biochem Biotechnol (2014) 172:933–950