Embed Size (px)
Citation preview
MNRAS 448, 1704–1714 (2015) doi:10.1093/mnras/stv091
ExoMol line lists – VIII. A variationally computed line list for hotformaldehyde
Ahmed F. Al-Refaie,‹ Andrey Yachmenev, Jonathan Tennysonand Sergei N. YurchenkoDepartment of Physics and Astronomy, University College London, Gower Street, WC1E 6BT London, UK
Accepted 2014 December 23. Received 2014 December 20; in original form 2014 December 3
ABSTRACTA computed line list for formaldehyde, H2
12C16O, applicable to temperatures up to T = 1500 Kis presented. An empirical potential energy and ab initio dipole moment surfaces are usedas the input to the nuclear motion program TROVE. The resulting line list, referred to asAYTY, contains 10.3 million rotational-vibrational states and around 10 billion transitionfrequencies. Each transition includes associated Einstein-A coefficients and absolute transitionintensities, for wavenumbers below 10 000 cm−1 and rotational excitations up to J = 70. Room-temperature spectra are compared with laboratory measurements and data currently availablein the HITRAN data base. These spectra show excellent agreement with experimental spectraand highlight the gaps and limitations of the HITRAN data. The full line list is available fromthe CDS data base as well as at www.exomol.com.
Key words: molecular data – opacity – planets and satellites: atmospheres – stars: atmo-spheres – ISM: molecules.
1 IN T RO D U C T I O N
Formaldehyde, H2CO, is a poisonous molecule in the aldehydegroup. On Earth it plays a part in troposphere chemistry dynamicsas the main source of OH via photodissociation and is formedfrom photo-oxidation in the atmosphere or through the incompleteburning of biomass (Wayne 2000). Traces of formaldehyde havetentatively been detected in the Martian atmosphere (Korablev et al.1993) where it is believed to be derived from the oxidation ofmethane (CH4; Villanueva et al. 2013).
Formaldehyde was the first polyatomic molecule to be detectedin the interstellar medium (ISM; Zuckerman et al. 1970) and is ex-tremely abundant (Langer 1976). This has made it useful in investi-gating the isotope composition of carbon in the galaxy (Zuckermanet al. 1974). The proposed mechanism of production is via the suc-cessive hydrogenation of CO (Woon 2002) on icy grain mantles:
H + CO → HCO
H + HCO → H2CO. (1)
Further hydrogenation produces methanol through an intermediatemethyl radical H+H2CO→ CH3O→ H+ CH3O → CH3OH. Com-mon reactions include that with ammonia which produces amines(Schutte 2002) and polymerization with other H2CO molecules.As a result, formaldehyde is believed to be the major precursor forthe formation of complex organic molecules in the ISM that include
� E-mail: [email protected]
interstellar glycolaldehyde (Hollis, Lovas & Jewell 2000) and aminoacids (Schutte 2002).
Formaldehyde’s astrophysical relevance does not end in the ISM.Recently, it has been detected in comets (Bockelee-Morvan & Cro-visier 1992), such as 103P/Hartley 2 (Dello Russo et al. 2011),C/2007 N3 (Villanueva et al. 2011) and Hale-Bopp (Milam et al.2006), where it is thought to originate from the degradation ofpolyoxymethylene (Cottin et al. 2001). It is also present in proto-planetary discs around low-mass young stars (Taurus-Auriga ClassI/II; Zasowski et al. 2009; Oberg et al. 2010; Sargent et al. 2014) ascircumstellar ice with an abundance ratio of ≈2 per cent comparedto the more ubiquitous water ice.
Because of H2CO’s role as a precursor to complex organicmolecules, it is considered a possible biomarker. The RNA world hy-pothesis suggests an early Earth with a CO2-, H2O- and N2-rich at-mosphere (Neveu, Kim & Benner 2013). Illuminating this mix withultraviolet (UV) radiation should lead to a large amount of formalde-hyde being fixed in the atmosphere before being deposited into theprebiotic oceans (Neveu et al. 2013). Alternatively, the source ofprebiotic chemical compounds may be derived without need of illu-minating UV radiation via glancing icy body impacts (Goldman &Tamblyn 2013). Such impacts would produce shock-compressionconditions that lead to the formation of HCN molecules. TheseHCN molecules can be hydrolyzed to form formaldehyde and fromthere produce amino acids. Thus, a planet rich in formaldehyde mayindicate one undergoing the stages of pre-life.
Finally, formaldehyde masers (Forster et al. 1980; Pratap, Snyder& Batrla 1992) are a reliable and proven tracer for high-densityenvironments such as star-forming regions in galaxies due to its
C© 2015 The AuthorsPublished by Oxford University Press on behalf of the Royal Astronomical Society
at University C
ollege London on M
arch 7, 2015http://m
nras.oxfordjournals.org/D
ownloaded from
ExoMol line lists – VIII. H2CO 1705
ubiquity and large number of long-wavelength transitions (Mangumet al. 2008). Currently, there are 19 extragalactic sources (Mangumet al. 2008), of these masers including IRAS 18566+0408, whichis notable for detection of the first H2CO maser flare (Araya et al.2007). Formaldehyde masers (and maser flares) have mostly beenobserved via the 110 → 111 and 211 − 212 K-doublet transitions at6.1 and 2.2 cm, respectively.
The wide range of interactions in atmospheric, terrestrial, as-trophysical and astrobiological phenomena make formaldehyde arelevant molecule in the chemistry of exoplanets and their atmo-spheres. Therefore, a complete, high-resolution, line list for H2COshould provide an important aid for characterization and modellingof formaldehyde. These considerations led us to study formaldehydeas part of the ExoMol project (Tennyson & Yurchenko 2012), whichaims to produce comprehensive molecular line lists for studies ofthe atmospheres of exoplanets and cool stars.
High-resolution, room-temperature formaldehyde spectra havebeen well studied in the laboratory (Johns & McKellar 1975; Brown,Hunt & Pine 1979; Nakanaga, Kondo & Saeki 1982; Nadler, Daunt& Reuter 1987; Cline & Varghese 1988; Reuter et al. 1989; Poulinet al. 1996; Theule et al. 2003); the early work was reviewed byClouthier & Ramsay (1983). Currently, the major source of pub-licly available spectroscopic data on H2CO is the HITRAN database (Rothman et al. 2013) which has recently been updated toinclude long-wavelength data from the CDMS data base (Mulleret al. 2005). The spectral regions covered in the data bases are0–100, 1600–1800 (Perrin et al. 2009) and 2500–3100 cm−1
(Perrin et al. 2009) at up to 10−29 cm per molecule sensitivityfor T = 296 K. However, this accounts for only 40 000 transitionsextending up to J = 64 and covers only four of the six fundamentalvibrational bands as well as the ground-state rotational spectrum.This deficiency arises from an apparent lack of absolute intensi-ties in the 100–1600 cm−1 range. Additional observed transitionsare available (Perrin et al. 2009) and include line positions (Perrin,Keller & Flaud 2003; Tchana, Perrin & Lacome 2007; Zhao et al.2007), and intensities (Perrin, Keller & Flaud 2003; Flaud et al.2006; Perrin, Valentin & Daumont 2006) of some of the funda-mental bands and hot bands (Ito, Nakanaga & Takeo 1994; Perezet al. 2006; Margules et al. 2009). The incompleteness and lowrotational excitations available in HITRAN limit the applicabilityof these data for temperatures above 300 K. The theoretical spectrapresented in this paper aim to provide a more complete and accuratepicture of the spectra of formaldehyde up to 10 000 cm−1 and fortemperatures up to 1500 K. Our line list should therefore be usefulfor modelling higher temperature environments as well as studieson non-local thermodynamic equilibrium transitions such as thoseobserved in masers.
Theoretically, electric dipole transition intensities of H2CO werestudied by Luckhaus et al. (1996) and Carter et al. (2009); see alsothe review by Yurchenko (2014). Luckhaus et al. (1996) used anab initio MP2/6-311G** dipole moment surface (DMS) to simulatethe photoacoustic spectrum of high C-H stretching overtones ofH2CO. Carter et al. (2009) generated an ab initio couple-clusterCCSD(T)/aug-cc-pVTZ DMS for H2CO; they used an effectiverepresentation of charges to compute (relative) ro-vibrational lineintensities for H2CO reproducing the HITRAN data (Rothman et al.2009) with reasonable agreement. Poulin et al. (1996) computed anab initio DMS using the QCISD/6-31111G(d,p) level of theory andpresented it as an expansion.
Despite these works there is no comprehensive line list forformaldehyde available in the literature. The goal of this work is tobridge this gap. We use the variational program TROVE (Yurchenko,
Table 1. Vibrational modes and observed band centres in cm−1 byCarter, Pinnavaia & Handy (1995).
Mode Band centres Symmetry Description
ν1 2782.46 A1 Symmetric C-H stretchingν2 1746.01 A1 C-O stretchingν3 1500.18 A1 Symmetric O-C-H bendingν4 1167.26 B1 Out-of-plane bendingν5 2843.33 B2 Asymmetric C-H stretchingν6 1249.10 B2 Asymmetric O-C-H bending
Thiel & Jensen 2007) in conjunction with an initial potential energysurface (PES) obtained ‘spectroscopically’ by Yachmenev et al.(2011) and a new ab initio DMS for formaldehyde and generate anextensive line list for H2
12C16O applicable for the temperatures upto T = 1500 K. In the following, H2CO and formaldehyde will referto the main isotopologue H2
12C16O.
2 M E T H O D
2.1 Background
H2CO is a prolate asymmetric top molecule that belongs to the C2v
molecular symmetry group (Bunker & Jensen 1998). The grouphas four irreducible representations A1, A2, B1 and B2. Once the Hatom nuclear spin is taken into account, the ‘para’ A representationsare singly degenerate and the ‘ortho’ B representations are triplydegenerate. As H2CO has four atoms, it has six vibrational modes;Table 1 shows the vibrational modes and their corresponding sym-metries, band centres and descriptions. Coriolis interactions occurstrongly between the ν4 and ν6 modes, and weakly between theν3 and ν4 modes (Nakagawa & Morino 1971) which couples theirenergy levels and wavefunctions. This manifests itself in the ν3, ν4
and ν6 mode interaction as overlapping bands which make thesethree bands difficult to distinguish from each other.
2.2 Potential energy surface
Full details of their PES calculation are given by Yachmenev et al.(2011), so only a brief summary is presented here. The initialPES was computed ab initio using the CCSD(T)/aug-cc-pVQZ the-ory. Variational calculations with this surface give a root-mean-square (rms) error of 5.1 cm−1 for the fundamental band cen-tres. Yachmenev et al. (2011) refined the ab initio PES using aV′ = V + �V formulation, where V, �V and V′ are the original abinitio, correction and refined PES, respectively. The eigenfunctionsof the original ab initio Hamiltonian, H = T + V, are used as thebasis functions for the extended Hamiltonian H′ = H + �V, where�V is typically small and almost diagonal correction. �V is ex-panded in Taylor series and expansion coefficients are obtained ina variational least-squares fit to high-resolution spectroscopic datausing TROVE. The rms error against experimental energy levels withJ ≤ 5 of this semi-empirical PES, called H2CO-2011, is 0.04 cm−1.
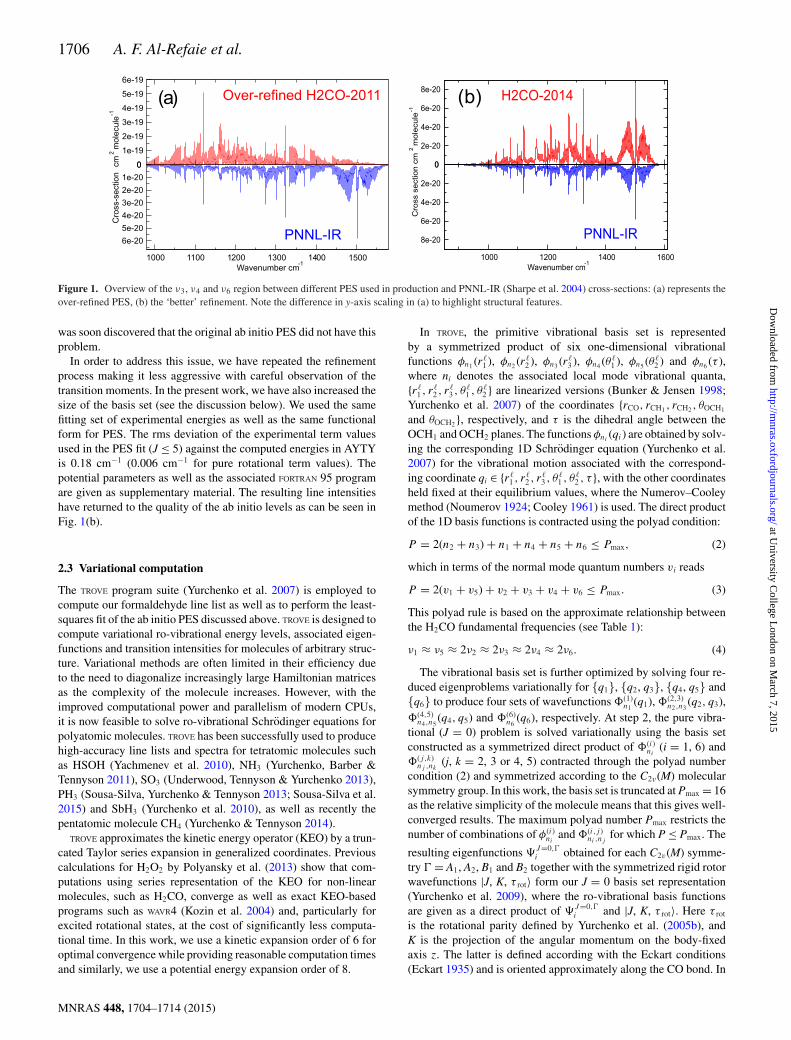
It should be noted however that the excellent accuracy of therefined PES caused serious problems with the absolute intensitiesof some bands. The intensities based on the initial, less accurate abinitio PES, the intensities of the ν3, ν4 and ν6 bands were observedto agree much better with the experiment. Fig. 1(a) highlights thiseffect, where an order-of-magnitude difference in absolute intensityand cross-section was observed. Initially blamed on the DMS, it
MNRAS 448, 1704–1714 (2015)
at University C
ollege London on M
arch 7, 2015http://m
nras.oxfordjournals.org/D
ownloaded from
1706 A. F. Al-Refaie et al.
Figure 1. Overview of the ν3, ν4 and ν6 region between different PES used in production and PNNL-IR (Sharpe et al. 2004) cross-sections: (a) represents theover-refined PES, (b) the ‘better’ refinement. Note the difference in y-axis scaling in (a) to highlight structural features.
was soon discovered that the original ab initio PES did not have thisproblem.
In order to address this issue, we have repeated the refinementprocess making it less aggressive with careful observation of thetransition moments. In the present work, we have also increased thesize of the basis set (see the discussion below). We used the samefitting set of experimental energies as well as the same functionalform for PES. The rms deviation of the experimental term valuesused in the PES fit (J ≤ 5) against the computed energies in AYTYis 0.18 cm−1 (0.006 cm−1 for pure rotational term values). Thepotential parameters as well as the associated FORTRAN 95 programare given as supplementary material. The resulting line intensitieshave returned to the quality of the ab initio levels as can be seen inFig. 1(b).
2.3 Variational computation
The TROVE program suite (Yurchenko et al. 2007) is employed tocompute our formaldehyde line list as well as to perform the least-squares fit of the ab initio PES discussed above. TROVE is designed tocompute variational ro-vibrational energy levels, associated eigen-functions and transition intensities for molecules of arbitrary struc-ture. Variational methods are often limited in their efficiency dueto the need to diagonalize increasingly large Hamiltonian matricesas the complexity of the molecule increases. However, with theimproved computational power and parallelism of modern CPUs,it is now feasible to solve ro-vibrational Schrodinger equations forpolyatomic molecules. TROVE has been successfully used to producehigh-accuracy line lists and spectra for tetratomic molecules suchas HSOH (Yachmenev et al. 2010), NH3 (Yurchenko, Barber &Tennyson 2011), SO3 (Underwood, Tennyson & Yurchenko 2013),PH3 (Sousa-Silva, Yurchenko & Tennyson 2013; Sousa-Silva et al.2015) and SbH3 (Yurchenko et al. 2010), as well as recently thepentatomic molecule CH4 (Yurchenko & Tennyson 2014).
TROVE approximates the kinetic energy operator (KEO) by a trun-cated Taylor series expansion in generalized coordinates. Previouscalculations for H2O2 by Polyansky et al. (2013) show that com-putations using series representation of the KEO for non-linearmolecules, such as H2CO, converge as well as exact KEO-basedprograms such as WAVR4 (Kozin et al. 2004) and, particularly forexcited rotational states, at the cost of significantly less computa-tional time. In this work, we use a kinetic expansion order of 6 foroptimal convergence while providing reasonable computation timesand similarly, we use a potential energy expansion order of 8.
In TROVE, the primitive vibrational basis set is representedby a symmetrized product of six one-dimensional vibrationalfunctions φn1 (r�
1 ), φn2 (r�2 ), φn3 (r�
3 ), φn4 (θ�1 ), φn5 (θ�
2 ) and φn6 (τ ),where ni denotes the associated local mode vibrational quanta,{r�
1 , r�2 , r
�3 , θ
�1 , θ�
2 } are linearized versions (Bunker & Jensen 1998;Yurchenko et al. 2007) of the coordinates {rCO, rCH1 , rCH2 , θOCH1
and θOCH2 }, respectively, and τ is the dihedral angle between theOCH1 and OCH2 planes. The functions φni
(qi) are obtained by solv-ing the corresponding 1D Schrodinger equation (Yurchenko et al.2007) for the vibrational motion associated with the correspond-ing coordinate qi ∈ {r�
1 , r�2 , r
�3 , θ
�1 , θ�
2 , τ }, with the other coordinatesheld fixed at their equilibrium values, where the Numerov–Cooleymethod (Noumerov 1924; Cooley 1961) is used. The direct productof the 1D basis functions is contracted using the polyad condition:
P = 2(n2 + n3) + n1 + n4 + n5 + n6 ≤ Pmax, (2)
which in terms of the normal mode quantum numbers vi reads
P = 2(v1 + v5) + v2 + v3 + v4 + v6 ≤ Pmax. (3)
This polyad rule is based on the approximate relationship betweenthe H2CO fundamental frequencies (see Table 1):
ν1 ≈ ν5 ≈ 2ν2 ≈ 2ν3 ≈ 2ν4 ≈ 2ν6. (4)
The vibrational basis set is further optimized by solving four re-duced eigenproblems variationally for {q1}, {q2, q3}, {q4, q5} and{q6} to produce four sets of wavefunctions (1)
n1(q1), (2,3)
n2,n3(q2, q3),
(4,5)n4,n5
(q4, q5) and (6)n6
(q6), respectively. At step 2, the pure vibra-tional (J = 0) problem is solved variationally using the basis setconstructed as a symmetrized direct product of (i)
ni(i = 1, 6) and
(j,k)nj ,nk
(j, k = 2, 3 or 4, 5) contracted through the polyad numbercondition (2) and symmetrized according to the C2v(M) molecularsymmetry group. In this work, the basis set is truncated at Pmax = 16as the relative simplicity of the molecule means that this gives well-converged results. The maximum polyad number Pmax restricts thenumber of combinations of φ(i)
niand (i,j )
ni ,njfor which P ≤ Pmax. The
resulting eigenfunctions J=0,�i obtained for each C2v(M) symme-
try � = A1, A2, B1 and B2 together with the symmetrized rigid rotorwavefunctions |J, K, τ rot〉 form our J = 0 basis set representation(Yurchenko et al. 2009), where the ro-vibrational basis functionsare given as a direct product of J=0,�
i and |J, K, τ rot〉. Here τ rot
is the rotational parity defined by Yurchenko et al. (2005b), andK is the projection of the angular momentum on the body-fixedaxis z. The latter is defined according with the Eckart conditions(Eckart 1935) and is oriented approximately along the CO bond. In
MNRAS 448, 1704–1714 (2015)
at University C
ollege London on M
arch 7, 2015http://m
nras.oxfordjournals.org/D
ownloaded from
ExoMol line lists – VIII. H2CO 1707
C2v(M) symmetry, K and τ rot correlate with the customary Ka andKc rotational quantum numbers as
K = Ka, τrot = mod(|Ka − Kc|, 2). (5)
The vibrational part of the J = 0 basis set is truncated using theenergy threshold of hc 18 000 cm−1and thus consists of 2310, 1531,1688 and 2112 functions for the A1, A2, B1 and B2 symmetries,respectively.
The resulting ro-vibrational Hamiltonian matrix in the J = 0representation exhibits a block diagonal structure where each offour blocks represents an irreducible representation A1, A2, B1 orB2 and can be diagonalized independently. Each of these blocksdisplays a band-diagonal structure whose bandwidth and length aredetermined by the J = 0 basis set size and the level of rotationalexcitation, respectively.
In generating our line list, we employed an upper eigenvaluelimit of 18 000 cm−1 as the intensity of transitions involving higherenergy states is too weak to be important. The J = 0 matrix blocksproduced by TROVE were on average of dimensions 1920 × 1920.The rule of thumb for the average size of a block for J ≥ 1 is1920(2J + 1). The largest J computed was J = 70 which re-quired the diagonalization of matrices of the order of ≈300 000 foreigenvalues and eigenvectors. The linear algebra libraries LAPACK(Anderson et al. 1999) and SCALAPACK (Blackford et al. 1997)were employed to solve for the eigenvalues and eigenvectors.
2.4 DMS and intensities
Intensity computation requires high-quality electric DMS. Weuse an ab initio DMS computed at the CCSD(T)/aug-cc-pVQZ
level of theory in the frozen-core approximation using CFOUR(Harding et al. 2008). Three symmetry-adapted projections of thedipole moment Cartesian components, μA1 , μB1 and μB2 , are givenin the analytical representations with each component expanded inTaylor series (185 parameters in total) in terms of internal coordi-nates around the equilibrium configuration using the form developedby Yachmenev, Polyak & Thiel (2013) to represent the dipole mo-ment of H2CS. These parameters reproduce the ab initio dipole mo-ment values of the μA1 , μB1 and μB2 components with rms errors of0.0002 D for each component. The equilibrium value of our dipolemoment is 2.3778 D (at re
CO = 1.203 3742 Å, reCH = 1.103 77 Å,
θ eOCH = 121.844◦), which can be compared to the experimental value
of the ground vibrational state dipole moment of μ = 2.3321(5) Dmeasured by Fabricant, Krieger & Muenter (1977).
The eigenvectors, obtained by diagonalization, are used in con-junction with the DMS to compute the required line strengths (andfrom that the Einstein-A coefficients and absolute intensities) oftransitions that satisfy the rotational selection rules
J ′ − J ′′ = 0, ±1, J ′ + J ′′ �= 0 (6)
and the symmetry selection rules
A1 ↔ A2 , B1 ↔ B2. (7)
The Einstein-A coefficient for a particular transition from the initialstate i to the final state f is given by
Aif = 8π4ν3if
3h(2Ji + 1)
∑A=X,Y ,Z
|〈f |μA|i〉|2, (8)
where Ji is the rotational quantum number for the initial state, h is thePlanck constant, νif is the transition frequency (hc νif = Ef − Ei),
Table 2. Extract from the H2CO state file. The full table is available at http://cdsarc.u-strasbg.fr/cgi-bin/VizieR?-source=J/MNRAS/.
I E (cm−1) g J �tot v1 v2 v3 v4 v5 v6 �vib K �rot IJ, � |C2i | n1 n2 n3 n4 n5 n6
1 0.000 000 1 0 1 0 0 0 0 0 0 1 0 1 1 0.99 0 0 0 0 0 02 1500.120 955 1 0 1 0 0 1 0 0 0 1 0 1 2 0.92 0 0 0 0 1 03 1746.045 388 1 0 1 0 1 0 0 0 0 1 0 1 3 0.92 1 0 0 0 0 04 2327.497 142 1 0 1 0 0 0 2 0 0 1 0 1 4 0.97 0 0 0 0 0 25 2494.322 937 1 0 1 0 0 0 0 0 2 1 0 1 5 0.96 0 0 0 1 1 06 2782.410 921 1 0 1 1 0 0 0 0 0 1 0 1 6 0.97 0 0 1 0 0 07 2999.006 647 1 0 1 0 0 2 0 0 0 1 0 1 7 0.84 0 0 0 1 1 08 3238.937 891 1 0 1 0 1 1 0 0 0 1 0 1 8 0.70 1 0 0 0 1 09 3471.719 306 1 0 1 0 2 0 0 0 0 1 0 1 9 0.83 2 0 0 0 0 010 3825.967 015 1 0 1 0 0 1 2 0 0 1 0 1 10 0.86 0 0 0 0 1 211 3936.435 541 1 0 1 0 0 1 0 0 2 1 0 1 11 0.73 0 0 0 3 0 012 4058.101 422 1 0 1 0 1 0 2 0 0 1 0 1 12 0.87 1 0 0 0 0 213 4083.490 190 1 0 1 0 0 0 0 1 1 1 0 1 13 0.69 0 1 0 1 0 014 4247.609 826 1 0 1 0 1 0 0 0 2 1 0 1 14 0.79 1 0 0 1 1 015 4256.314 862 1 0 1 1 0 1 0 0 0 1 0 1 15 0.90 0 0 1 0 1 016 4495.499 848 1 0 1 0 0 3 0 0 0 1 0 1 16 0.76 0 0 0 1 2 017 4529.635 737 1 0 1 1 1 0 0 0 0 1 0 1 17 0.90 1 0 1 0 0 0
Notes. I: State counting number;E: state term energy in cm−1;g: state degeneracy;J: state rotational quantum number;�tot: total symmetry in C2ν (M) (1 is A1, 2 is A2, 3 is B1 and 4 is B2);v1 − v6: normal mode vibrational quantum numbers;�vib: symmetry of vibrational contribution in C2ν (M);K: state projection of the rotational quantum number;�rot: symmetry of rotational contribution in C2ν (M) ;IJ, � : state number in J, � block;|C2
i |: largest coefficient used in the assignment;n1 − n6: TROVE vibrational quantum numbers.
MNRAS 448, 1704–1714 (2015)
at University C
ollege London on M
arch 7, 2015http://m
nras.oxfordjournals.org/D
ownloaded from
1708 A. F. Al-Refaie et al.
f and i represent the eigenfunctions of the final and initial states,respectively, and μA is the electronically averaged component ofthe dipole moment along the space-fixed axis A = X, Y, Z (see alsoYurchenko et al. 2005a). From this the absolute absorption intensityis determined by
I (f ← i) = Aif
8πcgns(2Jf +1)
exp(− Ei
kT
)Q ν2
if
[1−exp
(−hcνif
kT
)],
(9)
where k is the Boltzmann constant, T is the absolute temperatureand gns is the nuclear spin statistical weight factor. Q, the partitionfunction, is given by
Q =∑
i
gi exp
(−Ei
kT
), (10)
where gi is the degeneracy of a particular state i with energy Ei. ForH2CO, gi is gns(2Ji + 1) with gns = 1 for A1 and A2 symmetries andgns = 3 for B1 and B2 symmetries. The transitions were computedusing the energy limits hc 8000 and hc 18 000 cm−1 for the lowerand upper states, respectively.
Although diagonalization of the Hamiltonian matrices is very de-manding on computer resources, it is the calculation of the Einstein-A coefficients which dominates the actual computer time due tothe sheer number of these and the large size of the eigenvectors.Graphics processing units were therefore employed to acceleratecomputation of the intensities. To do this required the developmentof a new algorithm to allow these fast but memory-poor processorsto be used efficiently. A paper discussing this will be publishedelsewhere (Al-Refaie, Tennyson & Yurchenko 2015).
3 R ESULTS
The line list produced, which we call AYTY, contains around 10billion transitions with wavenumbers up to 10 000 cm−1. The tran-sitions are sorted in increasing transition frequency and then con-verted into the ExoMol format (Tennyson, Hill & Yurchenko 2013).An extract of the state file and transition file can be seen in Tables 2and 3. Spectra at arbitrary temperatures can be computed usingthe Einstein-A coefficients from the transition files. The theoreticalerror is estimated by the fitting rms deviation of 0.18 cm−1. Thismeans our transition frequencies and energy levels should be reli-able to about 0.2 cm−1 with low-lying levels, particularly the purerotational ones, being much more accurate than this and levels forvibrational states for which there are no available laboratory datamuch less so.
Table 3. Extracts from the H2CO tran-sition file. The full table is available athttp://cdsarc.u-strasbg.fr/cgi-bin/VizieR?-source=J/MNRAS/
f i Afi
6713 828 6734 990 8.2910e−066709 468 6722 660 3.2621e−056704 996 6726 710 4.7333e−056726 711 6739 070 5.0697e−056718 218 6730 865 5.4273e−056730 866 6750 469 5.6752e−05
Notes. f: Upper state counting number;i: lower state counting number;Afi: Einstein-A coefficient in s−1.
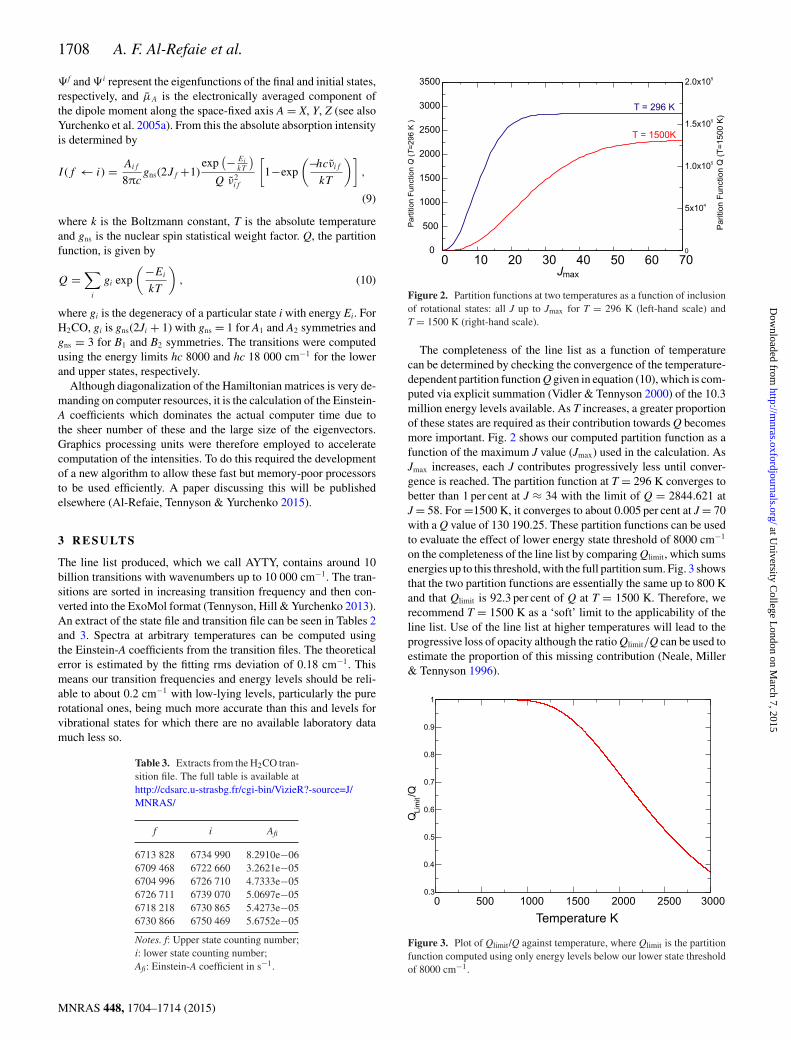
Figure 2. Partition functions at two temperatures as a function of inclusionof rotational states: all J up to Jmax for T = 296 K (left-hand scale) andT = 1500 K (right-hand scale).
The completeness of the line list as a function of temperaturecan be determined by checking the convergence of the temperature-dependent partition function Q given in equation (10), which is com-puted via explicit summation (Vidler & Tennyson 2000) of the 10.3million energy levels available. As T increases, a greater proportionof these states are required as their contribution towards Q becomesmore important. Fig. 2 shows our computed partition function as afunction of the maximum J value (Jmax) used in the calculation. AsJmax increases, each J contributes progressively less until conver-gence is reached. The partition function at T = 296 K converges tobetter than 1 per cent at J ≈ 34 with the limit of Q = 2844.621 atJ = 58. For =1500 K, it converges to about 0.005 per cent at J = 70with a Q value of 130 190.25. These partition functions can be usedto evaluate the effect of lower energy state threshold of 8000 cm−1
on the completeness of the line list by comparing Qlimit, which sumsenergies up to this threshold, with the full partition sum. Fig. 3 showsthat the two partition functions are essentially the same up to 800 Kand that Qlimit is 92.3 per cent of Q at T = 1500 K. Therefore, werecommend T = 1500 K as a ‘soft’ limit to the applicability of theline list. Use of the line list at higher temperatures will lead to theprogressive loss of opacity although the ratio Qlimit/Q can be used toestimate the proportion of this missing contribution (Neale, Miller& Tennyson 1996).
Figure 3. Plot of Qlimit/Q against temperature, where Qlimit is the partitionfunction computed using only energy levels below our lower state thresholdof 8000 cm−1.
MNRAS 448, 1704–1714 (2015)
at University C
ollege London on M
arch 7, 2015http://m
nras.oxfordjournals.org/D
ownloaded from
ExoMol line lists – VIII. H2CO 1709
Table 4. Comparisons of H2CO partition functions asa function of temperature for this work, CDMS (Mulleret al. 2005) and those used in HITRAN (Fischer et al.2003).
T (K) AYTY CDMS HITRAN
2.725 2.0165 2.01665.000 4.4833 4.48329.375 13.801 13.800818.75 44.6835 44.681237.5 128.6581 128.649275 361.7053 361.7195 362.07
150 1019.9549 1019.9706 1020.47225 1874.4679 1872.6221 1875.67300 2904.1778 2883.0163 2906.32500 6760.2315 6208.3442 6760.991500 128 635.40 130 190.253000 2741 283.3 3038 800.0
Table 5. Parameters used to rep-resent the partition function, seeequation (11), valid for tempera-tures up to 3000 K.
Parameter Value
a0 1.127 898 076 83a1 −5.350 679 398 66a2 10.336 843 237 00a3 −4.921 874 551 47a4 −2.282 340 893 65a5 3.611 228 217 99a6 −1.641 743 653 25a7 0.337 275 432 06a8 −0.026 542 231 36
Table 4 compares our partition functions with those from CDMS(Muller et al. 2005) and those used in HITRAN (Fischer et al. 2003).At temperatures T ≤ 300 K, we agree to better than 1 per cent withCDMS and HITRAN. At 500 K the difference with CDMS is much
higher at 8.9 per cent, due to our explicit sum running over a muchlarger number of levels, but agreement with HITRAN is good.There are bigger differences at higher temperatures: at 1500 K ourpartition function is lower by about 1.2 per cent and at 3000 K by9.7 per cent. This may be caused by the lack of the high-energycontributions due to the energy cut-off of hc 18 000 cm−1 used inour line list, see Sousa-Silva et al. (2014) and Neale & Tennyson(1995) for a discussion of the importance of contributions from theexcited ro-vibrational states up to the dissociation. Our full partitionfunction evaluated on a 1 K grid is given in the supplementary data.
We use the analytical representation suggested by Vidler &Tennyson (2000) as given by
log10 Q(T ) =8∑
n=0
an
[log10 T
]n. (11)
The expansion parameters given in Table 5 reproduce our parti-tion function better than 0.3 per cent for temperatures ranging up to3000 K.
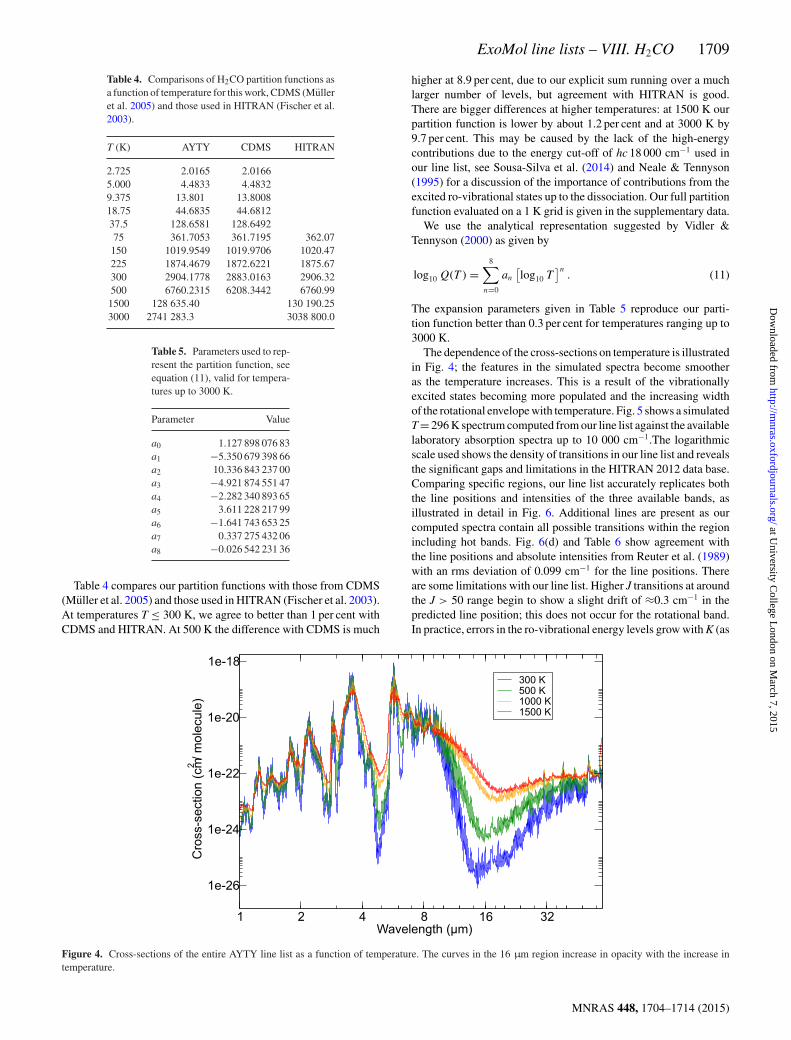
The dependence of the cross-sections on temperature is illustratedin Fig. 4; the features in the simulated spectra become smootheras the temperature increases. This is a result of the vibrationallyexcited states becoming more populated and the increasing widthof the rotational envelope with temperature. Fig. 5 shows a simulatedT = 296 K spectrum computed from our line list against the availablelaboratory absorption spectra up to 10 000 cm−1.The logarithmicscale used shows the density of transitions in our line list and revealsthe significant gaps and limitations in the HITRAN 2012 data base.Comparing specific regions, our line list accurately replicates boththe line positions and intensities of the three available bands, asillustrated in detail in Fig. 6. Additional lines are present as ourcomputed spectra contain all possible transitions within the regionincluding hot bands. Fig. 6(d) and Table 6 show agreement withthe line positions and absolute intensities from Reuter et al. (1989)with an rms deviation of 0.099 cm−1 for the line positions. Thereare some limitations with our line list. Higher J transitions at aroundthe J > 50 range begin to show a slight drift of ≈0.3 cm−1 in thepredicted line position; this does not occur for the rotational band.In practice, errors in the ro-vibrational energy levels grow with K (as
Figure 4. Cross-sections of the entire AYTY line list as a function of temperature. The curves in the 16 µm region increase in opacity with the increase intemperature.
MNRAS 448, 1704–1714 (2015)
at University C
ollege London on M
arch 7, 2015http://m
nras.oxfordjournals.org/D
ownloaded from
1710 A. F. Al-Refaie et al.
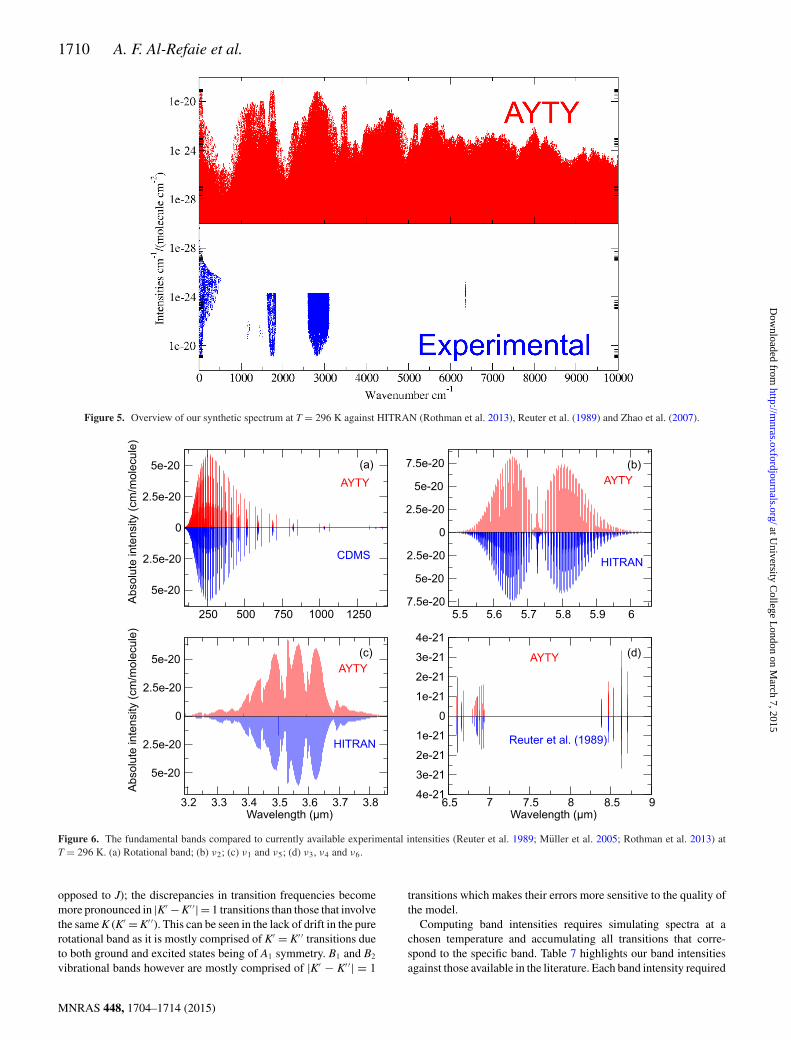
Figure 5. Overview of our synthetic spectrum at T = 296 K against HITRAN (Rothman et al. 2013), Reuter et al. (1989) and Zhao et al. (2007).
Figure 6. The fundamental bands compared to currently available experimental intensities (Reuter et al. 1989; Muller et al. 2005; Rothman et al. 2013) atT = 296 K. (a) Rotational band; (b) ν2; (c) ν1 and ν5; (d) ν3, ν4 and ν6.
opposed to J); the discrepancies in transition frequencies becomemore pronounced in |K′ − K′′| = 1 transitions than those that involvethe same K (K′ = K′′). This can be seen in the lack of drift in the purerotational band as it is mostly comprised of K′ = K′ ′ transitions dueto both ground and excited states being of A1 symmetry. B1 and B2
vibrational bands however are mostly comprised of |K′ − K′ ′| = 1
transitions which makes their errors more sensitive to the quality ofthe model.
Computing band intensities requires simulating spectra at achosen temperature and accumulating all transitions that corre-spond to the specific band. Table 7 highlights our band intensitiesagainst those available in the literature. Each band intensity required
MNRAS 448, 1704–1714 (2015)
at University C
ollege London on M
arch 7, 2015http://m
nras.oxfordjournals.org/D
ownloaded from
ExoMol line lists – VIII. H2CO 1711
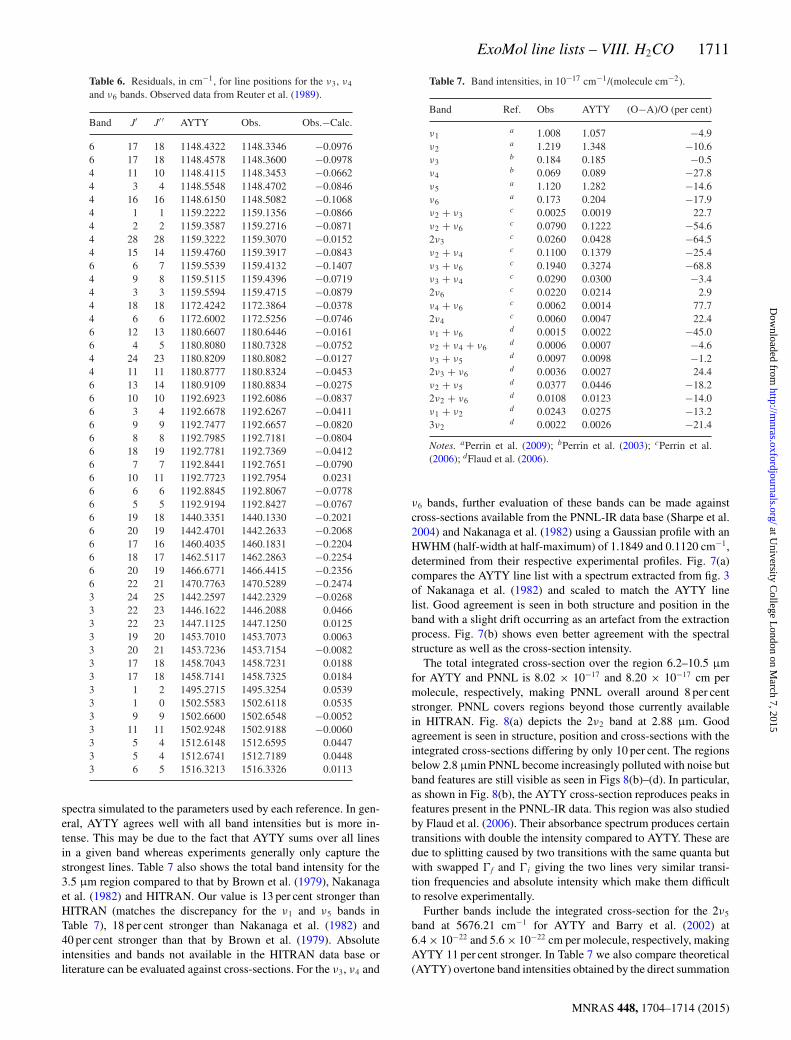
Table 6. Residuals, in cm−1, for line positions for the ν3, ν4
and ν6 bands. Observed data from Reuter et al. (1989).
Band J′ J′ ′ AYTY Obs. Obs.−Calc.
6 17 18 1148.4322 1148.3346 −0.09766 17 18 1148.4578 1148.3600 −0.09784 11 10 1148.4115 1148.3453 −0.06624 3 4 1148.5548 1148.4702 −0.08464 16 16 1148.6150 1148.5082 −0.10684 1 1 1159.2222 1159.1356 −0.08664 2 2 1159.3587 1159.2716 −0.08714 28 28 1159.3222 1159.3070 −0.01524 15 14 1159.4760 1159.3917 −0.08436 6 7 1159.5539 1159.4132 −0.14074 9 8 1159.5115 1159.4396 −0.07194 3 3 1159.5594 1159.4715 −0.08794 18 18 1172.4242 1172.3864 −0.03784 6 6 1172.6002 1172.5256 −0.07466 12 13 1180.6607 1180.6446 −0.01616 4 5 1180.8080 1180.7328 −0.07524 24 23 1180.8209 1180.8082 −0.01274 11 11 1180.8777 1180.8324 −0.04536 13 14 1180.9109 1180.8834 −0.02756 10 10 1192.6923 1192.6086 −0.08376 3 4 1192.6678 1192.6267 −0.04116 9 9 1192.7477 1192.6657 −0.08206 8 8 1192.7985 1192.7181 −0.08046 18 19 1192.7781 1192.7369 −0.04126 7 7 1192.8441 1192.7651 −0.07906 10 11 1192.7723 1192.7954 0.02316 6 6 1192.8845 1192.8067 −0.07786 5 5 1192.9194 1192.8427 −0.07676 19 18 1440.3351 1440.1330 −0.20216 20 19 1442.4701 1442.2633 −0.20686 17 16 1460.4035 1460.1831 −0.22046 18 17 1462.5117 1462.2863 −0.22546 20 19 1466.6771 1466.4415 −0.23566 22 21 1470.7763 1470.5289 −0.24743 24 25 1442.2597 1442.2329 −0.02683 22 23 1446.1622 1446.2088 0.04663 22 23 1447.1125 1447.1250 0.01253 19 20 1453.7010 1453.7073 0.00633 20 21 1453.7236 1453.7154 −0.00823 17 18 1458.7043 1458.7231 0.01883 17 18 1458.7141 1458.7325 0.01843 1 2 1495.2715 1495.3254 0.05393 1 0 1502.5583 1502.6118 0.05353 9 9 1502.6600 1502.6548 −0.00523 11 11 1502.9248 1502.9188 −0.00603 5 4 1512.6148 1512.6595 0.04473 5 4 1512.6741 1512.7189 0.04483 6 5 1516.3213 1516.3326 0.0113
spectra simulated to the parameters used by each reference. In gen-eral, AYTY agrees well with all band intensities but is more in-tense. This may be due to the fact that AYTY sums over all linesin a given band whereas experiments generally only capture thestrongest lines. Table 7 also shows the total band intensity for the3.5 μm region compared to that by Brown et al. (1979), Nakanagaet al. (1982) and HITRAN. Our value is 13 per cent stronger thanHITRAN (matches the discrepancy for the ν1 and ν5 bands inTable 7), 18 per cent stronger than Nakanaga et al. (1982) and40 per cent stronger than that by Brown et al. (1979). Absoluteintensities and bands not available in the HITRAN data base orliterature can be evaluated against cross-sections. For the ν3, ν4 and
Table 7. Band intensities, in 10−17 cm−1/(molecule cm−2).
Band Ref. Obs AYTY (O−A)/O (per cent)
ν1a 1.008 1.057 −4.9
ν2a 1.219 1.348 −10.6
ν3b 0.184 0.185 −0.5
ν4b 0.069 0.089 −27.8
ν5a 1.120 1.282 −14.6
ν6a 0.173 0.204 −17.9
ν2 + ν3c 0.0025 0.0019 22.7
ν2 + ν6c 0.0790 0.1222 −54.6
2ν3c 0.0260 0.0428 −64.5
ν2 + ν4c 0.1100 0.1379 −25.4
ν3 + ν6c 0.1940 0.3274 −68.8
ν3 + ν4c 0.0290 0.0300 −3.4
2ν6c 0.0220 0.0214 2.9
ν4 + ν6c 0.0062 0.0014 77.7
2ν4c 0.0060 0.0047 22.4
ν1 + ν6d 0.0015 0.0022 −45.0
ν2 + ν4 + ν6d 0.0006 0.0007 −4.6
ν3 + ν5d 0.0097 0.0098 −1.2
2ν3 + ν6d 0.0036 0.0027 24.4
ν2 + ν5d 0.0377 0.0446 −18.2
2ν2 + ν6d 0.0108 0.0123 −14.0
ν1 + ν2d 0.0243 0.0275 −13.2
3ν2d 0.0022 0.0026 −21.4
Notes. aPerrin et al. (2009); bPerrin et al. (2003); cPerrin et al.(2006); dFlaud et al. (2006).
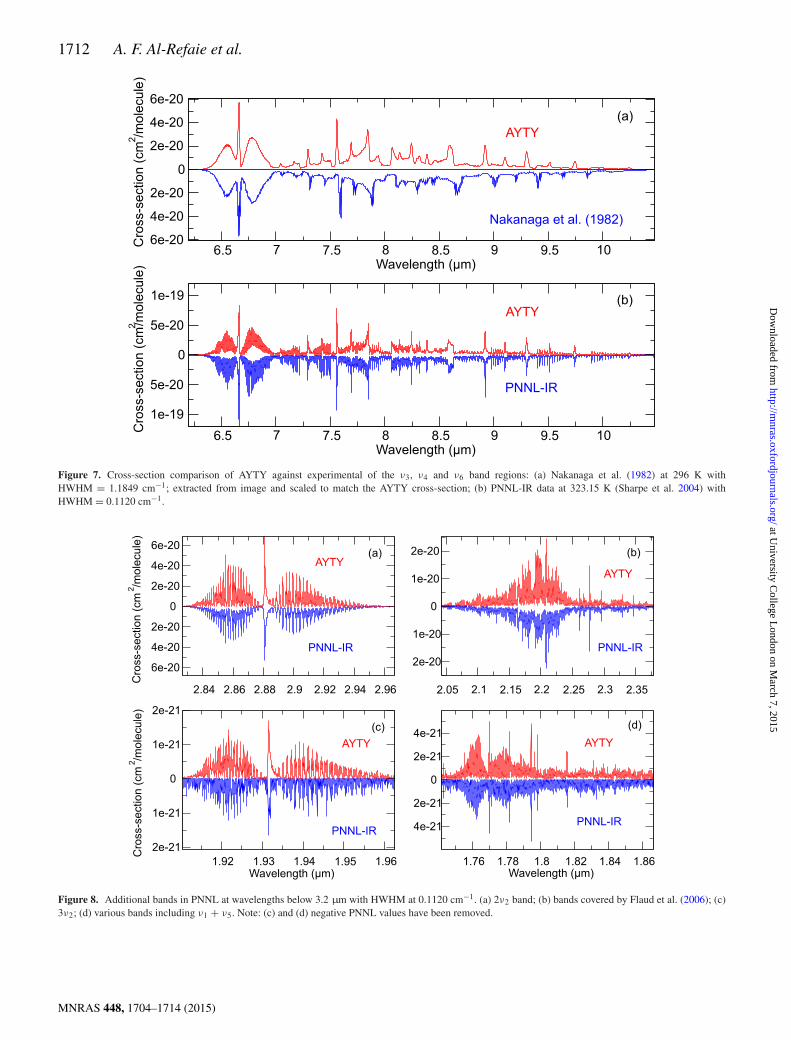
ν6 bands, further evaluation of these bands can be made againstcross-sections available from the PNNL-IR data base (Sharpe et al.2004) and Nakanaga et al. (1982) using a Gaussian profile with anHWHM (half-width at half-maximum) of 1.1849 and 0.1120 cm−1,determined from their respective experimental profiles. Fig. 7(a)compares the AYTY line list with a spectrum extracted from fig. 3of Nakanaga et al. (1982) and scaled to match the AYTY linelist. Good agreement is seen in both structure and position in theband with a slight drift occurring as an artefact from the extractionprocess. Fig. 7(b) shows even better agreement with the spectralstructure as well as the cross-section intensity.
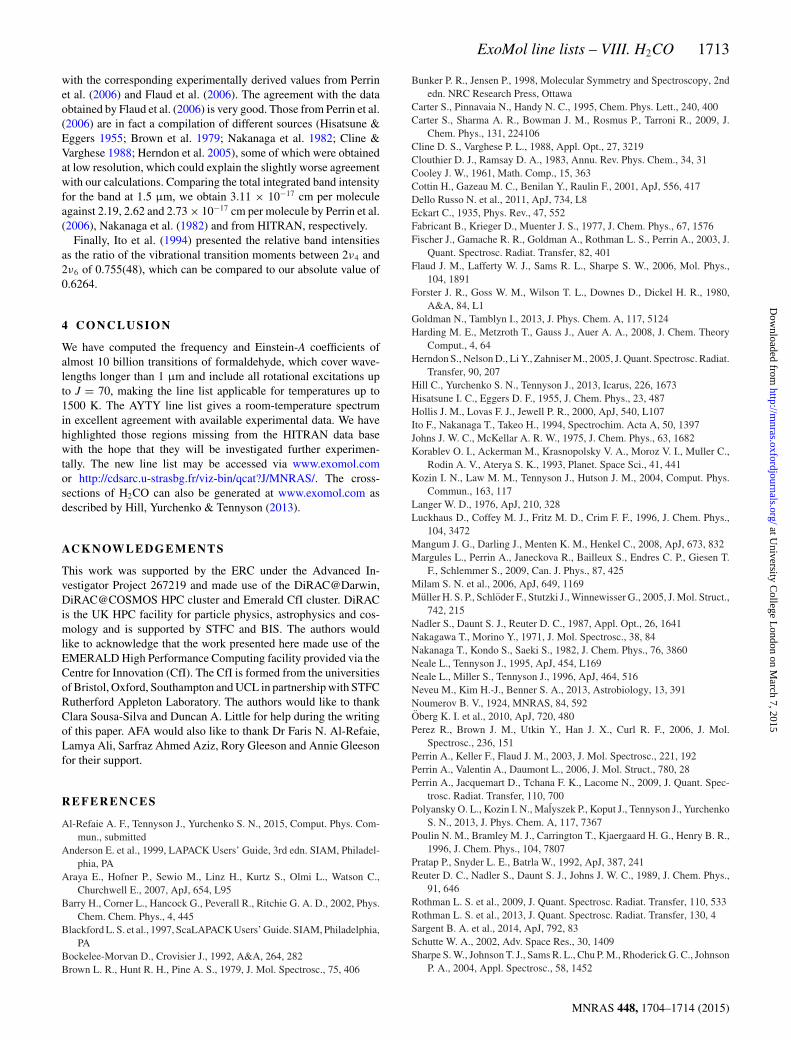
The total integrated cross-section over the region 6.2–10.5 μmfor AYTY and PNNL is 8.02 × 10⁻¹⁷ and 8.20 × 10⁻¹⁷ cm permolecule, respectively, making PNNL overall around 8 per centstronger. PNNL covers regions beyond those currently availablein HITRAN. Fig. 8(a) depicts the 2ν2 band at 2.88 μm. Goodagreement is seen in structure, position and cross-sections with theintegrated cross-sections differing by only 10 per cent. The regionsbelow 2.8 μmin PNNL become increasingly polluted with noise butband features are still visible as seen in Figs 8(b)–(d). In particular,as shown in Fig. 8(b), the AYTY cross-section reproduces peaks infeatures present in the PNNL-IR data. This region was also studiedby Flaud et al. (2006). Their absorbance spectrum produces certaintransitions with double the intensity compared to AYTY. These aredue to splitting caused by two transitions with the same quanta butwith swapped �f and �i giving the two lines very similar transi-tion frequencies and absolute intensity which make them difficultto resolve experimentally.
Further bands include the integrated cross-section for the 2ν5
band at 5676.21 cm−1 for AYTY and Barry et al. (2002) at6.4 × 10−22 and 5.6 × 10⁻²² cm per molecule, respectively, makingAYTY 11 per cent stronger. In Table 7 we also compare theoretical(AYTY) overtone band intensities obtained by the direct summation
MNRAS 448, 1704–1714 (2015)
at University C
ollege London on M
arch 7, 2015http://m
nras.oxfordjournals.org/D
ownloaded from
1712 A. F. Al-Refaie et al.
Figure 7. Cross-section comparison of AYTY against experimental of the ν3, ν4 and ν6 band regions: (a) Nakanaga et al. (1982) at 296 K withHWHM = 1.1849 cm−1; extracted from image and scaled to match the AYTY cross-section; (b) PNNL-IR data at 323.15 K (Sharpe et al. 2004) withHWHM = 0.1120 cm−1.
Figure 8. Additional bands in PNNL at wavelengths below 3.2 µm with HWHM at 0.1120 cm−1. (a) 2ν2 band; (b) bands covered by Flaud et al. (2006); (c)3ν2; (d) various bands including ν1 + ν5. Note: (c) and (d) negative PNNL values have been removed.
MNRAS 448, 1704–1714 (2015)
at University C
ollege London on M
arch 7, 2015http://m
nras.oxfordjournals.org/D
ownloaded from
ExoMol line lists – VIII. H2CO 1713
with the corresponding experimentally derived values from Perrinet al. (2006) and Flaud et al. (2006). The agreement with the dataobtained by Flaud et al. (2006) is very good. Those from Perrin et al.(2006) are in fact a compilation of different sources (Hisatsune &Eggers 1955; Brown et al. 1979; Nakanaga et al. 1982; Cline &Varghese 1988; Herndon et al. 2005), some of which were obtainedat low resolution, which could explain the slightly worse agreementwith our calculations. Comparing the total integrated band intensityfor the band at 1.5 μm, we obtain 3.11 × 10⁻¹⁷ cm per moleculeagainst 2.19, 2.62 and 2.73 × 10⁻¹⁷ cm per molecule by Perrin et al.(2006), Nakanaga et al. (1982) and from HITRAN, respectively.
Finally, Ito et al. (1994) presented the relative band intensitiesas the ratio of the vibrational transition moments between 2ν4 and2ν6 of 0.755(48), which can be compared to our absolute value of0.6264.
4 C O N C L U S I O N
We have computed the frequency and Einstein-A coefficients ofalmost 10 billion transitions of formaldehyde, which cover wave-lengths longer than 1 μm and include all rotational excitations upto J = 70, making the line list applicable for temperatures up to1500 K. The AYTY line list gives a room-temperature spectrumin excellent agreement with available experimental data. We havehighlighted those regions missing from the HITRAN data basewith the hope that they will be investigated further experimen-tally. The new line list may be accessed via www.exomol.comor http://cdsarc.u-strasbg.fr/viz-bin/qcat?J/MNRAS/. The cross-sections of H2CO can also be generated at www.exomol.com asdescribed by Hill, Yurchenko & Tennyson (2013).
AC K N OW L E D G E M E N T S
This work was supported by the ERC under the Advanced In-vestigator Project 267219 and made use of the DiRAC@Darwin,DiRAC@COSMOS HPC cluster and Emerald CfI cluster. DiRACis the UK HPC facility for particle physics, astrophysics and cos-mology and is supported by STFC and BIS. The authors wouldlike to acknowledge that the work presented here made use of theEMERALD High Performance Computing facility provided via theCentre for Innovation (CfI). The CfI is formed from the universitiesof Bristol, Oxford, Southampton and UCL in partnership with STFCRutherford Appleton Laboratory. The authors would like to thankClara Sousa-Silva and Duncan A. Little for help during the writingof this paper. AFA would also like to thank Dr Faris N. Al-Refaie,Lamya Ali, Sarfraz Ahmed Aziz, Rory Gleeson and Annie Gleesonfor their support.
R E F E R E N C E S
Al-Refaie A. F., Tennyson J., Yurchenko S. N., 2015, Comput. Phys. Com-mun., submitted
Anderson E. et al., 1999, LAPACK Users’ Guide, 3rd edn. SIAM, Philadel-phia, PA
Araya E., Hofner P., Sewio M., Linz H., Kurtz S., Olmi L., Watson C.,Churchwell E., 2007, ApJ, 654, L95
Barry H., Corner L., Hancock G., Peverall R., Ritchie G. A. D., 2002, Phys.Chem. Chem. Phys., 4, 445
Blackford L. S. et al., 1997, ScaLAPACK Users’ Guide. SIAM, Philadelphia,PA
Bockelee-Morvan D., Crovisier J., 1992, A&A, 264, 282Brown L. R., Hunt R. H., Pine A. S., 1979, J. Mol. Spectrosc., 75, 406
Bunker P. R., Jensen P., 1998, Molecular Symmetry and Spectroscopy, 2ndedn. NRC Research Press, Ottawa
Carter S., Pinnavaia N., Handy N. C., 1995, Chem. Phys. Lett., 240, 400Carter S., Sharma A. R., Bowman J. M., Rosmus P., Tarroni R., 2009, J.
Chem. Phys., 131, 224106Cline D. S., Varghese P. L., 1988, Appl. Opt., 27, 3219Clouthier D. J., Ramsay D. A., 1983, Annu. Rev. Phys. Chem., 34, 31Cooley J. W., 1961, Math. Comp., 15, 363Cottin H., Gazeau M. C., Benilan Y., Raulin F., 2001, ApJ, 556, 417Dello Russo N. et al., 2011, ApJ, 734, L8Eckart C., 1935, Phys. Rev., 47, 552Fabricant B., Krieger D., Muenter J. S., 1977, J. Chem. Phys., 67, 1576Fischer J., Gamache R. R., Goldman A., Rothman L. S., Perrin A., 2003, J.
Quant. Spectrosc. Radiat. Transfer, 82, 401Flaud J. M., Lafferty W. J., Sams R. L., Sharpe S. W., 2006, Mol. Phys.,
104, 1891Forster J. R., Goss W. M., Wilson T. L., Downes D., Dickel H. R., 1980,
A&A, 84, L1Goldman N., Tamblyn I., 2013, J. Phys. Chem. A, 117, 5124Harding M. E., Metzroth T., Gauss J., Auer A. A., 2008, J. Chem. Theory
Comput., 4, 64Herndon S., Nelson D., Li Y., Zahniser M., 2005, J. Quant. Spectrosc. Radiat.
Transfer, 90, 207Hill C., Yurchenko S. N., Tennyson J., 2013, Icarus, 226, 1673Hisatsune I. C., Eggers D. F., 1955, J. Chem. Phys., 23, 487Hollis J. M., Lovas F. J., Jewell P. R., 2000, ApJ, 540, L107Ito F., Nakanaga T., Takeo H., 1994, Spectrochim. Acta A, 50, 1397Johns J. W. C., McKellar A. R. W., 1975, J. Chem. Phys., 63, 1682Korablev O. I., Ackerman M., Krasnopolsky V. A., Moroz V. I., Muller C.,
Rodin A. V., Aterya S. K., 1993, Planet. Space Sci., 41, 441Kozin I. N., Law M. M., Tennyson J., Hutson J. M., 2004, Comput. Phys.
Commun., 163, 117Langer W. D., 1976, ApJ, 210, 328Luckhaus D., Coffey M. J., Fritz M. D., Crim F. F., 1996, J. Chem. Phys.,
104, 3472Mangum J. G., Darling J., Menten K. M., Henkel C., 2008, ApJ, 673, 832Margules L., Perrin A., Janeckova R., Bailleux S., Endres C. P., Giesen T.
F., Schlemmer S., 2009, Can. J. Phys., 87, 425Milam S. N. et al., 2006, ApJ, 649, 1169Muller H. S. P., Schloder F., Stutzki J., Winnewisser G., 2005, J. Mol. Struct.,
742, 215Nadler S., Daunt S. J., Reuter D. C., 1987, Appl. Opt., 26, 1641Nakagawa T., Morino Y., 1971, J. Mol. Spectrosc., 38, 84Nakanaga T., Kondo S., Saeki S., 1982, J. Chem. Phys., 76, 3860Neale L., Tennyson J., 1995, ApJ, 454, L169Neale L., Miller S., Tennyson J., 1996, ApJ, 464, 516Neveu M., Kim H.-J., Benner S. A., 2013, Astrobiology, 13, 391Noumerov B. V., 1924, MNRAS, 84, 592Oberg K. I. et al., 2010, ApJ, 720, 480Perez R., Brown J. M., Utkin Y., Han J. X., Curl R. F., 2006, J. Mol.
Spectrosc., 236, 151Perrin A., Keller F., Flaud J. M., 2003, J. Mol. Spectrosc., 221, 192Perrin A., Valentin A., Daumont L., 2006, J. Mol. Struct., 780, 28Perrin A., Jacquemart D., Tchana F. K., Lacome N., 2009, J. Quant. Spec-
trosc. Radiat. Transfer, 110, 700Polyansky O. L., Kozin I. N., Malyszek P., Koput J., Tennyson J., Yurchenko
S. N., 2013, J. Phys. Chem. A, 117, 7367Poulin N. M., Bramley M. J., Carrington T., Kjaergaard H. G., Henry B. R.,
1996, J. Chem. Phys., 104, 7807Pratap P., Snyder L. E., Batrla W., 1992, ApJ, 387, 241Reuter D. C., Nadler S., Daunt S. J., Johns J. W. C., 1989, J. Chem. Phys.,
91, 646Rothman L. S. et al., 2009, J. Quant. Spectrosc. Radiat. Transfer, 110, 533Rothman L. S. et al., 2013, J. Quant. Spectrosc. Radiat. Transfer, 130, 4Sargent B. A. et al., 2014, ApJ, 792, 83Schutte W. A., 2002, Adv. Space Res., 30, 1409Sharpe S. W., Johnson T. J., Sams R. L., Chu P. M., Rhoderick G. C., Johnson
P. A., 2004, Appl. Spectrosc., 58, 1452
MNRAS 448, 1704–1714 (2015)
at University C
ollege London on M
arch 7, 2015http://m
nras.oxfordjournals.org/D
ownloaded from
1714 A. F. Al-Refaie et al.
Sousa-Silva C., Yurchenko S. N., Tennyson J., 2013, J. Mol. Spectrosc., 288,28
Sousa-Silva C., Hesketh N., Yurchenko S. N., Hill C., Tennyson J., 2014, J.Quant. Spectrosc. Radiat. Transfer, 142, 66
Sousa-Silva C., Al-Refaie A. F., Tennyson J., Yurchenko S. N., 2015, MN-RAS, 446, 2337
Tchana F. K., Perrin A., Lacome N., 2007, J. Mol. Spectrosc., 245, 141Tennyson J., Yurchenko S. N., 2012, MNRAS, 425, 21Tennyson J., Hill C., Yurchenko S. N., 2013, in Gillaspy J. D., Wiese W.
L., Podpaly Y. A., eds, AIP Conf. Proc. Vol. 1545, 8th InternationalConference on Atomic and Molecular Data and Their ApplicationsICAMDATA-2012. Am. Inst. Phys., New York, p. 186
Theule P., Callegari A., Rizzo T. R., Muenter J. S., 2003, J. Chem. Phys.,119, 8910
Underwood D. S., Tennyson J., Yurchenko S. N., 2013, Phys. Chem. Chem.Phys., 15, 10118
Vidler M., Tennyson J., 2000, J. Chem. Phys., 113, 9766Villanueva G. L., Mumma M. J., Disanti M. A., Bonev B. P., Gibb E. L.,
Magee-Sauer K., Blake G. A., Salyk C., 2011, Icarus, 216, 227Villanueva G. et al., 2013, Icarus, 223, 11Wayne R. P., 2000, Chemistry of Atmospheres. Oxford Univ. Press, OxfordWoon D. E., 2002, ApJ, 569, 541Yachmenev A., Yurchenko S. N., Jensen P., Baum O., Giesen T. F., Thiel
W., 2010, Phys. Chem. Chem. Phys., 12, 8387Yachmenev A., Yurchenko S. N., Jensen P., Thiel W., 2011, J. Chem. Phys.,
134, 11Yachmenev A., Polyak I., Thiel W., 2013, J. Chem. Phys., 139, 204308Yurchenko S. N., 2014, in Springborg M., Joswig J.-O., eds, Chemical
Modelling: Volume 10. Royal Society of Chemistry, Cambridge, p. 183Yurchenko S. N., Tennyson J., 2014, MNRAS, 440, 1649Yurchenko S. N., Thiel W., Carvajal M., Lin H., Jensen P., 2005a, Adv.
Quantum Chem., 48, 209Yurchenko S. N., Carvajal M., Jensen P., Lin H., Zheng J. J., Thiel W.,
2005b, Mol. Phys., 103, 359
Yurchenko S. N., Thiel W., Jensen P., 2007, J. Mol. Spectrosc., 245, 126Yurchenko S. N., Barber R. J., Yachmenev A., Thiel W., Jensen P., Tennyson
J., 2009, J. Phys. Chem. A, 113, 11845Yurchenko S. N., Carvajal M., Yachmenev A., Thiel W., Jensen P., 2010, J.
Quant. Spectrosc. Radiat. Transfer, 111, 2279Yurchenko S. N., Barber R. J., Tennyson J., 2011, MNRAS, 413, 1828Zasowski G., Kemper F., Watson D. M., Furlan E., Bohac C. J., Hull C.,
Green J. D., 2009, ApJ, 694, 459Zhao W., Gao X., Deng L., Huang T., Wu T., Zhang W., 2007, J. Quant.
Spectrosc. Radiat. Transfer, 107, 331Zuckerman B., Buhl D., Palmer P., Snyder L. E., 1970, ApJ, 160, 485Zuckerman B., Buhl D., Palmer P., Snyder L. E., 1974, ApJ, 189, 217
S U P P O RT I N G IN F O R M AT I O N
Additional Supporting Information may be found in the online ver-sion of this article:
H2CO_AYTY.pfH2CO_DMS_2014.f90H2CO_DMS_2014.inpH2CO_DMS_2014.outH2CO_DMS_2014.params (http://mnras.oxfordjournals.org/lookup/suppl/doi:10.1093/mnras/stv091/-/DC1).
Please note: Oxford University Press are not responsible for thecontent or functionality of any supporting materials supplied bythe authors. Any queries (other than missing material) should bedirected to the corresponding author for the article.
This paper has been typeset from a TEX/LATEX file prepared by the author.
MNRAS 448, 1704–1714 (2015)
at University C
ollege London on M
arch 7, 2015http://m
nras.oxfordjournals.org/D
ownloaded from


![MCMC for Variationally Sparse Gaussian Processes€¦ · (MCMC) approaches provide asymptotically exact approximations. Murray and Adams [11] and Filippone et al. [12] examine schemes](https://img.pdfslide.us/doc/110x75/60bf255507831636f522ba25/mcmc-for-variationally-sparse-gaussian-processes-mcmc-approaches-provide-asymptotically.jpg)


![arXiv:1704.05404v4 [cond-mat.mtrl-sci] 19 Oct 2017 · 2017. 10. 20. · mobility. We calculate the temperature-dependent polaron mobility of hybrid halide perovskites by variationally](https://img.pdfslide.us/doc/110x75/607bf768d5220d12cb22d509/arxiv170405404v4-cond-matmtrl-sci-19-oct-2017-2017-10-20-mobility-we.jpg)