Embed Size (px)
Citation preview

The Impact of
Exogenous Shocks on the Egyptian Economy
And Policy Responses
Eman Selim1
January 03, 2008
Draft
Abstract
This paper attempts to estimate the impact of exogenous economic shocks on the
economic performance in the last three decades. The exogenous economic shocks
considered are terms of trade, the change in GDP in industrial countries and the cost
of foreign borrowing. An overview of the development of main macroeconomic
variables in Egypt in the last decades is presented. Two econometric methodologies
are used. First a reduced regression model of one equation for the ratio of current
account to exports of goods and services and then to GDP is estimated for the period
1983-2006. The results of the regression analysis show that exogenous economic
shocks are relatively less important in explaining variations in the ratio of current
account over the period of estimation. Second, unrestricted VAR is used to assess the
impact of exogenous economic shocks on three endogenous variables. The impulse
responses of the variables to one standard deviation and the variance decomposition
show that exogenous shocks are more important in explaining the variations in the
main macroeconomic variables.
Key Words, exogenous shocks, current account, foreign terms of trade, real exchange
rate, 1 Associate Professor of Economics [email protected] [email protected]
Topics in Middle Eastern and African Economies Vol. 10, Sept 2008

1-Introduction
The Egyptian economy has gone through tremendous changes and has been subject to
considerable exogenous economic and political shocks in the last three decades
starting from the mid of the 1970s. However, the Egyptian experience in economic
development is unique. The Egyptian economy has been affected by exogenous
economic shocks that have hit non-oil developing countries since the 1970s in
different ways to reflect the economic transition the Egyptian economy has gone
through and to reflect foreign grants flowed steadily to Egypt and to reflect debt relief
provided to Egypt. In the 1970s, Egypt was considered as non-oil developing country.
By the mid of the 1980s oil production and exports have taken place. However, Egypt
was not classified as one of the big producers of oil. Since the 1970s and throughout
the 1990s, non- developing countries faced unfavorable events that affected stable
growth and weakened their management of economic problems in general and balance
of payments in particular. The most important exogenous economic shocks to non-
developing countries were the considerable fluctuations in the world market prices of
primary commodities with increases in oil prices which were reflected in the
deterioration in the terms of trade; the slowdown in economic activities in the
industrial countries which was caused recession in world trade and decline in export
volume for non-oil developing countries; sharp changes in the cost and the availability
of foreign finance which were expressed in the rise in real interest rates in
international capital markets and the decline in availability of foreign finance even
with high cost resulted from the decline of developing countries credibility.
Developing countries also faced exogenous in the form of sudden decline or sudden
Topics in Middle Eastern and African Economies Vol. 10, Sept 2008

stop of foreign grants. Since these foreign grants are considered as one of the main
sources of foreign exchange especially small developing countries in Africa, these
countries were obliged to reduce their spending or search for costly sources.
The Egyptian economy did not impact with these exogenous shocks in the same way
as other developing countries for number of reasons. First, Egypt has been a
permanent foreign aid receiver in all stages of its development either from Arab
countries until the mid of the 1970s or from western countries before 1967 and after
the mid of the 1970s. Foreign grants provide Egypt an ability to absorb all negative
effects of exogenous shocks. Besides, Egypt is not classified as a net-oil importer at
any phase of its growth. The Egyptian economy has moved from producing oil for
domestic consumption to oil –export by the mid of the 1980s. Moreover, Egypt is not
considered as a primary-commodity importer any more. Egypt was shocked by
crashes of oil prices in 1982 and 1986-1987. The crash of oil prices did not only affect
Egypt s export proceeds but also it affected its revenues from the Suez Canal, tourism
and workers remittances. On the other hand, we can also add that the Egyptian
government applied conservative and rigid exchange rate and monetary policies that
helped to offset negative effects of exogenous shocks.
Finally, being in the middle of a very disturbing area, Egypt has been subject to
various political external shocks. However, political external shocks such as the Gulf
war and the Iraqi war were accompanied with positive economic effects to Egypt.
After the Gulf war, Egypt has been granted by the Paris Club a considerable relief of
its outstanding foreign debts that were a great burden on the Egyptian economy in the
1980s.
Topics in Middle Eastern and African Economies Vol. 10, Sept 2008
After the Iraqi war, Egypt has been compensated through the U.N. food for oil
program. The Egyptian authorities received the monetary compensations in dollars
and paid them to workers in installments with Egyptian pounds.
The rest of the paper is arranged as follows. Section II presents some studies on
exogenous shocks to developing countries. Section III briefly describes the
development of current account, real GDP and fiscal deficit in Egypt and the main
variables suggested by the literature as the factors determining current account
behavior in developing countries. Section IV examines the impact of different
variables on the current account with a sample of time series data over the period
1983-2006. The data were first applied on a regression model and then with a vector-
auto regression method. Section V briefly summarizes the results.
II-Literature Review
Literature of the impact of exogenous shocks on the economic performance of
developing countries concentrates on studying the impact of external variables such as
terms of trade, real GNP of industrial countries and real interest rates in international
capital markets on major macroeconomic variables as real exchange rate and current
account to exports ratio.
Macroeconomic fluctuations in developing countries have been presented by Agenor,
Mcdermott and Prasad (2000). They show that real fluctuations in developing
countries is caused by external shocks in developed countries business cycles and by
changes in foreign real interest rate.
Hoffmaister and Roldos (1997) use panel data. They find that domestic aggregate
supply shocks are the most important sources of output fluctuations in the Asian and
Latin American countries.
Topics in Middle Eastern and African Economies Vol. 10, Sept 2008

Fackler and Rogers (1995), Reinhart (1995), Edwards and Vegh 9 (1997) and Montiel
(1997) have used empirical studies to distinguish between external and domestic
shocks for developing.
Ahmed (1999) studies the sources of economic fluctuations and their implications for
exchange rate regime in key Latin American countries. He used a six variable vector
auto regression (VAR) model and annual data from Argentina, Brazil, Chile,
Colombia, and Mexico over the period 183- 1999. Terms of trade, foreign output and
U.S. real interest rat are considered as the external variables and are affected by
external factors. Real exchange rate, output and the price level are affected by both
the domestic factors and the external variables. He finds that external shocks has
small role in causing real GDP fluctuations in these countries.
Ahmed, Ara, Hyder 2006 examine the sources of economic fluctuations in Pakistan
They use a structural vector auto-regression ( VAR) model to show that external
shocks are the most important source of economic fluctuations in Pakistan.
Khan and Knight (1983) examined the impact of both internal shocks and external
shocks on the current account balances of 32 non-oil developing countries during the
1970s. They considered that the fiscal deficit, and the appreciation of real effective
exchange as the internal shocks. External shocks are the deterioration in terms of
trade, the slow down of economic growth in developed countries and the increase in
foreign real interest rates. They used regression analysis for across- section time-
series sample of 32 non-oil developing countries from 1973- 1980. They find that the
two types of shocks are important in affecting the current account balances of the
countries.
Dorooian (1983) examined the impact of terms of trade, growth differential, real
foreign interest rate, real effective exchange rate, fiscal position ratio, and ratio of
Topics in Middle Eastern and African Economies Vol. 10, Sept 2008

total reserves to nominal value of imports on the current account in analytical groups
of non-oil countries. The analytical groups are the net oil exporter, major exporters of
manufactures, low-income countries and other net oil importers. He used annual data
from 1973 to 1980 to each group.
Balassa (1986) researched on the policy responses of developing countries to external
shocks in two periods; 1973- 78 and 1978- 83. Balassa (1986) classified developing
countries as outward and inward countries depending on their incentive policy toward
exports and imports. Developing countries that provide more support to import
substitution are classified as inward countries. Developing countries that provide
similar incentives to exports and to imports are classified as outward countries. Both
groups of developing countries include newly industrialized countries and less
developed countries. Egypt was classified as a less developed countries pursued
inward – oriented policies.
External shocks in the first period are terms of trade affected by the increases in oil
prices, and the effects of changes in export volume as a result of the slowdown of
world trade and recession in developed countries. In the second period external shocks
include interest rate increase in world financial markets.
Balassa (1986) showed that policy responses to external shocks took the form of
additional external net borrowing, increasing export market shares, import substitution
by decreasing the income elasticity of import demand and deflationary
macroeconomic policies which led to the decline in the growth of demand for imports.
Balassa 1986 found that outward- oriented countries suffered greater terms of trade
losses than inward- oriented countries during both periods of external shocks.
Inward- oriented countries s policy response in the first period took entirely the form
of additional net external financing. In the second period, inward- oriented countries
Topics in Middle Eastern and African Economies Vol. 10, Sept 2008

depended less on additional net external financing because they faced their
accumulated foreign indebtedness and high debit – service ratios. Outward – oriented
countries initially applied deflationary policies and later on they applied export
promotion and import substitution policies which led to increase in economic growth.
J.Fry and M.Lilian ( 1986 ) have considered monetary policy response to external oil-
price shocks of 1973-74 and 1979-80 of oil-importing countries.
They tested the medium and long – run effects of discretionary monetary policy by
using pooled time series data across 55 developed and developing countries.
They find that the more monetary policy is used to contain the effects of external oil
price shocks the less effective it becomes.
Tanzi (1986) has discussed the factors associated with external shocks to developing
countries, the effects of these shocks on fiscal variables and the policy response to
shocks.
According to Tanzi, the exogenous shocks to developing countries include changes in
the export earnings, changes in major import prices, changes in the cost of foreign
borrowing, changes in the availability of foreign credit, changes in the level of foreign
grants, changes in foreign workers remittances, changes in direct foreign in the level
of capital outflows by nationals.
Tanzi 1986 argued that exogenous shocks to developing countries can directly and
automatically affect fiscal variables which require policy response.
He also argued that for developing countries it is very important to distinguish the
changes in fiscal variables that reflect genuine policy responses from that reflect
automatic effects.
Tanzi 1986 argued that developing countries have limited control over its fiscal policy
and may not be able to use it to face external shocks because there is a strong link
Topics in Middle Eastern and African Economies Vol. 10, Sept 2008

between the budget and the foreign sector from the revenue side and the expenditure
side.
Some other literature concentrates only on the shocks of endogenous variables
especially supply shocks.2
III. An Overview of the Egyptian Economy
The Egyptian economy has gone through different structural changes since 1952. In
1956, the government nationalized the Suez canal company and paid huge
compensations to foreigners. In 1962, the government introduced the social laws
which provided state ownership and control on all revenues generated from different
economic sectors. The state controlled the agriculture sector, especially the
distribution of cotton; the main agriculture product. The state owned and operated the
banking sector. Private enterprises were nationalized and managed by the state. The
import-substitution industrialization model was adopted. The government provided
subsidies to basic needs goods including food, utilities, electricity and water.
In 1973, Egypt started a new economic system which was called Infitah or open door
policy. The intention was to open the door for foreign investment and to encourage
the private sector to undertake a prominent role in economic development.
The Egyptian economy witnessed huge foreign capital inflows between 1974 and
19853 due to number of factors; the rise in oil price which had a positive impact on
Egypt because of the increase in oil production, the reopening of Suez Canal, the
surge in workers remittances and the inflow of foreign aid. However, the massive
expansion in the public budget caused the persistency of fiscal deficits. The open door
2 See Ball,L. and Mankiw.G. 1995.Gordon,R. 1984. 3 Alssia, 2007
Topics in Middle Eastern and African Economies Vol. 10, Sept 2008
policy took the form of liberalizing the import sector enhanced with the overvaluation
of the exchange rate. Before4 May 11, 1987 the Central Bank managed the proceeds
and disbursements of foreign exchange in Egypt. The Central Bank pool received the
receipts of foreign exchange from the exports of petroleum, cotton and rice; Suez
Canal dues and Sumed pipeline royalties. The commercial banks pool which received
foreign exchange from workers remittances, tourism, and exports not included in the
Central Bank pool. And provided them for public sector need not included in the
central bank pool. A parallel and unofficial foreign exchange market was established
outside the banks market. The exchange rate in the market reflected the supply,
demand and risk premium conditions. The main sources of this market were workers”
remittances and tourism and provided foreign exchange for the private sector.
The 1980s were characterized with heavy external debts burden, high rate of inflation
exceeding 20 percent, chronic current account deficit and huge government fiscal
deficit. On May 11, 1987 a new bank foreign exchange market was established. The
commercial banks and two travel agents were permitted to undertake foreign
exchange transactions. Egypt began an economic reform program in the 1990s
including the ten reforms in Washington consensus and IMF prescription. Egypt
started two reform programs under the supervision of international organizations. The
Egyptian government signed an economic stabilization program with the International
Monetary Fund in May 1991 and a structural adjustment program with the World
Bank in November 1991. The reform programs succeeded to help Egypt to achieve
some financial and fiscal improvements. Inflation rate declined from almost 20
percent to one digit percent, interest rates on Egyptian Pound were liberalized, and
budget deficit was declined. On February 27, 1991, foreign exchange transactions
4 International financial statistics, Country Notes 2007.
Topics in Middle Eastern and African Economies Vol. 10, Sept 2008

were carried out through two markets; the primary market and the free market. On
October 8, 1991 the primary market was eliminated and the exchange rates were
unified, devalued and begged to the dollar. Egypt enjoyed a period of capital inflows
which were sterilized to avoid their inflationary effect. However, the program stopped
three years after the mid of the 1990s. The Asian financial crisis 1997 and its
extension to some Latin American Countries and to Russia in 1998 and 1999 formed
unfavorable external economic conditions for the Egyptian economy. Egypt witnessed
massive foreign capital outflows.
As the assumed success of the economic reform did not reach the average person in
Egypt, the period 1998- 2004 witnessed a slowdown in economic reform measures.
The period was characterized with directing the attention to institutional and legal
reforms to provide a solid basis for economic reform5. It also witnessed the focus on
signing trade agreements with Arab Countries, Asian Countries, European Countries
and the United States. The foreign exchange market was subject to disturbances and
instability since the end of 1999 but the Government intervention maintained the fixed
exchange rate. By 2001, the authorities allowed limited depreciation in the exchange
rate. The unofficial market in foreign exchange and the official multiple rates
reemerged in 2001 and 2002. In 2003, the exchange rate was depreciated to fluctuate
between 6-7 pounds for one American dollar afterwards, with the stagnation of the
economy and the deterioration in the per capita income, exchange rate stabilized
around 5.7 and 5.5 pounds per American Dollar. Egyptian cabinet began a new reform
program in 2004. The new reform program puts great emphasis on tariff and tax
reductions, applying new procedures for national budget to avoid off budget
5 Such as the real estate Mortgage Law, Export Laws, intellectual Property Rights Law, Special Economic Zones Laws,
Topics in Middle Eastern and African Economies Vol. 10, Sept 2008

expenditures. Privatization of public enterprises was revived. New economic
legislations were implemented.
Egypt has been a recipient of foreign aid since the 1960s and since the mid of the
1970s. The donors- countries are the United States, Western Europe, Japan and the
Gulf countries. 6
The US has provided Egypt with $1.3 billion a year on military aid since 1979 and
$815 million a year in economic assistance. The USAID program gives $ 200 million
cash to the Egyptian government. This money is supposed to solve problems related
to deregulations, privatization and free trade.
U.S continues with large assistance program for Egypt .U.S. provides finance for
many programs. After the 2003 Iraq war, a portion of U.S. government assistances
took the form of bond guarantees conditioned on Egyptian compliance with series of
economic reforms. Upon fulfilling these conditions, U.S. government provides Egypt
with bond guarantees which enabled the Egyptian government to issue $ 1.5 billion
10-year bonds in September 2005. U.S. agrees to import products from Egypt without
tariffs if they have been produced in a qualified industries Zones and 11.7% of the
inputs of these products originate from Israel.
It has been argued that foreign aid has not helped Egypt to achieve the
characterization of newly industrialized countries. It has also been argued that foreign
aid helped Egypt to avoid real economic reform.7
6 Mustafa Kamal Al-Sayed, 2001 7 www.csmonitor.com
Topics in Middle Eastern and African Economies Vol. 10, Sept 2008

Foreign Aid to Egypt8
(Millions of Dollars)
Year Economic Military
Military Education and
Training (IMET)
Total
As a percentage of GDP
%
1948-1997 23,288.6 22,353.5 27.3 45,669.4 .------
1998 815.0 1,300.0 1.0 2,116.0 2.4891999 775.0 1,300.0 1.0 2,076.0 2.2412000 727.3 1,300.0 1.0 2,028.3 2.1462001 695.0 1,300.0 1.0 1,996.0 2.4982002 655.0 1,300.0 1.0 1,956.0 2.3232003 911.0 1,300.0 1.2 2,212.2 3.2312004 571.6 1,292.3 1.4 1865.3 2.2442005 530.7 1,289.6 1.2 1,821.5 1.9272006 495.0 1,300.0 1.2 1,796.2 1.657Total 29,464.2 34,035.4 37.3 63,536.9 -----
Source: Jewish Virtual Library 2007
Real GDP growth averaged around 3.8 in the 1990s and jumped to 6.1 by 1999. Real
GDP growth fluctuated during the following years until it rises to 6.8 in 2006.(table 1)
. Egypt fiscal position is improving with deficits improving.
Inflation reached 12.3 percent in the period 1989-1998. The inflation rate declined
afterwards and reached its lowest level in 2000 and 2001. However, inflation rate
witnessed another rise in 2004 and 2005 when it reached 8.8 percent. The inflation
showed a second decline in 2006.
8 www.jewishvirtuallibrary.org
Topics in Middle Eastern and African Economies Vol. 10, Sept 2008

Current account as a percentage of GDP improved from -1.9 percent to 4.3 in 2004 to
witness another decline in 2005 and 2006 when it reaches a very positive ratio 0.8.
Table 3
Macroeconomic Indicators for Egypt
Annual percent Change
Average
1989-98
1999 2000 2001 2002 2003 2004 2005 2006
Real GDP Growth 3.7 6.1 5.4 3.5 3.2 3.2 4.1 4.5 6.8
Inflation
Current account
% GDP
Consumer
prices
12.3
12.3
3.7
-1.9 3.7
2.8
-1.2 2.8
2.4
- 2.4
2.4
0.7 2.4
3.2
2.4 3.2
8.1
4.3 8.1
8.8 4.2
3.2 0.8
8.8 4.2
World Economic Outlook 2007
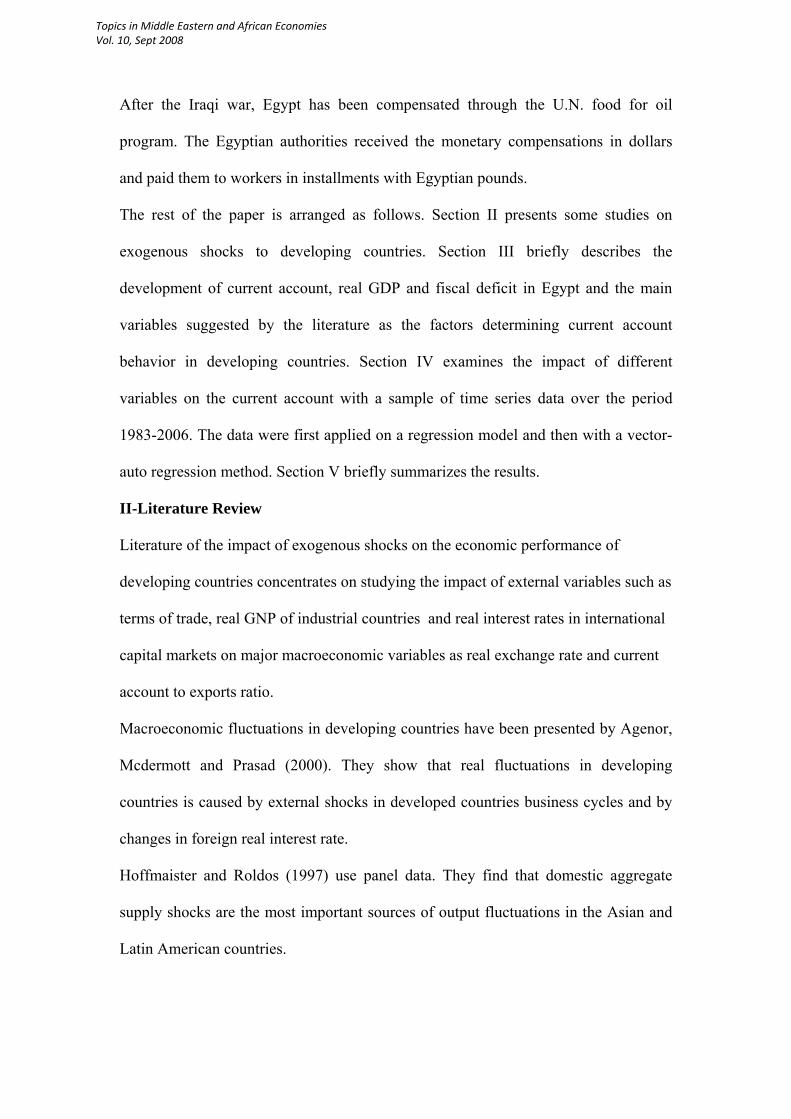
Debt to GNP was higher than 100 percent by the end of the 1980s and debt service
was higher than 30 percent of exports.9 Due to implementation of serious reform
program in the 1990s and debt relief provided to Egypt by Paris Club, Debt indicators
improved. Debt to GNP ratio declined to 39 percent in 1997 and debt service to
exports ratio declined to 8.9 percent.
9 Agenor,Diwan and Kibbi,2000.
Topics in Middle Eastern and African Economies Vol. 10, Sept 2008

Figure 1:The current Account to GDP Ratio
-2
0
2
4
6
8
10
75 80 85 90 95 00 05
CURRENTTACCEGPY The Consumer Price Index
0
50
100
150
200
75 80 85 90 95 00 05
CPI1995
80
120
160
200
240
75 80 85 90 95 00 05
INDIXTERMSDEVE Fiscal Position to GDP Ratio
-0.30
-0.25
-0.20
-0.15
-0.10
-0.05
0.00
0.05
75 80 85 90 95 00 05
GOVDY1
Topics in Middle Eastern and African Economies Vol. 10, Sept 2008

IV. Data and Methods Exogenous economic shocks are presented by changes in terms of trade, industrial
countries GDP and foreign interest rate. Economic performance is presented by
changes in major macroeconomic variables; current account, real GDP growth, the
inflation rate, the fiscal position and total reserves minus goods as a percentage of
imports of goods and services.
Data The data for terms of trade are not available for Egypt. The terms of trade are
presented by the percent of change in terms of trade for non-oil developing countries,
terms of trade index for developing countries and the ratio of the international price of
long cotton to the price of wheat. Foreign output is the annual change of GDP for
industrial countries. Real foreign interest rate is percent change in real U.S. deposit
rate. Real exchange rate for Egypt is the market exchange rate deflated by the
consumer price index. Domestic output is real GDP and is measured as the market
value of GDP deflated by the consumer price index. Non-gold official reserves as a
ratio of imports of goods and services are also measured.
The inflation rate is the natural logarithm of CPI. The fiscal position is the ratio of
fiscal deficit/surplus to GDP.
The sources of the data are International financial Statistics different issues, World
Economic Outlook and Balance of Payments Statistics, different issues, IMF.
The Augmented Dickey-Fuller Unit Root Test
To assess the stationary of the time series data, the Augmented Dicky-Fuller unit root
test is used. The first difference of the time series data are regressed against the one
year lag of the series, the lagged difference terms and a constant and a time trend.
Δ Xt = ß1 Xt-1 + ß2 ΔXt-1 + ß3 ΔXt-2 + ß4 + ß5t
If the coefficient of Xt-1 is significantly different than zero, then the hypothesis that X
contains a unit root is rejected and the stationary is accepted.
Since all the variables used in the estimation are either log-levels or percentage
changes, they are found to be stationary series.10
10 The results are provided in the appendix.
Topics in Middle Eastern and African Economies Vol. 10, Sept 2008

A Simple Reduced Form Model
First, a simple regression model is used where the current account ratio to GDP or to
exports of goods and services is measured to estimate the relative importance of
exogenous shocks as explanatory factors to current account development for the
period 1983-2006. Different versions of the current account model have been used.
The dependent variable in all these versions is the current account balance scaled by
exports of goods and services and then by GDP. This simple model depends on the
work of S.Khan and D.Knight (1983) and the extension of their model by Doroodian
(1985). The model can be considered as unrestricted reduced model and is derived
from a structural model of the components of current account which are the imports of
goods and services and the exports of goods and services11. Khan and Knight (1983).
The model is :
CA/X = f( TOT, DIFYY , RER, FIR, FB/Y, RES/M) (1)
Where
CA = current account balance
X = nominal exports of goods and services
TOT = terms of trade for non-oil developing countries taken first as rate of
change then the index is used.
DIFYY = difference between the rate of change of GDP in industrial and that of
Egypt.
RER = real exchange rate of Egypt where the consumer price index is used to
deflate the market exchange rate.
IR = the deposit interest rate of USA. position to GDP
RES/M= non-gold reserves to nominal imports
FB/Y = the ratio of fiscal budget of goods and services ratio.
In the light of the previous section discussion one would expect an improvement in
the terms of trade, or an increase in the difference between the growth rates of GDP
between industrial countries and Egypt or the improvement in the fiscal position
would improve the current account balance while the rise in the foreign interest, an
appreciation of real exchange rate or the increase in the ratio .
The specific form of equation (1) is given by equation (2).
11 See Khan and Knight.(1983)
Topics in Middle Eastern and African Economies Vol. 10, Sept 2008
CA/X = a + bΔTOT + cGDPVMIND + d RER + e FIR + f FPY + U (2)
CA/Y = a + b TOT + c GDPVMIND + d RER + e FIR + f FPY + g( RES/M)(-1)
(3)12
Different versions of equations (2) and (3) were estimated.
The Results The different versions of equation (2) were estimated with using time-
series data for Egypt for the period of 1983-2006.
The results for the different versions of equation (2) are shown in table (2 ).
An attempt13 has been done to estimate equation (2) containing only the three
exogenous variables, all the three variables yield insignificant coefficients and the
adjusted coefficient of determination was quite low. In equation 2.1 which includes
only the endogenous variables, all three variables have coefficients significantly
different from zero at the 5 percent level. However, the rate of growth of GDP and the
fiscal position as a ratio to GDP have unexpected signs. The negative effect of the
rate of growth of GDP on current account could be explained that economic
expansion would encourage imports. The positive effect of fiscal position on the
current account has one explanation is that the improvement in Egypt’s fiscal budget
and relying on domestic market to finance the fiscal deficit. Equation 2.2 includes
three exogenous variables; the terms of trade, the real foreign interest and the foreign
output and two endogenous variables; the real exchange rate and the fiscal position.
All exogenous variables are significantly different from zero at 5 percent level with
expected signs. The real exchange rate is insignificant and the fiscal position is
significant with a positive sign. This may indicate the positive impact of fiscal
improvement Egypt has witnessed after execution of economic reform program which
concentrates on financial adjustment. It may also indicate the government dependency
on internal finance of fiscal budget. Equation 2.3 used current account to GDP ratio
as a dependent variable instead of current account to exports of goods and services
ratio. This does not affect the significant of variables and their signs. Equation 2.4
contains the ratio of non-gold reserves as a dependent endogenous variable and it
excludes the rate of growth of GDP. The new variable is significantly different from
zero and with a negative sign. This is probably because the source of foreign reserves
is non-export earnings. Egypt’s ability to import depends on foreign reserves from
foreign grants. 12 Doroodian 1985 used this equation as an extended model of Khan and knight 1983 model. 13 This attempt is not included.
Topics in Middle Eastern and African Economies Vol. 10, Sept 2008

Table 2: Results For Current account Balance of Egypt :1983-12006
Equation
Number
Constant TOT DIFYY FIR GGDP RER RESM FBY R2 SEE
2.1 0.00053
(11.88)
-7.15
(-11.18)
0.00044
( 1.49)
0.00032
‘( 2.74)
0.87 1.58
2.2 0.00058
( 13.6)
2.54
( 2.92)
4.81
( 1.19)
-3.9
(-2.4)
0.0002
(0.74)
0.00029
(3.09)
0.934 1.15
2.3 23.37
(13.08)
0.0099
(2.7)
0.203
(1.2)
-
0.156
(-
2.34)
-3.18
(-15.12)
9.39
(0.822)
9.95
(2.48)
0.94 0.48
2.4 -0.19
(-6.8)
0.0002
(3.56)
0.0055
(2.7)
0.002
(1.05)
2.83
(7.9)
-0.03
(-1.4)
-0.38
(-1.4)
0.97 0.006
Dependent variable in equation 2.3 is the ratio of the current account to GDP of goods
and services. Dependent variable in equations 2.1,2.2 and 2.4 and is the ratio of
current account to exports. R2 is the adjusted coefficient of determination, T-values
are in the parentheses, and SEE is the standard error of the equation. Terms of trade in
equation 2.4 are the percentage changes in terms of trade for non-oil developing
countries.
Extended model (table3)
Constant F/y TOT GDPF FIR LogGDP RER Rese/M(-
1)
Adjusted
R2
SEE
3.1 25.6
(10.63)
14.5
(2.1)
-.015
(-
3.19)
0.26
(1.5)
-3.312
(-13.9)
17.6
(1.38)
-5.1
(-2.04)
0.90 0.55
3.2 27.2
(13.2)
14.7
(2.3)
-
0.013
(-2.5)
0.27
(1.6)
-
0.134
(-
1.58)
-3.3
(-14.18)
-5.24
(-2.19)
0.91 0.54
Topics in Middle Eastern and African Economies Vol. 10, Sept 2008

The dependent variable is current account as a percentage of nominal GDP. T
values are in parentheses. The adjusted are Square is provided.
The unexpected signs for log real GDP and for the percentage of total non-gold
reserves to imports of goods and services could be explained as the growth of
GDP and the availability of foreign reserves stimulate imports.
Vector Auto-Regression Model
Vector auto regression (VARs): A restricted VARs14 of three exogenous variables;
terms of trade, differences in growth between industrial countries and Egypt and
foreign interest rate and three endogenous variables; the ratio of current account to
exports of goods and services, real exchange rate and growth rate of real GDP. In a
restricted VARs exogenous are allowed to impact the endogenous variables only
directly and not indirectly through the other endogenous variables. The annual data
lags up to one year. The three equations of the model are constrained to be linear in
the lagged values of all endogenous variables and in lagged values of exogenous
variables. In the first VARs the endogenous variables are the ratio of current account
balance to GDP, the growth rate of GDP and the ratio of non-gold reserves to imports
of goods and services. The exogenous variables are the percentage change in
industrial countries GDP, the index of terms of trade for non-oil developing countries
and foreign interest rate.
The model can be estimated with OLS since there are no unlagged endogenous
variables on the right side of the equation and since the endogenous and exogenous
variables on the right side are the same in all equations. Due to data limitations, one
year lag was used for both the endogenous and exogenous variables.
The VAR model can be written as:
Yit =A (L) ∑Y(t-1) + Uit (3)
Where A(L) is a matrix polynomial in the lag operator L and Uit is the time t seriaaly
independent innovations to variable i. and var(Ut) =∑ is a diagonal variance matrix of
Uit. To recover the mutually uncorrelated structural shocks and the structural
parameters from the estimated reduced form parameters and the reduced form
residuals the reduced form residuals are orthogonalized by Cholesky decomposition.
14 The VAR model was introduced by Sims (1972,1980)
Topics in Middle Eastern and African Economies Vol. 10, Sept 2008

This method assumes that contemporaneous structural parameters have recursive
structures which take the form:
et =A (0)ut (4)
The specific model estimated is :
CX = A0 + A1 CX(-1) + A2 GGDP(-1) + A3 RER(-1) + A4 GDPVIND(-1) + A5
TOT (-1) + A6 FIR(-1) + U (5)
Annual data over the years 1983-2006 are used to estimate equation (5), with one year
lag because of data limitations.
Many attempts were undertaken to estimate the VAR model. Some of the results are
presented here. The first attempt introduced all variables as endogenous with one year
lag in the following order ; terms of trade , percentage change in GDP of industrial
countries, foreign interest rate, percent of current account to GDP , log real GDP, total
reserves minus gold to imports of goods and services ratio, fiscal position.
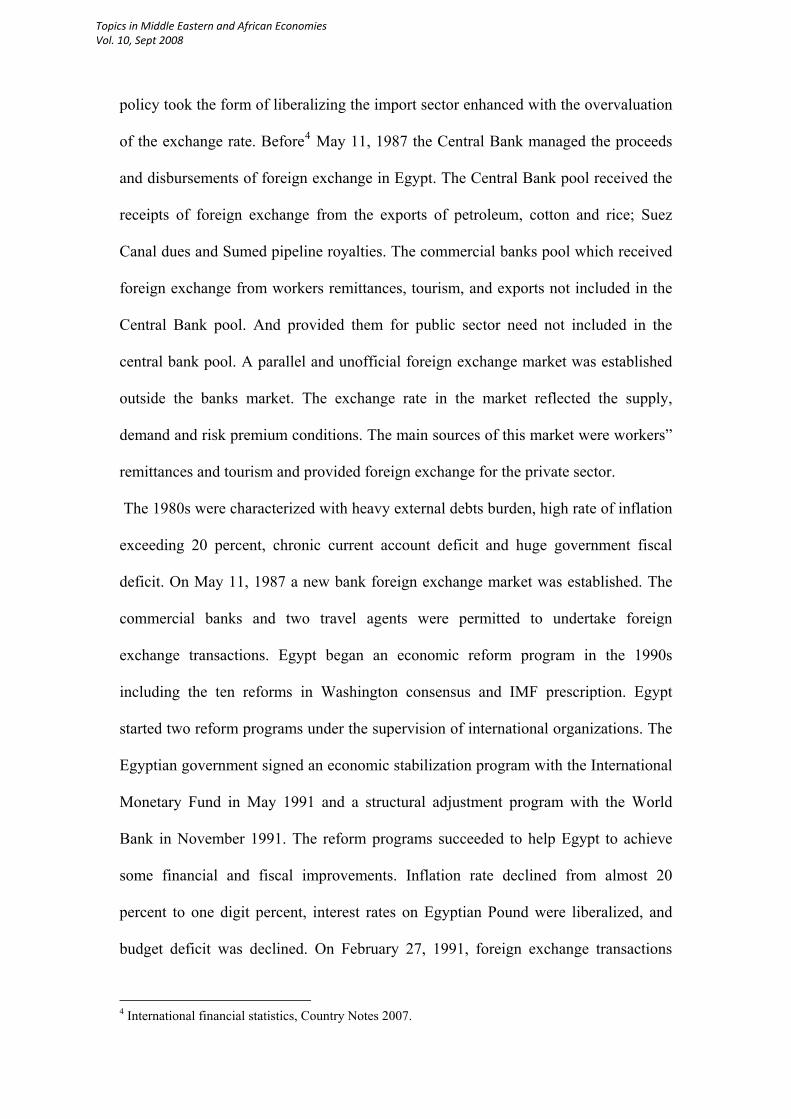
The Impulse responses
The impulse responses present the dynamic responses of the variables to major
economic shocks in relation with the time since the occurrence of the shock. It shows
the responses of the variables to a one-standard deviation of other variables shocks.
The impulse response is represented by the dark lines in figure 2. The dashed lines
represent 1.67 standard error bands or 90 percent confidence intervals. The first
column represents the impulse responses of terms of trade to itself and to other
variables in the VAR. The second column is for GDP of industrial countries impulse
responses, The third for foreign interest rate response. The fourth column for current
account to GDP ratio, the fifth for log GDP, the sixth one for total reserves to imports
ratio and the last column for the fiscal position impulse responses.
Topics in Middle Eastern and African Economies Vol. 10, Sept 2008
- 1 5
- 1 0
- 5
0
5
1 0
1 5
2 0
1 2 3 4 5 6 7 8 9 1 0
Re sp o ns e o f TO T3 t o TO T3
- 1 5
- 1 0
- 5
0
5
1 0
1 5
2 0
1 2 3 4 5 6 7 8 9 1 0
Response of TO T3 t o G DPVM I ND
- 1 5
- 1 0
- 5
0
5
1 0
1 5
2 0
1 2 3 4 5 6 7 8 9 1 0
Re sp o ns e o f TO T3 t o FI R
- 1 5
- 1 0
- 5
0
5
1 0
1 5
2 0
1 2 3 4 5 6 7 8 9 1 0
Re sp o ns e o f TO T3 t o CY
- 1 5
- 1 0
- 5
0
5
1 0
1 5
2 0
1 2 3 4 5 6 7 8 9 1 0
Response of TO T3 t o LO G REALG DP
- 1 5
- 1 0
- 5
0
5
1 0
1 5
2 0
1 2 3 4 5 6 7 8 9 1 0
Response of TO T3 t o TO TRESEI M P
- 1 5
- 1 0
- 5
0
5
1 0
1 5
2 0
1 2 3 4 5 6 7 8 9 1 0
Response of TO T3 t o G O VDY
- 0 . 4
- 0 . 2
0 . 0
0 . 2
0 . 4
0 . 6
0 . 8
1 . 0
1 2 3 4 5 6 7 8 9 1 0
Response of G DPVM I ND t o TO T3
- 0 . 4
- 0 . 2
0 . 0
0 . 2
0 . 4
0 . 6
0 . 8
1 . 0
1 2 3 4 5 6 7 8 9 1 0
Response of G DPVM I ND t o G DPVM I ND
- 0 . 4
- 0 . 2
0 . 0
0 . 2
0 . 4
0 . 6
0 . 8
1 . 0
1 2 3 4 5 6 7 8 9 1 0
Response of G DPVM I ND t o FI R
- 0 . 4
- 0 . 2
0 . 0
0 . 2
0 . 4
0 . 6
0 . 8
1 . 0
1 2 3 4 5 6 7 8 9 1 0
Response of G DPVM I ND t o CY
- 0 . 4
- 0 . 2
0 . 0
0 . 2
0 . 4
0 . 6
0 . 8
1 . 0
1 2 3 4 5 6 7 8 9 1 0
Response of G DPVM I ND t o LO G REALG DP
- 0 . 4
- 0 . 2
0 . 0
0 . 2
0 . 4
0 . 6
0 . 8
1 . 0
1 2 3 4 5 6 7 8 9 1 0
Response of G DPVM I ND t o TO TRESEI M P
- 0 . 4
- 0 . 2
0 . 0
0 . 2
0 . 4
0 . 6
0 . 8
1 . 0
1 2 3 4 5 6 7 8 9 1 0
Response of G DPVM I ND t o G O VDY
- 1 . 0
- 0 . 5
0 . 0
0 . 5
1 . 0
1 . 5
1 2 3 4 5 6 7 8 9 1 0
Re sp o ns e o f FI R t o TO T3
- 1 . 0
- 0 . 5
0 . 0
0 . 5
1 . 0
1 . 5
1 2 3 4 5 6 7 8 9 1 0
Response of FI R t o G DPVM I ND
- 1 . 0
- 0 . 5
0 . 0
0 . 5
1 . 0
1 . 5
1 2 3 4 5 6 7 8 9 1 0
Re sp o ns e o f FI R t o FI R
- 1 . 0
- 0 . 5
0 . 0
0 . 5
1 . 0
1 . 5
1 2 3 4 5 6 7 8 9 1 0
Re sp o ns e o f FI R t o CY
- 1 . 0
- 0 . 5
0 . 0
0 . 5
1 . 0
1 . 5
1 2 3 4 5 6 7 8 9 1 0
Response of FI R t o LO G REALG DP
- 1 . 0
- 0 . 5
0 . 0
0 . 5
1 . 0
1 . 5
1 2 3 4 5 6 7 8 9 1 0
Re sp o ns e o f FI R t o TO TRESEI M P
- 1 . 0
- 0 . 5
0 . 0
0 . 5
1 . 0
1 . 5
1 2 3 4 5 6 7 8 9 1 0
Response of FI R t o G O VDY
- 1 . 5
- 1 . 0
- 0 . 5
0 . 0
0 . 5
1 . 0
1 . 5
2 . 0
1 2 3 4 5 6 7 8 9 1 0
Re sp o ns e o f CY t o TO T3
- 1 . 5
- 1 . 0
- 0 . 5
0 . 0
0 . 5
1 . 0
1 . 5
2 . 0
1 2 3 4 5 6 7 8 9 1 0
Response of CY t o G DPVM I ND
- 1 . 5
- 1 . 0
- 0 . 5
0 . 0
0 . 5
1 . 0
1 . 5
2 . 0
1 2 3 4 5 6 7 8 9 1 0
Re sp o ns e o f CY t o FI R
- 1 . 5
- 1 . 0
- 0 . 5
0 . 0
0 . 5
1 . 0
1 . 5
2 . 0
1 2 3 4 5 6 7 8 9 1 0
Re sp o ns e o f CY t o CY
- 1 . 5
- 1 . 0
- 0 . 5
0 . 0
0 . 5
1 . 0
1 . 5
2 . 0
1 2 3 4 5 6 7 8 9 1 0
Response of CY t o LO G REALG DP
- 1 . 5
- 1 . 0
- 0 . 5
0 . 0
0 . 5
1 . 0
1 . 5
2 . 0
1 2 3 4 5 6 7 8 9 1 0
Response of CY t o TO TRESEI M P
- 1 . 5
- 1 . 0
- 0 . 5
0 . 0
0 . 5
1 . 0
1 . 5
2 . 0
1 2 3 4 5 6 7 8 9 1 0
Response of CY t o G O VDY
- 0 . 6
- 0 . 4
- 0 . 2
0 . 0
0 . 2
0 . 4
1 2 3 4 5 6 7 8 9 1 0
Response of LO G REALG DP t o TO T3
- 0 . 6
- 0 . 4
- 0 . 2
0 . 0
0 . 2
0 . 4
1 2 3 4 5 6 7 8 9 1 0
Response of LO G REALG DP t o G DPVM I ND
- 0 . 6
- 0 . 4
- 0 . 2
0 . 0
0 . 2
0 . 4
1 2 3 4 5 6 7 8 9 1 0
Response of LO G REALG DP t o FI R
- 0 . 6
- 0 . 4
- 0 . 2
0 . 0
0 . 2
0 . 4
1 2 3 4 5 6 7 8 9 1 0
Response of LO G REALG DP t o CY
- 0 . 6
- 0 . 4
- 0 . 2
0 . 0
0 . 2
0 . 4
1 2 3 4 5 6 7 8 9 1 0
Response of LO G REALG DP t o LO G REALG DP
- 0 . 6
- 0 . 4
- 0 . 2
0 . 0
0 . 2
0 . 4
1 2 3 4 5 6 7 8 9 1 0
Response of LO G REALG DP t o TO TRESEI M P
- 0 . 6
- 0 . 4
- 0 . 2
0 . 0
0 . 2
0 . 4
1 2 3 4 5 6 7 8 9 1 0
Response of LO G REALG DP t o G O VDY
- 0 . 0 4
- 0 . 0 2
0 . 0 0
0 . 0 2
0 . 0 4
1 2 3 4 5 6 7 8 9 1 0
Response of TO TRESEI M P t o TO T3
- 0 . 0 4
- 0 . 0 2
0 . 0 0
0 . 0 2
0 . 0 4
1 2 3 4 5 6 7 8 9 1 0
Response of TO TRESEI M P t o G DPVM I ND
- 0 . 0 4
- 0 . 0 2
0 . 0 0
0 . 0 2
0 . 0 4
1 2 3 4 5 6 7 8 9 1 0
Re sp o ns e o f TO TRESEI M P t o FI R
- 0 . 0 4
- 0 . 0 2
0 . 0 0
0 . 0 2
0 . 0 4
1 2 3 4 5 6 7 8 9 1 0
Response of TO TRESEI M P t o CY
- 0 . 0 4
- 0 . 0 2
0 . 0 0
0 . 0 2
0 . 0 4
1 2 3 4 5 6 7 8 9 1 0
Response of TO TRESEI M P t o LO G REALG DP
- 0 . 0 4
- 0 . 0 2
0 . 0 0
0 . 0 2
0 . 0 4
1 2 3 4 5 6 7 8 9 1 0
Response of TO TRESEI M P t o TO TRESEI M P
- 0 . 0 4
- 0 . 0 2
0 . 0 0
0 . 0 2
0 . 0 4
1 2 3 4 5 6 7 8 9 1 0
Response of TO TRESEI M P t o G O VDY
- 0 . 0 1 5
- 0 . 0 1 0
- 0 . 0 0 5
0 . 0 0 0
0 . 0 0 5
0 . 0 1 0
0 . 0 1 5
1 2 3 4 5 6 7 8 9 1 0
Response of G O VDY t o TO T3
- 0 . 0 1 5
- 0 . 0 1 0
- 0 . 0 0 5
0 . 0 0 0
0 . 0 0 5
0 . 0 1 0
0 . 0 1 5
1 2 3 4 5 6 7 8 9 1 0
Response of G O VDY t o G DPVM I ND
- 0 . 0 1 5
- 0 . 0 1 0
- 0 . 0 0 5
0 . 0 0 0
0 . 0 0 5
0 . 0 1 0
0 . 0 1 5
1 2 3 4 5 6 7 8 9 1 0
Response of G O VDY t o FI R
- 0 . 0 1 5
- 0 . 0 1 0
- 0 . 0 0 5
0 . 0 0 0
0 . 0 0 5
0 . 0 1 0
0 . 0 1 5
1 2 3 4 5 6 7 8 9 1 0
Response of G O VDY t o CY
- 0 . 0 1 5
- 0 . 0 1 0
- 0 . 0 0 5
0 . 0 0 0
0 . 0 0 5
0 . 0 1 0
0 . 0 1 5
1 2 3 4 5 6 7 8 9 1 0
Response of G O VDY t o LO G REALG DP
- 0 . 0 1 5
- 0 . 0 1 0
- 0 . 0 0 5
0 . 0 0 0
0 . 0 0 5
0 . 0 1 0
0 . 0 1 5
1 2 3 4 5 6 7 8 9 1 0
Response of G O VDY t o TO TRESEI M P
- 0 . 0 1 5
- 0 . 0 1 0
- 0 . 0 0 5
0 . 0 0 0
0 . 0 0 5
0 . 0 1 0
0 . 0 1 5
1 2 3 4 5 6 7 8 9 1 0
Response of G O VDY t o G O VDY
Response t o O ne S. D. I nnovat ions ± 2 S. E.
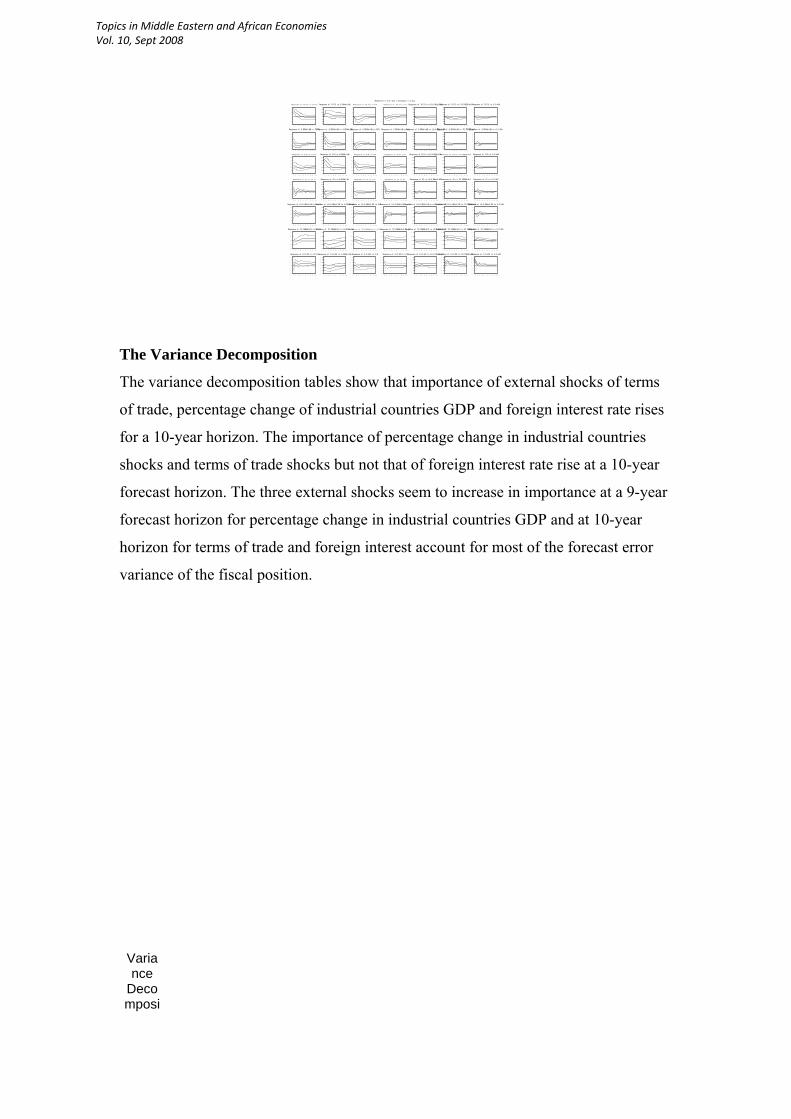
The Variance Decomposition
The variance decomposition tables show that importance of external shocks of terms
of trade, percentage change of industrial countries GDP and foreign interest rate rises
for a 10-year horizon. The importance of percentage change in industrial countries
shocks and terms of trade shocks but not that of foreign interest rate rise at a 10-year
forecast horizon. The three external shocks seem to increase in importance at a 9-year
forecast horizon for percentage change in industrial countries GDP and at 10-year
horizon for terms of trade and foreign interest account for most of the forecast error
variance of the fiscal position.
Variance
Decomposi
Topics in Middle Eastern and African Economies Vol. 10, Sept 2008

tion of CY:
Period
S.E. TOT3 GDPVMIND FIR CY
1 1.423742 6.541652 4.314920 4.749274 84.39415 2 1.647591 8.687021 16.69672 6.406716 63.08298 3 1.721135 10.07079 18.45694 6.093572 57.88638 4 1.740743 10.01045 19.41019 6.163971 56.58966 5 1.759277 11.10026 19.05284 6.356879 55.40363 6 1.768023 11.32437 18.87325 6.712654 54.85842 7 1.775920 11.53058 18.70794 6.957387 54.37497 8 1.780833 11.55076 18.60683 7.089470 54.09254 9 1.785082 11.54936 18.53043 7.131174 53.87966 10 1.789046 11.51556 18.47172 7.131059 53.70863
Variance
Decomposition of LOGREALGDP:
Period
S.E. TOT3 GDPVMIND FIR CY
1 0.388308 6.763725 4.399905 2.746551 85.31481 2 0.448497 7.938231 15.56943 5.658767 63.99438 3 0.470792 9.429078 16.98915 5.539897 58.60051 4 0.478930 9.386179 17.49349 5.685758 56.84443 5 0.487335 10.48855 16.90367 5.937499 55.12673 6 0.493650 10.64674 16.47845 6.320256 53.91868 7 0.500101 10.73837 16.10050 6.551897 52.82607 8 0.506056 10.60470 15.77113 6.631993 51.96778 9 0.512084 10.43229 15.48173 6.594025 51.23405 10 0.518254 10.21634 15.22071 6.497161 50.57607
Variance
Decomposition of
Topics in Middle Eastern and African Economies Vol. 10, Sept 2008

GOVDY:
Period
S.E. TOT3 GDPVMIND FIR CY
1 0.011765 6.768627 12.73053 1.219711 7.439568 2 0.015297 13.87435 15.62571 4.248845 4.444264 3 0.017472 11.26157 25.15624 7.011008 3.738740 4 0.019260 12.83210 27.76893 8.403091 3.258855 5 0.020384 13.37463 29.37527 9.735445 3.157469 6 0.021203 14.66702 29.21273 10.83072 3.115595 7 0.021714 15.43378 28.88642 11.81006 3.135018 8 0.022046 16.05933 28.44348 12.52904 3.138286 9 0.022238 16.41160 28.11622 13.02310 3.131947 10 0.022349 16.62590 27.87562 13.31800 3.115047
Topics in Middle Eastern and African Economies Vol. 10, Sept 2008

Conclusion
The paper purpose is to estimate the impact of exogenous shocks on the main
macroeconomic variables. The results show that all three exogenous shocks are
significant with the expected sign. Endogenous shocks are also important
interpretation of economic fluctuations. However, some endogenous shocks come
with unexpected sign. When exogenous shocks are examined separately, they were
not significant. An important exogenous variable was omitted because of lack of data.
The foreign grants Egypt has received during all its distinguished periods play the role
of a buffer against the impact of exogenous shocks. A reduced regression model of
current account ratio shows that changes in domestic variables are more important in
explaining the behavior of current account to GDP or to exports ratio. However, a
dynamic VAR model shows that shocks to exogenous variables are more important.
Attempts also should be done to take account of the different economic policies
applied. This could be presented by dummy variables that take zero in years before
implementing economic reform program in the 1991 and take one afterwards.
Topics in Middle Eastern and African Economies Vol. 10, Sept 2008

References
Ahmed, Shaghil,”” Sources of Economic Fluctuations in Latin America and
Implications for Choice of Exchange Rate Regimes” Board of Governors of the
Federal Reserve System, International Finance Division, No.656.December 1999.
Ahmed, Shaghil, Ara, Iffat and Hyder, Kalim”” How External Shocks and Exchange
Rate Depreciation Affect Pakistan? Implications for Choice of an Exchange Rate
Regime.” SBP-Research Bulletin Volume 2, No.1.2006.
Agenor ,P.,diwan.I,and Al-Kibbi,Jamal.”’ Non-Dent financing of Development in
MENA. 2000
Alissa, Sufyan. ”’The Political economy of reform in Egypt: Understanding the Role
of Institutions”” www.carnegieendowment.org
Balassa, Bela “” Policy Responses to Exogenous Shocks in Developing Countries””
The American Economic Review, Vol.76,No.2, Papers and Proceedings of the
Ninety-Eighth Annual Meeting of the American Association. May 1986, pp75-78
Doroodian, Khorow “” Determinants of Current Account Balances of Non-Oil
Developing Countries in the 1970: Comment on Khan and Knight”” Staff Papers-
International Monetary Fund, Vol.32, No.1.(Mar.,1985),pp160-164..
Ball,L.;Mankiw,G. “ Relative – Price Changes as Aggregate Supply Shocks”’
Vol.110,No.1. Feb.1996.pp 161-193 The quarterly journal Of Economics.
Gordon, Robert “’ Supply Shocks and Monetary Policy Revisited”’ The American
Economic Review,Vol.74,No.2,Ppers and proceedings of the Ninety-Sixth Annual
Meeting of the American Economic Association.(May,1984),pp.38-43.
Topics in Middle Eastern and African Economies Vol. 10, Sept 2008
J.Fry, Maxwell and M.Lilien, David “” Monetary Policy Responses to Exogenous
Shocks “The American Economic Review, Vol.76, No.2, Papers and Proceedings of
the Ninety-Eighth Annual Meeting of the American Association. May. 1986, pp79-83.
Khan, Mohsin, “ Developing Country Exchange Rate Policy Responses to Exogenous
Shocks “ The American Economic Review, Vol.76,No.2, Papers and Proceedings of
the Ninety-Eighth Annual Meeting of the American Association. May 1986, pp84-87.
“Determinants of Current account Balances of Non-Oil
Developing Countries in the 1970s: An Empirical Analysis “’ Staff papers-IMF
Vol.30,No 4 (Dec.1983) , pp.819-842.
Kamal, Mustafa. “” What Have We Done With U.S. Aid?””Al - Ahram Weekly On
line .21-27. June. 2001..Issue Number 539.
Tanzi, Vito, “Fiscal Policy Responses to Exogenous Shocks in Developing Countries”
The American Economic Review, Vol, 76, No.2 Papers and Proceedings of the
Ninety- Eighth Annual Meeting of the American Economic Association.(May, 1986),
pp. 88- 91.
Topics in Middle Eastern and African Economies Vol. 10, Sept 2008

Topics in Middle Eastern and African Economies Vol. 10, Sept 2008