Embed Size (px)
Citation preview
Exit from aidAn analysis of country experiencesLars Engen and Annalisa Prizzon
April 2019
Report

Readers are encouraged to reproduce material for their own publications, as long as they are not being sold commercially. ODI requests due acknowledgement and a copy of the publication. For online use, we ask readers to link to the original resource on the ODI website. The views presented in this paper are those of the author(s) and do not necessarily represent the views of ODI or our partners.
This work is licensed under CC BY-NC-ND 4.0.
Cover photo: Sao Paulo, Brazil. © Jared Yeh.
3
Acknowledgements
This report is the outcome of a year-long research project that started in summer 2017 and was completed in summer 2018. The project benefited from the thoughtful and generous contributions of several colleagues and institutions from around the world.
First, we thank our current and former colleagues and associates at the Overseas Development Institute (ODI) who contributed to and reviewed the research in its early stages, including our preliminary analysis, literature review and research framework (Catherine Blampied, Marco Cangiano, Raphaëlle Faure, Nilima Gulrajani, Kiyoshi Kodera and Andrew Rogerson), as well as Laura Kerr at Results UK.
Second, the project would have not been possible without the contribution of eight teams of national consultants that led and conducted the case studies on which this synthesis report is based. Our most sincere thanks goes to them for their hard work on literature reviews, data collection and analysis, and interviews. In alphabetical order by country, we acknowledge the contributions of:
• Salma El-Sayeh, Deputy Managing Director, and Dina Sherif, CEO, Ahead of the Curve (Egypt) • Charles Abugre, Commissioner of Ghana’s National Development Planning Commission, and Atieno Odomo, independent consultant (Ghana)
• Phouphet Kyophilavong, Associate Professor and Vice Dean, Faculty of Economics and Business Management, National University of Laos (the Lao People’s Democratic Republic)
• David Nabena, Senior Economist, and Olanrewaju Ajogbasile, HelpDesk Programme Manager, Nigeria Governors’ Forum (Nigeria)
• Nyda Mukhtar and Kiran Tariq, Public Financial Management Consultants, Oxford Policy Management (Pakistan)
• Francis Odhuno, Senior Research Fellow, and Eugene Ezebilo, Associate Professor, National Research Institute (Papua New Guinea)
• Udan Fernando, Executive Director, and K. Romeshun, Senior Researcher, Centre for Poverty Analysis (Sri Lanka)
• Dang Thi Thu Hoai, Central Institute for Economic Management (Viet Nam)
Third, Sarah Parker and Richa Okhandiar-MacDougall were responsible for the administration and management of this complex project and provided excellent support at different stages throughout. We thank Anna Hickman and Caelin Robinson (ODI) and Chris Little, who coordinated the production of this report, and Alasdair Deas, who edited it.
Fourth, Lizzie Dipple and Pascal Jaupart (Oxford University), Debapriya Bhattacharya (Chair, Southern Voice on Post-MDG International Development Goals and Distinguished Fellow, Centre for Policy Dialogue) and Andrew Rogerson (ODI) peer reviewed an early version of this report. Their comprehensive and constructive comments strengthened and challenged its arguments.
Finally, and most importantly, we gratefully acknowledge the financial support of the Bill and Melinda Gates Foundation and of Australia’s Department of Foreign Affairs and Trade (DFAT), the latter as part of the partnership between DFAT and ODI. This project was not commissioned directly by our funders. The views presented in this paper do not necessarily represent the views of DFAT or the Commonwealth of Australia. The Commonwealth of Australia accepts no responsibility for any loss, damage or injury resulting from reliance on any of the information or views contained in this publication.
Data were collected between June 2017 and June 2018. The reclassifications considered are, therefore, up to June 2018. Data analyses are based on data available as of June 2018, unless otherwise specified.
All errors and omissions are the responsibility of the authors and of the eight national teams. This paper does not reflect the views of our funders, of ODI, or of our peer reviewers.
4
Contents
Acknowledgements 3
List of boxes, tables and figures 5
Acronyms 7
Executive summary 9
1 Introduction 14
1.1 This report, the questions we aim to address and our hypotheses 14
1.2 Our methodological approach 16
1.3 Report structure 18
2 Literature and cross-country data analysis 19
2.1 What do we know from the literature? 19
2.2 What do the data tell us? 21
2.3 Conclusions: what evidence or gaps were found in the literature review and cross-country data analysis? 29
3 Case-study overview and country contexts 31
3.1 Overview of the eight country case studies 31
3.2 An overview of the economic, social and political contexts shaping volume and allocation of finance 32
4 Trends in development finance 39
4.1 Volume and instruments of ODF 39
4.2 Terms and conditions and sectoral allocation 47
5 Government strategies 57
5.1 Government priorities for development finance 57
5.2 Strategies in place 58
5.3 Coordination mechanisms 61
6 Conclusions and recommendations 63
References 67
Annex 1 Country analytical and operational classifications 70
Annex 2 List of interviewees 74
Annex 3 Country factsheets 79
5
List of boxes, tables and figures
Boxes
Box 1 Analytical and operational classification: the case of the World Bank 15
Box 2 Criteria for case-study selection 32
Tables
Table 1 Research questions, hypotheses and rationale 17
Table 2 Literature review and cross-country data analysis: summary of findings 29
Table 3 Overview of analytical and operational classifications 31
Table 4 Sectoral allocation of ODF: before and after reclassification or graduation 51
Figures
Figure 1 Grants as a share of ODF before and after reclassification and transition to LMIC status
(normalised) 22
Figure 2 Grants as a share of ODF 23
Figure 3 Change in grant share of ODF five years before and after reclassification 24
Figure 4 Aid dependency and GNI per capita, by income classification, 2013 24
Figure 5 Aid dependency before and after reclassification to LMIC (normalised) 25
Figure 6 ODF as a share of GDP before and after reclassification to LMIC 25
Figure 7 Absolute difference in annual average ODA and OOFs five years before and after reclassification 26
Figure 8 Average interest rates and maturity of official debt 26
Figure 9 Sector-allocable ODF, 2013–2015 27
Figure 10 Infrastructure and social-sector shares of sector-allocable ODF, by income classification
(three-year moving averages) 28
Figure 11 Change in social-sector share of ODF five years before and after reclassification 28
Figure 12 Poverty rates, 1990–1995 vs 2011–2016 34
6
Figure 13 HDI scores, 1990–2015 35
Figure 14 Grant composition of ODF, three-year averages, 1993–2016 40
Figure 15 Aid dependency 41
Figure 16 Grant composition of ODF, three-year averages, 1993–2016 43
Figure 17 The ‘missing middle’ of development finance hypothesis across countries 45
Figure 18 Changes in the sectoral allocation of resources: external finance (ODF), three-year average 50
Figure 19 Changes in the sectoral allocation of resources: public finance (excl. Papua New Guinea) 53
7
Acronyms
ADB Asian Development Bank
AfDB African Development Bank
COFOG Classification of the Functions of Government (IMF)
CRS Creditor Reporting System (OECD)
DAC Development Assistance Committee (OECD)
DFID Department for International Development (United Kingdom)
DFAT Department for Foreign Affairs and Trade (Australia)
DPG Development Partners Group
EU European Union
Gavi Global Alliance for Vaccines and Immunisation
GDP gross domestic product
GFATM Global Fund to Fight AIDS, Tuberculosis and Malaria
GNI gross national income
HDI Human Development Index (UNDP)
HIC high-income country
HIPC heavily indebted poor country
IBRD International Bank for Reconstruction and Development (World Bank)
IDA International Development Association (World Bank)
IMF International Monetary Fund
LDC least developed country
LIC low-income country
LMIC lower-middle-income country
MDB multilateral development bank
MDBS Multi-Donor Budget Support
MDG Millennium Development Goal
MIC middle-income country
MTDS Medium-Term Debt Strategy/Medium-Term Debt Management Strategy
NSEDP National Socio-Economic Development Plan (Lao PDR)
ODA official development assistance
ODI Overseas Development Institute
ODF official development finance
OOF other official flow
SDC Swiss Agency for Development Cooperation
SECO State Secretariat for Economic Affairs (Switzerland)
8
Sida Swedish International Development Cooperation Agency
UK United Kingdom
UMIC upper-middle-income country
UNDP United Nations Development Programme
US United States
USAID United States Agency for International Development
WDI World Development Indicators (World Bank)
9
Executive summary
Over the past 15 years, 35 low-income countries (LICs) have transitioned to middle-income country (MIC) status. This progress reflects the strong and sustained economic growth achieved in most parts of the developing world. While income per capita only partly reflects the overall economic and social development of a country, the move to MIC status can significantly affect the mix of financing resources available to it and often triggers donor discussion on whether to reduce or even phase out financial assistance.
This report is the first to look systematically at the impact on development financing of countries’ transition from low to middle-income status. We have analysed how development financing changed for countries reclassified between 1995 and 2010 and have carried out in-depth case studies of eight of them: Egypt, Ghana, the Lao People’s Democratic Republic (Lao PDR), Nigeria, Pakistan, Papua New Guinea, Sri Lanka and Viet Nam. We have focused on the changes to external or international public finance, which we have termed official development finance (ODF) and which includes both official development assistance (ODA) and other official flows (OOFs). However, our analysis also provides insights into changes in other public development-finance resources, particularly taxation.
Five main findings
1 Transition to LMIC status does not necessarily lead to a loss of international public finance International public finance increased, on average, in absolute terms for countries transitioning during the period studied. Comparing data for five years before and five years after reclassification from low-income to lower-middle-income country (LMIC) status, most countries saw an increase in both ODA flows and OOFs, while a very small number saw a decline in OOFs.
ODA increased after reclassification in most of the countries studied, the exceptions being Ghana and, more recently, Sri Lanka and Viet Nam. Increased flows following transition were often associated with geostrategic motivation: geographic location (for example, in the case of Western military action in the Middle East after 9/11, or Egypt in the turbulent Middle East and North Africa region), proximity (for instance, in the case of Papua New Guinea and its main development partner, Australia), natural disasters (as in Pakistan and Sri Lanka), or institutional strengthening.
In other words, development assistance was driven by motives well beyond the income per capita of the recipient country. ODF from development partners such as China and the Republic of Korea (whose allocations are not usually driven by the income per capita) increased, in particular. The rise of China as a donor has had large effects on development finance for many of the case-study countries, especially those geographically close to it. Lao PDR, Pakistan and Sri Lanka all lie along the designated route of China’s new Belt and Road Initiative. Chinese development assistance and investment have also been expanding in Ghana, Nigeria and Papua New Guinea. ODF from the Republic of Korea – especially from the Export-Import Bank of Korea (Korea Eximbank) – also increased in Lao PDR, Nigeria and Viet Nam.
The volume of OOFs did not increase in several case-study countries, though. There are various reasons for this. The type of financing provided by the largest bilateral donors may favour ODA (donors may be restricted to grant financing, for example); countries may not be eligible to borrow from the hard windows of multilateral development banks (MDBs) (a poor record of macroeconomic management might be a barrier to borrowing, for instance, or ‘blend’ countries might not be able to access International Bank for Reconstruction and
10
Development (IBRD) lending (as in the case of Nigeria and Pakistan); or MDBs’ eligibility criteria for non-concessional borrowing (as in the case of Ghana) or binding country debt limits (for example, in Viet Nam) might restrict a country’s access to finance.
2 For the most part, the terms and conditions of financing get tougher, with a gradual shift to loans Development partners may want to prioritise the allocation of their scarce grant financing to the recipient countries most in need, namely, those with the least capacity to repay loans. Becoming a MIC usually puts a country in a better position to borrow from capital markets and afford loan repayments, making it a lower priority for grant aid.
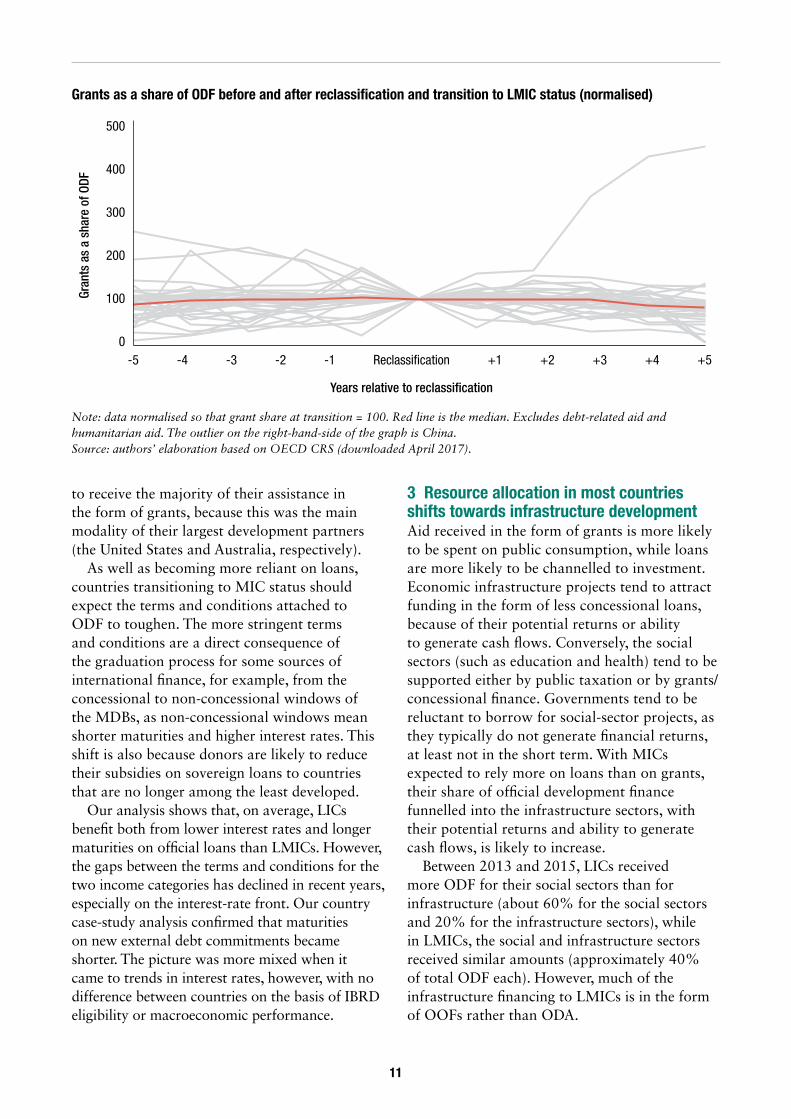
The evidence shows that countries that are becoming MICs gradually rely more on loans and less on grants, but this is a slow transition, and there are exceptions. In 2015, LICs received around 80% of their ODF as grants, but for LMICs, the share was less than 40%. However, if we consider those 32 countries that transitioned from LIC to LMIC status between 1995 and 2010, the grants as a median share of total ODF after transition remained similar to the share beforehand, with only a slight decline a few years after transition. While some countries receive a smaller share of their ODF in the form of grants, other countries receive a larger share.
Most country case studies, following transition to LMIC status, saw an increase in their share of loans versus grants. Egypt and Papua New Guinea were two exceptions. They continued
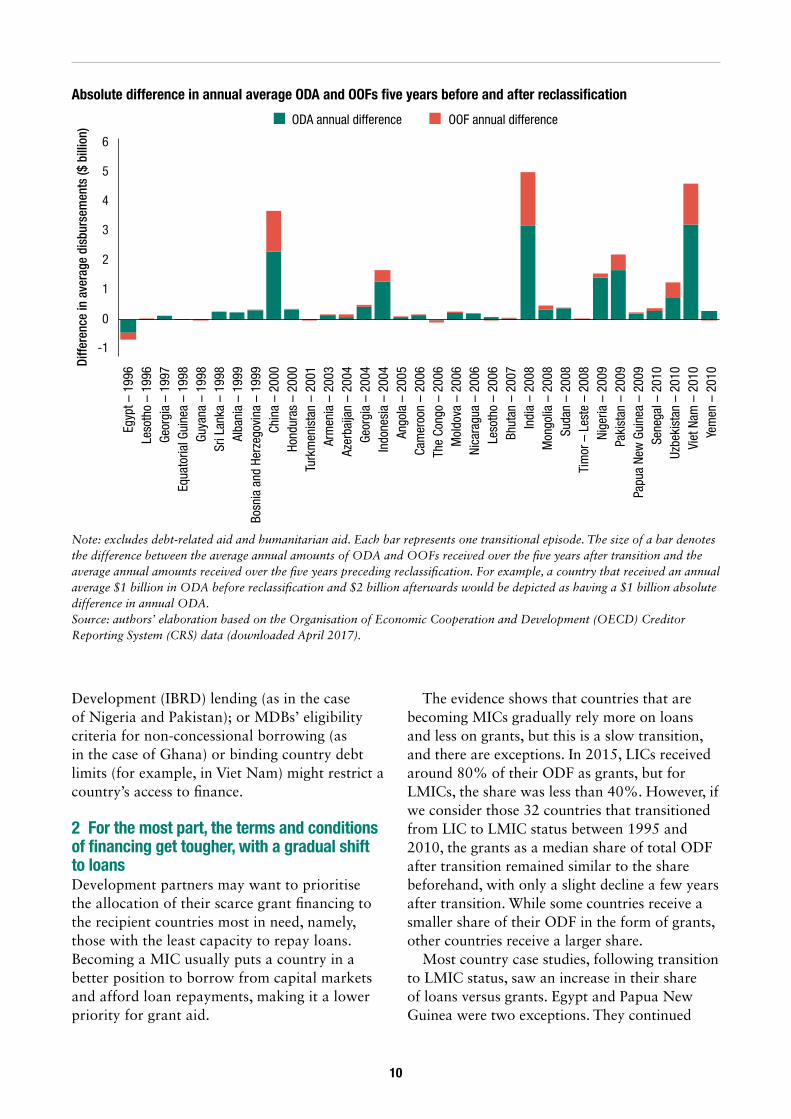
Absolute difference in annual average ODA and OOFs five years before and after reclassification
Note: excludes debt-related aid and humanitarian aid. Each bar represents one transitional episode. The size of a bar denotes the difference between the average annual amounts of ODA and OOFs received over the five years after transition and the average annual amounts received over the five years preceding reclassification. For example, a country that received an annual average $1 billion in ODA before reclassification and $2 billion afterwards would be depicted as having a $1 billion absolute difference in annual ODA. Source: authors’ elaboration based on the Organisation of Economic Cooperation and Development (OECD) Creditor Reporting System (CRS) data (downloaded April 2017).
6
5
4
3
2
1
0
-1
Egyp
t – 1
996Di
ffere
nce
in a
vera
ge d
isbu
rsem
ents
($ b
illio
n)
ODA annual difference OOF annual difference
Yem
en –
201
0Vi
et N
am –
201
0Uz
beki
stan
– 2
010
Sene
gal –
201
0Pa
pua
New
Gui
nea
– 20
09Pa
kist
an –
200
9Ni
geria
– 2
009
Tim
or –
Les
te –
200
8Su
dan
– 20
08M
ongo
lia –
200
8In
dia
– 20
08Bh
utan
– 2
007
Leso
tho
– 20
06Ni
cara
gua
– 20
06M
oldo
va –
200
6Th
e Co
ngo
– 20
06Ca
mer
oon
– 20
06An
gola
– 2
005
Indo
nesi
a –
2004
Geor
gia
– 20
04Az
erba
ijan
– 20
04Ar
men
ia –
200
3Tu
rkm
enis
tan
– 20
01Ho
ndur
as –
200
0Ch
ina
– 20
00Bo
snia
and
Her
zego
vina
– 1
999
Alba
nia
– 19
99Sr
i Lan
ka –
199
8Gu
yana
– 1
998
Equa
toria
l Gui
nea
– 19
98Ge
orgi
a –
1997
Leso
tho
– 19
96
11
to receive the majority of their assistance in the form of grants, because this was the main modality of their largest development partners (the United States and Australia, respectively).
As well as becoming more reliant on loans, countries transitioning to MIC status should expect the terms and conditions attached to ODF to toughen. The more stringent terms and conditions are a direct consequence of the graduation process for some sources of international finance, for example, from the concessional to non-concessional windows of the MDBs, as non-concessional windows mean shorter maturities and higher interest rates. This shift is also because donors are likely to reduce their subsidies on sovereign loans to countries that are no longer among the least developed.
Our analysis shows that, on average, LICs benefit both from lower interest rates and longer maturities on official loans than LMICs. However, the gaps between the terms and conditions for the two income categories has declined in recent years, especially on the interest-rate front. Our country case-study analysis confirmed that maturities on new external debt commitments became shorter. The picture was more mixed when it came to trends in interest rates, however, with no difference between countries on the basis of IBRD eligibility or macroeconomic performance.
3 Resource allocation in most countries shifts towards infrastructure development Aid received in the form of grants is more likely to be spent on public consumption, while loans are more likely to be channelled to investment. Economic infrastructure projects tend to attract funding in the form of less concessional loans, because of their potential returns or ability to generate cash flows. Conversely, the social sectors (such as education and health) tend to be supported either by public taxation or by grants/concessional finance. Governments tend to be reluctant to borrow for social-sector projects, as they typically do not generate financial returns, at least not in the short term. With MICs expected to rely more on loans than on grants, their share of official development finance funnelled into the infrastructure sectors, with their potential returns and ability to generate cash flows, is likely to increase.
Between 2013 and 2015, LICs received more ODF for their social sectors than for infrastructure (about 60% for the social sectors and 20% for the infrastructure sectors), while in LMICs, the social and infrastructure sectors received similar amounts (approximately 40% of total ODF each). However, much of the infrastructure financing to LMICs is in the form of OOFs rather than ODA.
Grants as a share of ODF before and after reclassification and transition to LMIC status (normalised)
Note: data normalised so that grant share at transition = 100. Red line is the median. Excludes debt-related aid and humanitarian aid. The outlier on the right-hand-side of the graph is China. Source: authors’ elaboration based on OECD CRS (downloaded April 2017).
500
400
300
200
Gran
ts a
s a
shar
e of
ODF
100
0Reclassi�cation
Years relative to reclassification
-5 -4 -3 -2 -1 +1 +2 +3 +4 +5
12
In nearly all of the country case studies, the sectoral allocation of resources – external ODF, as well as public finance as a share of GDP – has shifted towards infrastructure development. Except in Lao PDR, both ODF and public finance have increasingly targeted infrastructure development rather than the social sectors. In Viet Nam, this was the case for ODF, but not for public finance, which has increasingly been allocated to the social sector (in part to address some of the gaps left by development assistance). In the case of Papua New Guinea, this shift was a concern for both government officials and development partners because of its association with worsening health indicators. In Pakistan, the health sector accounted for around 6% of aid disbursements in 2000 and only 1% of in 2015. However, the rising shares of ODF allocated to infrastructure were largely down to government preference (for energy in Pakistan, for example).
4 Tax revenues as a share of GDP rise slowly (and in some cases, decline) As they grow, MICs can find themselves stuck in what has been called the ‘missing middle’ of development finance – when the total public resources available to a country fall as a share of GDP after it transitions from LIC status and recover only when it is well into MIC status.
While ODF grew during transition in the countries we studied, it did not grow as fast as GDP, meaning ODF as a share of GDP declined. In several cases, tax revenue as a share of GDP increased, but in all countries except Pakistan, this was not enough to compensate for the relative dip in ODF as a share of GDP. In some countries, the ‘missing middle’ of development finance was particularly pronounced: not only did ODF as a share of GDP fall, but so too did tax revenue, as in the cases of Sri Lanka, Nigeria and Papua New Guinea.
5 Countries often lack a plan for transitioning from aid Governments are expected to plan for the structural shift in the composition of their external financing (especially as part of their debt-management strategy). However, they do not necessarily publish a formal transition
strategy. Many countries have been reclassified from LIC to LMIC in recent decades, but we did not identify any literature directly related to recipient country strategies, let alone any systematic overviews of responses.
Among the country case studies, Viet Nam was the only one to have a strategy for transition away from aid. However, this primarily considered the types of project each source of financing could be used to fund. Other countries are planning to implement a strategy (Ghana, with its ‘Ghana Beyond Aid’ strategy, and Nigeria, to a certain extent) or indirectly reflect some principles of the transition from LIC in other documents (Lao PDR). Other governments manage their financing options through a debt-management strategy (even though the objective here is to minimise costs and financial risk, rather than act as a planning tool).
Across the country case studies, we found that the governments did not – or found it difficult to – articulate priorities for the types of assistance they would like to receive from development partners in their transition away from aid. They seldom acknowledged the changing circumstances associated with LMIC status. Whenever a priority was specified, it largely reflected the need for capacity-building and knowledge to fill gaps where government capacity was limited.
Five recommendations for partner-country governments and development partnersBased on the main findings of the literature review, cross-country data analysis and country case studies, we have identified five recommendations for partner-country governments and for development partners, respectively.
Partner-country governments should • Articulate and be clear on priorities for external development finance and develop a strategy for managing the transition away from aid. The terms and conditions of financing are, in most cases, likely to change at the global level (with a rise in interest rates, in particular), while ODF as a share of GDP is expected to fall.
13
• Within this context, prioritise tax revenue mobilisation and tax administration as a key element of national financing strategy.
• Plan for changes in the composition of development finance to mitigate financial risks and rising costs, especially when a country has limits to its external borrowing, such as a capped debt-to-GDP ratio, and when favourable borrowing terms and conditions, such as loans from hard windows of MDBs, could be an option.
• Protect gains achieved in the social sectors by ring-fencing the share of government spending that goes to education and health. We have seen how the shares of both external assistance and public finance to the social sectors have been falling in some of the countries reviewed.
• Invest in coordination mechanisms. Now, more than ever, coordination between government and development partners should be improved. It will be key to the sharing of information about development partners’ plans, when they intend to change their programme orientation or decide to withdraw their development projects from the country.
Development partners should • Take a whole-of-finance-system approach when supporting countries in transition, coordinating changes in focus, volume and modalities with other donors or lenders to avoid jeopardising results already achieved.
• Reconsider criteria and approaches to transition. Beyond income per capita of the recipient country, resource allocation should consider trajectories in resource mobilisation
that are broader than macroeconomic performance. The ‘blend’ period for MDB lending should also be reviewed, reflecting performance in human development – indicators and spending – among the eligibility criteria, at least more explicitly.
• Align with national development plans. With countries’ prioritisation of infrastructure development, development partners should continue to reflect recipient countries’ priorities for their own national development. This would include building capacity to manage the transition, supporting the country’s priorities and strategies.
• Help boost non-concessional official finance and tax revenues. To help address the ‘missing middle’ of development finance, development partners should boost non-concessional sovereign lending (especially the hard windows of the MDBs), which is still cheaper than borrowing from domestic or international capital markets at higher rates and shorter maturities and would lessen the pressure on future debt sustainability. With tax revenue falling as a share of GDP, development partners should also focus on how to support efforts to boost tax revenue.
• Do not consider transition as a linear process towards graduation from aid and continue to engage with countries in transition. Countries might have started to move away from aid, but the process may not necessarily be linear and without setbacks. Low interest rates have helped keep costs low, but a rising trend – and reduced market appetite for investment in emerging markets – might change this picture.
14
1 Introduction
1 Based on available data (2002–2016). Our analysis is based on income classifications as of June 2018.
2 Although the focus of this paper is on the impact of reclassification from LIC to MIC status, we are well aware that the changes in terms and conditions offered by multilateral development banks are based on similar, albeit slightly different, criteria and take into account a creditworthiness assessment. The reason we focus on the income classification is because it often influences bilateral partners’ allocation of resources (see Jalles d’Orey and Prizzon, 2019).
3 The principles of analytical and operational classification are very similar across the other multilateral development banks that have both concessional and non-concessional windows, albeit with small differences.
1.1 This report, the questions we aim to address and our hypotheses
Over the past 15 years, 35 LICs have joined the ranks of the world’s MICs: a reflection of the strong and sustained economic growth achieved in most parts of the developing world.1
Because of this improved income status, several dimensions of the development-finance landscape are likely to evolve in most MICs, notably the volumes, terms and conditions, and sectoral allocation of resources, but also governments’ preferences for the types of assistance they would like to receive and the arenas in which resource negotiations are conducted. For example, although eligibility criteria for funding do not change when a country is reclassified as an MIC,2 cross-country quantitative evidence suggests that bilateral Development Assistance Committee (DAC) donors view a country’s crossing of the World Bank’s operational cut-off for International Development Association (IDA) eligibility as a signal that it is in less need of aid. As a result, donors reduce their own aid levels, reinforcing the (negative) effects of threshold-crossing on IDA flows (Knack et al., 2013). Box 1 elaborates on the difference between analytical and operational classification, referring to the case of the World Bank.3
Income per capita only partly reflects the overall economic and social development of a country. However, being reclassified as an
MIC often triggers a discussion about whether the assistance it receives should be reduced or phased out. Several authors have mapped how development assistance overall has been allocated to MICs (ODI et al., 2015; Alonso et al., 2014; Glennie, 2011) and how it should be delivered in MICs (see Davies, 2015). These studies aim to inform a polarised debate about whether and how development partners should support MICs that might have enough fiscal resources to support their own development strategy.
Against this background, very surprisingly, we have little evidence and very few systematic cross-country comparative reviews of how volumes of development finance and terms and conditions evolve during the transition from LIC status for specific economies. Furthermore, and more importantly for policy decisions, we know little about how developing-country governments have managed the transition away from aid and what lessons we can draw from partner countries that have already been down this path. Beyond looking at trends in development finance after reclassification to MIC status, this report aims to identify what principles and objectives, if any, governments had (and should have) in place to navigate the transition away from aid.
Amounts and patterns of development finance naturally change over time because of the evolving needs and demands of recipient countries. Therefore, a falling volume of finance should not be considered, in itself, the main problem. The
15
key policy question is how can partner-country governments manage their own budgets when the ODA they receive falls, the sources of finance they can access change and the financial terms they are offered typically become less favourable? (Of course, financing options might become more flexible and/or reliable, available at higher volume and come with fewer conditions attached.)
This paper focuses on the experiences of recipient countries. A companion paper (Jalles
d’Orey and Prizzon, 2019) reviews development partners’ approaches to transition and exit from bilateral programmes and considers the principles they should adopt in their transition and exit strategies. Several bilateral development partners are, indeed, reflecting on how their portfolios and instruments must be adapted in response to an evolving demand for development cooperation, in order to maximise their impact.
Box 1 Analytical and operational classification: the case of the World Bank
The World Bank’s analytical classification groups countries into low-income countries (LICs), lower-middle-income countries (LMICs), upper-middle-income countries (UMICs) and high-income countries (HICs) based on their gross national income (GNI) per capita. These groupings are used for analysis, for example, when comparing data and conditions between country groups, but they are not directly linked to lending terms. When a country crosses the income per capita threshold between one category and another, this is referred to as ‘reclassification’. The World Bank reclassifies countries in July each year, based on GNI per capita in the previous year. Countries can be reclassified to either a higher or a lower category, and classifications can be volatile, as countries’ income-per-capita can fluctuate around the threshold. For fiscal year 2017/18, the GNI per capita (Atlas method) thresholds for the categories were: LMIC, above $1,005; UMIC, above $3,955; and HIC, above $12,235. Annex 1 summarises reclassifications for all LICs and MICs up to June 2018.
In contrast to the analytical classification, the World Bank’s operational classification has direct consequences for a country’s financing options, determining the eligibility of countries to access concessional financing from the World Bank. (Other multilateral development banks (MDBs) with concessional windows apply a similar approach.) Countries are classified as: IDA (eligible for International Development Association (IDA) financing, soft or concessional window), IBRD (eligible to borrow from the International Bank for Reconstruction and Development (IBRD), hard or non-concessional window) or blend countries. Blend status means that a country can access lending from both the IDA and IBRD. Blend terms apply to blend countries and to IDA countries whose GNI per capita has been above the operational cut-off for more than two consecutive years, known as gap countries (World Bank, 2018).
Graduation from the IDA means that a country stops being eligible for IDA concessional financing and instead becomes eligible for financing from the IBRD only. Financing terms at the IBRD are less favourable than for IDA concessional funding (shorter maturity and grace periods and higher interest rates). The graduation process is triggered by crossing a GNI-per-capita threshold. The actual ‘readiness’ to graduate to IBRD status is based on an assessment (or creditworthiness assessment) of a country’s macroeconomic prospects, risk of debt distress, vulnerability to shocks, external debt and liquidity, political stability, levels of poverty and social indicators. On average, IDA countries remain in blend status for approximately two IDA replenishment cycles (i.e. six years). Graduation is usually set to occur at the end of an IDA replenishment period. Because of their vulnerability and small-scale markets, several small island developing states benefit from an exception and can borrow at IDA terms regardless of their income per capita. For fiscal year 2017/18, the IDA threshold was a GNI per capita of $1,165, slightly higher than the LMIC threshold. (The IDA threshold does not correspond to the LMIC threshold, hence the need to differentiate between analytical and operational classifications, which are often confused.)
16
The principal focus of this study is public finance. First, we consider external finance from sovereign donors. We label this as official development finance (ODF), which corresponds to the sum of ODA (which we refer to as concessional finance) and other official flows (OOFs) (or non-concessional finance). We then look at domestic revenues raised by national governments.
More precisely, in this paper we aim to test a series of common hypotheses about how the trajectory of development finance changes when countries are reclassified to MIC status (notably the volume, terms and conditions and sectoral allocation of development finance) and about the strategies countries have in place to manage such transition. The seven research questions – and the hypotheses and rationale behind each of them – are elaborated in Table 1.
1.2 Our methodological approach
To address these research questions, test hypotheses and, more importantly, fill the gaps in the policy literature on whether and how countries have managed the changing patterns of development finance caused by their reclassification to MIC status, we followed a two-step methodology.
• Desk-based review. First, we reviewed the evidence from the academic and policy literature and analysed how development finance evolved in the transition from LIC to MIC status and the graduation from the soft windows of MDBs across countries.4 The aims of the literature review and data analysis were to identify the main research gaps to be filled, test the hypotheses we set out in Table 1 and, ultimately, inform the detailed methodology of our case studies.
• Case-study phase. To examine the specific dynamics of transition to MIC status and graduation from IDA eligibility (or soft windows of MDBs), we conducted eight country case studies. The small sample size means this synthesis report presents an
4 Most of the data were gathered from the OECD’s CRS database, International Monetary Fund (IMF) statistics on government finances and the World Bank’s World Development Indicators.
illustration of country experiences rather than a systematic comparison across countries. A standardised methodology was developed to guide the case studies, which were carried out by teams of external consultants based in the country and familiar with its context. The methodology for the case studies was a combination of (i) quantitative analyses (descriptive statistics) of external and domestic public finance and of economic and human development indicators, and (ii) literature reviews on the economic, political and governance contexts and on the dynamics in relationships with donors. This approach was complemented by in-country semi-structured interviews with senior government officials, development partners and experts, with an average of 15 informants in each country case study. A list of the individuals consulted and who agreed to be mentioned is included as Annex 2.
Literature reviews and data analyses were conducted between July and December 2017 for the core part of this report and between December 2017 and July 2018 for the case studies. While each team was given a standardised research protocol, the coverage of information and analysis varies across the case studies, because of differences in the availability of data and in the information provided by interviewees.
Most of the data on ODF refer to flows from members of the DAC, as the data on emerging donors were not consistent across the country case studies. We refer to the latter in connection with specific countries. We did not map or analyse the trajectory of finance from philanthropic organisations because of a lack of detailed data. We reviewed changes in the development-finance landscape and investigated financing strategies, but did not consider changes in outcomes or effectiveness of development programmes and projects.
17
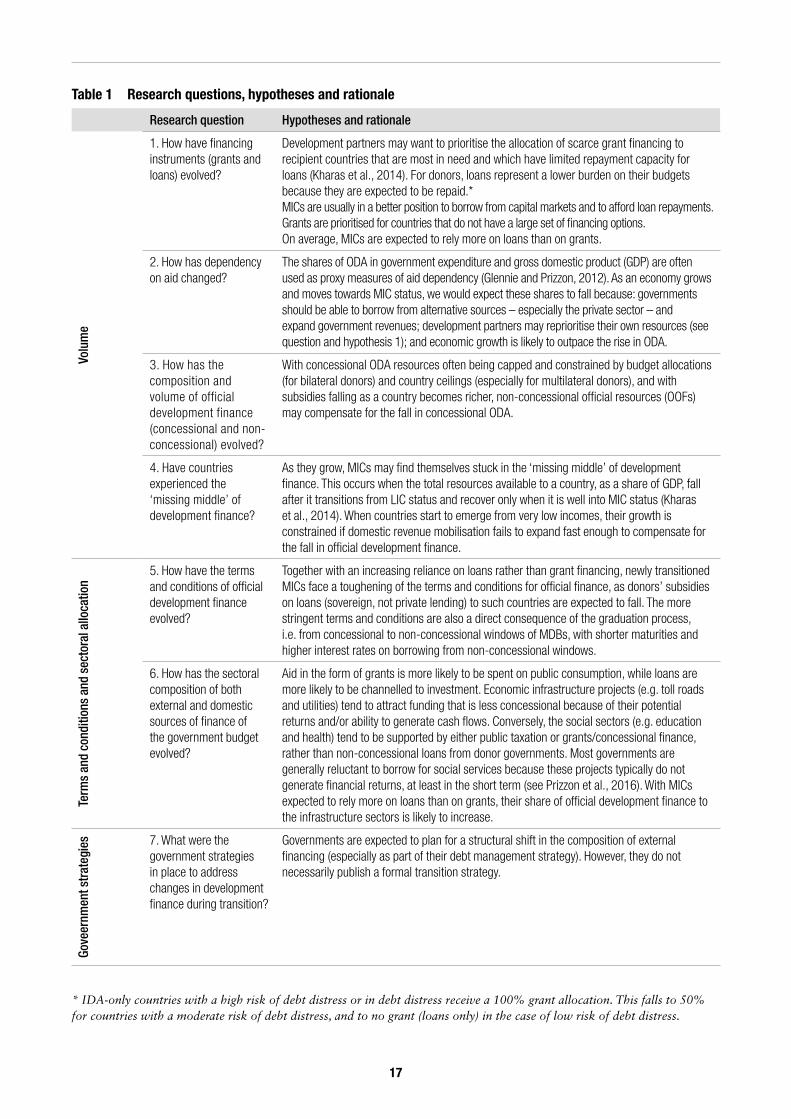
Research question Hypotheses and rationale
Volu
me
1. How have financing instruments (grants and loans) evolved?
Development partners may want to prioritise the allocation of scarce grant financing to recipient countries that are most in need and which have limited repayment capacity for loans (Kharas et al., 2014). For donors, loans represent a lower burden on their budgets because they are expected to be repaid.*MICs are usually in a better position to borrow from capital markets and to afford loan repayments. Grants are prioritised for countries that do not have a large set of financing options. On average, MICs are expected to rely more on loans than on grants.
2. How has dependency on aid changed?
The shares of ODA in government expenditure and gross domestic product (GDP) are often used as proxy measures of aid dependency (Glennie and Prizzon, 2012). As an economy grows and moves towards MIC status, we would expect these shares to fall because: governments should be able to borrow from alternative sources – especially the private sector – and expand government revenues; development partners may reprioritise their own resources (see question and hypothesis 1); and economic growth is likely to outpace the rise in ODA.
3. How has the composition and volume of official development finance (concessional and non-concessional) evolved?
With concessional ODA resources often being capped and constrained by budget allocations (for bilateral donors) and country ceilings (especially for multilateral donors), and with subsidies falling as a country becomes richer, non-concessional official resources (OOFs) may compensate for the fall in concessional ODA.
4. Have countries experienced the ‘missing middle’ of development finance?
As they grow, MICs may find themselves stuck in the ‘missing middle’ of development finance. This occurs when the total resources available to a country, as a share of GDP, fall after it transitions from LIC status and recover only when it is well into MIC status (Kharas et al., 2014). When countries start to emerge from very low incomes, their growth is constrained if domestic revenue mobilisation fails to expand fast enough to compensate for the fall in official development finance.
Term
s an
d co
nditi
ons
and
sect
oral
allo
catio
n
5. How have the terms and conditions of official development finance evolved?
Together with an increasing reliance on loans rather than grant financing, newly transitioned MICs face a toughening of the terms and conditions for official finance, as donors’ subsidies on loans (sovereign, not private lending) to such countries are expected to fall. The more stringent terms and conditions are also a direct consequence of the graduation process, i.e. from concessional to non-concessional windows of MDBs, with shorter maturities and higher interest rates on borrowing from non-concessional windows.
6. How has the sectoral composition of both external and domestic sources of finance of the government budget evolved?
Aid in the form of grants is more likely to be spent on public consumption, while loans are more likely to be channelled to investment. Economic infrastructure projects (e.g. toll roads and utilities) tend to attract funding that is less concessional because of their potential returns and/or ability to generate cash flows. Conversely, the social sectors (e.g. education and health) tend to be supported by either public taxation or grants/concessional finance, rather than non-concessional loans from donor governments. Most governments are generally reluctant to borrow for social services because these projects typically do not generate financial returns, at least in the short term (see Prizzon et al., 2016). With MICs expected to rely more on loans than on grants, their share of official development finance to the infrastructure sectors is likely to increase.
Gove
ernm
ent s
trat
egie
s 7. What were the government strategies in place to address changes in development finance during transition?
Governments are expected to plan for a structural shift in the composition of external financing (especially as part of their debt management strategy). However, they do not necessarily publish a formal transition strategy.
* IDA-only countries with a high risk of debt distress or in debt distress receive a 100% grant allocation. This falls to 50% for countries with a moderate risk of debt distress, and to no grant (loans only) in the case of low risk of debt distress.
Table 1 Research questions, hypotheses and rationale
18
1.3 Report structure
The report is structured as follows:
• Section 2 first reviews the literature mapping the evolution of the development-finance landscape during the transition from LIC to MIC status and the graduation from the soft windows of MDBs, and maps data trends across LICs and MICs. It then analyses the literature summarising countries’ financing approaches and strategies for transition to MIC status and graduation from the soft windows of MDBs. The objective is to test the seven research questions and respective hypotheses using the existing literature and cross-data analysis.
• Section 3 analyses the economic, social and political contexts shaping decisions on the volume and allocation of ODF after the
reclassification to MIC status and graduation from the soft windows of MDBs.
• Section 4 focuses on how the volume, terms and conditions and the sectoral composition of ODF and public finance evolved in the eight case-study countries, testing the research questions and hypotheses from the perspective of the recipient countries.
• Section 5 turns to the political-economy aspects, reviewing the pillars, if any were in place, of countries’ financing strategies and approaches during the transition to less-concessional financing sources.
• Section 6 concludes by outlining the implications of the findings of this report, both for partner-country governments, to help them to identify what they need to prioritise during this transitional phase, and for development partners planning to phase out their development programmes.
19
2 Literature and cross-country data analysis
5 This was due to a combination of the country having to graduate from IDA for a second time after the Asian financial crisis and the composition of its donors (some of the largest grant providers).
There have been several examples in recent years of countries being reclassified from LIC to MIC status or graduating from the soft windows of the MDBs (see Annex 1). However, the academic and policy literature reviewing the implications for development finance is rather thin, whether quantitative or qualitative, across countries or for individual countries.
This section will first review the evidence from the literature to date on transition finance developed against our seven research questions (see Table 1). Most of this literature focuses on the experience of Asian countries, which were the first to experience the transition from aid dependency. We will then complement and test our findings by analysing the trends in development-finance flows and the changing patterns that occur when countries are reclassified as MICs. Our main objectives are: first, to test whether the literature and data analyses corroborate or challenge our hypotheses on the composition and volume of development financing; and second, to identify analytical gaps on governments’ financing strategies as countries are reclassified to MIC status or graduated from the soft windows of the MDBs to be considered in the country case studies in Section 4 and 5.
Section 2.3 summarises and assesses the answers provided by the literature review and the cross-country analysis and compares them with the seven research questions we are aiming to answer in this report.
2.1 What do we know from the literature?
2.1.1 Volumes and instruments of official development finance
How have financing instruments (grants and loans) evolved? Across countries, the review of quantitative evidence shows that LICs tend to receive a higher share of their ODF (the sum of ODA and OOFs) as grants than LMICs do (ODI et al., 2015). Loans gradually become more important than grants as countries graduate from IDA (Moss and Majerowicz, 2012), which is what we would have expected from our hypothesis.
These trends across countries are largely confirmed by looking at individual countries. The relative share of grants compared to loans fell following reclassification to LMIC status in Cambodia (UNDP, n.d.), Lao PDR (MPI and UNDP, 2017), Myanmar (UNDP, 2016) and Viet Nam (EU et al., 2014). In Viet Nam’s case, the volume of both grants and loans continued to increase after the country’s reclassification to MIC status in 2010, but with loans increasing faster than grants.
An arguable exception is Indonesia. Prizzon and Rogerson (2017) found no evidence that loans became more important within ODF after the country transitioned to MIC status or after it graduated from IDA.5 Although the value of the grants the country received did decline, the value of its official loans decreased even faster, shifting the balance towards a relatively higher grant share.
20
How has dependency on aid changed?Empirically, in relative terms, studies have found that ODA counts for a larger share of development financing in LICs than in MICs (ODI et al., 2015) and that aid as a share of government revenues declines as economies grow (Cottarelli, 2011; Sy and Rakotondrazaka, 2015). This has been corroborated by case studies in Viet Nam (EU et al., 2014) and Indonesia (Prizzon and Rogerson, 2017).
However, in terms of absolute volume, the evidence is mixed. While ODA volumes decreased in Lao PDR (after reclassification to MIC status; MPI and UNDP, 2017) and Indonesia (after IDA graduation; Prizzon and Rogerson, 2017) ODA volumes remained stable, and even increased, in in Viet Nam (again after reclassification to MIC status; EU et al., 2014).
How has the composition and volume of official development finance (concessional and non-concessional) evolved?Again, there is little on this question in the literature. However, the evidence suggests that non-concessional finance only partly makes up for the fall in concessional finance, meaning there is a net decline in external ODF.
In countries graduating from IDA, Moss and Majerowicz (2012) found that the increase in non-concessional loans from the IBRD almost made up for the fall in concessional IDA lending. Kharas et al. (2014) argue that the reduction in concessional flows (as a share of GDP) is not sufficient to make up for the loss of concessional finance, leading to a net decline in ODF as a share of GDP. A case study on Indonesia showed that the fall in ODA was only partially offset by an increase in OOFs (Prizzon and Rogerson, 2017).
Have countries experienced the ‘missing middle’ of development finance? Kharas et al. (2014) argue that as countries grow, the increase in domestic revenues is not sufficient
6 IDA-graduated countries can also see the total net present value of their loans rise if they opt for accelerated repayments of outstanding IDA debt, meaning ‘double principal repayments (i.e. shorten maturity) or increase the interest rate’ (Moss and Majerowicz, 2012: 10).
to compensate for the decline in external assistance, resulting in a net decline in available ODF for LMICs, as a share of GDP. The 2015 European Report on Development also finds that, as economies grow, the decline in the ratio of aid to GNI is faster than the increase in the ratio of tax revenues to GNI, leading to a net decrease in public financing (ODI et al., 2015).
However, the findings from Kharas et al. (2014) have been challenged, notably by Dercon and Lea (2015). While this condition might be true for some LMICs, it is not generalisable across the group of countries when using a wider dataset. Importantly, these studies are not based on the dynamic experiences of actual countries, but rather on static snapshots of countries in different income groups.
2.1.2 Terms and conditions and sectoral allocation of official development finance
How have the terms and conditions of the different financing options evolved? The literature provides very little evidence on the dynamic effects on the terms and conditions of ODF as countries transition from LIC to MIC status or graduate from IDA. On graduation from IDA, countries have less access to concessional funding, both from MDBs and (in practice) from bilateral donors. For Indonesia, unsurprisingly, maturities had been steadily decreasing in the years leading up to graduation from IDA (Prizzon and Rogerson, 2017). Contrary to expectations following graduation from IDA lending, interest rates continued to decrease, but this was largely caused by a general drop in interest rates globally during the period, including on IBRD loans.6
How has the sectoral composition of both external and domestic sources of finance of the government budget evolved? The literature investigating this question using quantitative methods across countries is rather
21
thin and mainly focuses on just the health sector7 (see, for example, Yamey and Hecht, 2018) rather than across sectors. Most literature is based on case-study analyses. In Myanmar, the share of ODA that goes to social infrastructure and services dropped from 45% in 2010 to 29% in 2014, when the country was reclassified as an MIC. The share of ODA that goes to economic infrastructure and services increased nearly tenfold, from 2.5% to 24% (UNDP, 2016). A case study on Viet Nam found that the government was more likely to use non-concessional finance for ‘investment projects with the potential to generate a revenue stream to cover repayments’ (EU et al., 2014). In the case of Indonesia, however, Prizzon and Rogerson (2017) found that the share of ODA going to health and education increased after graduation from IDA in 2014.
2.1.3 Strategies for dealing with transitions and graduationsAlthough many countries have been reclassified from LIC to MIC in recent years, we did not identify any literature directly related to recipient countries’ strategies for dealing with reclassification, let alone a systematic overview of responses.
Some studies concentrated on the donor side of the equation (see the companion paper to this project, Jalles d’Orey and Prizzon, 2019). One notable recurring finding from these studies is that the reduction in financial flows is less significant for recipient countries than the withdrawal of the institutional support that accompanied the development assistance (although in many cases the financial flows were already small at the time of donor exit) (Slob and Jerve, 2008; Forsberg, 2010; EU et al., 2014; ICAI, 2016; see also Whitaker et al., 2013). For newly graduated LMICs, strengthening
7 The health sector can be especially vulnerable to withdrawal of aid in the face of income reclassification and graduation; some countries can rely on aid to support their budgets, and the eligibility criteria applied by large donors to the health sector (e.g. the Global Alliance for Vaccines and Immunisation, Gavi) are largely based on income-based thresholds.
8 For example, Gupta et al. (2003) and later Benedek et al. (2012) have shown empirically that grants, but not loans, have a negative effect on government revenues. But this has been questioned, including by Morrissey (2015), who finds no systematic effect. In another branch of the literature, studies have found that, amid unpredictable aid flows, shortfalls in aid have led to cuts in investment, while windfalls have led to increased government consumption (Pycroft and Martins, 2009). Remmer (2004) finds that increased foreign aid leads to increased government spending and falling revenue generation.
of institutional capacity has not kept up with economic growth, and several of the reviews argue for continued ‘soft’ support (in other words, technical assistance) based on a review of country studies (Prizzon and Rabinowitz, 2015).
Most of the cross-country literature focuses on the impact of changes in aid flows on governments’ fiscal policies, without taking the processes of reclassification or graduation into account. The focus of this literature is whether and how greater aid flows can ‘crowd out’ government revenues, rather than the other way around, as in this report.8
Notwithstanding this debate, reviews of recipient countries have found that the reduction of aid dependency is an explicit target for many developing countries, whether transitioning to MIC or not, as aid dependency is associated with a lack of policy autonomy, which undermines government accountability to citizens and reduces the predictability of government spending (Thomas et al., 2011). Countries such as Afghanistan, Cambodia, Ghana, Liberia, Nepal, Rwanda, Sierra Leone, Uganda and Viet Nam have all explicitly targeted reduced aid dependency in their national development or aid management policies (ibid.). We also see this historically in Botswana, which had a goal of ending aid dependency from a very early date, long before transitioning out of external assistance (Maipose et al., 2007; Bräutigam, 2000).
2.2 What do the data tell us?
To complement our review of the sparse literature on development finance at the time of transition, we first compared trends across LICs and MICs as aggregate groups to discern general differences between them. However, this approach does not reflect the dynamic effects of transition or
22
graduation over time. To examine the implications of transition/graduation over time, we then compared trends in development-finance flows before and after transition/graduation. Historical trends in aid flows, such as the prioritisation of social sectors in the Millennium Development Goals (MDGs), will have implications for all recipient countries, regardless of their status.9
2.2.1 Volumes and instruments of official development finance
How have financing instruments (grants and loans) evolved? Based on OECD CRS data, the share of ODF received in the form of grants tends, on average, to be higher for LICs than for LMICs. In 2015,
9 This section summarises the main findings. Robustness tests (not shown) were carried out and the results were not significantly different. These tests included splitting the data by donor, using only ODA data instead of ODF, using ODF commitments instead of disbursements, limiting ODF to only sector-allocable aid, including and excluding debt and humanitarian aid, and including and excluding China and India. Tests were also duplicated for IDA graduations in place of LMIC transitions.
10 Robustness tests are available for 2000, 2005 and 2010.
11 Thirty-one countries were reclassified between 1995 and 2010. Some countries were reclassified more than once. We only have sufficient data for 32 separate reclassification episodes. The analysis was limited to 1995–2010 in order to ensure sufficient data coverage for five years before and after reclassification.
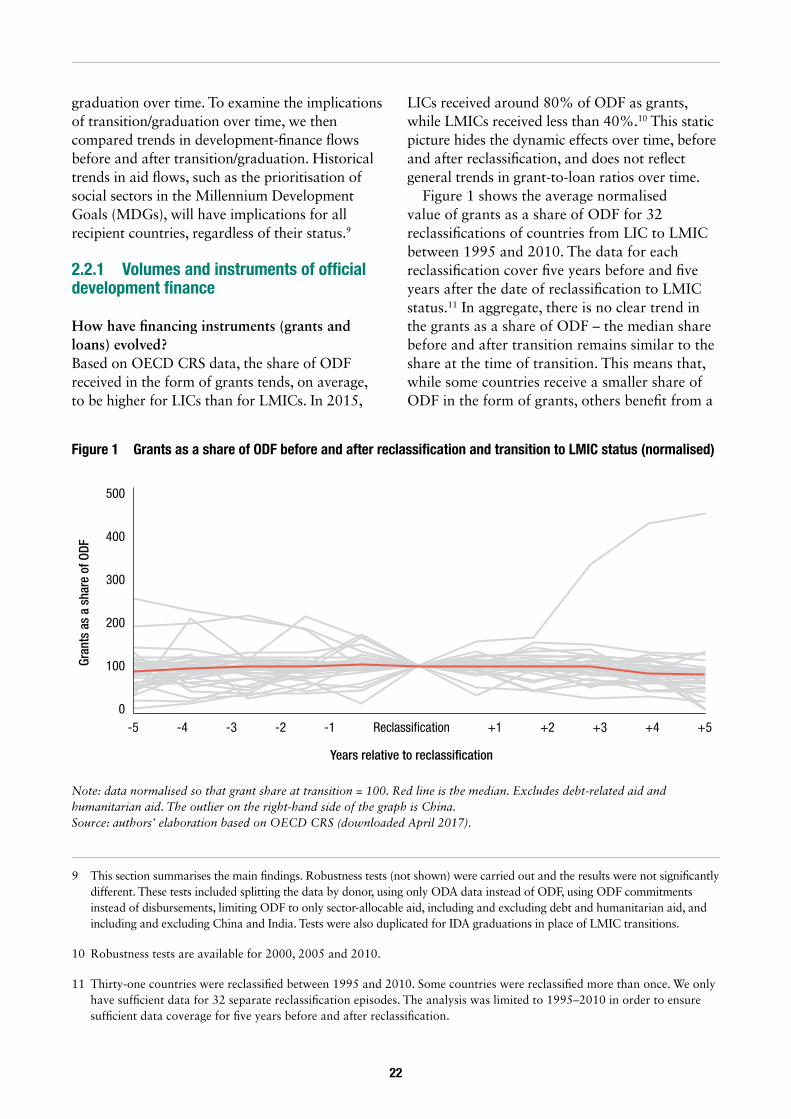
LICs received around 80% of ODF as grants, while LMICs received less than 40%.10 This static picture hides the dynamic effects over time, before and after reclassification, and does not reflect general trends in grant-to-loan ratios over time.
Figure 1 shows the average normalised value of grants as a share of ODF for 32 reclassifications of countries from LIC to LMIC between 1995 and 2010. The data for each reclassification cover five years before and five years after the date of reclassification to LMIC status.11 In aggregate, there is no clear trend in the grants as a share of ODF – the median share before and after transition remains similar to the share at the time of transition. This means that, while some countries receive a smaller share of ODF in the form of grants, others benefit from a
Figure 1 Grants as a share of ODF before and after reclassification and transition to LMIC status (normalised)
Note: data normalised so that grant share at transition = 100. Red line is the median. Excludes debt-related aid and humanitarian aid. The outlier on the right-hand side of the graph is China. Source: authors’ elaboration based on OECD CRS (downloaded April 2017).
500
400
300
200
Gran
ts a
s a
shar
e of
ODF
100
0Reclassi�cation
Years relative to reclassification
-5 -4 -3 -2 -1 +1 +2 +3 +4 +5
23
larger share of grants when they are reclassified as LMICs (contrary to our hypothesis).
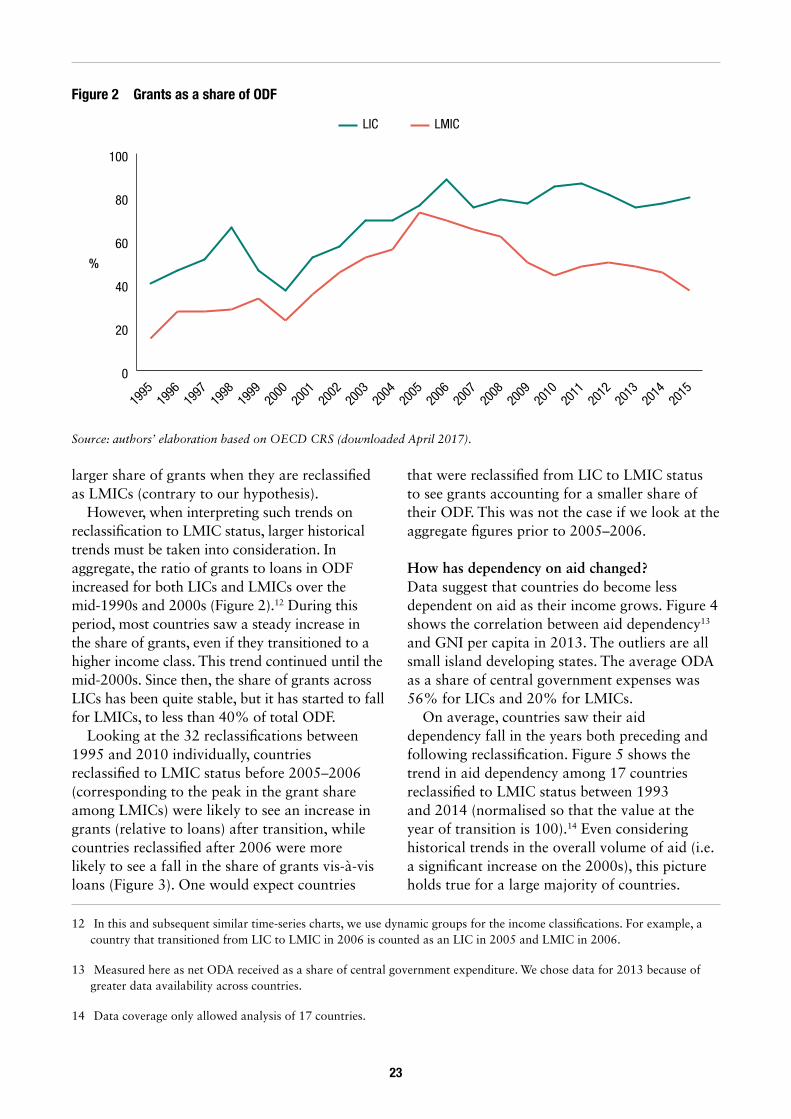
However, when interpreting such trends on reclassification to LMIC status, larger historical trends must be taken into consideration. In aggregate, the ratio of grants to loans in ODF increased for both LICs and LMICs over the mid-1990s and 2000s (Figure 2).12 During this period, most countries saw a steady increase in the share of grants, even if they transitioned to a higher income class. This trend continued until the mid-2000s. Since then, the share of grants across LICs has been quite stable, but it has started to fall for LMICs, to less than 40% of total ODF.
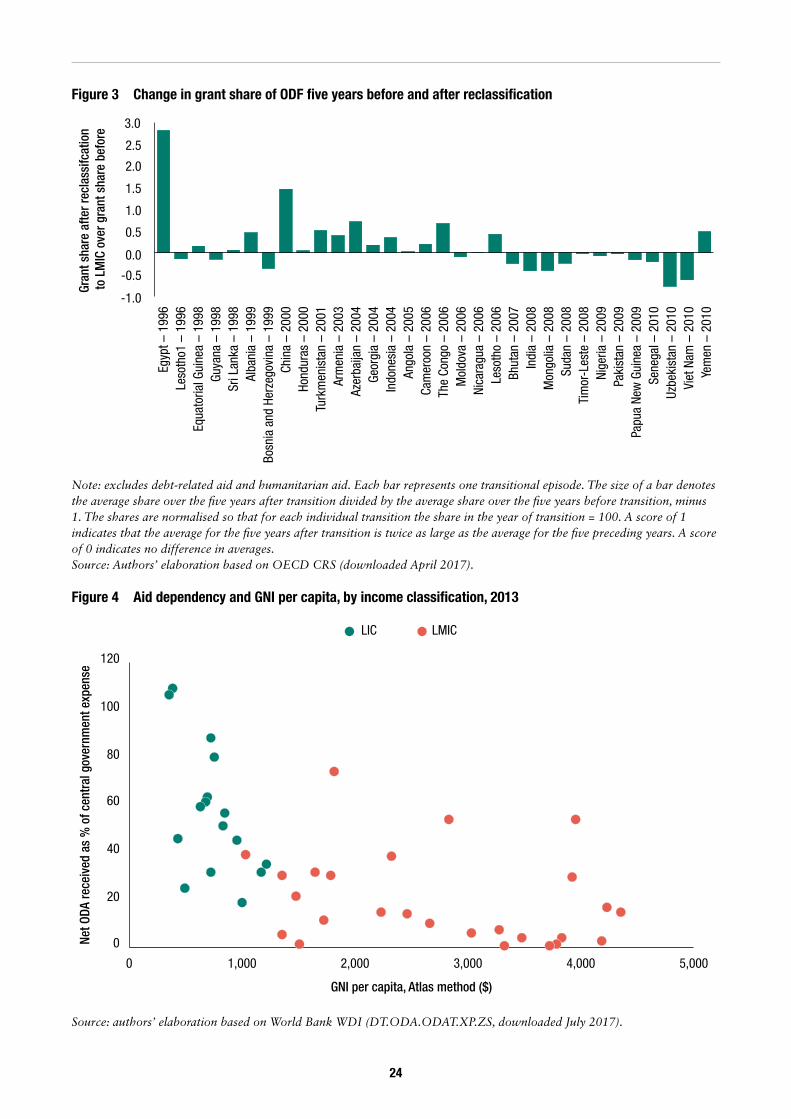
Looking at the 32 reclassifications between 1995 and 2010 individually, countries reclassified to LMIC status before 2005–2006 (corresponding to the peak in the grant share among LMICs) were likely to see an increase in grants (relative to loans) after transition, while countries reclassified after 2006 were more likely to see a fall in the share of grants vis-à-vis loans (Figure 3). One would expect countries
12 In this and subsequent similar time-series charts, we use dynamic groups for the income classifications. For example, a country that transitioned from LIC to LMIC in 2006 is counted as an LIC in 2005 and LMIC in 2006.
13 Measured here as net ODA received as a share of central government expenditure. We chose data for 2013 because of greater data availability across countries.
14 Data coverage only allowed analysis of 17 countries.
that were reclassified from LIC to LMIC status to see grants accounting for a smaller share of their ODF. This was not the case if we look at the aggregate figures prior to 2005–2006.
How has dependency on aid changed?Data suggest that countries do become less dependent on aid as their income grows. Figure 4 shows the correlation between aid dependency13 and GNI per capita in 2013. The outliers are all small island developing states. The average ODA as a share of central government expenses was 56% for LICs and 20% for LMICs.
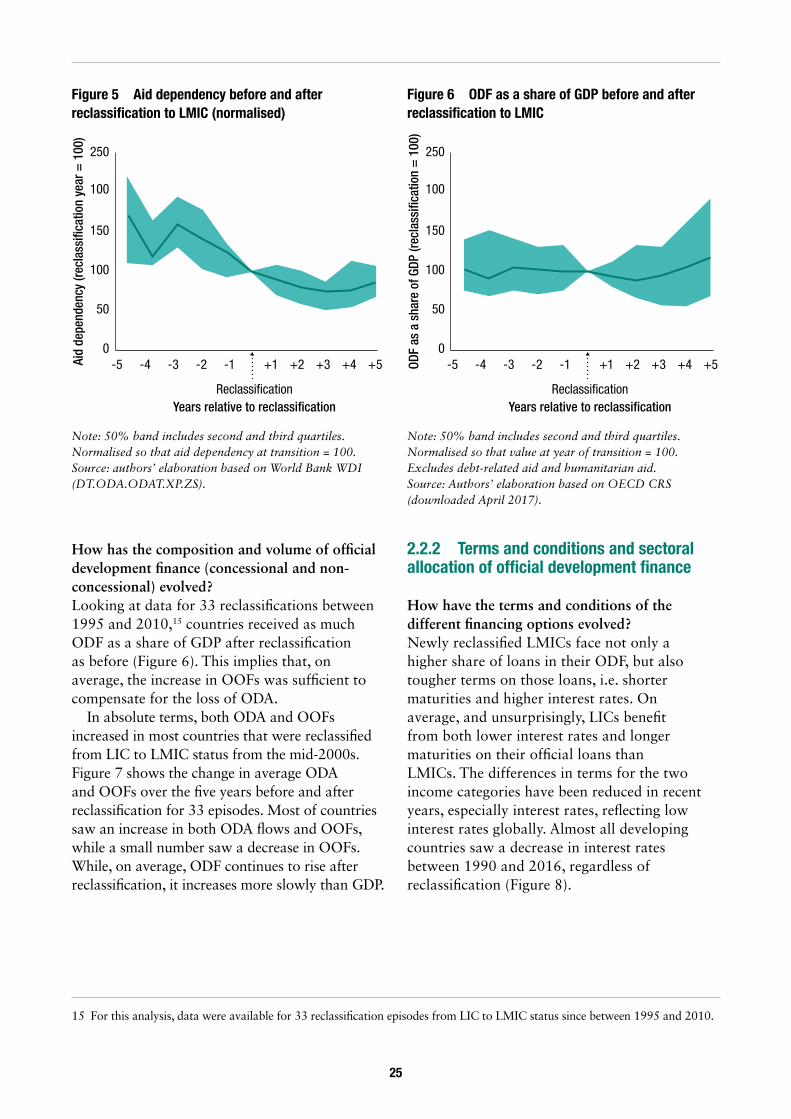
On average, countries saw their aid dependency fall in the years both preceding and following reclassification. Figure 5 shows the trend in aid dependency among 17 countries reclassified to LMIC status between 1993 and 2014 (normalised so that the value at the year of transition is 100).14 Even considering historical trends in the overall volume of aid (i.e. a significant increase on the 2000s), this picture holds true for a large majority of countries.
Figure 2 Grants as a share of ODF
Source: authors’ elaboration based on OECD CRS (downloaded April 2017).
0
20
40
%
60
80
100
LMICLIC
2015
2014
2013
2012
2011
2010
2009
2008
2007
2006
2005
2004
2003
2002
2001
2000
1999
1998
1997
1996
1995
24
Figure 3 Change in grant share of ODF five years before and after reclassification
Note: excludes debt-related aid and humanitarian aid. Each bar represents one transitional episode. The size of a bar denotes the average share over the five years after transition divided by the average share over the five years before transition, minus 1. The shares are normalised so that for each individual transition the share in the year of transition = 100. A score of 1 indicates that the average for the five years after transition is twice as large as the average for the five preceding years. A score of 0 indicates no difference in averages. Source: Authors’ elaboration based on OECD CRS (downloaded April 2017).
Yem
en –
201
0Vi
et N
am –
201
0Uz
beki
stan
– 2
010
Sene
gal –
201
0Pa
pua
New
Gui
nea
– 20
09Pa
kist
an –
200
9Ni
geria
– 2
009
Tim
or-L
este
– 2
008
Suda
n –
2008
Mon
golia
– 2
008
Indi
a –
2008
Bhut
an –
200
7Le
soth
o –
2006
Nica
ragu
a –
2006
Mol
dova
– 2
006
The
Cong
o –
2006
Cam
eroo
n –
2006
Ango
la –
200
5In
done
sia
– 20
04Ge
orgi
a –
2004
Azer
baija
n –
2004
Arm
enia
– 2
003
Turk
men
ista
n –
2001
Hond
uras
– 2
000
Chin
a –
2000
Bosn
ia a
nd H
erze
govi
na –
199
9Al
bani
a –
1999
Sri L
anka
– 1
998
Guya
na –
199
8Eq
uato
rial G
uine
a –
1998
Leso
tho1
– 1
996
Egyp
t – 1
996
Gran
t sha
re a
fter r
ecla
ssifc
atio
n to
LM
IC o
ver g
rant
sha
re b
efor
e 3.0
2.5
2.0
1.5
1.0
0.5
0.0
-0.5
-1.0
Figure 4 Aid dependency and GNI per capita, by income classification, 2013
Source: authors’ elaboration based on World Bank WDI (DT.ODA.ODAT.XP.ZS, downloaded July 2017).
0
0 1,000 2,000 3,000 4,000 5,000
20
40
60
Net O
DA re
ceiv
ed a
s %
of c
entr
al g
over
nmen
t exp
ense
GNI per capita, Atlas method ($)
80
100
120
LIC LMIC
25
How has the composition and volume of official development finance (concessional and non-concessional) evolved?Looking at data for 33 reclassifications between 1995 and 2010,15 countries received as much ODF as a share of GDP after reclassification as before (Figure 6). This implies that, on average, the increase in OOFs was sufficient to compensate for the loss of ODA.
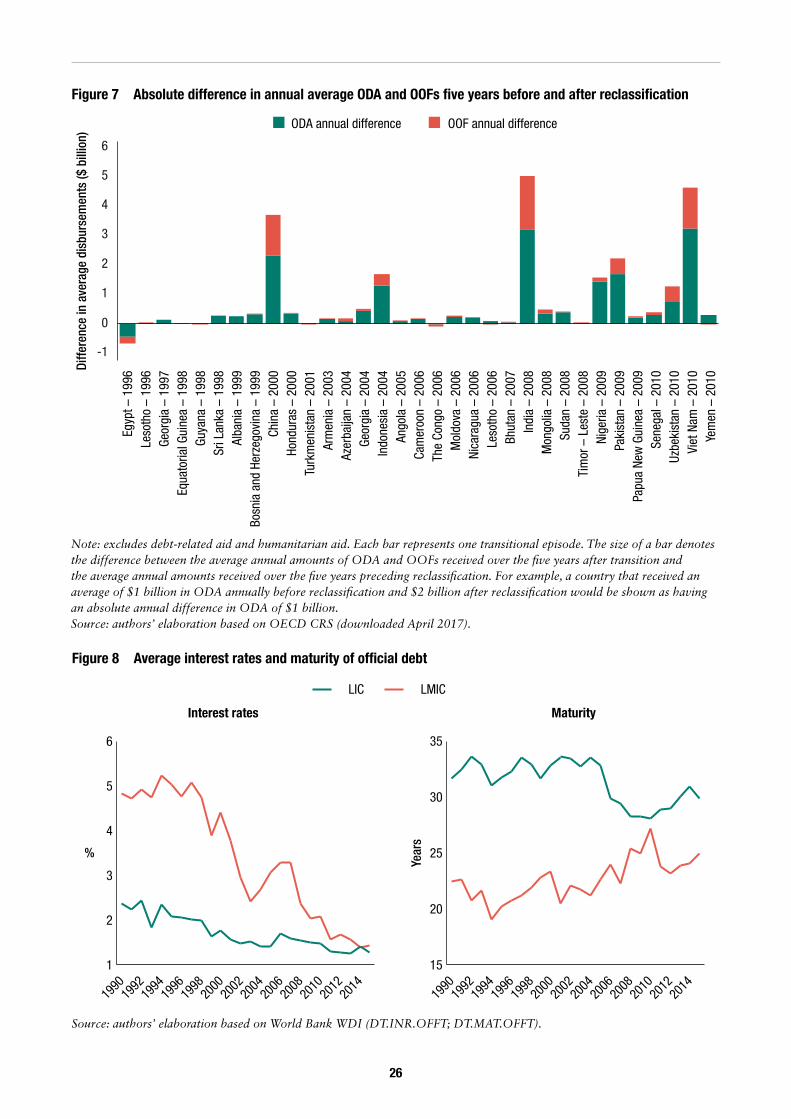
In absolute terms, both ODA and OOFs increased in most countries that were reclassified from LIC to LMIC status from the mid-2000s. Figure 7 shows the change in average ODA and OOFs over the five years before and after reclassification for 33 episodes. Most of countries saw an increase in both ODA flows and OOFs, while a small number saw a decrease in OOFs. While, on average, ODF continues to rise after reclassification, it increases more slowly than GDP.
15 For this analysis, data were available for 33 reclassification episodes from LIC to LMIC status since between 1995 and 2010.
2.2.2 Terms and conditions and sectoral allocation of official development finance
How have the terms and conditions of the different financing options evolved? Newly reclassified LMICs face not only a higher share of loans in their ODF, but also tougher terms on those loans, i.e. shorter maturities and higher interest rates. On average, and unsurprisingly, LICs benefit from both lower interest rates and longer maturities on their official loans than LMICs. The differences in terms for the two income categories have been reduced in recent years, especially interest rates, reflecting low interest rates globally. Almost all developing countries saw a decrease in interest rates between 1990 and 2016, regardless of reclassification (Figure 8).
Figure 5 Aid dependency before and after reclassification to LMIC (normalised)
Note: 50% band includes second and third quartiles. Normalised so that aid dependency at transition = 100. Source: authors’ elaboration based on World Bank WDI (DT.ODA.ODAT.XP.ZS).
0
50
100
150
100
250
Years relative to reclassification
-5 -4 -3 -2 -1 +1 +2 +3 +4 +5
Reclassi�cation
Aid
depe
nden
cy (r
ecla
ssifi
catio
n ye
ar =
100
)Figure 6 ODF as a share of GDP before and after reclassification to LMIC
Note: 50% band includes second and third quartiles. Normalised so that value at year of transition = 100. Excludes debt-related aid and humanitarian aid. Source: Authors’ elaboration based on OECD CRS (downloaded April 2017).
0
50
100
150
100
250
Years relative to reclassification
-5 -4 -3 -2 -1 +1 +2 +3 +4 +5
Reclassi�cation
ODF
as a
sha
re o
f GDP
(rec
lass
ifica
tion
= 1
00)
26
Figure 7 Absolute difference in annual average ODA and OOFs five years before and after reclassification
Note: excludes debt-related aid and humanitarian aid. Each bar represents one transitional episode. The size of a bar denotes the difference between the average annual amounts of ODA and OOFs received over the five years after transition and the average annual amounts received over the five years preceding reclassification. For example, a country that received an average of $1 billion in ODA annually before reclassification and $2 billion after reclassification would be shown as having an absolute annual difference in ODA of $1 billion.Source: authors’ elaboration based on OECD CRS (downloaded April 2017).
6
5
4
3
2
1
0
-1
Egyp
t – 1
996Di
ffere
nce
in a
vera
ge d
isbu
rsem
ents
($ b
illio
n)
ODA annual difference OOF annual difference
Yem
en –
201
0Vi
et N
am –
201
0Uz
beki
stan
– 2
010
Sene
gal –
201
0Pa
pua
New
Gui
nea
– 20
09Pa
kist
an –
200
9Ni
geria
– 2
009
Tim
or –
Les
te –
200
8Su
dan
– 20
08M
ongo
lia –
200
8In
dia
– 20
08Bh
utan
– 2
007
Leso
tho
– 20
06Ni
cara
gua
– 20
06M
oldo
va –
200
6Th
e Co
ngo
– 20
06Ca
mer
oon
– 20
06An
gola
– 2
005
Indo
nesi
a –
2004
Geor
gia
– 20
04Az
erba
ijan
– 20
04Ar
men
ia –
200
3Tu
rkm
enis
tan
– 20
01Ho
ndur
as –
200
0Ch
ina
– 20
00Bo
snia
and
Her
zego
vina
– 1
999
Alba
nia
– 19
99Sr
i Lan
ka –
199
8Gu
yana
– 1
998
Equa
toria
l Gui
nea
– 19
98Ge
orgi
a –
1997
Leso
tho
– 19
96
Figure 8 Average interest rates and maturity of official debt
Source: authors’ elaboration based on World Bank WDI (DT.INR.OFFT; DT.MAT.OFFT).
Interest rates Maturity
1
2
3
%
Year
s
4
5
6
LMICLIC
2014
2012
2010
2008
2006
2004
2002
2000
1998
1996
1994
1992
1990
15
20
25
30
35
2014
2012
2010
2008
2006
2004
2002
2000
1998
1996
1994
1992
1990
27
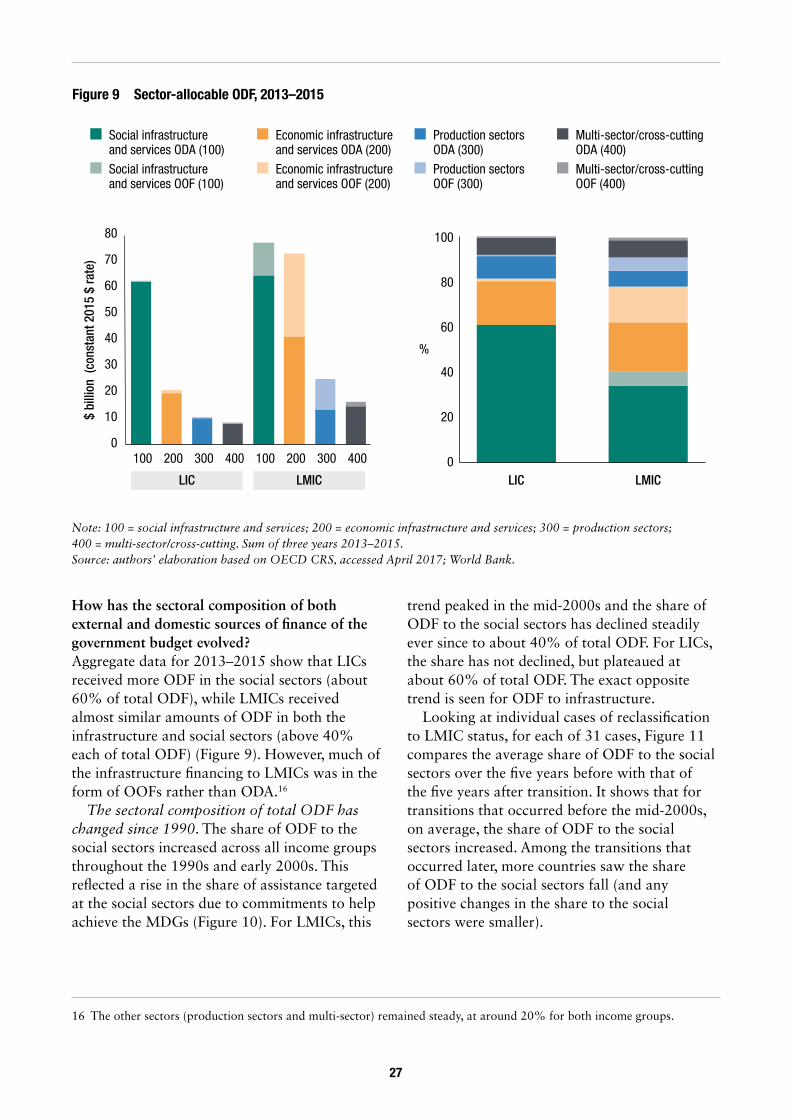
How has the sectoral composition of both external and domestic sources of finance of the government budget evolved? Aggregate data for 2013–2015 show that LICs received more ODF in the social sectors (about 60% of total ODF), while LMICs received almost similar amounts of ODF in both the infrastructure and social sectors (above 40% each of total ODF) (Figure 9). However, much of the infrastructure financing to LMICs was in the form of OOFs rather than ODA.16
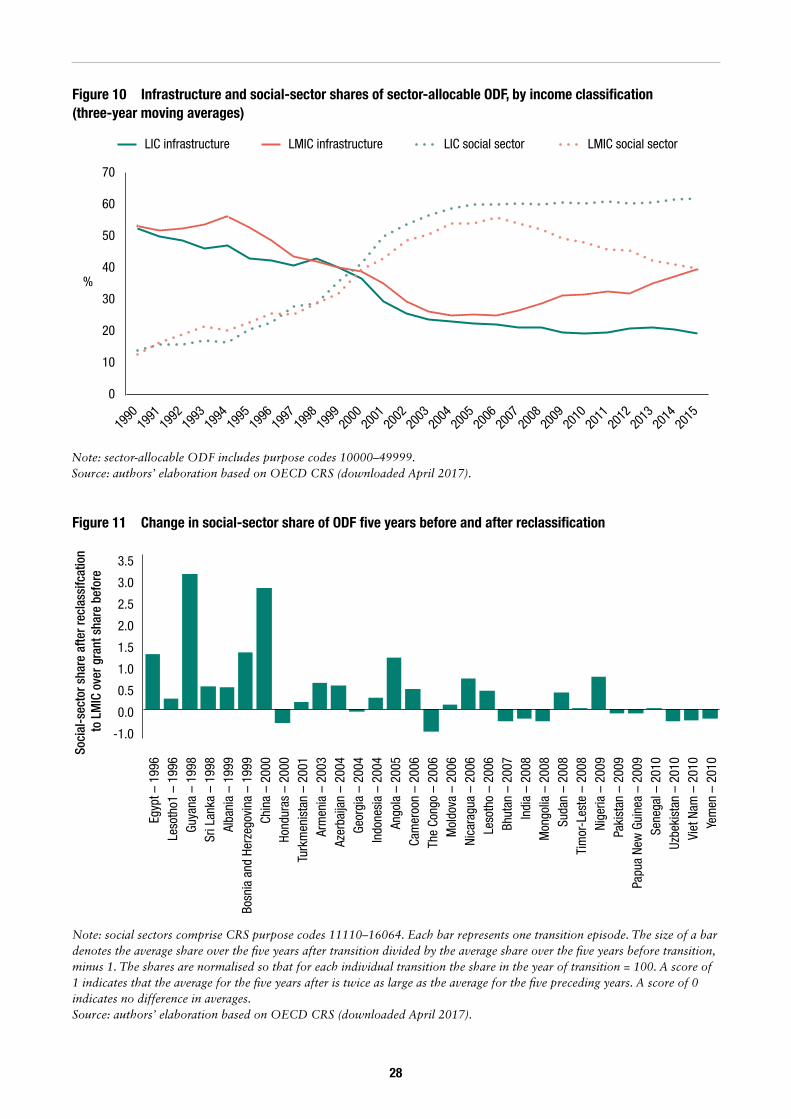
The sectoral composition of total ODF has changed since 1990. The share of ODF to the social sectors increased across all income groups throughout the 1990s and early 2000s. This reflected a rise in the share of assistance targeted at the social sectors due to commitments to help achieve the MDGs (Figure 10). For LMICs, this
16 The other sectors (production sectors and multi-sector) remained steady, at around 20% for both income groups.
trend peaked in the mid-2000s and the share of ODF to the social sectors has declined steadily ever since to about 40% of total ODF. For LICs, the share has not declined, but plateaued at about 60% of total ODF. The exact opposite trend is seen for ODF to infrastructure.
Looking at individual cases of reclassification to LMIC status, for each of 31 cases, Figure 11 compares the average share of ODF to the social sectors over the five years before with that of the five years after transition. It shows that for transitions that occurred before the mid-2000s, on average, the share of ODF to the social sectors increased. Among the transitions that occurred later, more countries saw the share of ODF to the social sectors fall (and any positive changes in the share to the social sectors were smaller).
Figure 9 Sector-allocable ODF, 2013–2015
Note: 100 = social infrastructure and services; 200 = economic infrastructure and services; 300 = production sectors; 400 = multi-sector/cross-cutting. Sum of three years 2013–2015. Source: authors’ elaboration based on OECD CRS, accessed April 2017; World Bank.
0
10
20
30
40
50
60
70
80
100 200 300 400 100 200 300 400
LIC LMIC LIC LMIC
$ bi
llion
(co
nsta
nt 2
015
$ ra
te)
0
20
40
60
80
100
Social infrastructure and services ODA (100)
Social infrastructureand services OOF (100)
Economic infrastructure and services ODA (200)
Economic infrastructureand services OOF (200)
Production sectorsODA (300)
Production sectorsOOF (300)
Multi-sector/cross-cuttingODA (400)
Multi-sector/cross-cuttingOOF (400)
%
28
Figure 10 Infrastructure and social-sector shares of sector-allocable ODF, by income classification (three-year moving averages)
Note: sector-allocable ODF includes purpose codes 10000–49999. Source: authors’ elaboration based on OECD CRS (downloaded April 2017).
0
10
20
30
40%
50
60
70
1990
1991
1992
1993
1994
1995
1996
1997
1998
1999
2000
2001
2002
2003
2004
2005
2006
2007
2008
2009
2010
2011
2012
2013
2014
2015
LIC infrastructure LMIC infrastructure LIC social sector LMIC social sector
Figure 11 Change in social-sector share of ODF five years before and after reclassification
Note: social sectors comprise CRS purpose codes 11110–16064. Each bar represents one transition episode. The size of a bar denotes the average share over the five years after transition divided by the average share over the five years before transition, minus 1. The shares are normalised so that for each individual transition the share in the year of transition = 100. A score of 1 indicates that the average for the five years after is twice as large as the average for the five preceding years. A score of 0 indicates no difference in averages. Source: authors’ elaboration based on OECD CRS (downloaded April 2017).
-1.0
0.0
0.5
1.0
1.5
2.0
2.5
3.0
3.5
Egyp
t – 1
996
Leso
tho1
– 1
996
Guya
na –
199
8Sr
i Lan
ka –
199
8Al
bani
a –
1999
Bosn
ia a
nd H
erze
govi
na –
199
9Ch
ina
– 20
00Ho
ndur
as –
200
0Tu
rkm
enis
tan
– 20
01Ar
men
ia –
200
3Az
erba
ijan
– 20
04Ge
orgi
a –
2004
Indo
nesi
a –
2004
Ango
la –
200
5Ca
mer
oon
– 20
06 T
he C
ongo
– 2
006
Mol
dova
– 2
006
Nica
ragu
a –
2006
Leso
tho
– 20
06Bh
utan
– 2
007
Indi
a –
2008
Mon
golia
– 2
008
Suda
n –
2008
Tim
or-L
este
– 2
008
Nige
ria –
200
9Pa
kist
an –
200
9Pa
pua
New
Gui
nea
– 20
09Se
nega
l – 2
010
Uzbe
kist
an –
201
0Vi
et N
am –
201
0Ye
men
– 2
010
Soci
al-s
ecto
r sha
re a
fter r
ecla
ssifc
atio
n to
LM
IC o
ver g
rant
sha
re b
efor
e
29
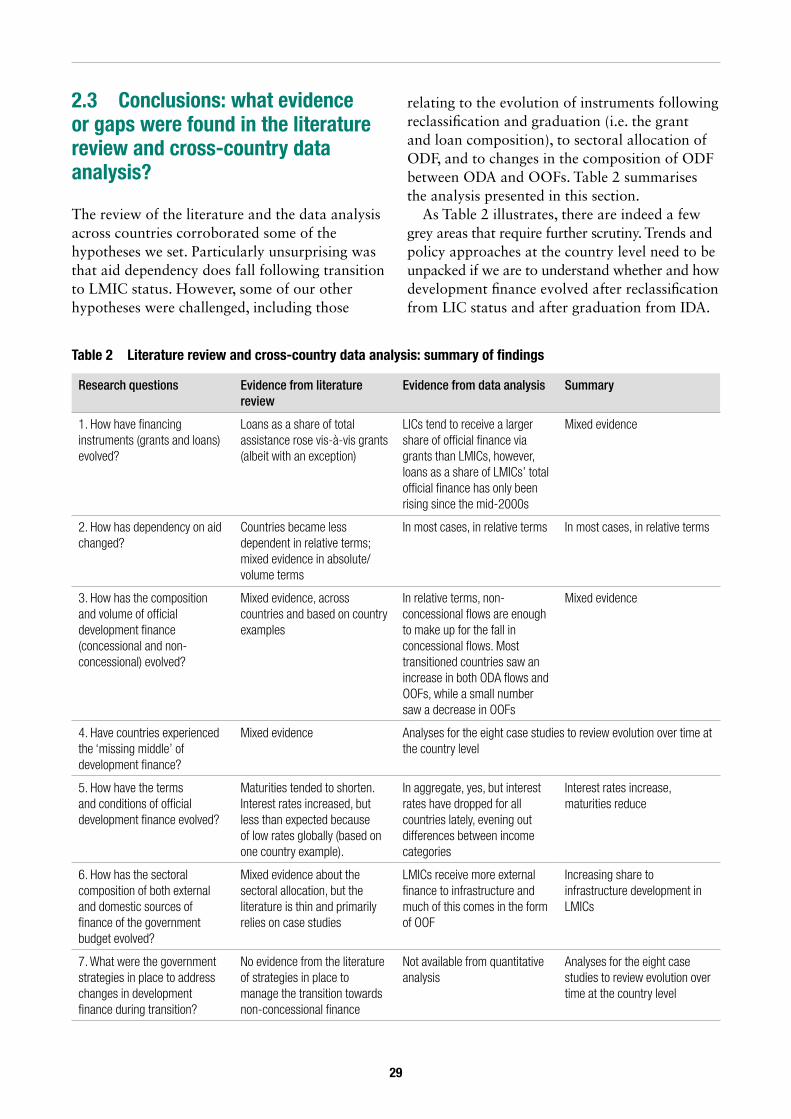
2.3 Conclusions: what evidence or gaps were found in the literature review and cross-country data analysis?
The review of the literature and the data analysis across countries corroborated some of the hypotheses we set. Particularly unsurprising was that aid dependency does fall following transition to LMIC status. However, some of our other hypotheses were challenged, including those
relating to the evolution of instruments following reclassification and graduation (i.e. the grant and loan composition), to sectoral allocation of ODF, and to changes in the composition of ODF between ODA and OOFs. Table 2 summarises the analysis presented in this section.
As Table 2 illustrates, there are indeed a few grey areas that require further scrutiny. Trends and policy approaches at the country level need to be unpacked if we are to understand whether and how development finance evolved after reclassification from LIC status and after graduation from IDA.
Research questions Evidence from literature review
Evidence from data analysis Summary
1. How have financing instruments (grants and loans) evolved?
Loans as a share of total assistance rose vis-à-vis grants (albeit with an exception)
LICs tend to receive a larger share of official finance via grants than LMICs, however, loans as a share of LMICs’ total official finance has only been rising since the mid-2000s
Mixed evidence
2. How has dependency on aid changed?
Countries became less dependent in relative terms; mixed evidence in absolute/volume terms
In most cases, in relative terms In most cases, in relative terms
3. How has the composition and volume of official development finance (concessional and non-concessional) evolved?
Mixed evidence, across countries and based on country examples
In relative terms, non-concessional flows are enough to make up for the fall in concessional flows. Most transitioned countries saw an increase in both ODA flows and OOFs, while a small number saw a decrease in OOFs
Mixed evidence
4. Have countries experienced the ‘missing middle’ of development finance?
Mixed evidence Analyses for the eight case studies to review evolution over time at the country level
5. How have the terms and conditions of official development finance evolved?
Maturities tended to shorten. Interest rates increased, but less than expected because of low rates globally (based on one country example).
In aggregate, yes, but interest rates have dropped for all countries lately, evening out differences between income categories
Interest rates increase, maturities reduce
6. How has the sectoral composition of both external and domestic sources of finance of the government budget evolved?
Mixed evidence about the sectoral allocation, but the literature is thin and primarily relies on case studies
LMICs receive more external finance to infrastructure and much of this comes in the form of OOF
Increasing share to infrastructure development in LMICs
7. What were the government strategies in place to address changes in development finance during transition?
No evidence from the literature of strategies in place to manage the transition towards non-concessional finance
Not available from quantitative analysis
Analyses for the eight case studies to review evolution over time at the country level
Table 2 Literature review and cross-country data analysis: summary of findings
30
The eight case studies presented in Sections 3 to 5 give a more granular assessment, grounding changing patterns in a country’s political economy,
economic, social and political contexts, which affect and drive decisions on access, volume and terms and conditions of both ODF and public finance.
31
Egypt Ghana Lao PDR Nigeria Pakistan Papua New Guinea**
Sri Lanka
Viet Nam
Year of reclassification from LIC to LMIC*
1996 2011 2011 2009 2009 2009 1998 2010
Operational classification: World Bank
IBRD IDA IDA Blend Blend Blend IBRD IBRD
Operational classification: regional development bank, as of FY2018 (bank)
Non-concessional(AfDB)
Concessional(AfDB)
Concessional(ADB)
Non-concessional(AfDB)
Blend(ADB)
Blend(ADB)
Blend(ADB)
Blend(ADB)
Table 3 Overview of analytical and operational classifications
*Years are the calendar year the World Bank classification was changed (i.e. the year after crossing the threshold).**Classified as LMIC until 2000. AfDB, African Development Bank; ADB, Asian Development Bank. Source: World Bank OGHIST; AfDB and ADB websites.
3 Case-study overview and country contexts
This report is the very first attempt to look systematically at the impact on development financing during this transition from low to middle-income country, and the first to examine the experiences of countries as they go through transition. We took a case-study approach to delve into the trajectories and experiences of eight countries, with the aim of filling the gaps identified in the literature review and data analysis. In this section, we describe the economic, social and political contexts shaping decisions on volumes and allocations of finance across the eight country case studies. Sections 4 and 5 elaborate on the main findings for the eight countries (on development finance and strategic approaches, respectively).
3.1 Overview of the eight country case studies
Eight countries were chosen as subjects for the case studies: Egypt, Ghana, Lao PDR, Nigeria, Pakistan, Papua New Guinea, Sri Lanka and Viet Nam. Box 2 elaborates on the criteria used in the selection of this group of countries.
All these economies are now classified as LMICs and were all reclassified as LMIC or graduated from IDA between 1995 and 2012 (Table 3). We chose 2012 as the cut-off year so there would be sufficient time-series data to allow analysis of trajectories of development finance and financing strategies after reclassification to LMIC status or graduation from IDA (or the soft windows of the MDBs).
32
3.2 An overview of the economic, social and political contexts shaping volume and allocation of financeA country’s economic context, social challenges and political situation shape its access to development finance. Following a framework elaborated in Prizzon et al. (2016), we would, for example, assume that countries with higher rates of economic growth have greater opportunities to access international capital markets and diversify funding sources. Similarly, we would expect countries of geostrategic importance to be in a stronger negotiating position in relation to their development partners.
In this section we analyse the key dimensions of the economic, social and political contexts of the eight case-study countries to inform the analysis in Sections 4 and 5 (albeit with
a certain degree of simplification, given the large number of countries reviewed). Annex 3 presents individual country factsheets, summarising key dimensions of the economic, social and political contexts in the case study countries, as well as trends for financing development during the transition from LMIC status and/or graduation from the soft windows of the MDBs.
3.2.1 Economic context
Macroeconomic performance
Most countries posted a strong economic performance from the early 2000s and weathered the consequences of the 2007–08 international financial and economic crisis. We can cluster the eight case studies into three main groups.
Box 2 Criteria for case-study selection
To be considered for inclusion in this study, countries had to meet the following criteria:1
• Were classified as a middle-income country during World Bank FY2017. Low-income and high-income economies were thus excluded.
• Were not small island developing states or countries with a population below 1 million or above 1 billion. Small island developing states are usually IDA eligible, regardless of their income per capita. Countries with a population above 1 billion (China and India) were excluded because of the complexity of their economies.
• Were reclassified to LMIC status and/or graduated to IBRD at least five years ago (or at least five data points are available for the country). Countries such as Kenya, which became a blend country only in the last IDA replenishment, and Kyrgyzstan, which became an LMIC in 2013, were therefore excluded.
We wanted to ensure a balanced representation of countries by operational classification. Three of the countries selected have already graduated from the IDA window: Egypt (1998), Sri Lanka (2017) and Viet Nam (2017). The remaining five countries are all borrowing from IDA on blend terms, with Nigeria, Pakistan and Papua New Guinea also having access to IBRD loans.2 Note that IDA eligibility is based on more than just income level – Viet Nam, for example, graduated from IDA before countries with much higher GNI per capita, such as Nigeria and Papua New Guinea.
Finally, we wanted a balanced geographical representation across Africa, South Asia and South East Asia within the time horizon chosen (1995–2012).
Country selection was also influenced by pragmatic considerations, i.e. the degree of prior ODI contact and prior experience working in the country (especially in terms of access to local partners).
1 Indonesia was not considered because it had been used as a pilot case study.
2 Ghana and Lao PDR are both IDA countries, but borrow from IDA on blend terms.
33
• Lao PDR, Sri Lanka and Viet Nam recorded strong economic growth from the early 2000s, often above 7% annual GDP growth, though this has slowed recently.
• Ghana, Nigeria and Papua New Guinea, all oil and gas-rich economies,17 share a similar or even stronger economic growth path. However, their high dependence on natural resources meant the slump in oil and gas prices that started in 2014–15 translated into falling GNI per capita in these countries.
• Economic growth in Egypt and Pakistan was volatile or even negative. Egypt’s growth rate deteriorated in the early 2000s (not long after reclassification to LMIC and graduation from IDA). In Pakistan, economic performance was affected by economic policies of different governments and natural disasters. The country was the fourth richest among the group in 2000 (in per capita terms) and then had the lowest income per capita within the group until 2015.
The rebasing of Ghana’s and Nigeria’s national accounts had direct implications for their analytical classifications and even funding eligibility. In November 2010, nearly overnight, Ghana’s GNI per capita crossed the IDA operational threshold as the result of the updated figures. In April 2014, the revised GNI per capita figures meant Nigeria became Africa’s largest economy, making it eligible, for example, for the accelerated phasing out of Gavi assistance.
Public finance
Low capacity to boost and expand fiscal revenues – at least as a share of GDP – is a common challenge across all the eight countries reviewed in this report. In the case of Egypt, total fiscal revenues as a share of GDP indeed fell from 35% in 1995 to 24.3% in 2002, the period of graduation from the soft windows of the MDBs. Ghana and Nigeria’s tax ratios are
17 Between 2014 and 2016, Ghana, Nigeria and Papua New Guinea all earned more than 70% of their export revenues from natural resources.
18 This share was 19.1% of total revenues in 2012, but dropped significantly to about 3.6% in 2016 (Source: General Statistics Office of Viet Nam).
well below the sub-Saharan African average (the tax-to-GDP ratio was on average 15% in Ghana and, following the decline in oil prices, 5.9% in 2016 in Nigeria). Viet Nam’s budget revenue depended significantly on revenue from crude oil until 2012.18 Between 2004 and 2006, Pakistan’s tax-to-GDP ratio was below 10%. The International Monetary Fund (IMF) programme, signed by the Government of Pakistan in 2013, included tax reforms as a condition, which allowed for the reduction of ad hoc exemptions and improvements in tax administration, thereby improving revenue collection. In terms of public revenue as a share of GDP, from 2005 to 2010 in Papua New Guinea the ratio decreased from 26.8% to 17.8% (Prizzon, 2014) and continued to fall afterwards. Section 4.4 will elaborate on this point, comparing trends in public finance vis-à-vis ODF.
In most countries, public expenditure as a share of GDP rose over time, as did fiscal deficits. In Ghana, for example, public expenditure increased from 22.5% in 2011 to 28% in 2017 (also because of a reform of civil-service wages). Nigeria and Papua New Guinea were the exceptions among the eight country case studies. In Nigeria, the fall in government revenues led to dramatic cuts in public expenditure, from 27% of GDP in 2000 to 11% in 2016 (the sub-Saharan African average was 21%). A similar trend, with a fall from 37% in 2011 to 22% in 2015, occurred in Papua New Guinea because of falling commodity prices (and thus falling government revenues).
Debt management and debt sustainability
Ensuring public debt remains sustainable has been a recurring challenge for several of the countries. Egypt and Nigeria both suffered debt crises in the early 1990s. Later, in the mid-2000s, Ghana and Nigeria received debt relief. Ghana benefitted from the World Bank’s Heavily Indebted Poor Country (HIPC) Initiative. Nigeria regained IDA status
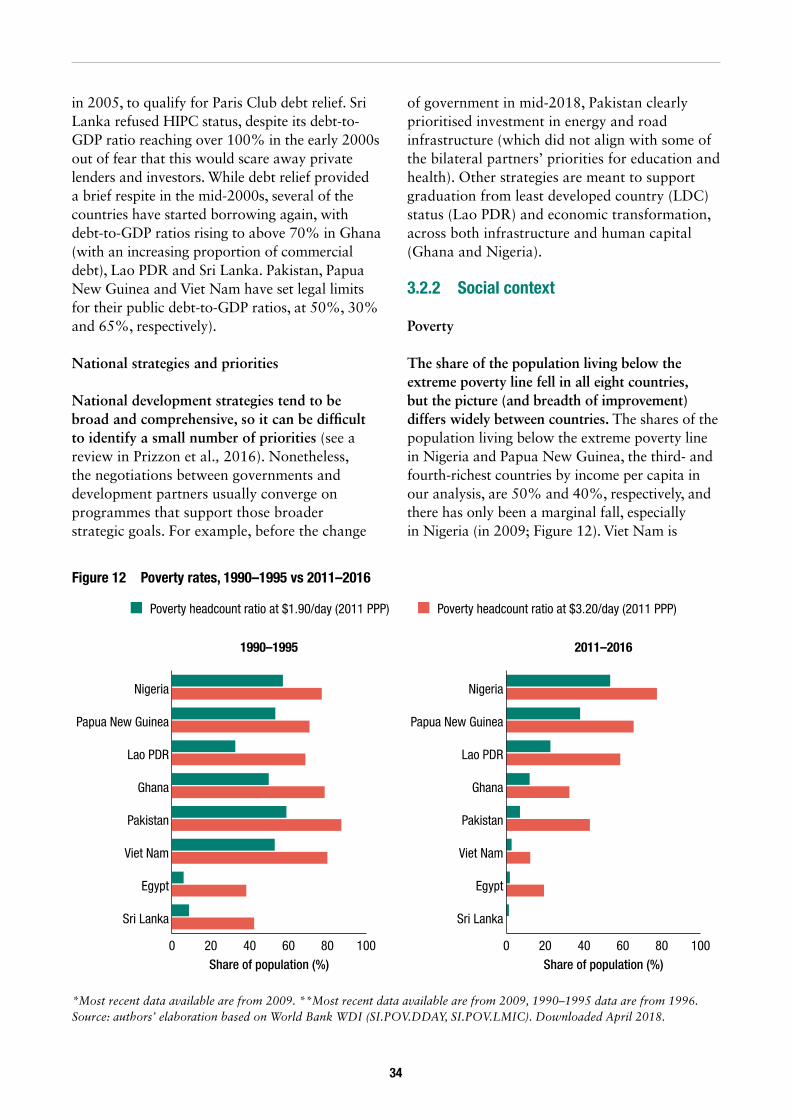
34
in 2005, to qualify for Paris Club debt relief. Sri Lanka refused HIPC status, despite its debt-to-GDP ratio reaching over 100% in the early 2000s out of fear that this would scare away private lenders and investors. While debt relief provided a brief respite in the mid-2000s, several of the countries have started borrowing again, with debt-to-GDP ratios rising to above 70% in Ghana (with an increasing proportion of commercial debt), Lao PDR and Sri Lanka. Pakistan, Papua New Guinea and Viet Nam have set legal limits for their public debt-to-GDP ratios, at 50%, 30% and 65%, respectively).
National strategies and priorities
National development strategies tend to be broad and comprehensive, so it can be difficult to identify a small number of priorities (see a review in Prizzon et al., 2016). Nonetheless, the negotiations between governments and development partners usually converge on programmes that support those broader strategic goals. For example, before the change
of government in mid-2018, Pakistan clearly prioritised investment in energy and road infrastructure (which did not align with some of the bilateral partners’ priorities for education and health). Other strategies are meant to support graduation from least developed country (LDC) status (Lao PDR) and economic transformation, across both infrastructure and human capital (Ghana and Nigeria).
3.2.2 Social context
Poverty
The share of the population living below the extreme poverty line fell in all eight countries, but the picture (and breadth of improvement) differs widely between countries. The shares of the population living below the extreme poverty line in Nigeria and Papua New Guinea, the third- and fourth-richest countries by income per capita in our analysis, are 50% and 40%, respectively, and there has only been a marginal fall, especially in Nigeria (in 2009; Figure 12). Viet Nam is
Figure 12 Poverty rates, 1990–1995 vs 2011–2016
*Most recent data available are from 2009. **Most recent data available are from 2009, 1990–1995 data are from 1996. Source: authors’ elaboration based on World Bank WDI (SI.POV.DDAY, SI.POV.LMIC). Downloaded April 2018.
1990–1995 2011–2016
0 20 40Share of population (%)
60 80 100
Poverty headcount ratio at $3.20/day (2011 PPP)Poverty headcount ratio at $1.90/day (2011 PPP)
Sri Lanka
Egypt
Viet Nam
Pakistan
Ghana
Lao PDR
Papua New Guinea
Nigeria
0 20 40Share of population (%)
60 80 100
Sri Lanka
Egypt
Viet Nam
Pakistan
Ghana
Lao PDR
Papua New Guinea
Nigeria
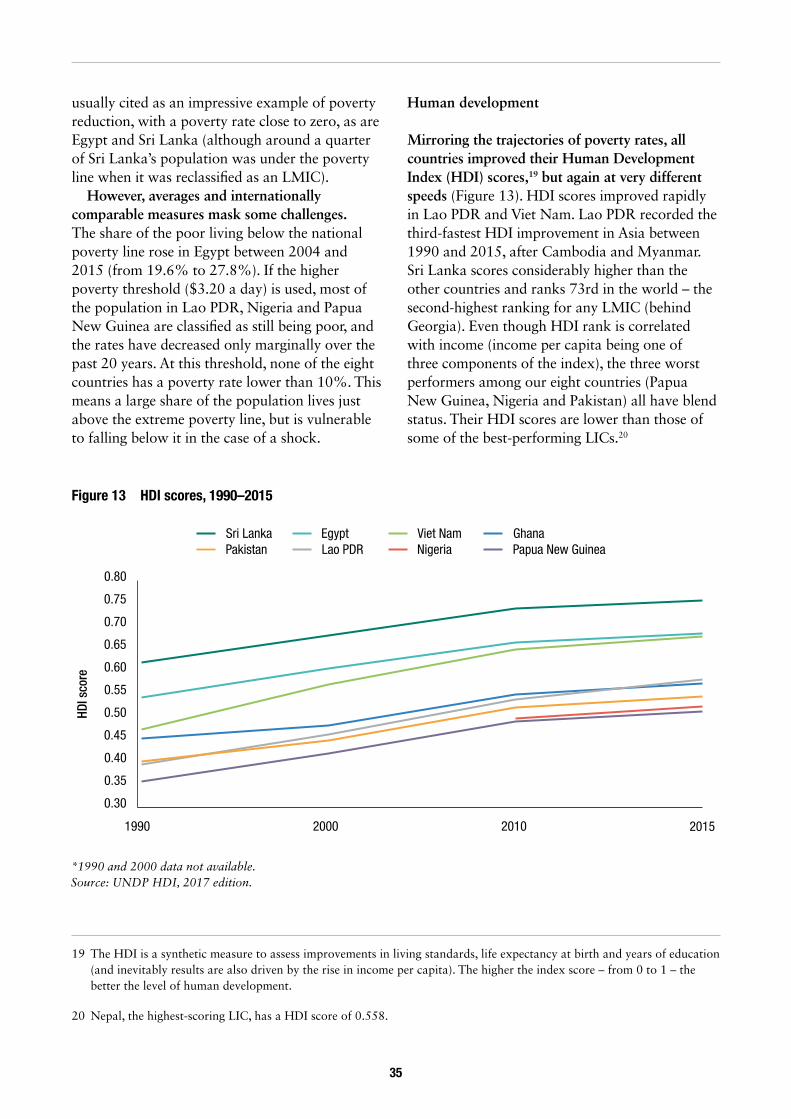
35
usually cited as an impressive example of poverty reduction, with a poverty rate close to zero, as are Egypt and Sri Lanka (although around a quarter of Sri Lanka’s population was under the poverty line when it was reclassified as an LMIC).
However, averages and internationally comparable measures mask some challenges. The share of the poor living below the national poverty line rose in Egypt between 2004 and 2015 (from 19.6% to 27.8%). If the higher poverty threshold ($3.20 a day) is used, most of the population in Lao PDR, Nigeria and Papua New Guinea are classified as still being poor, and the rates have decreased only marginally over the past 20 years. At this threshold, none of the eight countries has a poverty rate lower than 10%. This means a large share of the population lives just above the extreme poverty line, but is vulnerable to falling below it in the case of a shock.
19 The HDI is a synthetic measure to assess improvements in living standards, life expectancy at birth and years of education (and inevitably results are also driven by the rise in income per capita). The higher the index score – from 0 to 1 – the better the level of human development.
20 Nepal, the highest-scoring LIC, has a HDI score of 0.558.
Human development
Mirroring the trajectories of poverty rates, all countries improved their Human Development Index (HDI) scores,19 but again at very different speeds (Figure 13). HDI scores improved rapidly in Lao PDR and Viet Nam. Lao PDR recorded the third-fastest HDI improvement in Asia between 1990 and 2015, after Cambodia and Myanmar. Sri Lanka scores considerably higher than the other countries and ranks 73rd in the world – the second-highest ranking for any LMIC (behind Georgia). Even though HDI rank is correlated with income (income per capita being one of three components of the index), the three worst performers among our eight countries (Papua New Guinea, Nigeria and Pakistan) all have blend status. Their HDI scores are lower than those of some of the best-performing LICs.20
Figure 13 HDI scores, 1990–2015
*1990 and 2000 data not available. Source: UNDP HDI, 2017 edition.
0.30
0.35
0.40
0.45
0.50
0.55
0.60
0.65
0.70
0.75
0.80
1990 2000 2010 2015
Egypt GhanaLao PDRPakistan Papua New Guinea
Sri Lanka Viet NamNigeria
HDI s
core
36
Education and health
All in all, education and health indicators improved in all the countries reviewed in this report, again albeit at different speeds. The indicators considered in the case studies include: average years of school and school attendance rates; life expectancy at birth; and infant, child and maternity mortality rates and immunisation rates. (See the factsheets for the case study countries in Annex 3 on two of these indicators, life expectancy at birth and primary education enrolment rates.)
Challenges remain, though. Despite overall progress on the indicators, geographical imbalances in the quality of health care persist in Lao PDR, and in both education and health care in Ghana. In Nigeria, immunisation coverage improved, but fell far short of the increase needed to achieve the relevant MDG in 2015. In Papua New Guinea, immunisation rates against DTP (diphtheria-tetanus-pertussis) and measles for one-year-olds started falling in 2010 and recovered only in 2015.
3.2.3 Political context Egypt, Nigeria, Pakistan and Sri Lanka have experienced political instability, unrest and even wars. Ghana, Lao PDR, Viet Nam and, to a lesser extent, Papua New Guinea have seen more political stability. Instability can have consequences for development finance flows. For example, in Sri Lanka, development partners’ contributions were conditional upon peace talks. When the peace process stalled, traditional donors held back their funding; the Sri Lankan government then turned to other, non-traditional donors to make up the deficit (de Mel and de Silva, 2010).
Decentralisation also affects the ability of local governments to borrow from donors outside of central-government involvement. In Nigeria, state governments have the power to raise domestic loans independently, but external loans can only be contracted through the federal government, which guarantees and on-lends such loans to the state governments. Similarly, in Pakistan provincial governments can raise domestic and foreign loans, albeit below certain limits and with loan guarantees provided by the federal government.
For our case studies, global geopolitical trends are likely to have affected development finance flows. The wars in Afghanistan and Iraq led to an increase in aid to Pakistan from the US between the early 2000s and 2010. Historically, the US has been the largest donor to Egypt, because of the geostrategic position of the country in the Middle East region (recently such support has been cut). Refugee flows have also affected donor–recipient relations in many countries. Papua New Guinea is a notable example; since it started assisting Australia by housing asylum seekers, the balance of power in this relationship has shifted towards Papua New Guinea (Hayward-Jones, 2017).
Relations with bilateral donors and international financial institutions have been tense at times. In Ghana, development partners suspended their budgetary support disbursements in fiscal year 2013/14 because of poor macroeconomic performance (the coordination structures and platforms collapsed as a result). Similarly, the Nigerian government has been associated with fraud in the management of aid. Separate audit reports on grants from the Global Fund and Gavi have found systemic weaknesses in the management of funds by various government entities. While Pakistan was classified as a blend country, giving it the ability to access both concessional and non-concessional loans from the two large MDBs in Pakistan (World Bank and Asian Development Bank (ADB)), the fall in foreign-exchange reserves resulted in Pakistan not being able to draw down its IBRD non-concessional financing. Similar arguments applied to Lao PDR, after the 1997–1998 financial crisis, when the country had limited access to multilateral loans, in part because of its rising public debt. In Sri Lanka, tensions with an increasing number of donors following the 2004 tsunami and loan conditionalities imposed by multilateral and traditional bilateral donors mean the country has been approaching China and commercial lenders since 2005.
Finally, natural disasters, such as the tsunami in 2004 that affected Sri Lanka and the floods in 2010 in Pakistan, have led to a rise in humanitarian assistance to these countries.
37
3.2.4 Changes in donor mix Across the eight countries, the mix of the development partners has changed. (This will be reviewed as a key component of Section 4.) A few development partners either left a country (because of its reclassification to LMIC status, among other factors) or began to support development cooperation programmes, both on concessional and non-concessional terms (independently from the country’s income classification).
In some instances, the number of donors operating in a country increased, rather than fell, because of transition to LMIC. This is particularly the case in Egypt, where the number of donors nearly tripled between 1999 and 2015 (from 19 to 59). Despite more donors reporting aid figures to the DAC or joining the DAC since late 1990s, this is still a striking figure.
The rise of China as a donor has had a large impact on development finance in many of the case-study countries, especially countries geographically close to China. Lao PDR, Pakistan and Sri Lanka are all along the designated route for China’s Belt and Road Initiative. Chinese development assistance and investments have been expanding in Ghana, Nigeria and Papua New Guinea. In Ghana, China’s role as a source of investment capital has grown tremendously. Since 2010, Ghana has borrowed over $3.5 billion for investment projects and is in negotiation with Chinese companies for a barter arrangement to exchange minerals for infrastructure development. Between 2002 and 2013, China’s loans to Nigeria reached over 45% of the value of the total loan packages provided by DAC countries and MDBs, while Chinese export credits were equivalent to 74% of the total credit provided by both DAC countries and MDBs. Pakistan has become part of China’s Belt and Road Initiative, and the China-Pakistan Economic Corridor (CPEC) project has been launched, through which China is bringing investment into the country.21 China is expected to become the biggest source of capital for Pakistan. Sri Lanka has received some aid from China since the 1990s, but China has been a significant donor since around 2007.
21 The CPEC will focus on energy and road infrastructure projects. China will provide financing to Pakistan in the form of concessionary loans, zero-interest loans and direct investment.
ODF from the Republic of Korea has also increased. While Japan remained the largest donor to Lao PDR from 2008 to 2016, the Republic of Korea rose from being its fifth-largest donor in 2008–2010 to its second-largest in 2014–2016. The Republic of Korea has also begun to play a more prominent role in Nigeria’s development-finance environment. Development finance from the country rose to $91 million in 2015 from just $4.3 million in 2010. Before 2009, the World Bank, Japan, France and Germany were the main donors to Viet Nam and they provided more than 70% of total ODA to the country. After 2009, ADB and the Republic of Korea joined the group of main donors, together with Gavi and the Global Fund. The Republic of Korea replaced France as the main provider of OOFs to Viet Nam, reflecting its growing direct investment in Viet Nam’s manufacturing sectors, particularly electronics components.
A few donors have left or are planning to leave. The companion paper to this project (Jalles d’Orey and Prizzon, 2019) reviewed donors’ approaches to transition across the eight countries analysed in this report.
• More specifically, the Netherlands, the United Kingdom (UK) and Japan have cut their ODA to Ghana significantly since 2011. According to interviews with development partners, the Netherlands and Denmark are set to phase out development cooperation programmes and projects completely in the near future. The UK is considering the same course of action. These countries have turned their attention to promoting trade, investment and private-sector development.
• Several development partners have phased out their development cooperation programmes in Viet Nam. The Netherlands stopped bilateral support in 2012, then Sweden in 2013, Denmark in 2015, the UK (Department for International Development, or DFID) in 2016, Switzerland (Swiss Agency for Development Cooperation (SDC); the State Secretariat for Economic Affairs (SECO) is still present) in 2016 and Finland in fiscal year 2017/18.
38
According to the interviews, these partners’ decisions were primarily driven by the reclassification of Viet Nam to LMIC status.
• At present, only smaller donors have left Pakistan, so the impact on the overall financing has not been significant (even though, after the case study was completed, the US announced major cuts in its aid programme in early September 2018).
• In Sri Lanka, the Swedish International Development Cooperation Agency (Sida) left the country in March 2010. In 2007, Sweden decided to reduce its number of
focus countries and Sri Lanka was one of the countries that from which it decided to withdraw (McGillivray et al., 2012). The primary reason it gave was the lack of progress in achieving peace in Sri Lanka, with the reclassification to LMIC status cited as a secondary reason. Disbursements by Sida on loan projects continued until 2015. The SDC wound up its office in 2015, but assistance to Sri Lanka continues. Based on interviews with development partners, the reason to close the office in Colombo was the completion of post-war work directly implemented by the SDC.
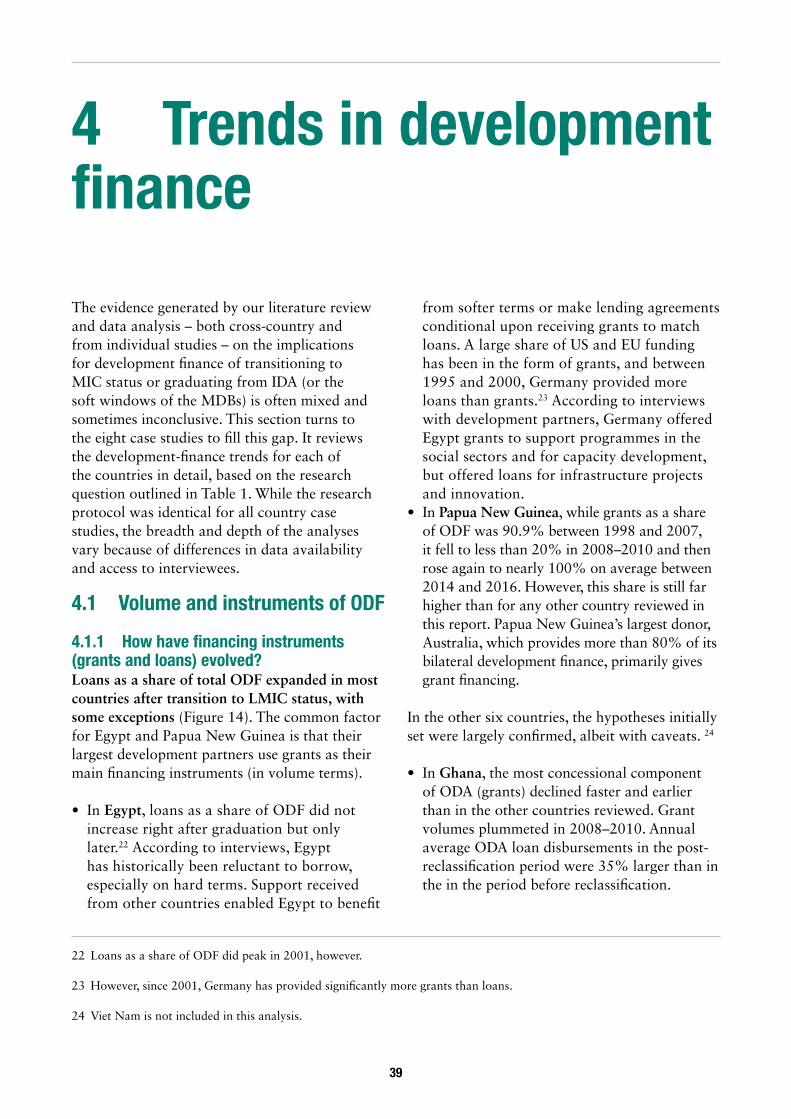
39
4 Trends in development finance
22 Loans as a share of ODF did peak in 2001, however.
23 However, since 2001, Germany has provided significantly more grants than loans.
24 Viet Nam is not included in this analysis.
The evidence generated by our literature review and data analysis – both cross-country and from individual studies – on the implications for development finance of transitioning to MIC status or graduating from IDA (or the soft windows of the MDBs) is often mixed and sometimes inconclusive. This section turns to the eight case studies to fill this gap. It reviews the development-finance trends for each of the countries in detail, based on the research question outlined in Table 1. While the research protocol was identical for all country case studies, the breadth and depth of the analyses vary because of differences in data availability and access to interviewees.
4.1 Volume and instruments of ODF
4.1.1 How have financing instruments (grants and loans) evolved?Loans as a share of total ODF expanded in most countries after transition to LMIC status, with some exceptions (Figure 14). The common factor for Egypt and Papua New Guinea is that their largest development partners use grants as their main financing instruments (in volume terms).
• In Egypt, loans as a share of ODF did not increase right after graduation but only later.22 According to interviews, Egypt has historically been reluctant to borrow, especially on hard terms. Support received from other countries enabled Egypt to benefit
from softer terms or make lending agreements conditional upon receiving grants to match loans. A large share of US and EU funding has been in the form of grants, and between 1995 and 2000, Germany provided more loans than grants.23 According to interviews with development partners, Germany offered Egypt grants to support programmes in the social sectors and for capacity development, but offered loans for infrastructure projects and innovation.
• In Papua New Guinea, while grants as a share of ODF was 90.9% between 1998 and 2007, it fell to less than 20% in 2008–2010 and then rose again to nearly 100% on average between 2014 and 2016. However, this share is still far higher than for any other country reviewed in this report. Papua New Guinea’s largest donor, Australia, which provides more than 80% of its bilateral development finance, primarily gives grant financing.
In the other six countries, the hypotheses initially set were largely confirmed, albeit with caveats. 24
• In Ghana, the most concessional component of ODA (grants) declined faster and earlier than in the other countries reviewed. Grant volumes plummeted in 2008–2010. Annual average ODA loan disbursements in the post-reclassification period were 35% larger than in the in the period before reclassification.
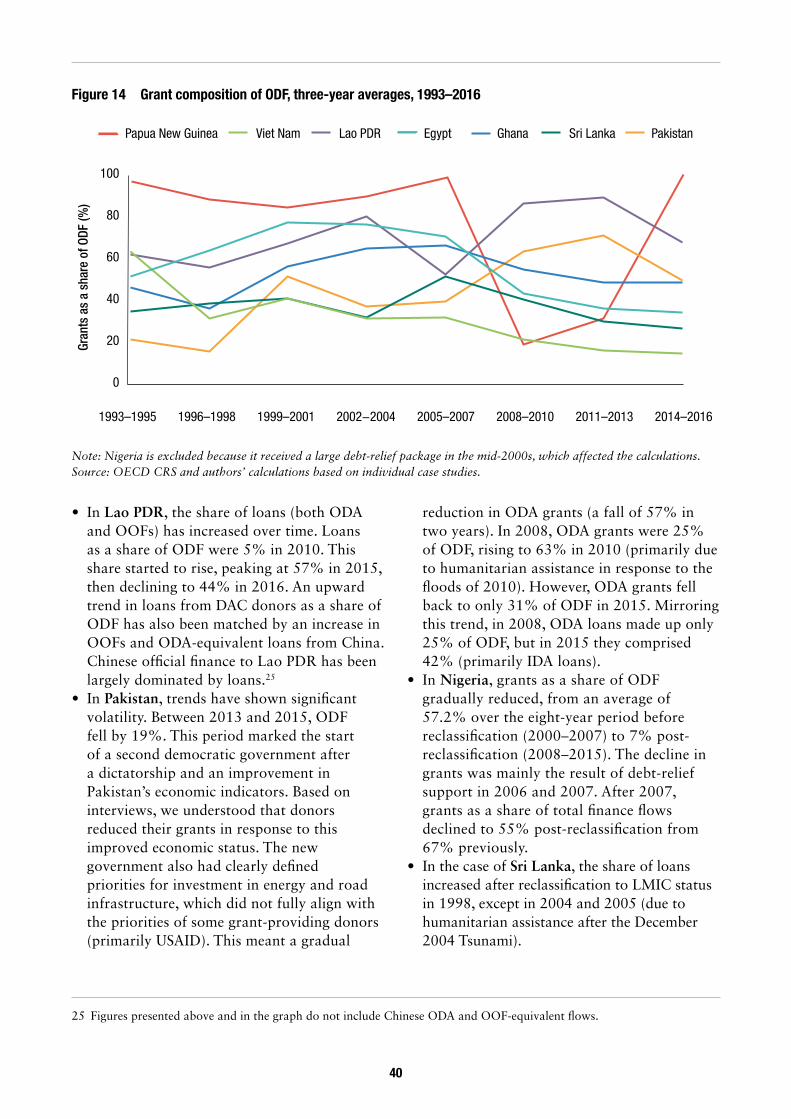
40
• In Lao PDR, the share of loans (both ODA and OOFs) has increased over time. Loans as a share of ODF were 5% in 2010. This share started to rise, peaking at 57% in 2015, then declining to 44% in 2016. An upward trend in loans from DAC donors as a share of ODF has also been matched by an increase in OOFs and ODA-equivalent loans from China. Chinese official finance to Lao PDR has been largely dominated by loans.25
• In Pakistan, trends have shown significant volatility. Between 2013 and 2015, ODF fell by 19%. This period marked the start of a second democratic government after a dictatorship and an improvement in Pakistan’s economic indicators. Based on interviews, we understood that donors reduced their grants in response to this improved economic status. The new government also had clearly defined priorities for investment in energy and road infrastructure, which did not fully align with the priorities of some grant-providing donors (primarily USAID). This meant a gradual
25 Figures presented above and in the graph do not include Chinese ODA and OOF-equivalent flows.
reduction in ODA grants (a fall of 57% in two years). In 2008, ODA grants were 25% of ODF, rising to 63% in 2010 (primarily due to humanitarian assistance in response to the floods of 2010). However, ODA grants fell back to only 31% of ODF in 2015. Mirroring this trend, in 2008, ODA loans made up only 25% of ODF, but in 2015 they comprised 42% (primarily IDA loans).
• In Nigeria, grants as a share of ODF gradually reduced, from an average of 57.2% over the eight-year period before reclassification (2000–2007) to 7% post-reclassification (2008–2015). The decline in grants was mainly the result of debt-relief support in 2006 and 2007. After 2007, grants as a share of total finance flows declined to 55% post-reclassification from 67% previously.
• In the case of Sri Lanka, the share of loans increased after reclassification to LMIC status in 1998, except in 2004 and 2005 (due to humanitarian assistance after the December 2004 Tsunami).
Figure 14 Grant composition of ODF, three-year averages, 1993–2016
Note: Nigeria is excluded because it received a large debt-relief package in the mid-2000s, which affected the calculations. Source: OECD CRS and authors’ calculations based on individual case studies.
0
20
40
60
80
100
1993–1995 1996–1998 1999–2001 2002−2004 2005–2007 2008–2010 2011–2013 2014–2016
Papua New Guinea Lao PDR PakistanGhana Sri LankaViet Nam Egypt
Gran
ts a
s a
shar
e of
ODF
(%)
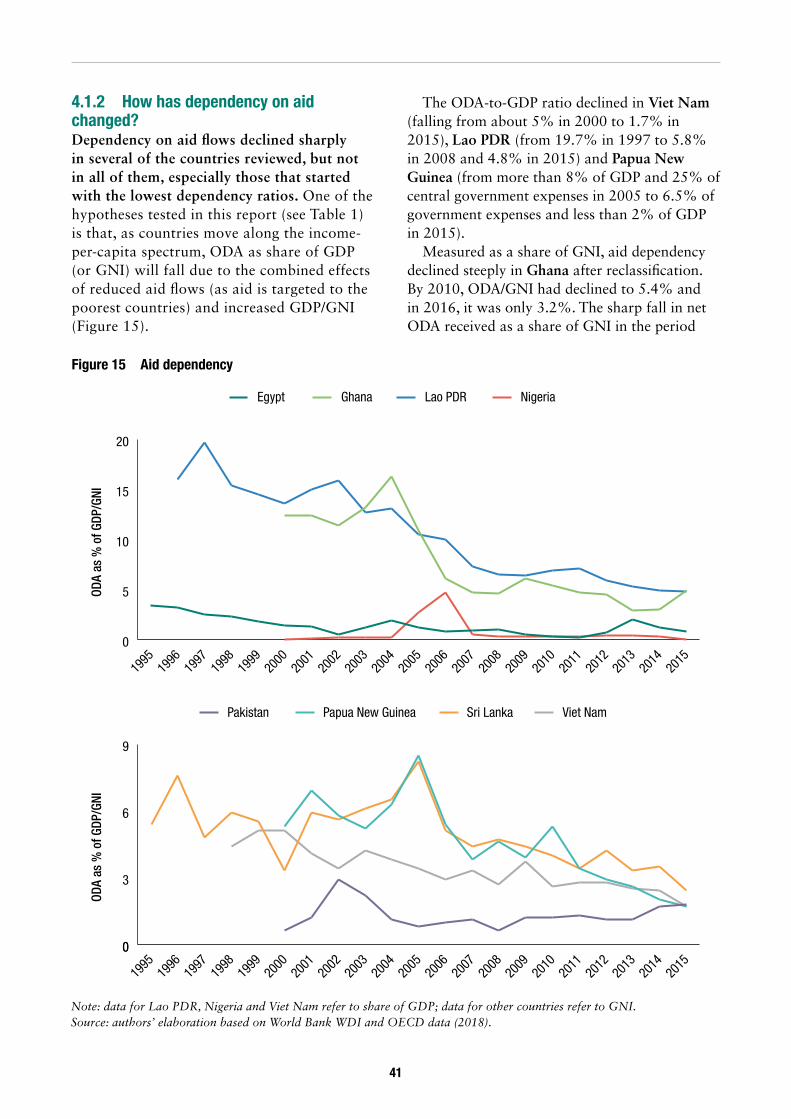
41
4.1.2 How has dependency on aid changed?Dependency on aid flows declined sharply in several of the countries reviewed, but not in all of them, especially those that started with the lowest dependency ratios. One of the hypotheses tested in this report (see Table 1) is that, as countries move along the income-per-capita spectrum, ODA as share of GDP (or GNI) will fall due to the combined effects of reduced aid flows (as aid is targeted to the poorest countries) and increased GDP/GNI (Figure 15).
The ODA-to-GDP ratio declined in Viet Nam (falling from about 5% in 2000 to 1.7% in 2015), Lao PDR (from 19.7% in 1997 to 5.8% in 2008 and 4.8% in 2015) and Papua New Guinea (from more than 8% of GDP and 25% of central government expenses in 2005 to 6.5% of government expenses and less than 2% of GDP in 2015).
Measured as a share of GNI, aid dependency declined steeply in Ghana after reclassification. By 2010, ODA/GNI had declined to 5.4% and in 2016, it was only 3.2%. The sharp fall in net ODA received as a share of GNI in the period
Figure 15 Aid dependency
Note: data for Lao PDR, Nigeria and Viet Nam refer to share of GDP; data for other countries refer to GNI. Source: authors’ elaboration based on World Bank WDI and OECD data (2018).
0
5
10
ODA
as %
of G
DP/G
NI 15
20
0
ODA
as %
of G
DP/G
NI
NigeriaLao PDRGhanaEgypt
2015
2014
2013
2012
2011
2010
2009
2008
2007
2006
2005
2004
2003
2002
2001
2000
1999
1998
1997
1996
1995
0
3
6
9
Viet NamSri LankaPapua New GuineaPakistan
2015
2014
2013
2012
2011
2010
2009
2008
2007
2006
2005
2004
2003
2002
2001
2000
1999
1998
1997
1996
1995
42
2014–2016 – a 24% fall in cumulative receipts equivalent to $240 million – was driven by a reduction in grant financing, an increase in debt servicing on loans from multilateral institutions and GDP growth that increased the denominator significantly, especially following the GDP rebasing exercise.
The other countries had more volatile patterns. In Egypt, the ratio first decreased gradually well before graduation from IDA status, but then increased prior to the presidential elections in 2004 and in 2013. Pakistan’s dependency on ODA is low. From 2000 to 2015, the share never exceeded 3% of GDP. ODA accounted for 12% on average of total revenue, despite Pakistan’s weak revenue performance (but it has increased over time). In Nigeria, ODA as a share of GDP has remained relatively flat since 2000 (except during the debt-relief period of 2005–2006) and since 2008, it has been below 0.5% of GDP.
4.1.3 How has the composition and volume of official development finance (concessional and non-concessional) evolved?The short answer is that ODA increased in nearly all countries after reclassification to LMIC status and graduation from the soft windows of the MDBs, the exceptions being Ghana and, more recently, Sri Lanka and Viet Nam, with the increase in OOFs partly compensating for the fall in ODA in these last two countries (Figure 16).
Why is the case? The economic, social and geostrategic dimensions illustrated in Section 3 can help us understand these trends.
• In the case of Egypt, the shift from blend to solely IBRD lending has meant less concessional loan terms, but it also led to a much larger inflow of funds a few years after graduation. Total official finance fell rapidly from the late 1990s and the fall in ODA was not offset by the rise in OOFs. The sharp rise in ODF in 2013–2015 was driven by assistance from the United Arab Emirates.26
• In Lao PDR, the main donors that have been contributing to rising ODA flows include Japan, the Republic of Korea, the ADB and
26 The largest investments were directed towards ‘general budget support related aid’, loans and grants for the Central Bank of Egypt and financial assistance in oil and gas.
the World Bank, alongside China (accounted as OOFs). The increase in ODA flows to Lao PDR from DAC members has been complemented by an increase in OOFs from China (not reported here).
• In Nigeria, ODF grew 5.3% (from $3.4 billion to $3.6 billion) from 2014 to 2015, although this was slower than the 8.4% recorded over the previous five-year period.
• From 2000 to 2015, Pakistan has seen an annual average growth rate of 8% in ODF. In the early 2000s, there was a peak in ODA grants, as Pakistan received large inflows of development assistance in recognition of its support for Western military action in Afghanistan.
• In Papua New Guinea, bilateral and multilateral agencies scaled up their assistance to the country after it was reclassified to LMIC status. The increase in multilateral financing was mainly due to the ADB, Global Fund and Gavi. Interviews with stakeholders indicated, however, that most donors’ ODA decisions were not influenced by the World Bank’s decision to reclassify Papua New Guinea as a LMIC. Rather than reduce their ODA, most donors committed to larger aid flows. Chinese aid to Papua New Guinea has also grown significantly, possibly making China the second-largest donor (although Australia remains 10 times larger; not reported in the graph).
• Assistance to Sri Lanka shows a positive trend from 2006, after the country approached China and India for assistance, which came without preconditions (not included in the Figure 16). Thus, no reduction in funding is noted after reclassification to LMIC status; in fact, the opposite is observed, because of humanitarian aid provided after the tsunami in 2004 and support for the peace process and post-conflict reconstruction. This trend was confirmed by interviews with development partners and government agencies.
• In the case of Viet Nam, ODA started to fall, but total OOFs increased significantly, mainly because the government borrowed from the World Bank, the ADB and Japan to implement the its fiscal stimulus package. This was
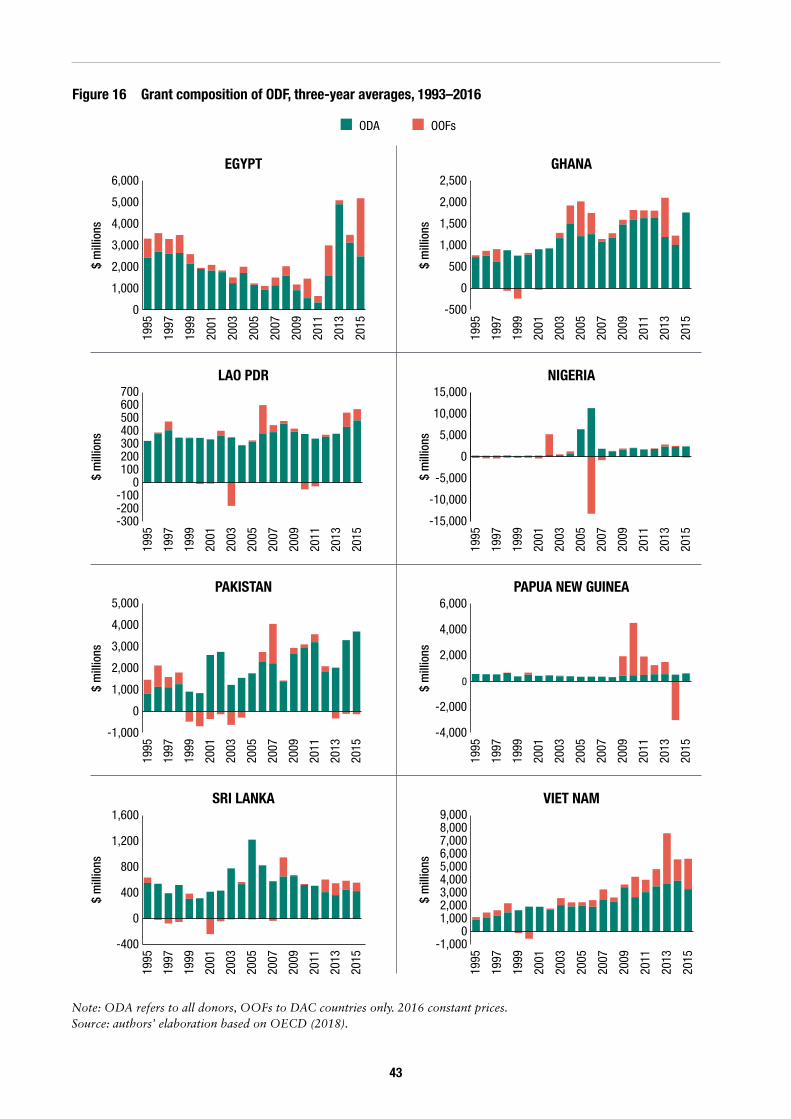
43
Figure 16 Grant composition of ODF, three-year averages, 1993–2016
Note: ODA refers to all donors, OOFs to DAC countries only. 2016 constant prices. Source: authors’ elaboration based on OECD (2018).
0
1,000
2,000
3,000
$ m
illio
ns 4,000
5,000
6,000
OOFsODA
2015
2013
2011
2009
2007
2005
2003
2001
1999
1997
1995
2015
2013
2011
2009
2007
2005
2003
2001
1999
1997
1995
2015
2013
2011
2009
2007
2005
2003
2001
1999
1997
1995
2015
2013
2011
2009
2007
2005
2003
2001
1999
1997
1995
2015
2013
2011
2009
2007
2005
2003
2001
1999
1997
1995
2015
2013
2011
2009
2007
2005
2003
2001
1999
1997
1995
2015
2013
2011
2009
2007
2005
2003
2001
1999
1997
1995
2015
2013
2011
2009
2007
2005
2003
2001
1999
1997
1995
EGYPT
$ m
illio
ns
LAO PDR
$ m
illio
ns
PAKISTAN
$ m
illio
ns
SRI LANKA
$ m
illio
ns
GHANA
$ m
illio
ns
NIGERIA
$ m
illio
ns
PAPUA NEW GUINEA
$ m
illio
ns
VIET NAM
-15,000
-10,000
-5,000
0
5,000
10,000
15,000
-500
0
500
1,000
1,500
2,000
2,500
-300-200-100
0100200300400500600700
-1,000
0
1,000
2,000
3,000
4,000
5,000
-4,000
-2,000
0
2,000
4,000
6,000
-400
0
400
800
1,200
1,600
-1,0000
1,0002,0003,0004,0005,0006,0007,0008,0009,000
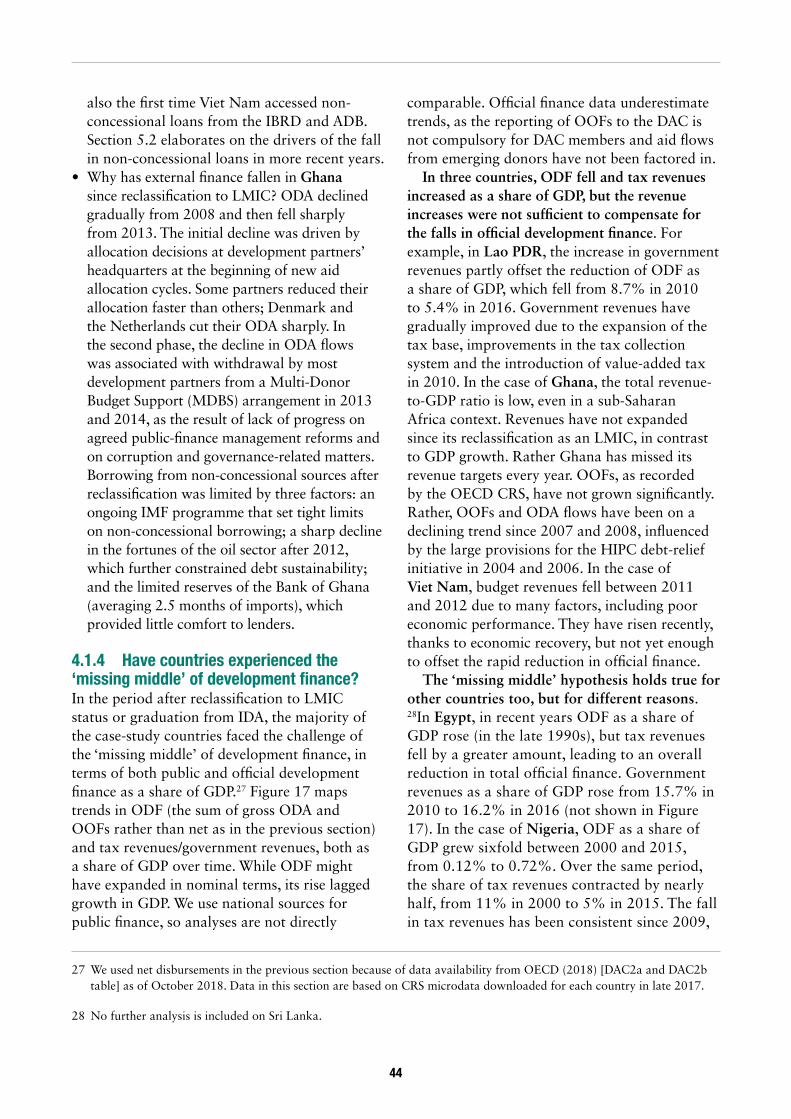
44
also the first time Viet Nam accessed non-concessional loans from the IBRD and ADB. Section 5.2 elaborates on the drivers of the fall in non-concessional loans in more recent years.
• Why has external finance fallen in Ghana since reclassification to LMIC? ODA declined gradually from 2008 and then fell sharply from 2013. The initial decline was driven by allocation decisions at development partners’ headquarters at the beginning of new aid allocation cycles. Some partners reduced their allocation faster than others; Denmark and the Netherlands cut their ODA sharply. In the second phase, the decline in ODA flows was associated with withdrawal by most development partners from a Multi-Donor Budget Support (MDBS) arrangement in 2013 and 2014, as the result of lack of progress on agreed public-finance management reforms and on corruption and governance-related matters. Borrowing from non-concessional sources after reclassification was limited by three factors: an ongoing IMF programme that set tight limits on non-concessional borrowing; a sharp decline in the fortunes of the oil sector after 2012, which further constrained debt sustainability; and the limited reserves of the Bank of Ghana (averaging 2.5 months of imports), which provided little comfort to lenders.
4.1.4 Have countries experienced the ‘missing middle’ of development finance? In the period after reclassification to LMIC status or graduation from IDA, the majority of the case-study countries faced the challenge of the ‘missing middle’ of development finance, in terms of both public and official development finance as a share of GDP.27 Figure 17 maps trends in ODF (the sum of gross ODA and OOFs rather than net as in the previous section) and tax revenues/government revenues, both as a share of GDP over time. While ODF might have expanded in nominal terms, its rise lagged growth in GDP. We use national sources for public finance, so analyses are not directly
27 We used net disbursements in the previous section because of data availability from OECD (2018) [DAC2a and DAC2b table] as of October 2018. Data in this section are based on CRS microdata downloaded for each country in late 2017.
28 No further analysis is included on Sri Lanka.
comparable. Official finance data underestimate trends, as the reporting of OOFs to the DAC is not compulsory for DAC members and aid flows from emerging donors have not been factored in.
In three countries, ODF fell and tax revenues increased as a share of GDP, but the revenue increases were not sufficient to compensate for the falls in official development finance. For example, in Lao PDR, the increase in government revenues partly offset the reduction of ODF as a share of GDP, which fell from 8.7% in 2010 to 5.4% in 2016. Government revenues have gradually improved due to the expansion of the tax base, improvements in the tax collection system and the introduction of value-added tax in 2010. In the case of Ghana, the total revenue-to-GDP ratio is low, even in a sub-Saharan Africa context. Revenues have not expanded since its reclassification as an LMIC, in contrast to GDP growth. Rather Ghana has missed its revenue targets every year. OOFs, as recorded by the OECD CRS, have not grown significantly. Rather, OOFs and ODA flows have been on a declining trend since 2007 and 2008, influenced by the large provisions for the HIPC debt-relief initiative in 2004 and 2006. In the case of Viet Nam, budget revenues fell between 2011 and 2012 due to many factors, including poor economic performance. They have risen recently, thanks to economic recovery, but not yet enough to offset the rapid reduction in official finance.
The ‘missing middle’ hypothesis holds true for other countries too, but for different reasons. 28In Egypt, in recent years ODF as a share of GDP rose (in the late 1990s), but tax revenues fell by a greater amount, leading to an overall reduction in total official finance. Government revenues as a share of GDP rose from 15.7% in 2010 to 16.2% in 2016 (not shown in Figure 17). In the case of Nigeria, ODF as a share of GDP grew sixfold between 2000 and 2015, from 0.12% to 0.72%. Over the same period, the share of tax revenues contracted by nearly half, from 11% in 2000 to 5% in 2015. The fall in tax revenues has been consistent since 2009,
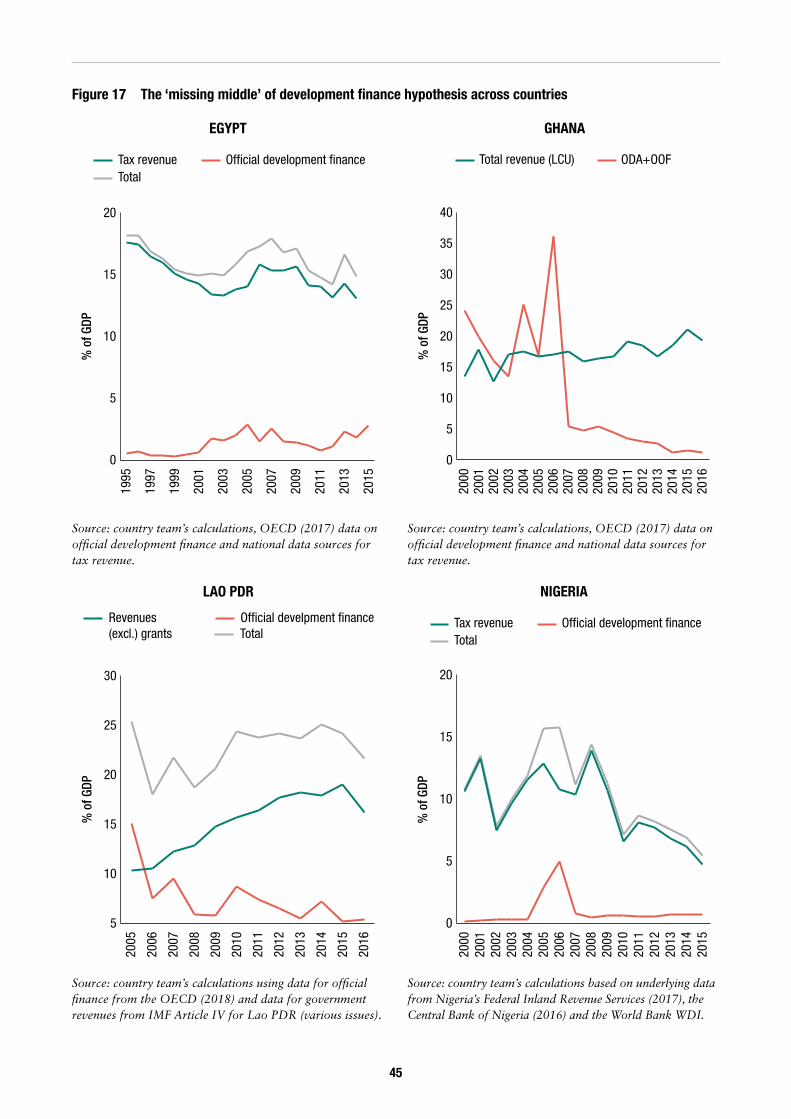
45
Figure 17 The ‘missing middle’ of development finance hypothesis across countries
EGYPT
0
5
10
% o
f GDP
15
20
TotalOf�cial development �nanceTax revenue
2015
2013
2011
2009
2007
2005
2003
2001
1999
1997
1995
LAO PDR
% o
f GDP
5
10
15
20
25
30
TotalOf�cial develpment �nanceRevenues
(excl.) grants
2016
2015
2014
2013
2012
2011
2010
2009
2008
2007
2006
2005
GHANA
% o
f GDP
0
5
10
15
20
25
30
35
40
ODA+OOFTotal revenue (LCU)
2016
2015
2014
2013
2012
2011
2010
2009
2008
2007
2006
2005
2004
2003
2002
2001
2000
NIGERIA
% o
f GDP
TotalOf�cial development �nanceTax revenue
0
5
10
15
20
2015
2014
2013
2012
2011
2010
2009
2008
2007
2006
2005
2004
2003
2002
2001
2000
Source: country team’s calculations, OECD (2017) data on official development finance and national data sources for tax revenue.
Source: country team’s calculations using data for official finance from the OECD (2018) and data for government revenues from IMF Article IV for Lao PDR (various issues).
Source: country team’s calculations, OECD (2017) data on official development finance and national data sources for tax revenue.
Source: country team’s calculations based on underlying data from Nigeria’s Federal Inland Revenue Services (2017), the Central Bank of Nigeria (2016) and the World Bank WDI.
46
Figure 17 The ‘missing middle’ of development finance hypothesis across countries cont’d
PAKISTAN
% o
f GDP
0
3
6
9
12
15
Total
Of�cial development �nanceTax
2015
2014
2013
2012
2011
2010
2009
2008
2007
2006
2005
2004
2003
2002
SRI LANKA
% o
f GDP
0
5
10
15
20
25
30
35
40
TotalOf�cial development �nanceRevenue
2014
2012
2010
2008
2006
2004
2002
2000
1998
1996
1994
1992
1990
PAPUA NEW GUINEA
% o
f GDP
0.00
0.05
0.10
0.15
0.20
0.25
0.30
0.35
Total
Of�cial development �nanceTax
2015
2014
2013
2012
2011
2010
2009
2008
2007
2006
2005
2004
2003
2002
VIET NAM
% o
f GDP
0
5
10
15
20
25
30
35
Total
Of�cial development �nanceBudget revenue
2016
2015
2014
2013
2012
2011
2010
2009
2008
2007
2006
2005
2004
2003
2002
Source: country team’s calculations, OECD and national sources.
Source: country team’s calculations, OECD database and ODI et al. (2015).
Source: country team’s calculation, OECD and Papua New Guinea budget update.
Source: country team’s calculations, OECD official devleopment finance data, ADB budget revenue data.
47
following the global financial crisis; since then, official flows have played an ever-increasing role in closing a widening public investment gap, albeit a relatively small one. This procyclical nature of government spending has led many development partners (including the DFID, World Bank and Bill and Melinda Gates Foundation) to implement new programmes aimed at improving fiscal sustainability in the country as a precursor to sustainable social development. In Papua New Guinea, after its reclassification in 2007, tax revenue generally fell in tandem with a (minimal) decline in external assistance as a proportion of the overall economy. Factors included falling commodity prices and the persistent appreciation of the kina against the US dollar (resulting in declining mining and petroleum tax revenues in local-currency terms).
The only exception to the ‘missing middle’ of development finance hypothesis is Pakistan. Tax revenues have been expanding as a share of GDP, but external official finance has been expanding too (even though grant financing started to decline in 2015).
4.2 Terms and conditions and sectoral allocation
4.2.1 How have the terms and conditions of official development finance evolved? 29
In nearly all of our case-study countries, average maturity on new external debt commitments has been on a downward trend (the exception being Papua New Guinea, with increasing average maturities in the late 2010s, which then fell again). This trend was expected because of the transition towards less-concessional sources of financing.
We have a mixed picture when it comes to trends on interest rates: there are no real differences between countries on the basis of IBRD eligibility or macroeconomic performance. Interest rates have been rising, per our hypothesis, in Ghana, Lao PDR, Papua New Guinea and Sri Lanka, but have been falling in
29 Graphs on average interest rates and maturities not shown in this report.
30 For cross-country comparability, we considered the transition to LMIC status for all countries.
all the other countries. An example is the case of Egypt, where average interest rates on new commitments have been falling. In the case of Lao PDR, interest rates on new official debt commitments decreased from 2.5% in 2010 to 1.4% in 2015, but then rose to 2.9% in 2016. Again, this is at odds with what we would expect to see, which is an upward trend in average interest rates over 2010–2016.
4.2.2 How has the sectoral composition of external and domestic sources of government budgetary financing evolved? In this section we analysed whether there has been any shift in funding from the social sectors to economic infrastructure. Economic infrastructure projects (e.g. toll roads and utilities) tend to attract funding that is less concessional thanks to their potential returns and/or ability to generate cash flows. Conversely, the social sectors (e.g. education and health) tend to be supported either by public taxation or by grants or concessional finance, rather than loans from donor governments. With MICs expected to rely more on loans than on grants, their share of official development finance to the infrastructure sectors is likely to increase. The case studies looked at both external public finance.
External finance Most countries, except for Lao PDR, saw an increase in the share of ODA allocated to infrastructure sectors. As highlighted in Section 3, several national strategies focus on and prioritise hard infrastructure, such as transport and energy. Prioritisation of those sectors is down to government preference, rather than shifts in the composition of external finance. We found this was particularly the case for Egypt and Pakistan (see Figure 18 and Table 4 for a comparison between the three years before transition to LMIC status and the most recent three years for which ODF data were available at the time writing).30
48
Shift in external assistance towards infrastructureEgypt: According to interviews conducted, sectoral intervention is largely determined by the interests of Egyptian officials and the priorities of donors. When it comes to loans, the Egyptian government prefers to borrow for infrastructure sectors where it does not necessarily have local expertise (e.g. energy). These trends are reflected in the different sectors that development partners have been supporting. For the AfDB, water supply and sanitation were a primary focus between 2002 and 2009. Between 2012 and 2015, its key sectors were banking and financial services, energy generation/non-renewable resources and agriculture. US funding was active in a wide range of sectors over the 20 years, including energy, health, education, government, infrastructure, water, sanitation, banking and business. However, primary or key sectors have shifted slightly over time. From 2005, government/civil society overwhelmingly exceeded any other sector, followed by health, education, trade policy and ‘business and other services’.
Ghana: ODA flows, especially from multilateral sources, are increasingly directed to economic infrastructure, mainly energy, finance and banking. Agriculture and the social sectors are a low priority for multilaterals. Bilateral donors, on the other hand, have maintained their share of ODA allocation to the social sector, albeit in lower volumes. However, allocations previously provided through MDBS appear to have shifted towards the production sector (mainly agriculture), governance-related activities and public financial management (especially domestic revenue mobilisation). This has affected disbursement channels: more and more bilateral ODA is channelled through civil-society, non-governmental organisations and the private sector, and the share that goes to the public sector tends to be channelled directly to sectors and decentralised structures. In response, development partners have reduced their interventions to support basic services (health and education), but have increased their focus on capacity-building activities in such areas as better management of public finance (e.g. through support for the Ghana Integrated Finance Management System), anti-corruption strategies and domestic resource mobilisation.
Some development partners have also shifted their lending methods more towards catalysing OOFs through export-import institutions and other development-finance vehicles, such as CDC Group (UK), Agence Française de Développement (France) and KfW (Germany), or by increasing the use of technical assistance.
Nigeria: The social sector remains the largest recipient, but its relative allocation has declined over time. The fastest-growing sector was the productive sector, recording a compound annual growth rate of 54% between 1998 and 2015, followed by the infrastructure sector (42.5%) and the social sector (30%). The fall in the relative share of assistance to the social sectors masks different trends. First, health financing grew from less than $25 million in 2000 to $272 million in 2010 and around $950 million in 2015 – recording the fastest growth in the social sector. Assistance to education has remained flat over the past few years.
Pakistan: The energy sector, especially the energy-policy subsector, has seen a large increase in donor financing. Energy has been a major priority for the elected governments of Pakistan, as electricity shortfalls have affected the nation quite severely since 2007. Similarly, governance as a sector has seen increases in aid disbursements while, over the same period, support for social sectors has declined. The health sector accounted for around 6% of aid disbursements in 2000 and only 1% of aid disbursements in 2015. The education sector’s share of total aid disbursements has fallen, although not to the same degree. In interviews, some donors and government officials claimed ‘donor fatigue’ to explain the drop in external financing for the education and health sectors. From the interviews, we also understand that funding to the social sectors beyond a certain level did not translate into more effective service delivery. The fall in external financing to the education and health sectors, especially ODA loan financing, can also be attributed to the passage of the 18th Constitutional Amendment, which removed education and health from federal government responsibility and transferred it exclusively to provincial governments. As the federal government negotiates all external financing, some officials and donors stated that
49
such reform reduced the federal government’s commitment to external financing in the education and health sectors. The federal government would rather receive external financing, especially ODA and OOF loans, for sectors that are under its purview (e.g. energy).
Papua New Guinea: While the volume of aid allocated for the social sector declined in 2013 and 2014 (before starting to trend upwards again), the infrastructure and multi-sector allocations continued their upward trend – the only difference being that infrastructure allocations appear to have increased faster than multi-sector aid. The share of ODF to the education sector fell dramatically. In interviews, both development partners and the government were concerned about the falling contributions to the health sector. Interviewees also noted that, rather than focusing on funding cuts, some donors were changing their areas of focus.
Sri Lanka: Programmes and projects supporting infrastructure development received the largest increases in relative terms. While this was partly driven by a decline in the unallocated portion of external assistance, the share allocated to programmes and projects in the social sectors has been falling since 2006.
Viet Nam: The largest share of ODA used to be channelled towards social infrastructure and services, water supply, health and education. After 2008, the share of ODA allocated to social services fell (mainly to education) and the shares to multi-sector and cross-cutting areas saw minor increases.
Shift in external assistance towards social sectors Lao PDR: The focus of ODF has shifted from education and infrastructure to the health sector. Even though absolute volumes of ODA might have risen, the share of ODA flows to the infrastructure sector fell from 34.4% in 2010 to 9.9% in 2016. In contrast, the share of ODA flows to the health sector increased from 7.0% to 19.0% and the share of ODA flows to the education sector rose from 15.8% to 20.7% over the same period. One of the largest bilateral donors (the Republic of Korea) has shifted
31 Time series for the sectoral allocation of public finance is missing in the case of Papua New Guinea.
its allocation of ODA from infrastructure to the health sector (since 2012), while another two of the largest bilateral donors (Japan and Australia) have continued to prioritise education. The reduction in DAC ODA flows to the infrastructure sector is more likely to be offset by Chinese OOFs (not captured in the figures here).
Public finance31
The scope of this section is to map whether and how the sectoral allocation of public finance evolved. Sufficient data were available to enable analysis of trends in external assistance across sectors; however, for some countries, the accrual data required for the functional classification of public finance had not been published for a sufficiently long period. Most countries, with the exception of Lao PDR and Viet Nam, were found to have redirected most of their assistance towards infrastructure development (see Figure 19).
Falling share to the social sectors Egypt: In 1995, before reclassification, health expenditure did not exceed 3.6% of GDP. By 2002, it had almost doubled, to 6%, but then fell back to 5% in 2005. Between 2005 and 2010, health expenditure as a share of GDP fluctuated, reaching 5.6% in 2014. Before reclassification, education spending had been growing very slowly (almost negligibly), from 4.6% of GDP in 1995 to 4.9% in 2003. From 2003, education spending declined, especially after 2005: spending fell from 4.8% in 2005 to 3.7% in 2007, and then to 3.5% in 2011. Since 2005, education spending has not reached 4% of GDP, except in 2012. It fell to 3% in 2016. Education has not been one of the government’s priority spending areas.
Ghana: While the share of total government expenditure on health, education and social protection has been stable, the size of the social-sector budget relative to needs has declined. According to a government respondent, the HIPC completion-point conditions, especially on social spending, had a spiralling effect on the government budget due to the uptake of major
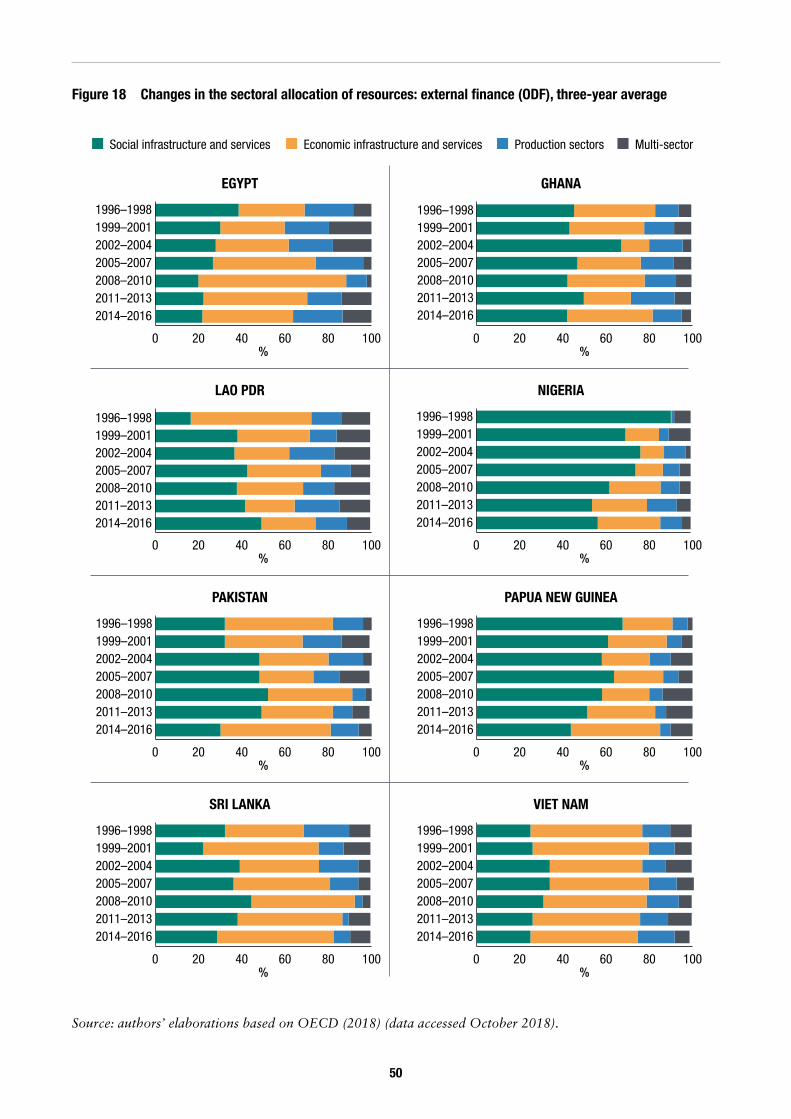
50
Figure 18 Changes in the sectoral allocation of resources: external finance (ODF), three-year average
Source: authors’ elaborations based on OECD (2018) (data accessed October 2018).
EGYPT
0 20 40%
60 80 100
Multi-sectorProduction sectorsEconomic infrastructure and servicesSocial infrastructure and services
2014–20162011–20132008–20102005–20072002–20041999–20011996–1998
LAO PDR
0 20 40%
60 80 100
PAKISTAN
0 20 40%
60 80 100
SRI LANKA
0 20 40%
60 80 100
NIGERIA
0 20 40%
60 80
PAPUA NEW GUINEA
0 20 40%
60 80
VIET NAM
0 20 40%
60 80
GHANA
0 20 40%
60 80 100
100
100
100
2014–20162011–20132008–20102005–20072002–20041999–20011996–1998
2014–20162011–20132008–20102005–20072002–20041999–20011996–1998
2014–20162011–20132008–20102005–20072002–20041999–20011996–1998
2014–20162011–20132008–20102005–20072002–20041999–20011996–1998
2014–20162011–20132008–20102005–20072002–20041999–20011996–1998
2014–20162011–20132008–20102005–20072002–20041999–20011996–1998
2014–20162011–20132008–20102005–20072002–20041999–20011996–1998
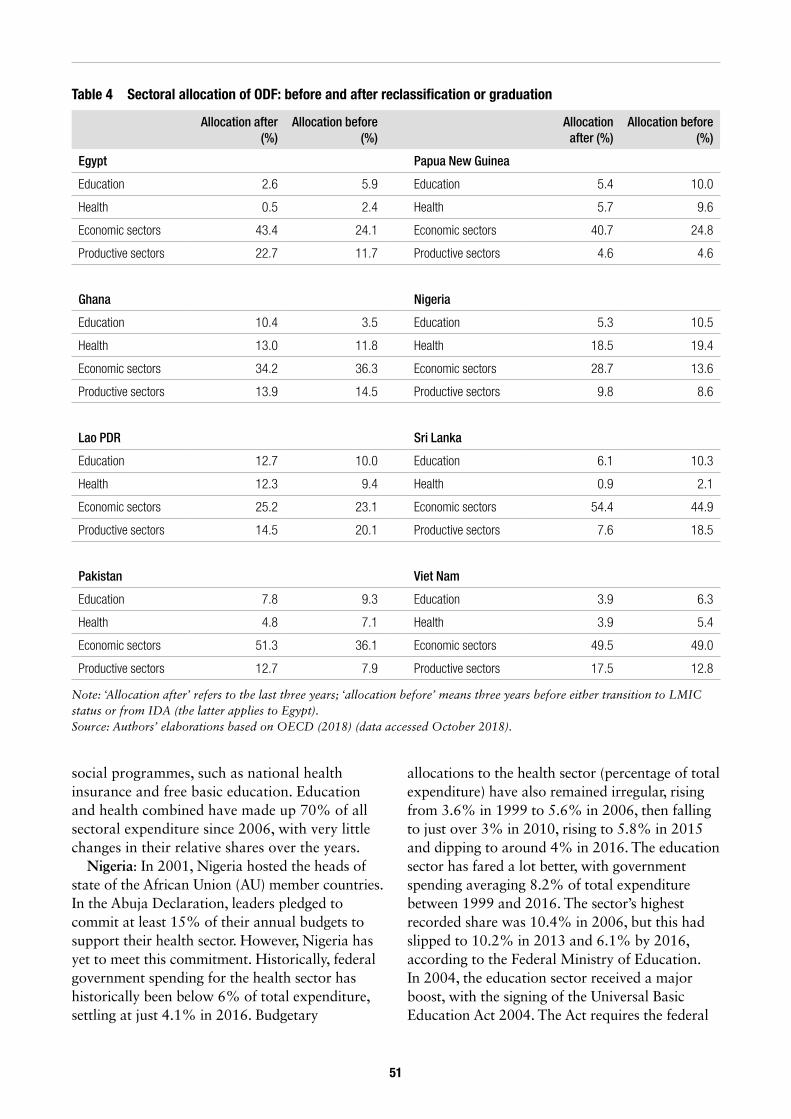
51
social programmes, such as national health insurance and free basic education. Education and health combined have made up 70% of all sectoral expenditure since 2006, with very little changes in their relative shares over the years.
Nigeria: In 2001, Nigeria hosted the heads of state of the African Union (AU) member countries. In the Abuja Declaration, leaders pledged to commit at least 15% of their annual budgets to support their health sector. However, Nigeria has yet to meet this commitment. Historically, federal government spending for the health sector has historically been below 6% of total expenditure, settling at just 4.1% in 2016. Budgetary
allocations to the health sector (percentage of total expenditure) have also remained irregular, rising from 3.6% in 1999 to 5.6% in 2006, then falling to just over 3% in 2010, rising to 5.8% in 2015 and dipping to around 4% in 2016. The education sector has fared a lot better, with government spending averaging 8.2% of total expenditure between 1999 and 2016. The sector’s highest recorded share was 10.4% in 2006, but this had slipped to 10.2% in 2013 and 6.1% by 2016, according to the Federal Ministry of Education. In 2004, the education sector received a major boost, with the signing of the Universal Basic Education Act 2004. The Act requires the federal
Allocation after (%)
Allocation before (%)
Allocation after (%)
Allocation before (%)
Egypt Papua New Guinea
Education 2.6 5.9 Education 5.4 10.0
Health 0.5 2.4 Health 5.7 9.6
Economic sectors 43.4 24.1 Economic sectors 40.7 24.8
Productive sectors 22.7 11.7 Productive sectors 4.6 4.6
Ghana Nigeria
Education 10.4 3.5 Education 5.3 10.5
Health 13.0 11.8 Health 18.5 19.4
Economic sectors 34.2 36.3 Economic sectors 28.7 13.6
Productive sectors 13.9 14.5 Productive sectors 9.8 8.6
Lao PDR Sri Lanka
Education 12.7 10.0 Education 6.1 10.3
Health 12.3 9.4 Health 0.9 2.1
Economic sectors 25.2 23.1 Economic sectors 54.4 44.9
Productive sectors 14.5 20.1 Productive sectors 7.6 18.5
Pakistan Viet Nam
Education 7.8 9.3 Education 3.9 6.3
Health 4.8 7.1 Health 3.9 5.4
Economic sectors 51.3 36.1 Economic sectors 49.5 49.0
Productive sectors 12.7 7.9 Productive sectors 17.5 12.8
Table 4 Sectoral allocation of ODF: before and after reclassification or graduation
Note: ‘Allocation after’ refers to the last three years; ‘allocation before’ means three years before either transition to LMIC status or from IDA (the latter applies to Egypt). Source: Authors’ elaborations based on OECD (2018) (data accessed October 2018).
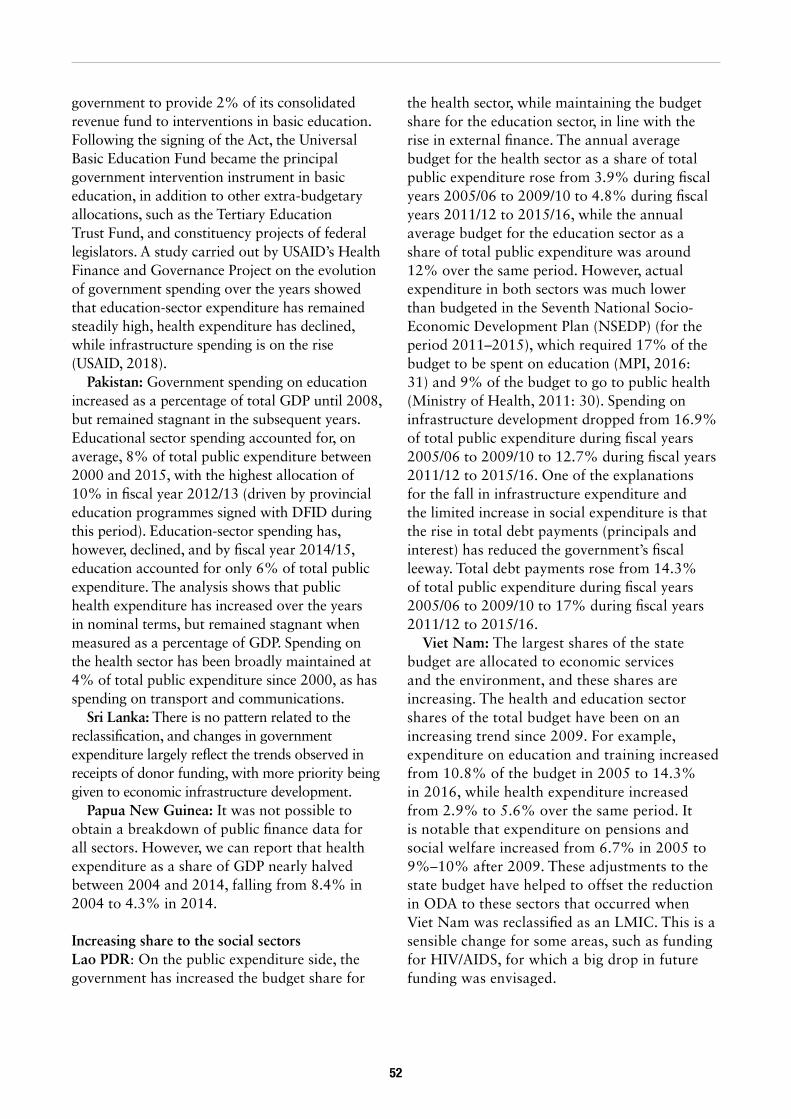
52
government to provide 2% of its consolidated revenue fund to interventions in basic education. Following the signing of the Act, the Universal Basic Education Fund became the principal government intervention instrument in basic education, in addition to other extra-budgetary allocations, such as the Tertiary Education Trust Fund, and constituency projects of federal legislators. A study carried out by USAID’s Health Finance and Governance Project on the evolution of government spending over the years showed that education-sector expenditure has remained steadily high, health expenditure has declined, while infrastructure spending is on the rise (USAID, 2018).
Pakistan: Government spending on education increased as a percentage of total GDP until 2008, but remained stagnant in the subsequent years. Educational sector spending accounted for, on average, 8% of total public expenditure between 2000 and 2015, with the highest allocation of 10% in fiscal year 2012/13 (driven by provincial education programmes signed with DFID during this period). Education-sector spending has, however, declined, and by fiscal year 2014/15, education accounted for only 6% of total public expenditure. The analysis shows that public health expenditure has increased over the years in nominal terms, but remained stagnant when measured as a percentage of GDP. Spending on the health sector has been broadly maintained at 4% of total public expenditure since 2000, as has spending on transport and communications.
Sri Lanka: There is no pattern related to the reclassification, and changes in government expenditure largely reflect the trends observed in receipts of donor funding, with more priority being given to economic infrastructure development.
Papua New Guinea: It was not possible to obtain a breakdown of public finance data for all sectors. However, we can report that health expenditure as a share of GDP nearly halved between 2004 and 2014, falling from 8.4% in 2004 to 4.3% in 2014.
Increasing share to the social sectors Lao PDR: On the public expenditure side, the government has increased the budget share for
the health sector, while maintaining the budget share for the education sector, in line with the rise in external finance. The annual average budget for the health sector as a share of total public expenditure rose from 3.9% during fiscal years 2005/06 to 2009/10 to 4.8% during fiscal years 2011/12 to 2015/16, while the annual average budget for the education sector as a share of total public expenditure was around 12% over the same period. However, actual expenditure in both sectors was much lower than budgeted in the Seventh National Socio-Economic Development Plan (NSEDP) (for the period 2011–2015), which required 17% of the budget to be spent on education (MPI, 2016: 31) and 9% of the budget to go to public health (Ministry of Health, 2011: 30). Spending on infrastructure development dropped from 16.9% of total public expenditure during fiscal years 2005/06 to 2009/10 to 12.7% during fiscal years 2011/12 to 2015/16. One of the explanations for the fall in infrastructure expenditure and the limited increase in social expenditure is that the rise in total debt payments (principals and interest) has reduced the government’s fiscal leeway. Total debt payments rose from 14.3% of total public expenditure during fiscal years 2005/06 to 2009/10 to 17% during fiscal years 2011/12 to 2015/16.
Viet Nam: The largest shares of the state budget are allocated to economic services and the environment, and these shares are increasing. The health and education sector shares of the total budget have been on an increasing trend since 2009. For example, expenditure on education and training increased from 10.8% of the budget in 2005 to 14.3% in 2016, while health expenditure increased from 2.9% to 5.6% over the same period. It is notable that expenditure on pensions and social welfare increased from 6.7% in 2005 to 9%–10% after 2009. These adjustments to the state budget have helped to offset the reduction in ODA to these sectors that occurred when Viet Nam was reclassified as an LMIC. This is a sensible change for some areas, such as funding for HIV/AIDS, for which a big drop in future funding was envisaged.
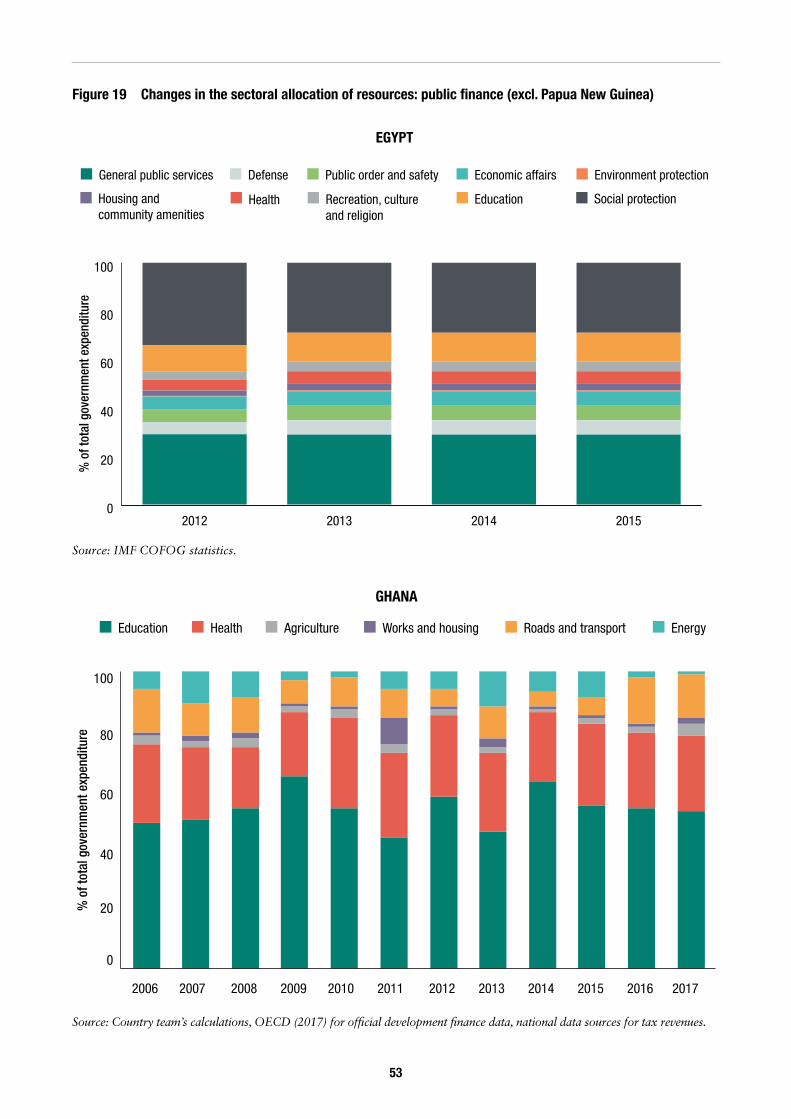
53
Figure 19 Changes in the sectoral allocation of resources: public finance (excl. Papua New Guinea)
Source: IMF COFOG statistics.
100
% o
f tot
al g
over
nmen
t exp
endi
ture
EGYPT
0
20
40
60
80
Social protectionEducationRecreation, cultureand religion
HealthHousing and community amenities
Environment protectionEconomic affairsPublic order and safetyDefenseGeneral public services
2015201420132012
Source: Country team’s calculations, OECD (2017) for official development finance data, national data sources for tax revenues.
100
80
60
40
20
0
% o
f tot
al g
over
nmen
t exp
endi
ture
GHANA
2006 2007 2008 2009 2010 2011 2012 2013 2014 2015 2016 2017
Education Health Agriculture Works and housing Roads and transport Energy
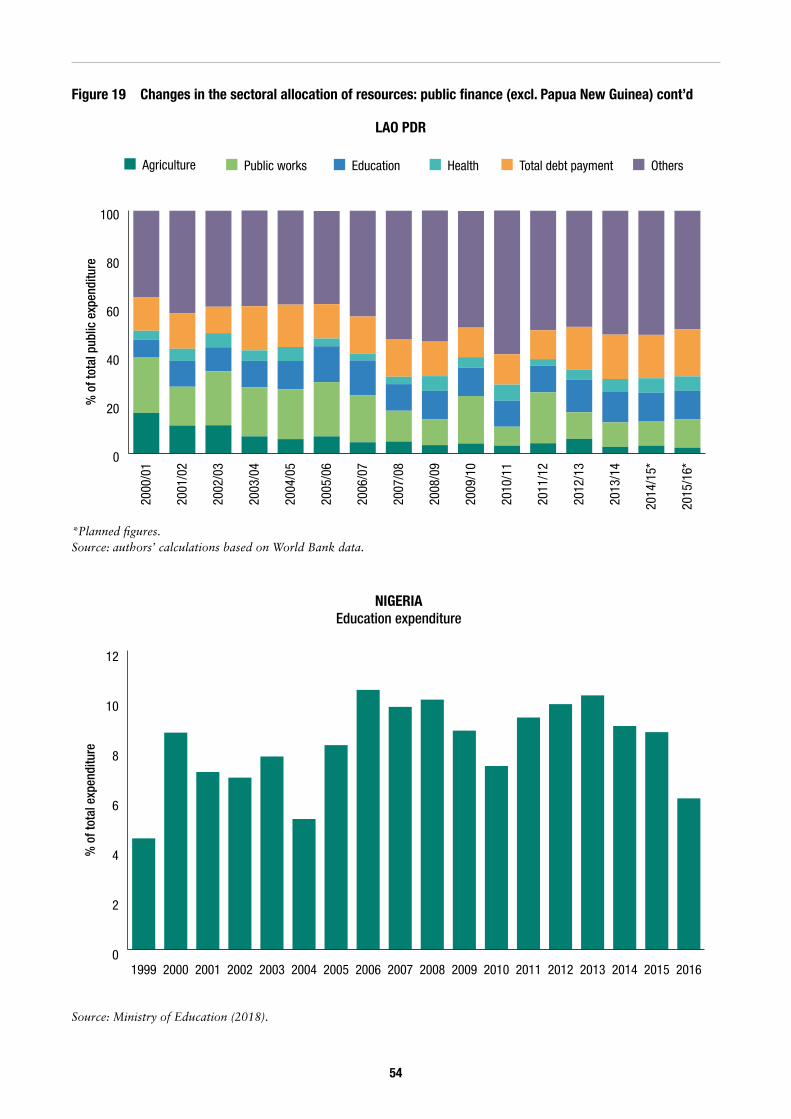
54
Figure 19 Changes in the sectoral allocation of resources: public finance (excl. Papua New Guinea) cont’d
*Planned figures.Source: authors’ calculations based on World Bank data.
% o
f tot
al p
ublic
exp
endi
ture
LAO PDR
0
20
40
60
80
100
OthersTotal debt paymentHealthEducationPublic worksAgriculture
201
5/16
*
201
4/15
*
201
3/14
201
2/13
201
1/12
201
0/11
2009
/10
2008
/09
2007
/08
2006
/07
2005
/06
2004
/05
2003
/04
2002
/03
2001
/02
2000
/01
Source: Ministry of Education (2018).
NIGERIAEducation expenditure
0
2
4
6
% o
f tot
al e
xpen
ditu
re 8
10
12
201620152014201320122011201020092008200720062005200420032002200120001999
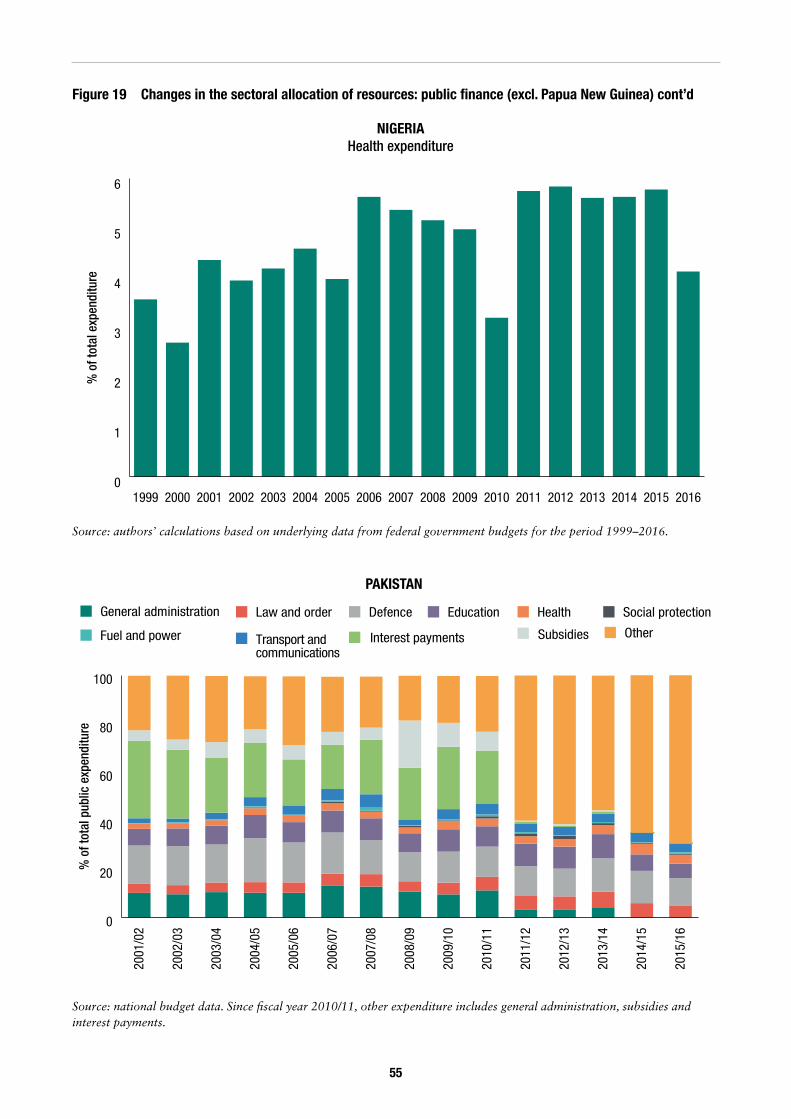
55
Figure 19 Changes in the sectoral allocation of resources: public finance (excl. Papua New Guinea) cont’d
NIGERIAHealth expenditure
% o
f tot
al e
xpen
ditu
re
0
1
2
3
4
5
6
201620152014201320122011201020092008200720062005200420032002200120001999
Source: authors’ calculations based on underlying data from federal government budgets for the period 1999–2016.
Source: national budget data. Since fiscal year 2010/11, other expenditure includes general administration, subsidies and interest payments.
General administration Law and order Defence Education Health Social protection
Fuel and power Transport and communications
Interest payments Subsidies Other
% o
f tot
al p
ublic
exp
endi
ture
PAKISTAN
0
20
40
60
80
100 2
015/
16
201
4/15
201
3/14
201
2/13
201
1/12
201
0/11
2009
/10
2008
/09
2007
/08
2006
/07
2005
/06
2004
/05
2003
/04
2002
/03
2001
/02
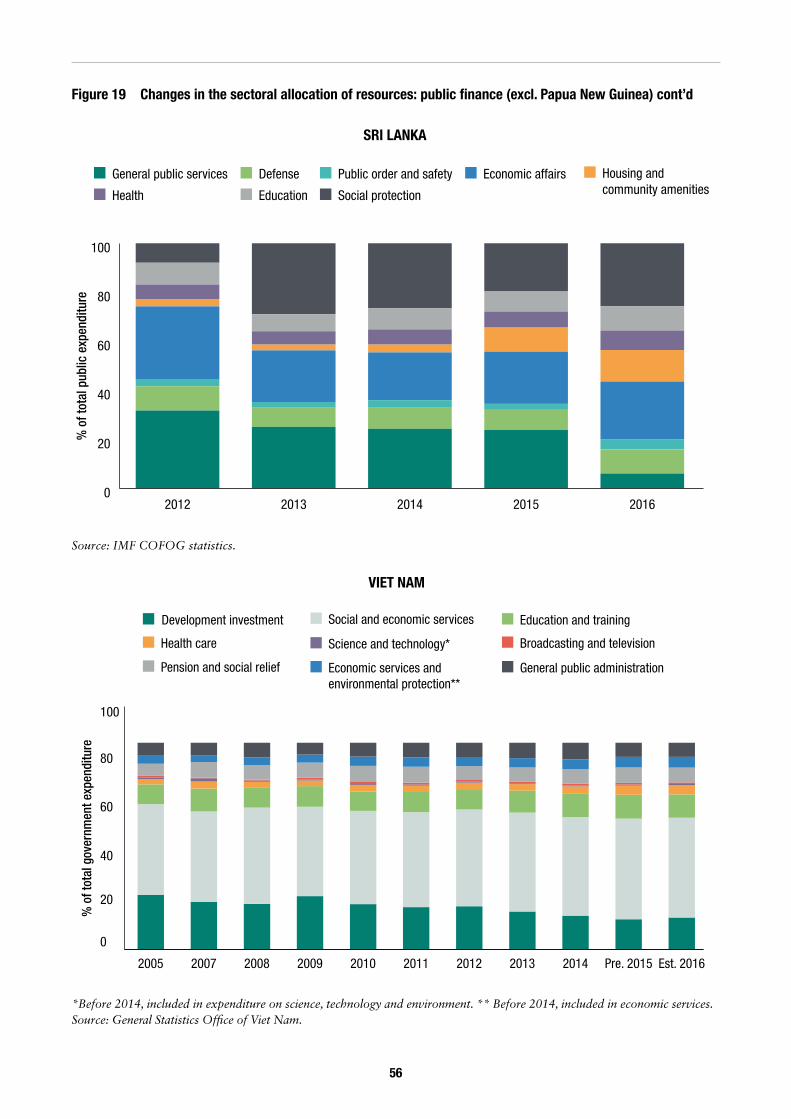
56
Figure 19 Changes in the sectoral allocation of resources: public finance (excl. Papua New Guinea) cont’d
Source: IMF COFOG statistics.
% o
f tot
al p
ublic
exp
endi
ture
SRI LANKA
0
20
40
60
80
100
Social protectionEducationHealth
Housing andcommunity amenities
Economic affairsPublic order and safetyDefenseGeneral public services
20162015201420132012
*Before 2014, included in expenditure on science, technology and environment. ** Before 2014, included in economic services. Source: General Statistics Office of Viet Nam.
100
80
60
40
20
0
% o
f tot
al g
over
nmen
t exp
endi
ture
VIET NAM
Development investment Social and economic services Education and training
Health care Science and technology* Broadcasting and television
Pension and social relief Economic services and environmental protection**
2005 2007 2009 20102008 2011 2012 2013 2014 Pre. 2015 Est. 2016
General public administration
57
5 Government strategies
32 No information for Ghana and Papua New Guinea is presented in this section.
33 For example, Denmark shifted from aid to new partnerships strongly focused on business opportunities between the two countries, such as the Danish-Vietnamese Fishery partnership (DANIDA, 2017). In the case of Switzerland, the bilateral cooperation between SDC and Viet Nam on poverty reduction and governance ended in 2016, but Viet Nam remained a partner in global and regional SDC programmes, which address challenges such as water resource management and food security. Bilateral cooperation with SECO has continued. SECO specified three objectives for its designed activities for 2017–2020: effective economic policies and institutions; a competitive and resource-efficient private sector; and sustainable and climate-resilient urban development (SECO, 2017).
In the previous section we identified the changes in the development-finance landscape that occurred after the case-study countries transitioned to MIC status or graduated from the soft windows of the MDBs. In this section, we review whether and how government priorities for development changed after transition or graduation, whether governments had a strategy in place (and the main elements of any plans) and whether and how aid coordination mechanisms evolved during transition to MIC status away from aid.
5.1 Government priorities for development finance32
Except for Viet Nam, across the country case studies, we did not identify any changes in the government’s priorities for external assistance or in its terms and conditions because of moving away from LIC status and concessional finance. This was contrary to the evidence gathered for Indonesia by Prizzon and Rogerson (2017).
In the case of Viet Nam, the focus of development finance shifted from poverty reduction to trade, and from financial transfers to a post-aid development partnership, primarily economic cooperation (EU et al., 2014). Donor programmes also tended to move from government–government financial transfers to the promotion of knowledge partnerships between public institutions, academic institutions and companies in Viet Nam and the donor country.33
According to interviews, Egypt has historically been resistant to borrowing for its social sectors, as mentioned earlier in the report. This was the case both before and after reclassification to LMIC status and graduation from IDA. However, this has started to change, after reductions in support from countries such as the US, which was Egypt’s largest cushion for the social sectors. Recently signed agreements to enhance social safety nets and upgrade education are the first of their kind and, according to interviews with donors, are likely to have been driven by the fall in concessional support from historically dominant actors and reduced support for the social sectors in general. Some of the donors interviewed noted that the strategy for managing and negotiating borrowing agreements was based on multiple factors, including: (i) the availability of local capacity (for example, Egypt does not borrow for road infrastructure projects) (ii) the urgency (for example, agreements could be negotiated with multiple players at the same time, with the government settling on the partner with the most flexible procurement policies or lending terms) and (iii) the availability of other options (for example, support from countries such as the US and Gulf countries, which has historically been the case).
In the case of Lao PDR, aid for capacity-building is a priority in the Vientiane Partnership Declaration on development effectiveness (but this priority is not driven or motivated
58
by the transition from LIC status).34 The key capacity-building objectives in the 8th NSEDP are to reform the vocational education system and promote linkages between production and employment generation by the private sector (MPI, 2016: 119). External grants and loans remain an important source of financing for the national development plan. The Vientiane Partnership Declaration states that ‘the Government [of Lao PDR] will continue to integrate ODA and other major sources of development financing into mainstream planning and budgeting frameworks alongside that of domestic public investment in core development programs’ (Government of Lao PDR, 2015: 3).
In Nigeria, according to interviews with government officials, the nature of development financing has changed, with many MDBs transitioning to concessional loans of ‘blend’ nature, while donor funding has evolved to become a ‘gap-filling’ instrument. Although provision of basic services has remained key, the transition to LMIC status has emphasised the need to demonstrate the impact of donor funding. According to interviews with development partners, donors are demanding better governance and accountability for aid, and their programmes now focus on improving service delivery through support for governance and institutional systems, rather than direct provision of services. In other words, programmes have evolved from directly providing services to helping government institutions improve their own delivery of services.
In the case of Pakistan, external assistance has two purposes: to finance the budget deficit and public expenditure, and to boost foreign-exchange reserves. While Pakistan is able to tap domestic and foreign markets for its financing needs, in the interviews the Ministry of Finance and Ministry of Planning, Development and Reform stressed that external financing decisions must be based on government policy and direction. However, the Economic Affairs
34 The Vientiane Partnership Declaration states that ‘the Government is committed to further strengthening capacity building objectives in the NSEDP, translate them into practical strategies and plans, and work with the Partners to develop and implement comprehensive long-term capacity building programs’. (Government of Lao PDR, 2015: 3).
35 Decision 251/QD-TTg, dated 17 February 2016, by the Prime Minister on ‘Direction on mobilizing, managing and using ODA and concessional loans of donors during 2016–2020’.
Division, which manages external financing for the government, acknowledged that the direction of external financing also had certain inputs from donors and that ‘donor fatigue’ played an important role in determining which sectors to support. As the government’s main priority for external financing has been to boost foreign-exchange reserves, some key informant interviews also indicated that the sector for which a grant is intended is not an important consideration. China is Pakistan’s preferred financier, because of the large scale of its foreign direct investment and its lack of strict conditionalities, in addition to trade and geopolitical factors (the strained state of international relations between Pakistan and the US is likely to impact future funding preferences). Another factor that emerged in interviews with development partners was that Pakistan’s preference for financing from China could contribute to the ‘crowding out’ of smaller donors.
5.2 Strategies in place
Viet Nam, Ghana, Lao PDR and Nigeria have, or are about to develop, an explicit strategy to maximise the use of finance after transition from concessional finance. Pakistan, Papua New Guinea and Sri Lanka rely on a debt management strategy. Egypt has a debt management strategy in place, but it is under the remit of the Ministry of Finance and not necessarily closely tied to the Ministry of International Cooperation.
Viet Nam’s ODA management guidelines for 2016–202035 show that the government has been highly aware of the transition away from aid since 2010. Several donors have reduced their grants or plan to terminate their official aid programmes for Viet Nam, while others have moved gradually from providing concessional to less-concessional loans. In this context, Viet Nam has tried to improve the impact of any loans it
59
receives, especially because of the pressure on public debt. However, the overall assessment is that management of ODA and concessional loans has not kept pace with changes in the policies of donors after Viet Nam became an MIC.
The directions for use of ODA in Viet Nam’s ODA management guidelines for 2016–2020 allocate finance on the basis of the terms and conditions of the instrument:
• ODA grants are to be used to implement programmes and projects that support policy formulation; institutional development; strengthening of human capabilities; improvements to the economy, culture, society and the environment, especially in rural regions; scientific research, technology and innovation.
• Concessional ODA loans are to be used for the implementation of programmes, especially infrastructure projects of high priority, that have widespread impact in the long term, but do not have the ability to directly recover capital.
• Less-concessional loans are to be used for programmes promoting the private sector, including projects in the form of public–private partnerships with the ability to generate cash flows.
The Vietnamese government has also aimed to strengthen public debt management. The Ministry of Finance now plays the main role in coordinating ODA. This is reflected in a new public debt management law issued in 2017. Responsibility for negotiation and implementation of external loans, including ODA, now lies with the Ministry of Finance (responsibility was previously shared by the Ministry of Planning and Investment and the State Bank of Vietnam).
The modest increase in non-concessional finance to Viet Nam has been driven not by the World Bank, the ADB or other international financial institutions, but mainly by Vietnamese government decisions on international borrowing. First, the government has certainly been concerned about the high cost of non-concessional loans. Vietnamese officials (from the Department of Debt Management and
External Finance of the Ministry of Finance) mentioned that the Vietnamese government had tried to negotiate loans at a reasonable cost and that Viet Nam had actually refused some loans due to unfavourable terms (eight cases in 2017, with a total value of $1.2 billion). The Vietnamese government compares the costs of different loans with those of domestic loans. Recently, the terms and conditions for domestic bonds have been much improved. The annual interest rate fell from 12% in 2012 to 6% in 2017 and loan maturity increased from 3 to 13.8 years. External loans as a share of total government debt fell from 61% in 2011 to 50% in 2017. Second, even if the government wanted to borrow more from external sources, it could not because of a limit placed on public debt. Public debt cannot exceed 65% of GDP (the ratio was 61.4% in 2017). More importantly, Viet Nam’s medium-term investment plan for 2016–2020 sets the amount of external loans for the whole period at 300,000 billion dong, equivalent to $13.3 billion. The government has already allocated all of this quota.
In Ghana, an inter-ministerial committee was set up by the President to develop a charter on ‘Ghana Beyond Aid’, which presented its recommendations to Parliament for approval in autumn 2018. Ghana had long anticipated its potential transition from LIC to LMIC status, especially since the announcement of the discovery of oil in commercial quantities in 2007. The rebasing exercise merely confirmed this. Consequently, in 2012, Ghana and her development partners signed the Government of Ghana/Development Partners Compact: Leveraging Partnership for Shared Growth and Development, 2012–2022. The Compact’s preamble states that it ‘should not be read as an ODA exit strategy, but should provide guidance for the strategic choices that will have to be made by the [Government of Ghana] and [development partners] alike in the period 2012–2022, as well as for the fostering of new alliances with emerging new players in development cooperation, with the ultimate goal of transforming Ghana into an established middle-income and aid independent country’.
Lao PDR’s development effectiveness and debt management strategies have recognised
60
the implications of changing status from LIC to LMIC. This has meant a stronger focus on delivering official finance to Lao PDR through budget support approved by the national assembly, to ensure that both domestic and external financing have been adequately mobilised to support the national socio-economic development plan. Interviewees from the Ministry of Planning and Investment indicated that the Government of Lao PDR is drafting two strategies – an ODA strategy and a public–private partnerships strategy – to deal with changes in development finance during the transition away from aid.
In view of the challenges in ODA coordination, the Nigerian government is developing an ODA policy framework and a system for capturing ODA data that will address current challenges associated with the deployment, management and tracking of aid in the country (Ministry of Budget and National Planning, 2015). The framework is being developed in partnership with donors to maximise the effectiveness and complementary value of aid entering the country, and it will aim to ensure ownership, accountability, effectiveness and the efficiency of ODA resource mobilisation and utilisation.
The other countries reviewed have debt management strategies in place. These mainly aim to reduce debt service and manage risks and exposure, rather than link financing with investment plans and budget allocation.
In the case of Pakistan, the main strategic priority has been to maintain fiscal stability. Foreign aid and inflows are primarily seen as a means for the country to keep or expand foreign reserves, rather than as a measure for addressing expenditure shortfalls. The government also leverages donor programmes (especially from the IMF) to push reforms that may have political costs and to build international relationships. The Medium-Term Debt Strategy (MTDS) 2015/16–2019/20 sets out the national approach to external debt. It states that while the country will aim to keep foreign debt to between 25% and 35% of the total debt stock, it will favour concessional loans over more expensive domestic
36 Papua New Guinea’s public debt strategy aims to keep the debt-to-GDP ratio below 30% (Papua New Guinea Department of Treasury, 2017).
loans. It also states that it will aim to maintain the current level of external inflows from multilateral and bilateral partners in an attempt to attract concessional loans and grants. Prior to the MTDS, in 2005 the government passed the Fiscal Responsibility and Debt Limitation Act, which aimed to reduce the size of Pakistan’s overall debt, including external debt.
Interviews with stakeholders in Papua New Guinea suggested there was no evidence of any strategy for managing the transition from concessional to less-concessional financing. One of the reasons for this is that MDBs (and concessional loans) are not the largest source of ODA to Papua New Guinea. The fact that the largest and most dominant donor, Australia, was not planning to cut back its grant-based support to Papua New Guinea gave reasonable assurance that the impact of any decrease in ODA following the country’s graduation to LMIC was going to be minimal, if anything. Interviewees reiterated the importance of all donors, big or small, to Papua New Guinea, noting that the country’s prospects of becoming self-sufficient were not strong enough.36
In the case of Sri Lanka, the Department of External Resources, which is responsible for aid management, has an explicit borrowing strategy (Department of External Resources, n.d.). The strategy of the Department of External Resources and the Central Bank of Sri Lanka is to meet the government’s borrowing needs at the lowest possible cost and risk. The strategy recognises that concessional financing is falling as a result of Sri Lanka becoming an LMIC. It has led to a broadening of the resource base, as new financing sources have been approached, and consideration of the proper mix of less- or non-concessional financing with the concessional financing available. The new financing sources include export credits from Pakistan, Malaysia, Hungary and Iran, and private banks, including Deutsche Bank and HSBC. The strategy focuses on sectors that generate cash flow, such as economic infrastructure facilities and productive sectors; loans that have the longest repayment periods, maximum grace periods and most
61
favourable grant elements; and the use of capital markets, through alternative methods such as issuing sovereign bonds.
In the case of Egypt, there was no strategy in place to manage the transition away from aid. One of the most significant shortfalls in aid management and coordination is the fact that there is minimal coordination between the Ministries of Planning and Finance and the Ministry of Investment and International Cooperation. A debt management strategy is in place (Ministry of Finance, 2015), but it is under the remit of the Ministry of Finance, and is not necessarily managed closely with the Ministry of Investment and International Cooperation.
5.3 Coordination mechanisms
Most of the case-study countries do not have an aid coordination mechanism. In the countries that do have one, the mechanisms are progressively losing relevance and traction, which in some cases has been caused by the reclassification to MIC (reflecting a trend identified across many other countries, see Prizzon et al., 2016).
In the case of Ghana, the optimism created by oil production affected the relationship between development partners and the Government of Ghana almost instantaneously. Projected oil revenues and the expanded economy improved debt sustainability, creating the fiscal space for borrowing, so the government borrowed ambitiously to boost infrastructure development. Having an alternative revenue source reshaped the power balance between the government and the development partners, which eventually harmed ODA disbursements, especially those in the form preferred by the government: MDBS and the entire development coordination and dialogue erected around it. So what changed in the period following Ghana’s reclassification? Both development partners and government officials interviewed recognised that the current situation in terms of platforms for strategic dialogue was one of inertia and was not optimal. The former coordination mechanism was never really replaced and the substitution of the framework agreement with Sector Working Groups did not materialise. One
interviewee stated that ‘the suspension of the budget support modality has affected the trust between the government and the development partners a lot’.
In Pakistan, the larger donor coordination mechanisms have become more infrequent over time, as the country’s dependence on external financing has reduced.
In the case of Nigeria, the government has failed to develop a central coordinating strategy for development finance. The country lacks an ODA policy and national operating guidelines for development assistance. The management of development assistance is, in reality, fragmented among several ministries, departments and agencies (Ministry of Budget and National Planning, 2015). Development support departments interact only loosely, with the Ministry of Finance managing and coordinating loans and the Ministry of Budget and National Planning responsible for grants. However, according to interviews with government officials and development partners, factors such as poor planning and institutional weaknesses have hampered the institution of strong sustainability mechanisms for exit strategies.
In Sri Lanka, the decreased influence of existing donors and the emergence of non-traditional donors, such as China and India, meant formal donor coordination mechanisms were phased out, with the government engaging with traditional and non-traditional donors bilaterally (Amarasinghe and Rebert, 2013: 22).
Arrangements on aid coordination and management have changed significantly since Viet Nam became an LMIC. Before the transition, donors and the Vietnamese government coordinated their interventions at an annual donor consultative group meeting, at which all donors gathered to discuss Viet Nam’s economy, opportunities and challenges, and to announce donor commitments. However, since 2013, this coordination mechanism has been replaced by the Viet Nam Development Partnership Forum. Donors do not announce commitments, but discuss development issues and priorities for Viet Nam. Donors are involved in sectoral donor coordination groups to ensure there is coordination and harmonisation among them.
62
In contrast, more active government engagement is foreseen for Egypt. There are currently aid management units within the Ministry of Investment and International Cooperation. In parallel, a Development Partners Group, which includes the most significant donors and lenders, is in place and led by the United Nations Development Programme (UNDP); the government’s
participation in this group is minimal. According to one of the interviewees, the Ministry of Investment and International Cooperation has expressed an interest in taking a more active role in Development Partners Group meetings. This is largely because of the Minister of Investment and International Cooperation, who is generally more proactive and open to external financiers.
63
6 Conclusions and recommendations
37 On this last point, see Manuel et al. (2018).
Many countries have been reclassified as MICs (34 economies are now classified as LICs) and have progressively moved away from traditional forms of aid. Against this backdrop, we were initially surprised that we did not identify a critical mass of contributions to the literature (either cross-country or individual country studies) mapping what all this meant for development finance and, more importantly, what could be learnt from the approaches taken by countries that had already undergone such a transition (and how donors should manage it). So far, the literature has focused on the opposite question: what are the (dis)incentives for tax-revenue mobilisation and the administration of greater aid inflows, and what is the rationale for filling financing gaps in countries that cannot afford service delivery even if they mobilise tax revenues at their maximum capacity?37
As discussed in Section 2, the literature often argues that crossing the LMIC threshold and graduating from the soft windows of the MDBs will change a country’s access to external ODF and the volume and type of ODF available. This is, indeed, the case for lending from the soft windows of the MDBs and for assistance offered by most vertical funds (by definition, because the eligibility criteria are triggered by income per capita). Bilateral development partners might reconsider the scale and scope of their development programmes and projects and change gear to provide the type of engagement required when a recipient country achieves MIC status and moves up the income-per-capita ladder, as we found in our companion paper (Jalles d’Orey and Prizzon, 2019).
With this report we wanted to ‘separate the hype from the reality’ and test a few hypotheses on the trajectories that development financing follows after transition to LMIC status and from concessional assistance, beyond aggregate measures or country-cross analyses. We wanted to ground our analyses, to the extent possible for this qualitative approach, in each country’s circumstances, i.e. in the economic, social and political contexts affecting decisions on allocation and prioritisation of development finance.
With this qualitative, rather than quantitative, analysis, we aimed to fill, at least partially, the gap in our knowledge by examining the experiences of eight countries that had either been reclassified as an MIC or had graduated from the soft windows of the MDBs over the past 5 to 10 years. We reviewed both the trends in development finance seen in these countries and the countries’ approaches to dealing with their change of status. At least for the sample that we reviewed, we both corroborated and challenged common assumptions on aid flows to MICs. Such mapping is not just a purely abstract or academic exercise; it can help us to understand the picture of international public finance in MICs, to determine how recipient countries and donors should plan for transition and how the various actors should coordinate their activities.
We took a macro perspective on ‘transition finance’ – a country approach does not allow for a granular analysis of the implications of transition to MIC status at the project/programme micro level (and that was not the purpose of our analysis). However, we identified
64
quite a few elements in the evolution of the development finance landscape following transition to MIC status (or graduation from soft windows of MDBs).
• Crossing the MIC threshold does not mean there will be less ODF (at least in absolute volume terms). Considering constant prices, we have seen that ODA has grown in all countries that we have reviewed, albeit at different rates. Rising flows are often associated with geostrategic considerations: geographical location for Pakistan (military action in the post 9/11 period) and Egypt (in the turbulent Middle East and North Africa region); proximity with a development partner, as for Papua New Guinea (and its main partner, Australia) or with natural disasters, as in the case of Pakistan and Sri Lanka; or institutional strengthening. In other words, development assistance was driven by motives well beyond the income per capita of the recipient country.
• Falling ODA flows are not necessarily matched by growing OOFs. While in most cases the volume of ODF rose, in several cases the volume of non-concessional official finance mobilised did not compensate for the fall in ODA flows. There are several factors behind this: (1) the type of financing provided by the largest bilateral donors (which might be restricted to grant financing); (2) access to the hard windows of the MDBs (being a vulnerable economy might prevent a country from borrowing from the hard window of an MDB, e.g. blend countries from accessing IBRD lending, as in the case of Nigeria and Pakistan); and (3) eligibility for non-concessional borrowing (as in the case of the AfDB) and binding country debt limits (as in Viet Nam).
• Unsurprisingly, loans as a share of ODA rose in most countries, but not all. We would have expected grants to be prioritised and channelled to low-income countries. However, in two of the countries reviewed only very limited changes occurred, notably, in Egypt and Papua New Guinea. Their largest development partners – the US and Australia, respectively – both provided their programmes (or used to) in the form of grants. Therefore, the patterns of development finance
in transition countries will be affected by their donors’ landscapes and their financing instruments and modalities.
• Most countries have seen their total official resources – ODF plus domestic public finance as a share of GDP – fall over time – with tax-to-GDP ratios rising, but not enough to compensate for the fall, or even declining over time. Except for Pakistan, all the countries reviewed in this report have seen their total official resources as a share of GDP fall over time. In some of these countries – Ghana, Lao PDR and Viet Nam – ODF as a share of GDP fell (ODF grew in volume terms but not as much as GDP). Tax revenues as a share of GDP increased, but not enough to compensate for the fall in ODA. In some of the cases examined, the ‘missing middle’ was even more pronounced. Not only did ODF as a share of GDP fall, but so too did tax revenues, as in the cases of Sri Lanka, Nigeria and Papua New Guinea. Because of concerns about future debt sustainability, the Vietnamese government has introduced a binding debt-to-GDP ratio ceiling for its public borrowing. This ceiling has been limiting its ability to borrow from the IBRD (this meant that the government of Viet Nam had not borrowed from IBRD at the time the case study was conducted, even though it was eligible).
• There has been a rise in ODF from development partners such as China and the Republic of Korea, whose allocation is not driven by the income per capita of the recipient country. The rise of China as a donor has had a large impact on development finance for many of our case-study countries, especially countries geographically close to China. Lao PDR, Pakistan and Sri Lanka all lie on the the designated route for China’s new Belt and Road Initiative. Chinese development assistance and investments have been expanding in Ghana, Nigeria and Papua New Guinea. ODF from the Republic of Korea – especially from Korea Eximbank – also expanded, in Lao PDR, Nigeria and Viet Nam.
• In nearly all the countries reviewed for this report, the sectoral allocation of resources – external ODF as well as public finance – has changed towards infrastructure development.
65
Except for Lao PDR, both external ODF and public finance have increasingly targeted infrastructure development rather than the social sectors. In Viet Nam, this was the case for external ODF but not for public finance – which has increasingly been allocated towards the social sectors (partly addressing some of the gaps left by falling development assistance). In the case of Papua New Guinea, this shift was of concern for both government officials and development partners (and was also associated with worsening health indicators). In Pakistan, the health sector accounted for around 6% of aid disbursements in 2000, and only 1% of aid disbursements in 2015. However, a rise in the share of ODF allocated to the infrastructure sector was the result of government preference (e.g. for energy in Pakistan).
• The three blend countries reviewed in this report are towards the bottom of the HDI rankings. Even though HDI rank is correlated with income (income per capita is one of the components of the index), the three worst HDI performers in our selected group (Papua New Guinea, Nigeria and Pakistan) are the blend countries. Their HDI rankings are lower than some of the ‘best performing’ LICs. Though opaque, the creditworthiness assessment does consider these factors, hence the lengthy – nearly a decade – period as a blend country (Viet Nam was reclassified as an LMIC more or less at the same time and became an IBRD country under IDA-18 in 2017). The blend countries reviewed for this report, especially Papua New Guinea, saw their public expenditure on education and health fall – at times sharply – and some human-development (especially health-related) indicators worsen.
• Despite facing changes in the volume, composition and terms and conditions of development finance in their transition away from aid, countries do not usually have a strategy in place to address the potential challenges or to plan ahead. The only exception is Viet Nam – but its strategy primarily looks at the types of projects each source can fund. Other countries are planning their transition away from aid (Ghana, with its ‘Ghana Beyond Aid’ strategy, and Nigeria) and have incorporated some principles of transition from LIC in other documents (Lao PDR). Other
governments manage their financing options through a debt management strategy (even though this aims to minimise costs and financial risk, rather than serve as a planning tool).
• Across the case studies, we found that governments did not – or found it difficult to – articulate their priorities for the types of assistance they would like to receive from development partners in their transition away from aid, not often acknowledging the changing circumstances associated with LMIC status. Whenever priorities were specified, they largely reflected the need for capacity building and knowledge, and to fill gaps where government capacity was limited.
• Coordination mechanisms have generally been phased out. High-level coordination mechanisms have either become less frequent or have lost traction, often because of the waning importance of external assistance. There are some counter-examples, though, such as the Egyptian government’s increasing engagement with a group of donor partners.
So, what should governments and development partners change to improve the management of the transition away from aid, based on the reviews in this report and in the companion paper to this project (Jalles d’Orey and Prizzon, 2019)?
For governments • Articulate and be clear on priorities for external development finance and develop a strategy for managing the transition away from aid. The terms and conditions are, in most cases, likely to change at the global level (especially rises in interest rates), and ODF as a share of GDP is likely to fall.
• Within this context, prioritise tax mobilisation and tax administration as a key element of the financing strategy.
• Plan for changes in the composition of development finance to mitigate financial risks and rising costs, especially when a country has limits to its external borrowing, such as debt-to-GDP cap, and when favourable borrowing terms and conditions, such as loans from the hard windows of the MDBs, could be an option.
• Protect gains achieved in the social sectors by ring-fencing the share of government
66
spending that goes to the education and health sectors. We have seen how the share of both external assistance and public finance to the social sectors have been falling in some of the countries reviewed.
• Invest in coordination mechanisms. Now more than ever, coordination between government and development partners should be improved. It will be key to the sharing of information about development partners’ plans; when they intend to change their programme orientation or decide to withdraw their development projects from the country.
For development partners • Supporting countries in the transition from aid should take a whole-of-finance-system approach, coordinating changes in focus, volumes and financing methods with other donors or lenders, to avoid jeopardising results already achieved.
• Reconsider criteria and approaches to transition. Beyond income per capita of the recipient country, resource allocation should consider trajectories in resource mobilisation broader than macroeconomic performance. The ‘blend’ period for MDB lending should also be reviewed, reflecting performance in human development – indicators and spending – among the eligibility criteria, at least more explicitly.
• Align with national development plans. With countries’ prioritisation towards infrastructure development, development partners should continue reflecting recipient countries’ priorities for their own national development. This would include building capacity to manage such transition, supporting the country’s priorities and strategies.
• Help boost non-concessional official finance and tax revenues To help address the ‘missing middle’ of development finance, development partners should either boost non-concessional sovereign lending (especially the hard windows of the MDBs) which are still cheaper than borrowing from domestic and international capital markets at higher rates and shorter maturities and would put less pressure on future debt sustainability. With tax revenues falling as a share of GDP, development partners should also focus on how to support efforts to boost tax revenue.
• Do not consider transition as a linear process towards graduation from aid, and continue to engage with countries in transition. Countries may have started moving away from aid, but the process may not necessarily be linear and without setbacks. Low interest rates have helped keep costs low, but a rising trend – and reduced market appetite for investment in emerging markets – could change this picture.
67
References
Alonso, J.A., Glennie, J. and Sumner, A. (2014) Recipients and contributors: middle income countries and the future of development cooperation. DESA Working Paper No. 135. New York, NY: United Nations Department of Economic and Social Affairs
Amarasinghe, D. and Rebert, J. (2013) Dynamics and trends of foreign aid in Sri Lanka. Colombo: International Alert
Benedek, D., Crivelli, E., Gupta, S. and Muthoora, P. (2012) Foreign aid and revenue: still a crowding out effect? IMF Working Paper 12/186. Washington, DC: International Monetary Fund (www.imf.org/en/Publications/WP/Issues/2016/12/31/Foreign-Aid-and-Revenue-Still-a-Crowding-Out-Effect-26085)
Bräutigam, D. (2000) Aid dependence and governance, vol. 1. Stockholm: Almqvist and Wiksell International
Central Bank of Nigeria (2016) ‘Public Finance Statistics’, in Statistical Bulletin 27 (December 2016) Abuja: Central Bank of Nigeria (www.cbn.gov.ng/Out/2017/SD/2016%20Statistical%20Bulletin%20Contents%20and%20Narratives.pdf)
Cottarelli, C. (2011) ‘Revenue mobilization in developing countries’. Policy Paper. Washington, DC: International Monetary Fund
DANIDA (2017) Vietnam-Denmark: transformation of a partnership – synthesis report. Copenhagen: DANIDA/Ministry of Foreign Affairs
Department of External Resources (n.d.) ‘External Financing Strategy’. Webpage. Colombo: Department of External Resources (www.erd.gov.lk/index.php?option=com_content&view=article&id=84&Itemid=305&lang=en#the-borrowing-strategy)
Davies, R. (2015) ‘Two dogmas of development financing: aid to the transition countries’. DevPolicy Blog. Development Policy Centre, Australian National University, 21 August (www.devpolicy.org/two-dogmas-of-development-financing-part-3-20150821/)
de Mel, D. and de Silva, A. (2010) Aid effectiveness in Sri Lanka. Colombo: Institute of Policy StudiesDercon, S. and Lea, N. (2015) ‘The missing middle – or is there an obvious resource gap for LMICs?’
http://users.ox.ac.uk/~econstd/2015-30-05%20-%20The%20Missing%20Middle_web.pdf (accessed (accessed July 2017).
EU, UN, MPI – European Union, United Nations, Ministry of Planning and Investment of Viet Nam (2014) Development Finance for Sustainable Development Goals in Middle-Income Viet Nam: Financing Viet Nam’s Development: meeting the new challenges. Hanoi: EU-Vietnam Strategic Dialogue Facility
Federal Inland Revenue Services (2018) ‘Tax revenue statistics’. (https://www.firs.gov.ng/tax-statistics.html)Forsberg, L.T. (2010) The Swedish exit from Vietnam: leaving painfully or normalising bilateral
relations? FRIDE Project Report. Madrid: FRIDEGlennie, J. (2011) The role of aid to middle-income countries: a contribution to evolving EU
development policy. London: Overseas Development InstituteGlennie, J. and Prizzon A. (2012) ‘From high to low aid: a proposal to classify countries by aid
receipt’. ODI Background Notes. London: Overseas Development Institute Government of Lao PDR (2015) Vientiane Declaration on Partnership for Effective Development
Cooperation. Vientiane: Government of the Lao People’s Democratic RepublicGupta, S., Clements, B., Pivovarsky, A. and Tiongson, E.R. (2003). Foreign aid and revenue response:
does the composition of aid matter? IMF Working Paper 3-176. Washington, DC: International Monetary Fund (www.imf.org/external/pubs/ft/wp/2003/wp03176.pdf)
68
Hayward-Jones, J. (2017) ‘Changing geopolitical dynamics for Papua New Guinea’. Papua New Guinea Country Snapshot. Lowy Institute, 6 December (http://interactives.lowyinstitute.org/publications/PNGin2017/png-in-2017-changing-geopolitical-dynamics-for-papua-new-guinea.html)
ICAI – Independent Commission for Aid Impact (2016) When aid relationships change: DFID’s approach to managing exit and transition in its development partnerships – a performance review. London: ICAI
Jalles d’Orey M.A. and Prizzon, A. (2019) Exit from aid: an analysis of donors’ approaches. London: Overseas Development Institute
Kharas, H., Prizzon, A. and Rogerson, A. (2014) Financing the post-2015 Sustainable Development Goals. London: Overseas Development Institute
Knack, S., Xu, L.C. and Zou, B. (2013) ‘Income thresholds and aid responses’. Paper presented at the 17th annual meeting of the International Society for New Institutional Economics, 20–22 June, Florence
Maipose, G., Somolekae, G. and Johnston, T. (2007) ‘Effective aid management: the case of Botswana’ in J. Carlsson, G. Somolekae and N. Van de Walle (eds.) Foreign aid in Africa: Learning from country experiences. Uppsala, Sweden: Nordic Africa Institute
Manuel, M., Desai, H., Samman, R. and Evans, M. (2018) Financing the end of extreme poverty. ODI Report. London: Overseas Development Institute
McGillivray, M., Carpenter, D. and Norup, S. (2012) Evaluation study of long-term development co-operation between Sri Lanka and Sweden. Stockholm: Swedish International Development Cooperation Agency
Ministry of Budget and National Planning (Nigeria) (2015) Development Cooperation Report. Abuja: Ministry of Budget and National Planning
Ministry of Education (Nigeria) (2018) ‘Federal government expenditure on education’. Unpublished raw data. Abuja: Ministry of Education
Ministry of Finance (Egypt) (2015) Medium-term debt management strategy (MTDS). Cairo: Ministry of Finance. (www.mof.gov.eg/MOFGallerySource/English/Reports/monthly/2015/September2015/MTDS-English.pdf)
Ministry of Health (Lao PDR) (2011) The 7th Five-Year Health Sector Development Plan. Vientiane Capital: Ministry of Health
Morrissey, O. (2015) ‘Aid and government fiscal behavior: assessing recent evidence’ World Development 69: 98–105
Moss, T.J. and Majerowicz, S. (2012) No longer poor: Ghana’s new income status and implications of graduation from IDA. Working Paper 300. Washington, DC: Center for Global Development
MPI – Ministry of Planning and Investment (2016) 8th Five-Year National Socio-Economic Development Plan (2016-2020). Vientiane: MPI
MPI and UNDP – Ministry of Planning and Investment and United Nations Development Programme (2017) Graduation from least developed country status – Lao PDR 2017. Vientiane: MPI and UNDP
ODI et al. – Overseas Development Institute, German Development Institute, European Centre for Development Policy Management, University of Athens Department of Economics, Southern Voice Network (2015) European Report on Development 2015: combining finance and policies to implement a transformative post-2015 development agenda. Brussels: European Union
OECD (2018) ‘Creditor Reporting System’. Paris: OECD. (https://stats.oecd.org/index.aspx?DataSetCode=CRS1)
Papua New Guinea Department of Treasury (2017) 2018 National Budget. Volume 1: economic and development policies. Port Moresby: Government of Papua New Guinea
Prizzon, A. (2014) The Age of Choice: Papua New Guinea in the new aid landscape. London: Overseas Development Institute
Prizzon, A. and Rabinowitz, G. (2015) Financing for development: lessons from Development Progress case studies. London: Overseas Development Institute
69
Prizzon, A. and Rogerson, A. (2017) Moving away from aid? The case of Indonesia. London: Overseas Development Institute
Prizzon, A., Greenhill, R. and Mustapha, S. (2016) An age of choice for development finance: evidence from country case studies. London: Overseas Development Institute
Pycroft, J. and Martins, P. (2009) How unpredictable aid influences service delivery: literature and data review. London: Overseas Development Institute (https://siteresources.worldbank.org/INTKNOWLEDGEFORCHANGE/Resources/AidPredictLitdatareviewODIfinalversionJune.pdf)
Remmer, K.L. (2004) ‘Does foreign aid promote the expansion of government?’ American Journal of Political Science 48(1): 77–92
SECO – State Secretariat for Economic Affairs (2017) SECO Country Strategy Vietnam 2017-2020. Bern: SECO
Slob, A. and Jerve, A.M. (2008) Managing aid exit and transformation: lessons from Botswana, Eritrea, India, Malawi and South Africa – synthesis report. Stockholm: Swedish International Development Agency
Sy, A. and Rakotondrazaka, F.M. (2015) Private capital flows, official development assistance, and remittances to Africa: who gets what. Policy Paper 2015-02. Washington, DC: Brookings Institution
Thomas, A., Viciani, I., Tench, J., Sharpe, R., Hall, M., Martin, M. and Watts, R. (2011) Ending aid dependency. Real Aid 3. London: ActionAid
UNDP – United Nations Development Programme (2016) ‘Overview report of development finance in Myanmar’. UNDP Myanmar and UNDP Bangkok regional office
UNDP (n.d.) ‘Cambodia: development finance assessment’. Powerpoint presentation. (www.asia-pacific.undp.org/content/dam/rbap/docs/meetTheSDGs/Cambodia%20Development%20Finance%20Assessment%20DFA%20PPT%20.pdf)
USAID (2018) HFG Nigeria final country report. Health, Finance & Governance Project final report. Washington, DC: USAID
Whitaker, D., Walford, V. and David, B. (2013) Health care financing in the Asia Pacific region. London: HLSP Institute
World Bank (2018) ‘Bank Directive: Financial terms and conditions of Bank financing. IBRD/IDA and blend countries: per capita incomes, lending eligibility, and repayment terms’. Updated May 2018. Washington, DC: World Bank Group
Yamey, G. and Hecht, R. (2018) ‘Are tough times ahead for countries graduating from foreign aid?’ Future Development blog. Brookings Institution, 8 March (www.brookings.edu/blog/future-development/2018/03/08/are-tough-times-ahead-for-countries-graduating-from-foreign-aid/)
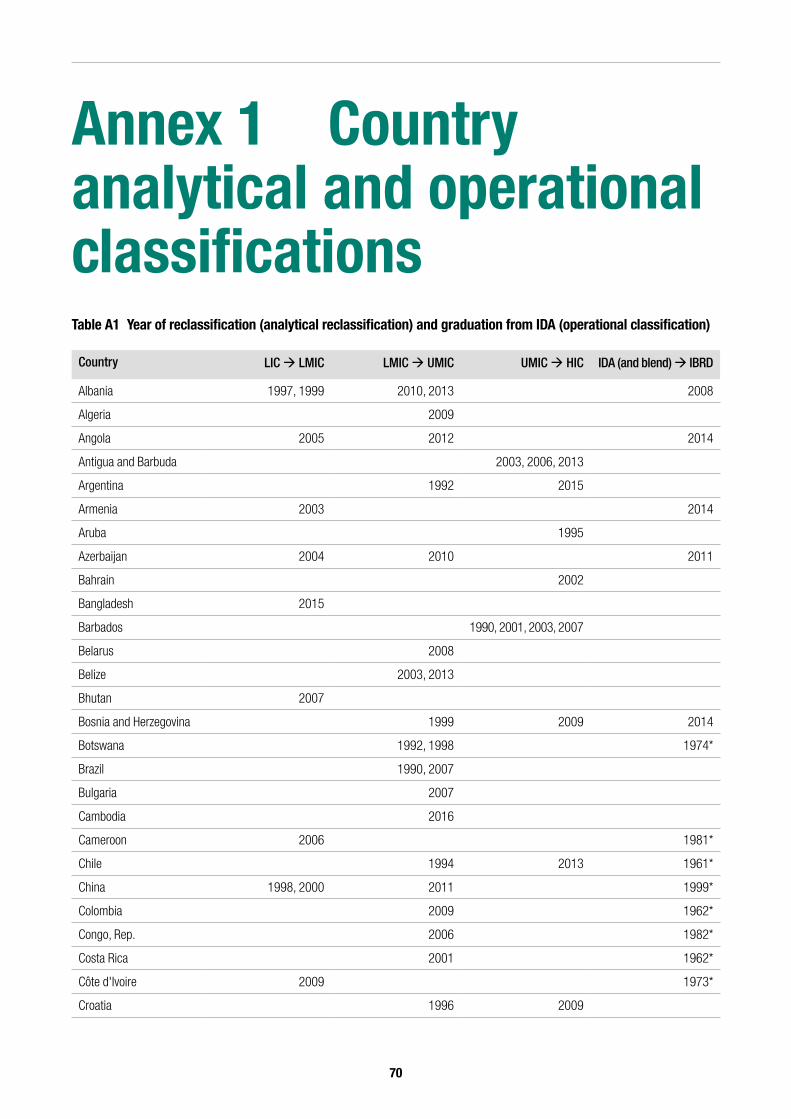
70
Annex 1 Country analytical and operational classificationsTable A1 Year of reclassification (analytical reclassification) and graduation from IDA (operational classification)
Country LIC LMIC LMIC UMIC UMIC HIC IDA (and blend) IBRD
Albania 1997, 1999 2010, 2013 2008
Algeria 2009
Angola 2005 2012 2014
Antigua and Barbuda 2003, 2006, 2013
Argentina 1992 2015
Armenia 2003 2014
Aruba 1995
Azerbaijan 2004 2010 2011
Bahrain 2002
Bangladesh 2015
Barbados 1990, 2001, 2003, 2007
Belarus 2008
Belize 2003, 2013
Bhutan 2007
Bosnia and Herzegovina 1999 2009 2014
Botswana 1992, 1998 1974*
Brazil 1990, 2007
Bulgaria 2007
Cambodia 2016
Cameroon 2006 1981*
Chile 1994 2013 1961*
China 1998, 2000 2011 1999*
Colombia 2009 1962*
Congo, Rep. 2006 1982*
Costa Rica 2001 1962*
Côte d'Ivoire 2009 1973*
Croatia 1996 2009
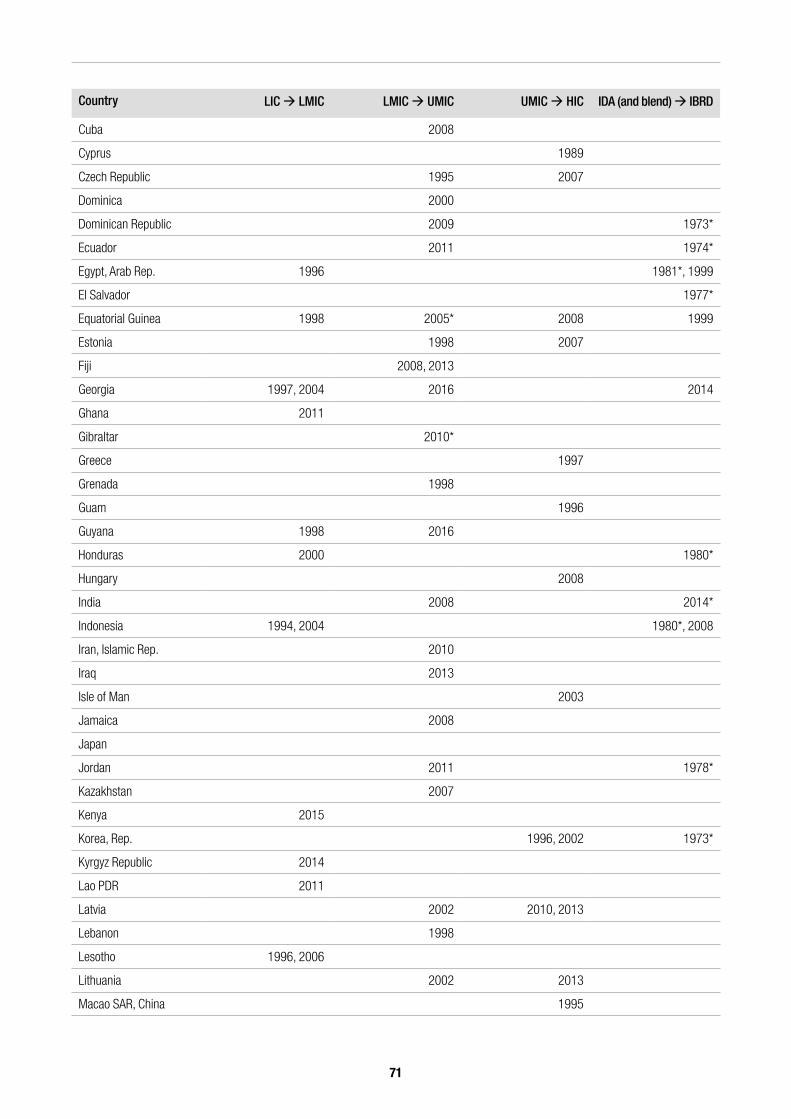
71
Country LIC LMIC LMIC UMIC UMIC HIC IDA (and blend) IBRD
Cuba 2008
Cyprus 1989
Czech Republic 1995 2007
Dominica 2000
Dominican Republic 2009 1973*
Ecuador 2011 1974*
Egypt, Arab Rep. 1996 1981*, 1999
El Salvador 1977*
Equatorial Guinea 1998 2005* 2008 1999
Estonia 1998 2007
Fiji 2008, 2013
Georgia 1997, 2004 2016 2014
Ghana 2011
Gibraltar 2010*
Greece 1997
Grenada 1998
Guam 1996
Guyana 1998 2016
Honduras 2000 1980*
Hungary 2008
India 2008 2014*
Indonesia 1994, 2004 1980*, 2008
Iran, Islamic Rep. 2010
Iraq 2013
Isle of Man 2003
Jamaica 2008
Japan
Jordan 2011 1978*
Kazakhstan 2007
Kenya 2015
Korea, Rep. 1996, 2002 1973*
Kyrgyz Republic 2014
Lao PDR 2011
Latvia 2002 2010, 2013
Lebanon 1998
Lesotho 1996, 2006
Lithuania 2002 2013
Macao SAR, China 1995
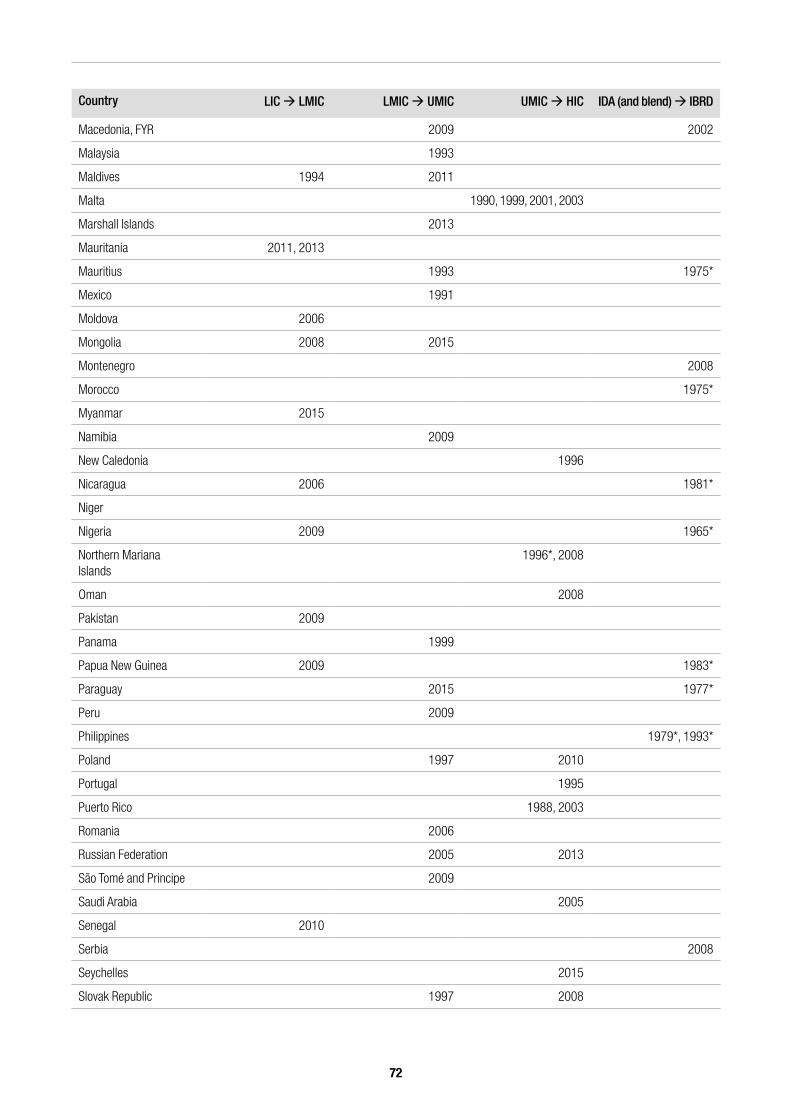
72
Country LIC LMIC LMIC UMIC UMIC HIC IDA (and blend) IBRD
Macedonia, FYR 2009 2002
Malaysia 1993
Maldives 1994 2011
Malta 1990, 1999, 2001, 2003
Marshall Islands 2013
Mauritania 2011, 2013
Mauritius 1993 1975*
Mexico 1991
Moldova 2006
Mongolia 2008 2015
Montenegro 2008
Morocco 1975*
Myanmar 2015
Namibia 2009
New Caledonia 1996
Nicaragua 2006 1981*
Niger
Nigeria 2009 1965*
Northern Mariana Islands
1996*, 2008
Oman 2008
Pakistan 2009
Panama 1999
Papua New Guinea 2009 1983*
Paraguay 2015 1977*
Peru 2009
Philippines 1979*, 1993*
Poland 1997 2010
Portugal 1995
Puerto Rico 1988, 2003
Romania 2006
Russian Federation 2005 2013
São Tomé and Principe 2009
Saudi Arabia 2005
Senegal 2010
Serbia 2008
Seychelles 2015
Slovak Republic 1997 2008
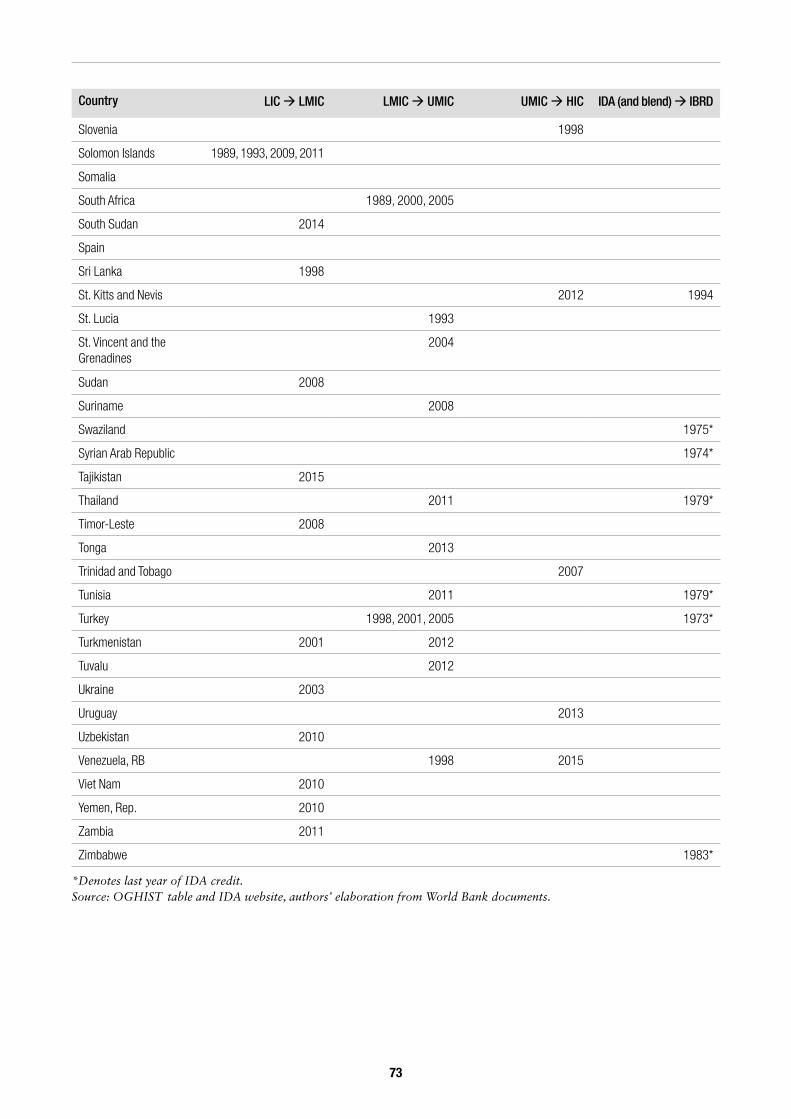
73
Country LIC LMIC LMIC UMIC UMIC HIC IDA (and blend) IBRD
Slovenia 1998
Solomon Islands 1989, 1993, 2009, 2011
Somalia
South Africa 1989, 2000, 2005
South Sudan 2014
Spain
Sri Lanka 1998
St. Kitts and Nevis 2012 1994
St. Lucia 1993
St. Vincent and the Grenadines
2004
Sudan 2008
Suriname 2008
Swaziland 1975*
Syrian Arab Republic 1974*
Tajikistan 2015
Thailand 2011 1979*
Timor-Leste 2008
Tonga 2013
Trinidad and Tobago 2007
Tunisia 2011 1979*
Turkey 1998, 2001, 2005 1973*
Turkmenistan 2001 2012
Tuvalu 2012
Ukraine 2003
Uruguay 2013
Uzbekistan 2010
Venezuela, RB 1998 2015
Viet Nam 2010
Yemen, Rep. 2010
Zambia 2011
Zimbabwe 1983*
*Denotes last year of IDA credit.Source: OGHIST table and IDA website, authors’ elaboration from World Bank documents.
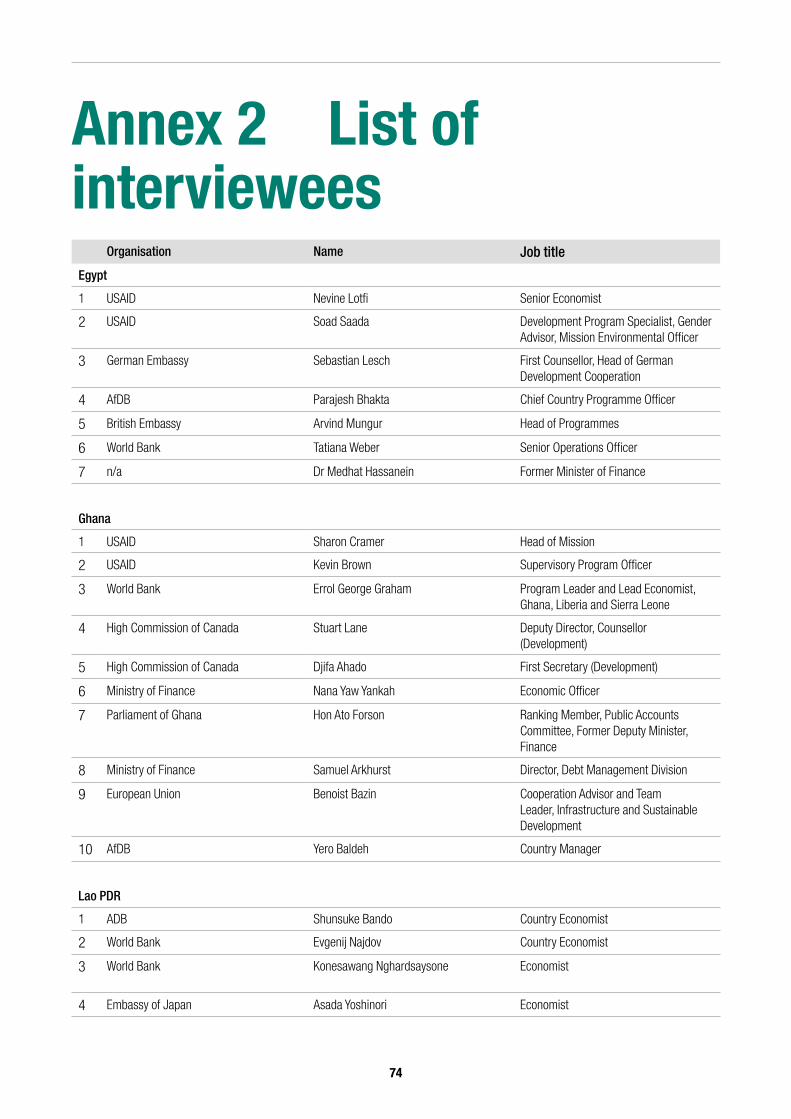
74
Annex 2 List of interviewees
Organisation Name Job title
Egypt
1 USAID Nevine Lotfi Senior Economist
2 USAID Soad Saada Development Program Specialist, Gender Advisor, Mission Environmental Officer
3 German Embassy Sebastian Lesch First Counsellor, Head of German Development Cooperation
4 AfDB Parajesh Bhakta Chief Country Programme Officer
5 British Embassy Arvind Mungur Head of Programmes
6 World Bank Tatiana Weber Senior Operations Officer
7 n/a Dr Medhat Hassanein Former Minister of Finance
Ghana
1 USAID Sharon Cramer Head of Mission
2 USAID Kevin Brown Supervisory Program Officer
3 World Bank Errol George Graham Program Leader and Lead Economist, Ghana, Liberia and Sierra Leone
4 High Commission of Canada Stuart Lane Deputy Director, Counsellor (Development)
5 High Commission of Canada Djifa Ahado First Secretary (Development)
6 Ministry of Finance Nana Yaw Yankah Economic Officer
7 Parliament of Ghana Hon Ato Forson Ranking Member, Public Accounts Committee, Former Deputy Minister, Finance
8 Ministry of Finance Samuel Arkhurst Director, Debt Management Division
9 European Union Benoist Bazin Cooperation Advisor and Team Leader, Infrastructure and Sustainable Development
10 AfDB Yero Baldeh Country Manager
Lao PDR
1 ADB Shunsuke Bando Country Economist
2 World Bank Evgenij Najdov Country Economist
3 World Bank Konesawang Nghardsaysone Economist
4 Embassy of Japan Asada Yoshinori Economist
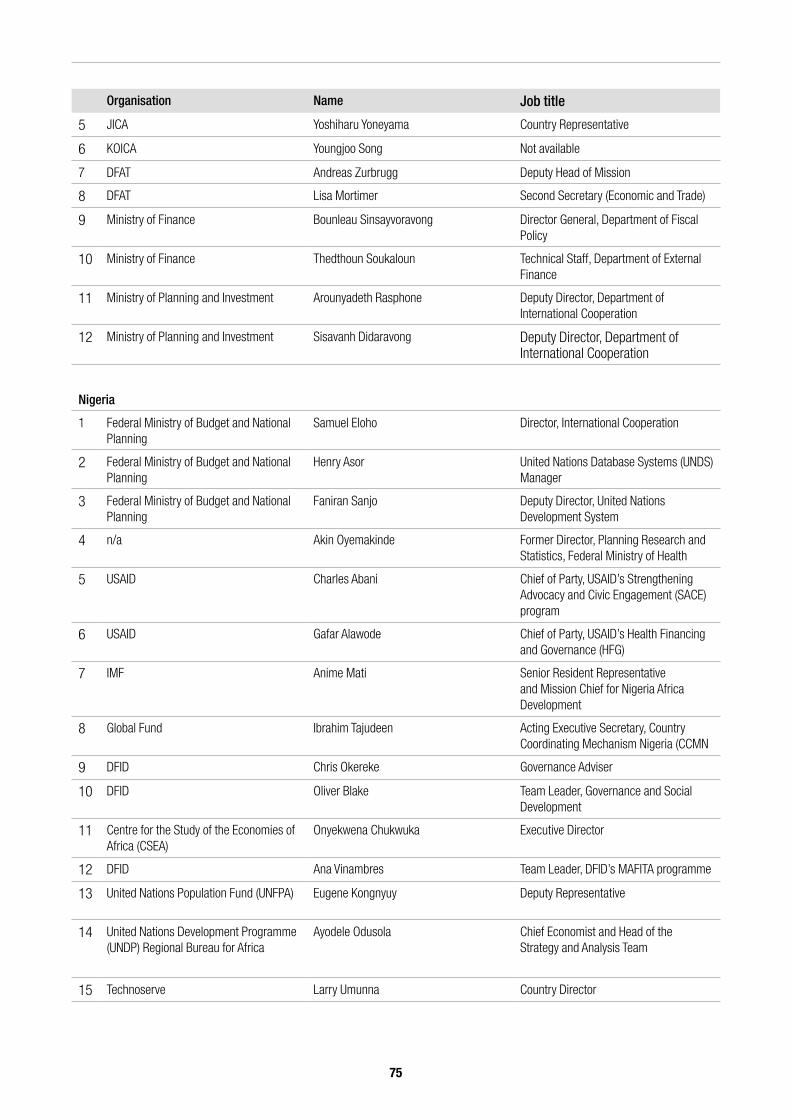
75
Organisation Name Job title
5 JICA Yoshiharu Yoneyama Country Representative
6 KOICA Youngjoo Song Not available
7 DFAT Andreas Zurbrugg Deputy Head of Mission
8 DFAT Lisa Mortimer Second Secretary (Economic and Trade)
9 Ministry of Finance Bounleau Sinsayvoravong Director General, Department of Fiscal Policy
10 Ministry of Finance Thedthoun Soukaloun Technical Staff, Department of External Finance
11 Ministry of Planning and Investment Arounyadeth Rasphone Deputy Director, Department of International Cooperation
12 Ministry of Planning and Investment Sisavanh Didaravong Deputy Director, Department of International Cooperation
Nigeria
1 Federal Ministry of Budget and National Planning
Samuel Eloho Director, International Cooperation
2 Federal Ministry of Budget and National Planning
Henry Asor United Nations Database Systems (UNDS) Manager
3 Federal Ministry of Budget and National Planning
Faniran Sanjo Deputy Director, United Nations Development System
4 n/a Akin Oyemakinde Former Director, Planning Research and Statistics, Federal Ministry of Health
5 USAID Charles Abani Chief of Party, USAID’s Strengthening Advocacy and Civic Engagement (SACE) program
6 USAID Gafar Alawode Chief of Party, USAID’s Health Financing and Governance (HFG)
7 IMF Anime Mati Senior Resident Representative and Mission Chief for Nigeria Africa Development
8 Global Fund Ibrahim Tajudeen Acting Executive Secretary, Country Coordinating Mechanism Nigeria (CCMN
9 DFID Chris Okereke Governance Adviser
10 DFID Oliver Blake Team Leader, Governance and Social Development
11 Centre for the Study of the Economies of Africa (CSEA)
Onyekwena Chukwuka Executive Director
12 DFID Ana Vinambres Team Leader, DFID’s MAFITA programme
13 United Nations Population Fund (UNFPA) Eugene Kongnyuy Deputy Representative
14 United Nations Development Programme (UNDP) Regional Bureau for Africa
Ayodele Odusola Chief Economist and Head of the Strategy and Analysis Team
15 Technoserve Larry Umunna Country Director
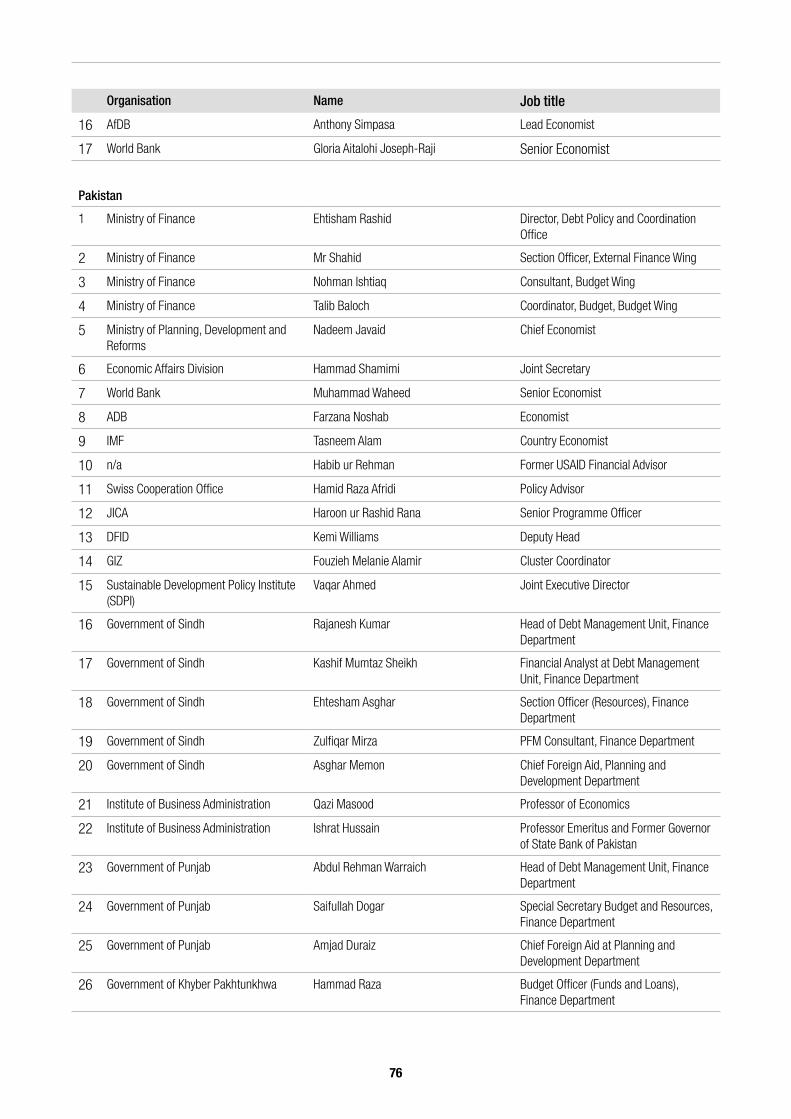
76
Organisation Name Job title
16 AfDB Anthony Simpasa Lead Economist
17 World Bank Gloria Aitalohi Joseph-Raji Senior Economist
Pakistan
1 Ministry of Finance Ehtisham Rashid Director, Debt Policy and Coordination Office
2 Ministry of Finance Mr Shahid Section Officer, External Finance Wing
3 Ministry of Finance Nohman Ishtiaq Consultant, Budget Wing
4 Ministry of Finance Talib Baloch Coordinator, Budget, Budget Wing
5 Ministry of Planning, Development and Reforms
Nadeem Javaid Chief Economist
6 Economic Affairs Division Hammad Shamimi Joint Secretary
7 World Bank Muhammad Waheed Senior Economist
8 ADB Farzana Noshab Economist
9 IMF Tasneem Alam Country Economist
10 n/a Habib ur Rehman Former USAID Financial Advisor
11 Swiss Cooperation Office Hamid Raza Afridi Policy Advisor
12 JICA Haroon ur Rashid Rana Senior Programme Officer
13 DFID Kemi Williams Deputy Head
14 GIZ Fouzieh Melanie Alamir Cluster Coordinator
15 Sustainable Development Policy Institute (SDPI)
Vaqar Ahmed Joint Executive Director
16 Government of Sindh Rajanesh Kumar Head of Debt Management Unit, Finance Department
17 Government of Sindh Kashif Mumtaz Sheikh Financial Analyst at Debt Management Unit, Finance Department
18 Government of Sindh Ehtesham Asghar Section Officer (Resources), Finance Department
19 Government of Sindh Zulfiqar Mirza PFM Consultant, Finance Department
20 Government of Sindh Asghar Memon Chief Foreign Aid, Planning and Development Department
21 Institute of Business Administration Qazi Masood Professor of Economics
22 Institute of Business Administration Ishrat Hussain Professor Emeritus and Former Governor of State Bank of Pakistan
23 Government of Punjab Abdul Rehman Warraich Head of Debt Management Unit, Finance Department
24 Government of Punjab Saifullah Dogar Special Secretary Budget and Resources, Finance Department
25 Government of Punjab Amjad Duraiz Chief Foreign Aid at Planning and Development Department
26 Government of Khyber Pakhtunkhwa Hammad Raza Budget Officer (Funds and Loans), Finance Department
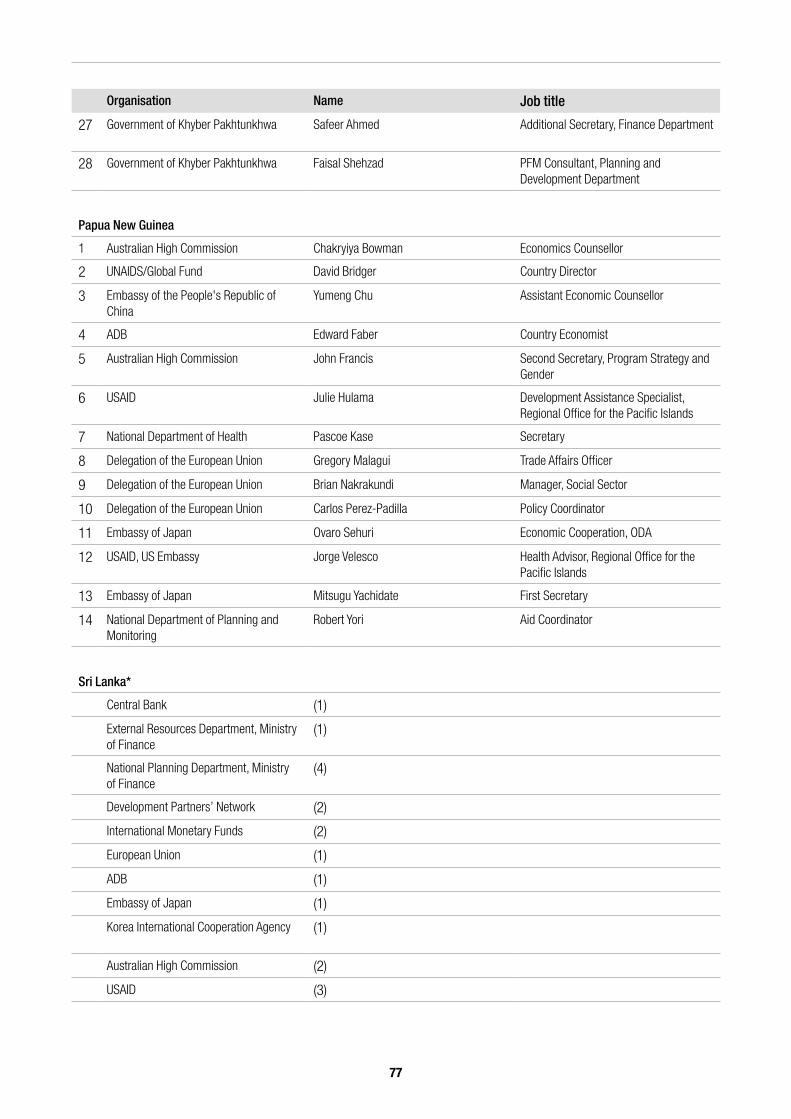
77
Organisation Name Job title
27 Government of Khyber Pakhtunkhwa Safeer Ahmed Additional Secretary, Finance Department
28 Government of Khyber Pakhtunkhwa Faisal Shehzad PFM Consultant, Planning and Development Department
Papua New Guinea
1 Australian High Commission Chakryiya Bowman Economics Counsellor
2 UNAIDS/Global Fund David Bridger Country Director
3 Embassy of the People's Republic of China
Yumeng Chu Assistant Economic Counsellor
4 ADB Edward Faber Country Economist
5 Australian High Commission John Francis Second Secretary, Program Strategy and Gender
6 USAID Julie Hulama Development Assistance Specialist, Regional Office for the Pacific Islands
7 National Department of Health Pascoe Kase Secretary
8 Delegation of the European Union Gregory Malagui Trade Affairs Officer
9 Delegation of the European Union Brian Nakrakundi Manager, Social Sector
10 Delegation of the European Union Carlos Perez-Padilla Policy Coordinator
11 Embassy of Japan Ovaro Sehuri Economic Cooperation, ODA
12 USAID, US Embassy Jorge Velesco Health Advisor, Regional Office for the Pacific Islands
13 Embassy of Japan Mitsugu Yachidate First Secretary
14 National Department of Planning and Monitoring
Robert Yori Aid Coordinator
Sri Lanka*
Central Bank (1)
External Resources Department, Ministry of Finance
(1)
National Planning Department, Ministry of Finance
(4)
Development Partners’ Network (2)
International Monetary Funds (2)
European Union (1)
ADB (1)
Embassy of Japan (1)
Korea International Cooperation Agency (1)
Australian High Commission (2)
USAID (3)
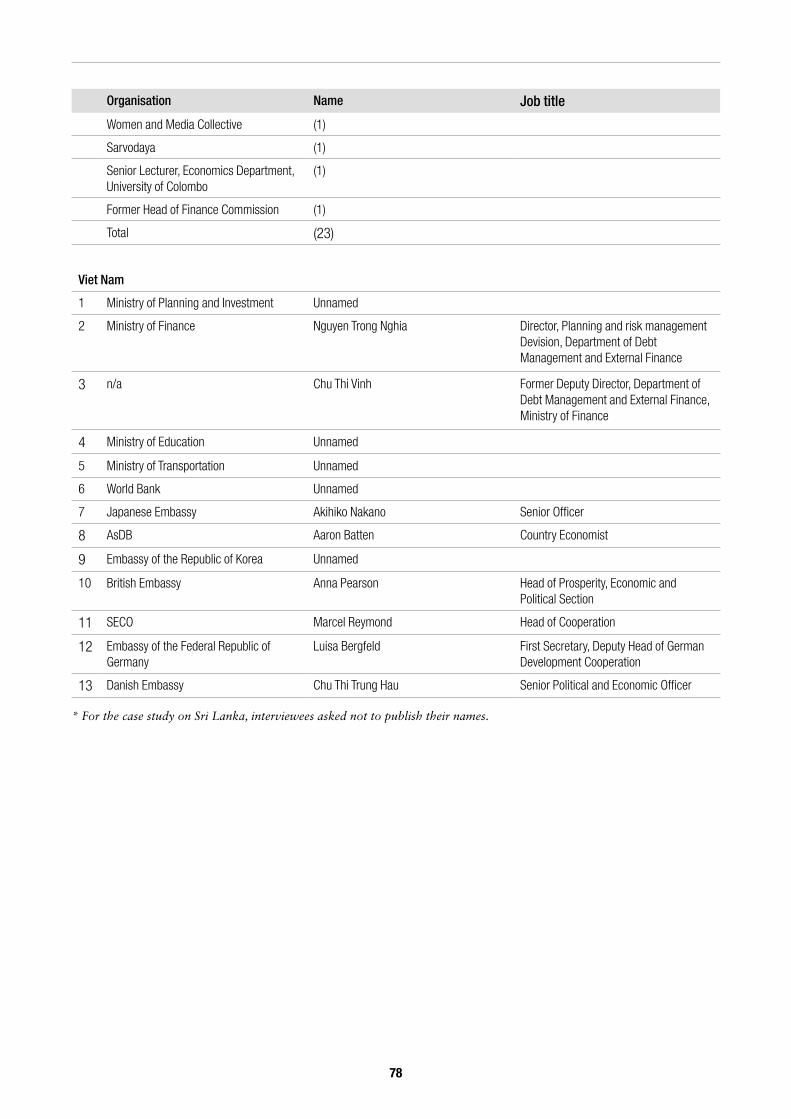
78
Organisation Name Job title
Women and Media Collective (1)
Sarvodaya (1)
Senior Lecturer, Economics Department, University of Colombo
(1)
Former Head of Finance Commission (1)
Total (23)
Viet Nam
1 Ministry of Planning and Investment Unnamed
2 Ministry of Finance Nguyen Trong Nghia Director, Planning and risk management Devision, Department of Debt Management and External Finance
3 n/a Chu Thi Vinh Former Deputy Director, Department of Debt Management and External Finance, Ministry of Finance
4 Ministry of Education Unnamed
5 Ministry of Transportation Unnamed
6 World Bank Unnamed
7 Japanese Embassy Akihiko Nakano Senior Officer
8 AsDB Aaron Batten Country Economist
9 Embassy of the Republic of Korea Unnamed
10 British Embassy Anna Pearson Head of Prosperity, Economic and Political Section
11 SECO Marcel Reymond Head of Cooperation
12 Embassy of the Federal Republic of Germany
Luisa Bergfeld First Secretary, Deputy Head of German Development Cooperation
13 Danish Embassy Chu Thi Trung Hau Senior Political and Economic Officer
* For the case study on Sri Lanka, interviewees asked not to publish their names.
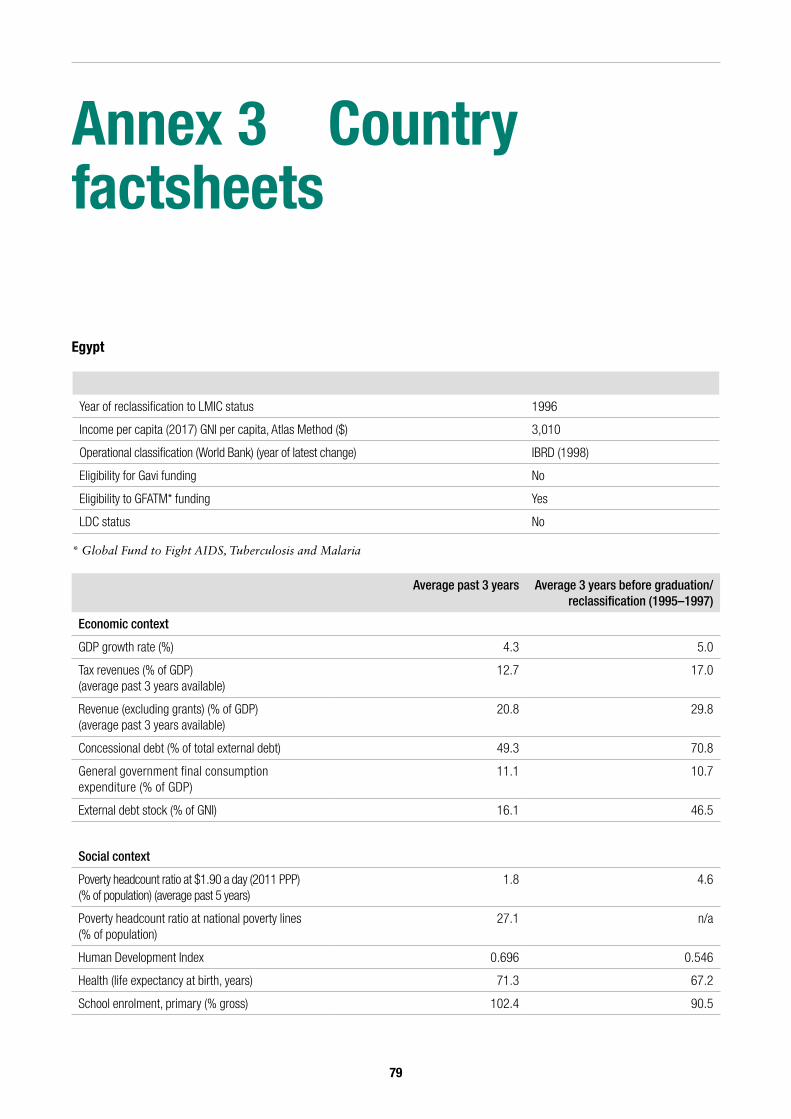
79
Annex 3 Country factsheets
Average past 3 years Average 3 years before graduation/reclassification (1995–1997)
Economic context
GDP growth rate (%) 4.3 5.0
Tax revenues (% of GDP) (average past 3 years available)
12.7 17.0
Revenue (excluding grants) (% of GDP) (average past 3 years available)
20.8 29.8
Concessional debt (% of total external debt) 49.3 70.8
General government final consumption expenditure (% of GDP)
11.1 10.7
External debt stock (% of GNI) 16.1 46.5
Social context
Poverty headcount ratio at $1.90 a day (2011 PPP) (% of population) (average past 5 years)
1.8 4.6
Poverty headcount ratio at national poverty lines (% of population)
27.1 n/a
Human Development Index 0.696 0.546
Health (life expectancy at birth, years) 71.3 67.2
School enrolment, primary (% gross) 102.4 90.5
Year of reclassification to LMIC status 1996
Income per capita (2017) GNI per capita, Atlas Method ($) 3,010
Operational classification (World Bank) (year of latest change) IBRD (1998)
Eligibility for Gavi funding No
Eligibility to GFATM* funding Yes
LDC status No
Egypt
* Global Fund to Fight AIDS, Tuberculosis and Malaria
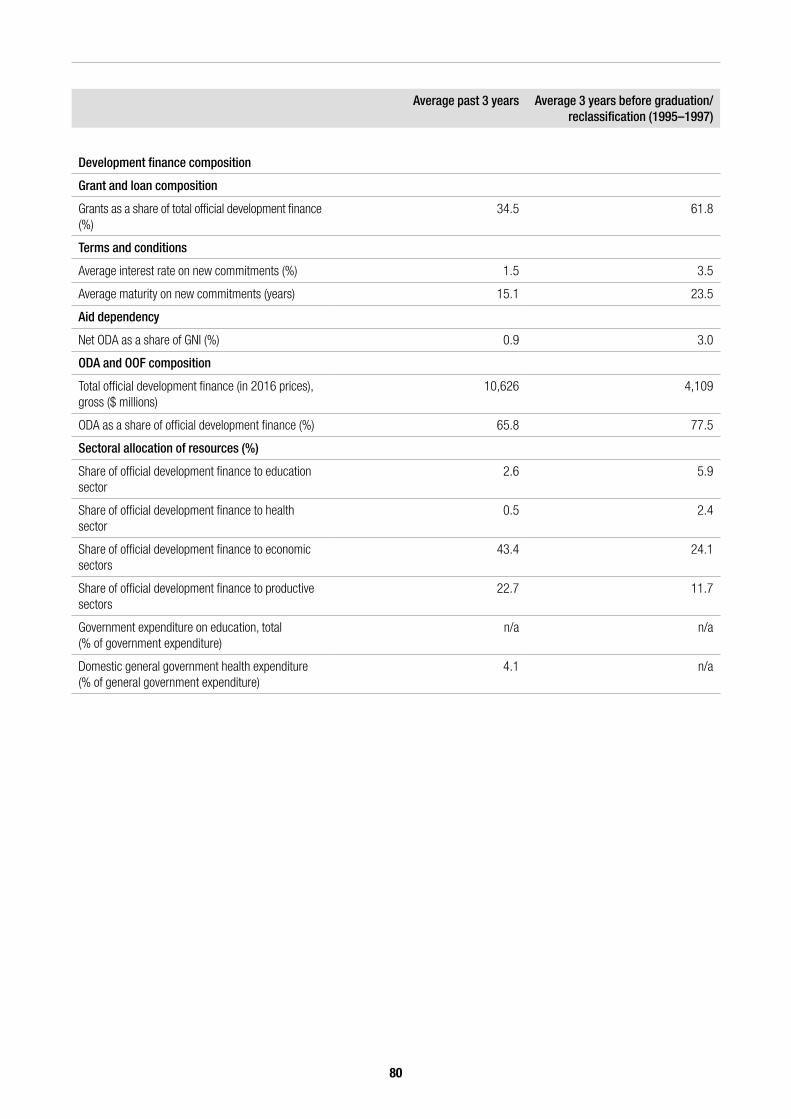
80
Average past 3 years Average 3 years before graduation/reclassification (1995–1997)
Development finance composition
Grant and loan composition
Grants as a share of total official development finance (%)
34.5 61.8
Terms and conditions
Average interest rate on new commitments (%) 1.5 3.5
Average maturity on new commitments (years) 15.1 23.5
Aid dependency
Net ODA as a share of GNI (%) 0.9 3.0
ODA and OOF composition
Total official development finance (in 2016 prices), gross ($ millions)
10,626 4,109
ODA as a share of official development finance (%) 65.8 77.5
Sectoral allocation of resources (%)
Share of official development finance to education sector
2.6 5.9
Share of official development finance to health sector
0.5 2.4
Share of official development finance to economic sectors
43.4 24.1
Share of official development finance to productive sectors
22.7 11.7
Government expenditure on education, total (% of government expenditure)
n/a n/a
Domestic general government health expenditure (% of general government expenditure)
4.1 n/a
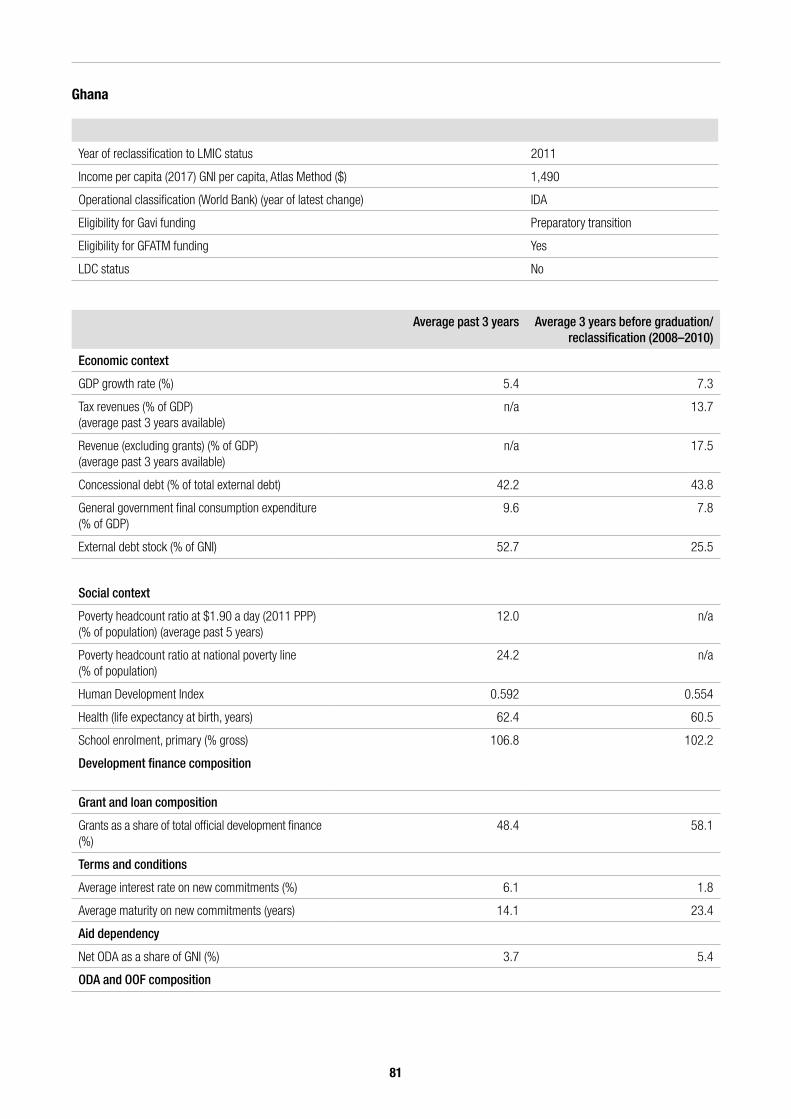
81
Average past 3 years Average 3 years before graduation/reclassification (2008–2010)
Economic context
GDP growth rate (%) 5.4 7.3
Tax revenues (% of GDP) (average past 3 years available)
n/a 13.7
Revenue (excluding grants) (% of GDP) (average past 3 years available)
n/a 17.5
Concessional debt (% of total external debt) 42.2 43.8
General government final consumption expenditure (% of GDP)
9.6 7.8
External debt stock (% of GNI) 52.7 25.5
Social context
Poverty headcount ratio at $1.90 a day (2011 PPP) (% of population) (average past 5 years)
12.0 n/a
Poverty headcount ratio at national poverty line (% of population)
24.2 n/a
Human Development Index 0.592 0.554
Health (life expectancy at birth, years) 62.4 60.5
School enrolment, primary (% gross) 106.8 102.2
Development finance composition
Grant and loan composition
Grants as a share of total official development finance (%)
48.4 58.1
Terms and conditions
Average interest rate on new commitments (%) 6.1 1.8
Average maturity on new commitments (years) 14.1 23.4
Aid dependency
Net ODA as a share of GNI (%) 3.7 5.4
ODA and OOF composition
Ghana
Year of reclassification to LMIC status 2011
Income per capita (2017) GNI per capita, Atlas Method ($) 1,490
Operational classification (World Bank) (year of latest change) IDA
Eligibility for Gavi funding Preparatory transition
Eligibility for GFATM funding Yes
LDC status No
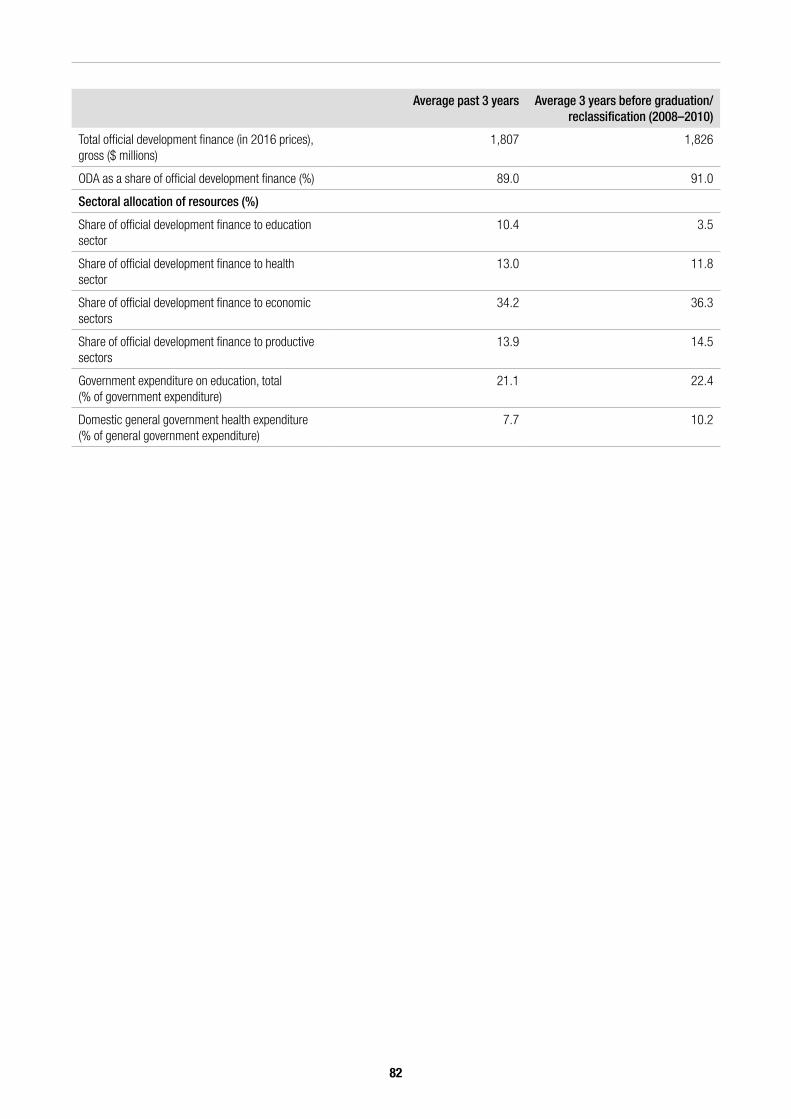
82
Average past 3 years Average 3 years before graduation/reclassification (2008–2010)
Total official development finance (in 2016 prices), gross ($ millions)
1,807 1,826
ODA as a share of official development finance (%) 89.0 91.0
Sectoral allocation of resources (%)
Share of official development finance to education sector
10.4 3.5
Share of official development finance to health sector
13.0 11.8
Share of official development finance to economic sectors
34.2 36.3
Share of official development finance to productive sectors
13.9 14.5
Government expenditure on education, total (% of government expenditure)
21.1 22.4
Domestic general government health expenditure (% of general government expenditure)
7.7 10.2
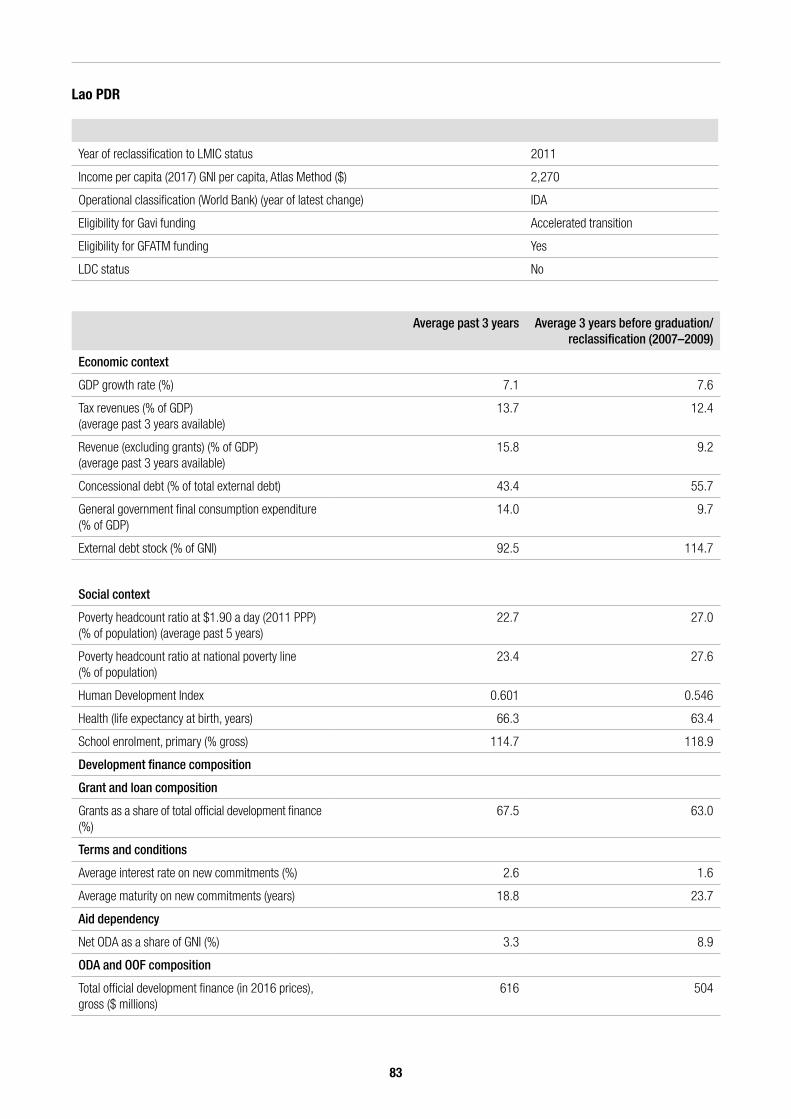
83
Average past 3 years Average 3 years before graduation/reclassification (2007–2009)
Economic context
GDP growth rate (%) 7.1 7.6
Tax revenues (% of GDP) (average past 3 years available)
13.7 12.4
Revenue (excluding grants) (% of GDP) (average past 3 years available)
15.8 9.2
Concessional debt (% of total external debt) 43.4 55.7
General government final consumption expenditure (% of GDP)
14.0 9.7
External debt stock (% of GNI) 92.5 114.7
Social context
Poverty headcount ratio at $1.90 a day (2011 PPP) (% of population) (average past 5 years)
22.7 27.0
Poverty headcount ratio at national poverty line (% of population)
23.4 27.6
Human Development Index 0.601 0.546
Health (life expectancy at birth, years) 66.3 63.4
School enrolment, primary (% gross) 114.7 118.9
Development finance composition
Grant and loan composition
Grants as a share of total official development finance (%)
67.5 63.0
Terms and conditions
Average interest rate on new commitments (%) 2.6 1.6
Average maturity on new commitments (years) 18.8 23.7
Aid dependency
Net ODA as a share of GNI (%) 3.3 8.9
ODA and OOF composition
Total official development finance (in 2016 prices), gross ($ millions)
616 504
Lao PDR
Year of reclassification to LMIC status 2011
Income per capita (2017) GNI per capita, Atlas Method ($) 2,270
Operational classification (World Bank) (year of latest change) IDA
Eligibility for Gavi funding Accelerated transition
Eligibility for GFATM funding Yes
LDC status No

84
Average past 3 years Average 3 years before graduation/reclassification (2007–2009)
ODA as a share of official development finance (%) 87.1 93.2
Sectoral allocation of resources (%)
Share of official development finance to education sector
12.7 10.0
Share of official development finance to health sector
12.3 9.4
Share of official development finance to economic sectors
25.2 23.1
Share of official development finance to productive sectors
14.5 20.1
Government expenditure on education, total (% of government expenditure)
12.5 13.2
Domestic general government health expenditure (% of general government expenditure)
3.1 4.6

85
Nigeria
Year of reclassification to LMIC status 2009
Income per capita (2017) GNI per capita, Atlas Method ($) 2,080
Operational classification (World Bank) (year of latest change) Blend
Eligibility for Gavi funding Accelerated transition
Eligibility for GFATM funding Yes
LDC status No
Average past 3 years Average 3 years before graduation/reclassification (2006–2008)
Economic context
GDP growth rate (%) 0.6 7.1
Tax revenues (% of GDP) (average past 3 years available)
1.5 3.9
Revenue (excluding grants) (% of GDP) (average past 3 years available)
5.0 11.5
Concessional debt (% of total external debt) 31.3 21.6
General government final consumption expenditure (% of GDP)
5.7 9.6
External debt stock (% of GNI) 6.2 7.2
Social context
Poverty headcount ratio at $1.90 a day (2011 PPP) (% of population) (average past 5 years)
n/a n/a
Poverty headcount ratio at national poverty line (% of population)
n/a n/a
Human Development Index 0.532 0.484
Health (life expectancy at birth, years) 53.0 49.3
School enrolment, primary (% gross) n/a 93.1
Development finance composition
Grant and loan composition
Grants as a share of total official development finance (%)
62.2 -248.8
Terms and conditions
Average interest rate on new commitments (%) 1.3 1.1
Average maturity on new commitments (years) 22.6 36.6
Aid dependency
Net ODA as a share of GNI (%) 0.5 3.4
ODA and OOF composition
Total official development finance (in 2016 prices), gross ($ millions)
3058.7 6109.4

86
Average past 3 years Average 3 years before graduation/reclassification (2006–2008)
ODA as a share of official development finance (%) 100.7 -237.7
Sectoral allocation of resources (%)
Share of official development finance to education sector
5.3 10.5
Share of official development finance to health sector
18.5 19.4
Share of official development finance to economic sectors
28.7 13.6
Share of official development finance to productive sectors
9.8 8.6
Government expenditure on education, total (% of government expenditure)
0.5 3.4
Domestic general government health expenditure (% of general government expenditure)
4.1 5.4
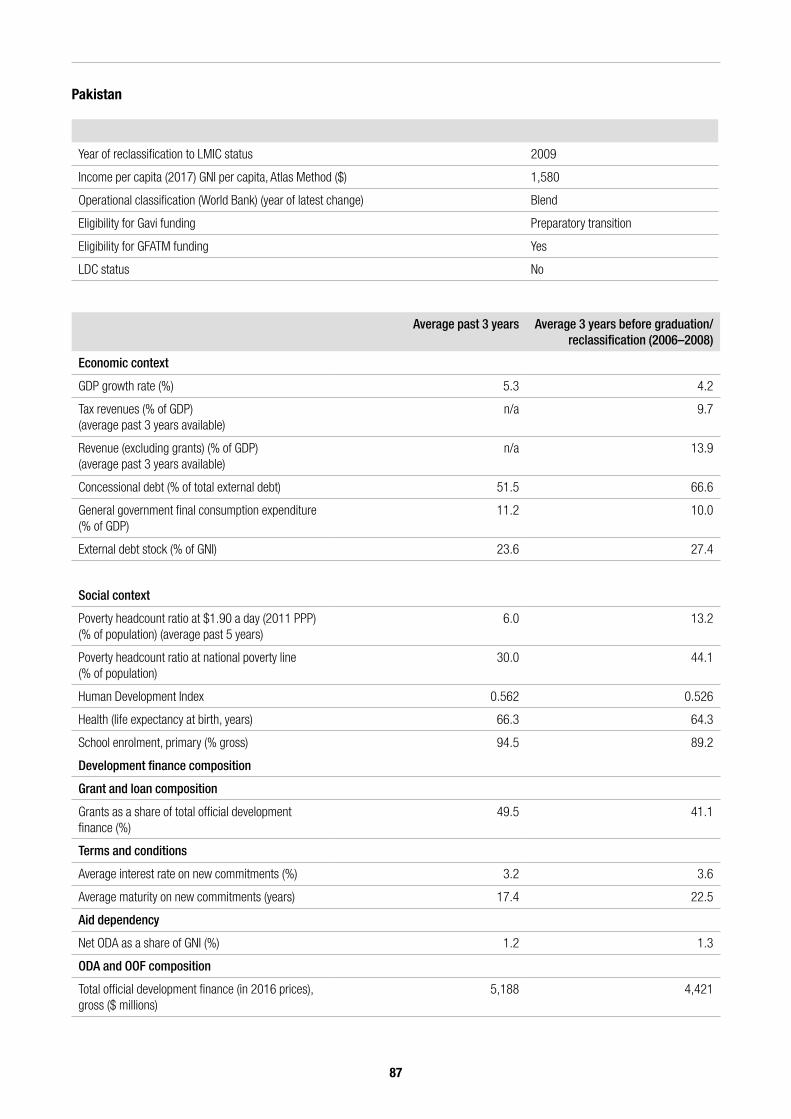
87
Average past 3 years Average 3 years before graduation/reclassification (2006–2008)
Economic context
GDP growth rate (%) 5.3 4.2
Tax revenues (% of GDP) (average past 3 years available)
n/a 9.7
Revenue (excluding grants) (% of GDP) (average past 3 years available)
n/a 13.9
Concessional debt (% of total external debt) 51.5 66.6
General government final consumption expenditure (% of GDP)
11.2 10.0
External debt stock (% of GNI) 23.6 27.4
Social context
Poverty headcount ratio at $1.90 a day (2011 PPP) (% of population) (average past 5 years)
6.0 13.2
Poverty headcount ratio at national poverty line (% of population)
30.0 44.1
Human Development Index 0.562 0.526
Health (life expectancy at birth, years) 66.3 64.3
School enrolment, primary (% gross) 94.5 89.2
Development finance composition
Grant and loan composition
Grants as a share of total official development finance (%)
49.5 41.1
Terms and conditions
Average interest rate on new commitments (%) 3.2 3.6
Average maturity on new commitments (years) 17.4 22.5
Aid dependency
Net ODA as a share of GNI (%) 1.2 1.3
ODA and OOF composition
Total official development finance (in 2016 prices), gross ($ millions)
5,188 4,421
Pakistan
Year of reclassification to LMIC status 2009
Income per capita (2017) GNI per capita, Atlas Method ($) 1,580
Operational classification (World Bank) (year of latest change) Blend
Eligibility for Gavi funding Preparatory transition
Eligibility for GFATM funding Yes
LDC status No

88
Average past 3 years Average 3 years before graduation/reclassification (2006–2008)
ODA as a share of official development finance (%) 97.2 81.3
Sectoral allocation of resources (%)
Share of official development finance to education sector
7.8 9.3
Share of official development finance to health sector
4.8 7.1
Share of official development finance to economic sectors
51.3 36.1
Share of official development finance to productive sectors
12.7 7.9
Government expenditure on education, total (% of government expenditure)
12.0 14.9
Domestic general government health expenditure (% of general government expenditure)
3.5 3.0
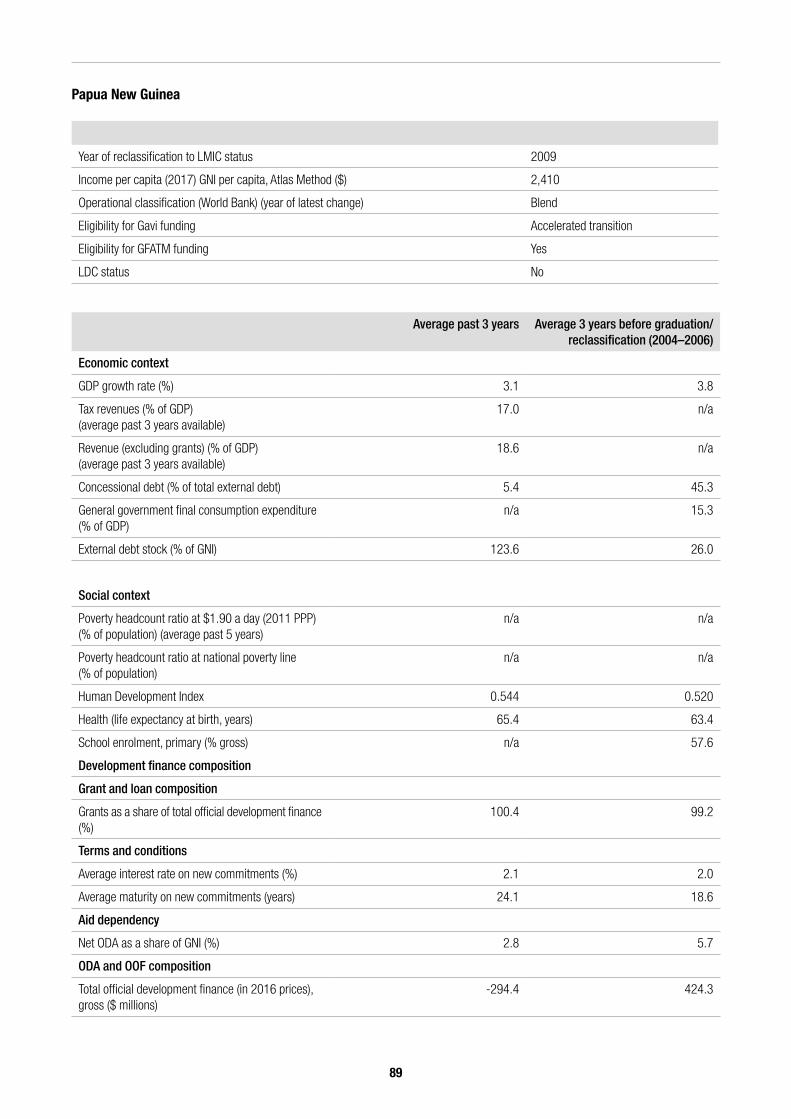
89
Average past 3 years Average 3 years before graduation/reclassification (2004–2006)
Economic context
GDP growth rate (%) 3.1 3.8
Tax revenues (% of GDP) (average past 3 years available)
17.0 n/a
Revenue (excluding grants) (% of GDP) (average past 3 years available)
18.6 n/a
Concessional debt (% of total external debt) 5.4 45.3
General government final consumption expenditure (% of GDP)
n/a 15.3
External debt stock (% of GNI) 123.6 26.0
Social context
Poverty headcount ratio at $1.90 a day (2011 PPP) (% of population) (average past 5 years)
n/a n/a
Poverty headcount ratio at national poverty line (% of population)
n/a n/a
Human Development Index 0.544 0.520
Health (life expectancy at birth, years) 65.4 63.4
School enrolment, primary (% gross) n/a 57.6
Development finance composition
Grant and loan composition
Grants as a share of total official development finance (%)
100.4 99.2
Terms and conditions
Average interest rate on new commitments (%) 2.1 2.0
Average maturity on new commitments (years) 24.1 18.6
Aid dependency
Net ODA as a share of GNI (%) 2.8 5.7
ODA and OOF composition
Total official development finance (in 2016 prices), gross ($ millions)
-294.4 424.3
Papua New Guinea
Year of reclassification to LMIC status 2009
Income per capita (2017) GNI per capita, Atlas Method ($) 2,410
Operational classification (World Bank) (year of latest change) Blend
Eligibility for Gavi funding Accelerated transition
Eligibility for GFATM funding Yes
LDC status No

90
Average past 3 years Average 3 years before graduation/reclassification (2004–2006)
ODA as a share of official development finance (%) 122.2 102.6
Sectoral allocation of resources (%)
Share of official development finance to education sector
5.4 10.0
Share of official development finance to health sector
5.7 9.6
Share of official development finance to economic sectors
40.7 24.8
Share of official development finance to productive sectors
4.6 4.6
Government expenditure on education, total (% of government expenditure)
n/a n/a
Domestic general government health expenditure (% of general government expenditure)
9.1 8.3

91
Year of reclassification to LMIC status 1998
Income per capita (2017) GNI per capita, Atlas Method ($) 3,840
Operational classification (World Bank) (year of latest change) IBRD (2017)
Eligibility for Gavi funding Fully self-financing
Eligibility for GFATM funding Yes
LDC status No
Sri Lanka
Average past 3 years Average 3 years before graduation/reclassification (1996–1997)
Economic context
GDP growth rate (%) 4.2 5.2
Tax revenues (% of GDP) (average past 3 years available)
11.0 16.9
Revenue (excluding grants) (% of GDP) (average past 3 years available)
12.2 19.3
Concessional debt (% of total external debt) 34.0 75.2
General government final consumption expenditure (% of GDP)
8.7 10.8
External debt stock (% of GNI) 56.3 60.1
Social context
Poverty headcount ratio at $1.90 a day (2011 PPP) (% of population) (average past 5 years)
1.3 8.8
Poverty headcount ratio at national poverty line (% of population)
5.4 n/a
Human Development Index 0.770 0.685
Health (life expectancy at birth, years) 75.1 69.3
School enrolment, primary (% gross) 101.6 109.0
Development finance composition
Grant and loan composition
Grants as a share of total official development finance (%)
26.6 39.9
Terms and conditions
Average interest rate on new commitments (%) 3.6 3.6
Average maturity on new commitments (years) 16.1 25.2
Aid dependency
Net ODA as a share of GNI (%) 0.5 3.4
ODA and OOF composition
Total official development finance (in 2016 prices), gross ($ millions)
1,308 812

92
Average past 3 years Average 3 years before graduation/reclassification (1996–1997)
ODA as a share of official development finance (%) 92.7 101.7
Sectoral allocation of resources (%)
Share of official development finance to education sector
6.1 10.3
Share of official development finance to health sector
0.9 2.1
Share of official development finance to economic sectors
54.4 44.9
Share of official development finance to productive sectors
7.6 18.5
Government expenditure on education, total (% of government expenditure)
10.4 12.1
Domestic general government health expenditure (% of general government expenditure)
8.7 n/a

93
Viet Nam
Year of reclassification to LMIC status 2009
Income per capita (2017) GNI per capita, Atlas Method ($) 2,170
Operational classification (World Bank) (year of latest change) IBRD (2017)
Eligibility for Gavi funding Accelerated transition
Eligibility for GFATM funding Yes
LDC status No
Average past 3 years Average 3 years before graduation/reclassification (2006–2008)
Economic context
GDP growth rate (%) 6.6 6.6
Tax revenues (% of GDP) (average past 3 years available)
19.1 22.0
Revenue (excluding grants) (% of GDP) (average past 3 years available)
21.5 23.8
Concessional debt (% of total external debt) 42.1 70.1
General government final consumption expenditure (% of GDP)
6.4 5.6
External debt stock (% of GNI) 42.9 29.0
Social context
Poverty headcount ratio at $1.90 a day (2011 PPP) (% of population) (average past 5 years)
2.5 17.2
Poverty headcount ratio at national poverty line (% of population)
13.5 n/a
Human Development Index 0.694 0.654
Health (life expectancy at birth, years) 76.1 74.6
School enrolment, primary (% gross) 109.3 99.2
Development finance composition
Grant and loan composition
Grants as a share of total official development finance (%)
14.7 31.6
Terms and conditions
Average interest rate on new commitments (%) 1.4 2.8
Average maturity on new commitments (years) 19.5 25.0
Aid dependency
Net ODA as a share of GNI (%) 1.9 2.9
ODA and OOF composition
Total official development finance (in 2016 prices), gross ($ millions)
7,326 3,410
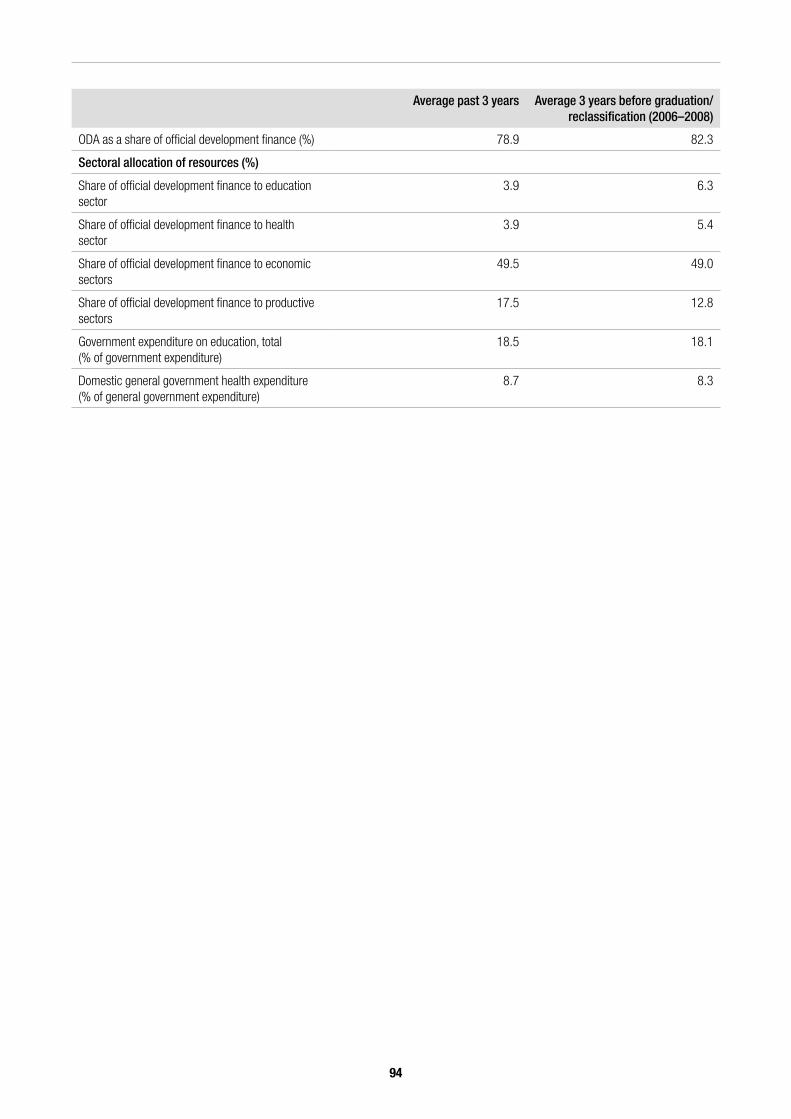
94
Average past 3 years Average 3 years before graduation/reclassification (2006–2008)
ODA as a share of official development finance (%) 78.9 82.3
Sectoral allocation of resources (%)
Share of official development finance to education sector
3.9 6.3
Share of official development finance to health sector
3.9 5.4
Share of official development finance to economic sectors
49.5 49.0
Share of official development finance to productive sectors
17.5 12.8
Government expenditure on education, total (% of government expenditure)
18.5 18.1
Domestic general government health expenditure(% of general government expenditure)
8.7 8.3

Evidence.Ideas.Change.
ODI203 Blackfriars RoadLondon SE1 8NJ
+44 (0)20 7922 [email protected]
odi.orgodi.org/facebookodi.org/twitter
ODI is an independent, global think tank, working for a sustainable and peaceful world in which every person thrives. We harness the power of evidence and ideas through research and partnership to confront challenges, develop solutions, and create change.