Embed Size (px)
Citation preview
Existing problems in theoretical determination of red-shifted
or blue-shifted hydrogen bond
Ping Lua, Guo-Qun Liub,*, Ji-Chao Lic
aSchool of Chemistry and Chemical Engineering, Jinan University, Jinan 250022, ChinabNew Material Research Institute, Shandong Academy of Sciences, Keyuan Road 19, Jinan 250014, China
cSchool of Physics and Microelectronics, Shandong University, Jinan 250100, China
Received 20 October 2004; accepted 20 January 2005
Available online 2 April 2005
Abstract
Both Hobza (Int. J. Quantum Chem., 90 (2002) 1071) and Li et al. (J. Am. Chem. Soc., 124 (2002) 9639) have predicted a blue-
shifted or improper N–H/F hydrogen bond existing in the F2N–H/FH complex with the method of Hartree–Fock calculation
followed by Møller–Plesset correlation energy correction truncated at second order (MP2/6-31G** and MP2/6-311CG**,
respectively). Unexpectedly, our density functional calculation (B3LYP) has predicted a red-shifted or normal N–H/F hydrogen
bond in this complex whether the counterpoise-corrected gradient optimization and frequency calculation is applied or not. Changing
the basis set from 6-311CG(d,p) to 6-311CCG(3df,3pd) does not change the red-shifted hydrogen bond prediction. Experimental
identification should be provided for evaluating relative performance of these two theoretical methods in predicting correct hydrogen
bond stretching vibration frequency shift upon complex formation. X–H bond length change and its vibrational frequency change do
not necessarily have monotonic corresponding relationship, i.e. blue-shift does not necessarily mean X–H bond length contraction, and
vice versa. Much more attention or consideration should be paid in theoretical hydrogen bond type prediction such as red-shifted or
blue-shifted.
q 2005 Elsevier B.V. All rights reserved.
Keywords: Hydrogen bond; Red-shift and blue-shift; MP2 and B3LYP; F2N–H/FH complex
1. Introduction
Theoretical computation plays an increasingly important
role in the determination of red-shifted or blue-shifted
hydrogen bonds (H-bonds) [1–5]. Generally, H-bond has the
form of X–H/Y, where X is an electronegative atom and Y
is either an electronegative atom or p-electrons of aromatic
systems. Red-shifted H-bond formation leads to decrease of
the X–H stretching vibrational frequency and usually to
X–H bond length elongation while blue-shifted H-bond
formation leads to increase of X–H vibrational frequency
and usually to X–H bond length contraction [6,7]. Thus it is
0166-1280/$ - see front matter q 2005 Elsevier B.V. All rights reserved.
doi:10.1016/j.theochem.2005.01.034
* Corresponding author. Tel.: C86 5312605935; fax: C86 5312962527.
E-mail addresses: [email protected] (G.-Q. Liu), [email protected].
edu.cn (G.-Q. Liu).
easy to predict the H-bond type by calculating and
comparing X–H bond length and vibrational frequency of
the H-bonded system with those of the monomer or non-H-
bonded system. Many theoretical methods, such as MP2 and
B3LYP, can implement this prediction and their perform-
ance is decided by whether the predicted results are in
accord with the experimental measurement or not.
Up to now, there is no contradictory hydrogen bond type
prediction reported between MP2 and B3LYP calculations.
Alabugin et al. have compared the results obtained by
MP2(FC)/6-31CG* calculation with those obtained by
B3LYP/6-311CG** computation and concluded that ‘the
B3LYP results parallel the MP2 data quite closely’ in
studying C–H/Y hydrogen bond formed by F3C–H and
other related molecules [5]. Both MP2 and B3LYP
computation have their own supporting instances from the
point of agreement between theoretical prediction and
experimental measurement. MP2/6-31G* counterpoise
(CP)-corrected gradient optimization, harmonic and
Journal of Molecular Structure: THEOCHEM 723 (2005) 95–100
www.elsevier.com/locate/theochem
P. Lu et al. / Journal of Molecular Structure: THEOCHEM 723 (2005) 95–10096
anharmonic vibrational analysis is in accord with the
double-resonance infrared ion-depletion spectroscopy in
identification of the C–H/p improper hydrogen bond
formed by Cl3C–H and fluorobenzene with the blue-shift
being 12 (theoretical) and 14 (experimental) cmK1,
respectively [8]. On the other hand, Matsuura et al. have
evidenced an intramolecular C–H/O improper hydrogen
bond in the TG(TjG 0) conformer of 1-methoxy-2-(dimethyl-
amino)ethane with the aid of matrix-isolation infrared
spectroscopy and density functional calculation (B3LYP/
6-311CG**) [1]. In this paper, we will report the first
occurrence of disagreement between MP2 and B3LYP
calculation in predicting hydrogen bond type of the
F2N–H/FH complex.
Li et al. have drawn three plots of the X–H vibrational
frequency against the X–H bond length, which gives straight
lines with high correlation coefficients (0.9900–0.9991), and
concluded that ‘blue-shift means X–H contraction, and vice
versa’ [4]. Alabugin et al. have predicted the normal or
improper H-bonds based on elongation or contraction of the
X–H bond length, which obviously follows Li et al.’s
conclusion [5]. However, as a matter of fact, in the complex
of F2N–H/FH, Li et al. have identified the improper
H-bond based on the vibrational frequency change but not
the N–H bond length change between the monomer and the
complex. In this paper, we will discuss the relationship
between X–H bond length change and X–H vibrational
frequency change so that we can choose a more rigid and
credible criterion to identify the H-bond type.
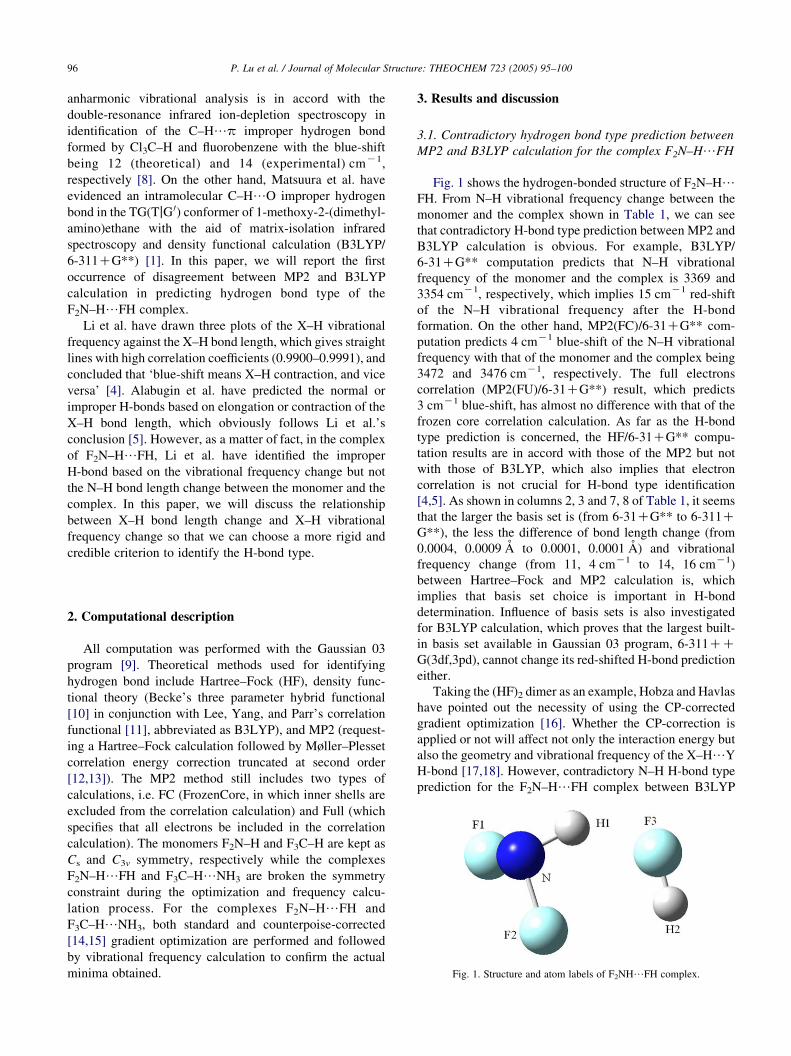
Fig. 1. Structure and atom labels of F2NH/FH complex.
2. Computational description
All computation was performed with the Gaussian 03
program [9]. Theoretical methods used for identifying
hydrogen bond include Hartree–Fock (HF), density func-
tional theory (Becke’s three parameter hybrid functional
[10] in conjunction with Lee, Yang, and Parr’s correlation
functional [11], abbreviated as B3LYP), and MP2 (request-
ing a Hartree–Fock calculation followed by Møller–Plesset
correlation energy correction truncated at second order
[12,13]). The MP2 method still includes two types of
calculations, i.e. FC (FrozenCore, in which inner shells are
excluded from the correlation calculation) and Full (which
specifies that all electrons be included in the correlation
calculation). The monomers F2N–H and F3C–H are kept as
Cs and C3v symmetry, respectively while the complexes
F2N–H/FH and F3C–H/NH3 are broken the symmetry
constraint during the optimization and frequency calcu-
lation process. For the complexes F2N–H/FH and
F3C–H/NH3, both standard and counterpoise-corrected
[14,15] gradient optimization are performed and followed
by vibrational frequency calculation to confirm the actual
minima obtained.
3. Results and discussion
3.1. Contradictory hydrogen bond type prediction between
MP2 and B3LYP calculation for the complex F2N–H/FH
Fig. 1 shows the hydrogen-bonded structure of F2N–H/FH. From N–H vibrational frequency change between the
monomer and the complex shown in Table 1, we can see
that contradictory H-bond type prediction between MP2 and
B3LYP calculation is obvious. For example, B3LYP/
6-31CG** computation predicts that N–H vibrational
frequency of the monomer and the complex is 3369 and
3354 cmK1, respectively, which implies 15 cmK1 red-shift
of the N–H vibrational frequency after the H-bond
formation. On the other hand, MP2(FC)/6-31CG** com-
putation predicts 4 cmK1 blue-shift of the N–H vibrational
frequency with that of the monomer and the complex being
3472 and 3476 cmK1, respectively. The full electrons
correlation (MP2(FU)/6-31CG**) result, which predicts
3 cmK1 blue-shift, has almost no difference with that of the
frozen core correlation calculation. As far as the H-bond
type prediction is concerned, the HF/6-31CG** compu-
tation results are in accord with those of the MP2 but not
with those of B3LYP, which also implies that electron
correlation is not crucial for H-bond type identification
[4,5]. As shown in columns 2, 3 and 7, 8 of Table 1, it seems
that the larger the basis set is (from 6-31CG** to 6-311CG**), the less the difference of bond length change (from
0.0004, 0.0009 A to 0.0001, 0.0001 A) and vibrational
frequency change (from 11, 4 cmK1 to 14, 16 cmK1)
between Hartree–Fock and MP2 calculation is, which
implies that basis set choice is important in H-bond
determination. Influence of basis sets is also investigated
for B3LYP calculation, which proves that the largest built-
in basis set available in Gaussian 03 program, 6-311CCG(3df,3pd), cannot change its red-shifted H-bond prediction
either.
Taking the (HF)2 dimer as an example, Hobza and Havlas
have pointed out the necessity of using the CP-corrected
gradient optimization [16]. Whether the CP-correction is
applied or not will affect not only the interaction energy but
also the geometry and vibrational frequency of the X–H/Y
H-bond [17,18]. However, contradictory N–H H-bond type
prediction for the F2N–H/FH complex between B3LYP
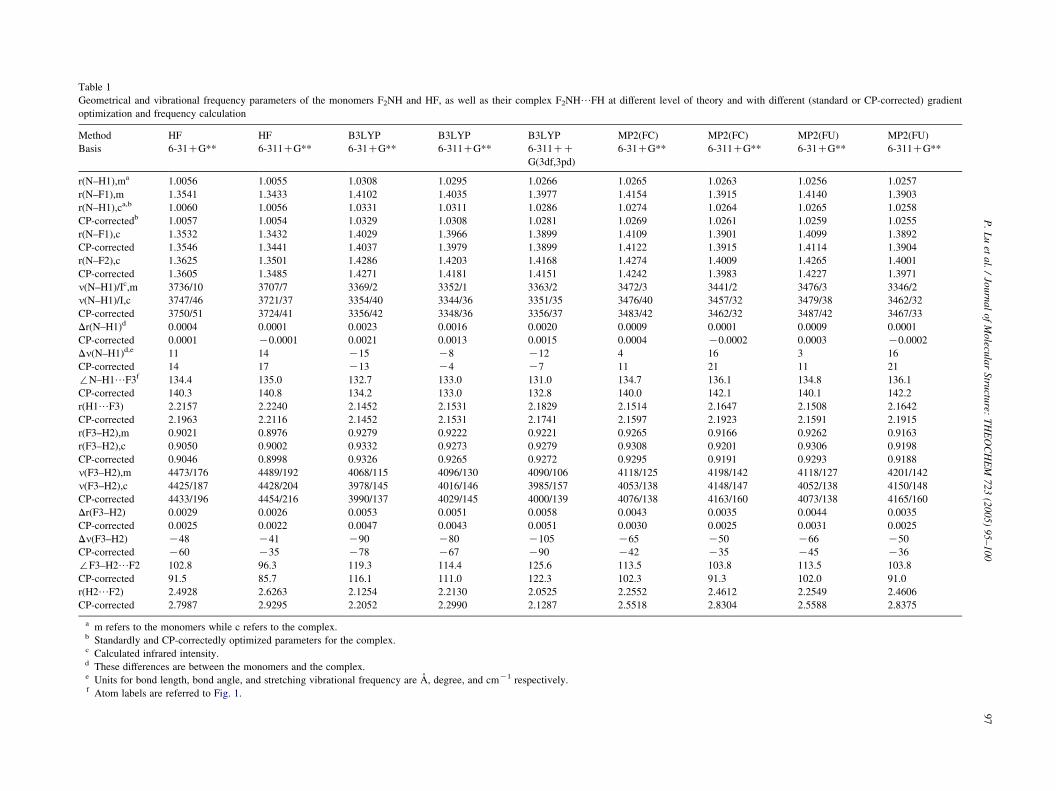
Table 1
Geometrical and vibrational frequency parameters of the monomers F2NH and HF, as well as their complex F2NH/FH at different level of theory and with different (standard or CP-corrected) gradient
optimization and frequency calculation
Method HF HF B3LYP B3LYP B3LYP MP2(FC) MP2(FC) MP2(FU) MP2(FU)
Basis 6-31CG** 6-311CG** 6-31CG** 6-311CG** 6-311CC
G(3df,3pd)
6-31CG** 6-311CG** 6-31CG** 6-311CG**
r(N–H1),ma 1.0056 1.0055 1.0308 1.0295 1.0266 1.0265 1.0263 1.0256 1.0257
r(N–F1),m 1.3541 1.3433 1.4102 1.4035 1.3977 1.4154 1.3915 1.4140 1.3903
r(N–H1),ca,b 1.0060 1.0056 1.0331 1.0311 1.0286 1.0274 1.0264 1.0265 1.0258
CP-correctedb 1.0057 1.0054 1.0329 1.0308 1.0281 1.0269 1.0261 1.0259 1.0255
r(N–F1),c 1.3532 1.3432 1.4029 1.3966 1.3899 1.4109 1.3901 1.4099 1.3892
CP-corrected 1.3546 1.3441 1.4037 1.3979 1.3899 1.4122 1.3915 1.4114 1.3904
r(N–F2),c 1.3625 1.3501 1.4286 1.4203 1.4168 1.4274 1.4009 1.4265 1.4001
CP-corrected 1.3605 1.3485 1.4271 1.4181 1.4151 1.4242 1.3983 1.4227 1.3971
n(N–H1)/Ic,m 3736/10 3707/7 3369/2 3352/1 3363/2 3472/3 3441/2 3476/3 3346/2
n(N–H1)/I,c 3747/46 3721/37 3354/40 3344/36 3351/35 3476/40 3457/32 3479/38 3462/32
CP-corrected 3750/51 3724/41 3356/42 3348/36 3356/37 3483/42 3462/32 3487/42 3467/33
Dr(N–H1)d 0.0004 0.0001 0.0023 0.0016 0.0020 0.0009 0.0001 0.0009 0.0001
CP-corrected 0.0001 K0.0001 0.0021 0.0013 0.0015 0.0004 K0.0002 0.0003 K0.0002
Dn(N–H1)d,e 11 14 K15 K8 K12 4 16 3 16
CP-corrected 14 17 K13 K4 K7 11 21 11 21
:N–H1/F3f 134.4 135.0 132.7 133.0 131.0 134.7 136.1 134.8 136.1
CP-corrected 140.3 140.8 134.2 133.0 132.8 140.0 142.1 140.1 142.2
r(H1/F3) 2.2157 2.2240 2.1452 2.1531 2.1829 2.1514 2.1647 2.1508 2.1642
CP-corrected 2.1963 2.2116 2.1452 2.1531 2.1741 2.1597 2.1923 2.1591 2.1915
r(F3–H2),m 0.9021 0.8976 0.9279 0.9222 0.9221 0.9265 0.9166 0.9262 0.9163
r(F3–H2),c 0.9050 0.9002 0.9332 0.9273 0.9279 0.9308 0.9201 0.9306 0.9198
CP-corrected 0.9046 0.8998 0.9326 0.9265 0.9272 0.9295 0.9191 0.9293 0.9188
n(F3–H2),m 4473/176 4489/192 4068/115 4096/130 4090/106 4118/125 4198/142 4118/127 4201/142
n(F3–H2),c 4425/187 4428/204 3978/145 4016/146 3985/157 4053/138 4148/147 4052/138 4150/148
CP-corrected 4433/196 4454/216 3990/137 4029/145 4000/139 4076/138 4163/160 4073/138 4165/160
Dr(F3–H2) 0.0029 0.0026 0.0053 0.0051 0.0058 0.0043 0.0035 0.0044 0.0035
CP-corrected 0.0025 0.0022 0.0047 0.0043 0.0051 0.0030 0.0025 0.0031 0.0025
Dn(F3–H2) K48 K41 K90 K80 K105 K65 K50 K66 K50
CP-corrected K60 K35 K78 K67 K90 K42 K35 K45 K36
:F3–H2/F2 102.8 96.3 119.3 114.4 125.6 113.5 103.8 113.5 103.8
CP-corrected 91.5 85.7 116.1 111.0 122.3 102.3 91.3 102.0 91.0
r(H2/F2) 2.4928 2.6263 2.1254 2.2130 2.0525 2.2552 2.4612 2.2549 2.4606
CP-corrected 2.7987 2.9295 2.2052 2.2990 2.1287 2.5518 2.8304 2.5588 2.8375
a m refers to the monomers while c refers to the complex.b Standardly and CP-correctedly optimized parameters for the complex.c Calculated infrared intensity.d These differences are between the monomers and the complex.e Units for bond length, bond angle, and stretching vibrational frequency are A, degree, and cmK1 respectively.f Atom labels are referred to Fig. 1.
P.
Lu
eta
l./
Jou
rna
lo
fM
olecu
lar
Stru
cture:
TH
EO
CH
EM
72
3(2
00
5)
95
–1
00
97
P. Lu et al. / Journal of Molecular Structure: THEOCHEM 723 (2005) 95–10098
and MP2 calculation still exists, as shown in Table 1, in spite
of application of the CP-correction. Consequently, this
contradictory prediction cannot originate from the effect of
basis set superposition error. On the other hand, the
introduction of CP-correction makes vibrational frequency
difference between the monomer and the complex become
smaller for the B3LYP calculation but larger for the MP2
calculation.
As shown in Fig. 1 and Table 1, there probably exists
another red-shifted F3–H2/F2 H-bond [19]. Relative to the
N–H1/F3 H-bond, its vibrational frequency difference
between the monomer and the complex is very large at all
kinds of theoretical levels. This large difference is partly due
to the F3–H2 bond weakening brought on by the N–H1/F3
H-bond formation [4,5]. Another origin will be the formation
of the H-bond F3–H2/F2, which is reflected by the bond
length difference between N–F1 and N–F2 shown in Table 1.
Thus the question appears naturally that whether the
contradictory prediction is brought on by the double
H-bond system or not since the complex is formed by two
weakly-interacted independent molecules? This is also not
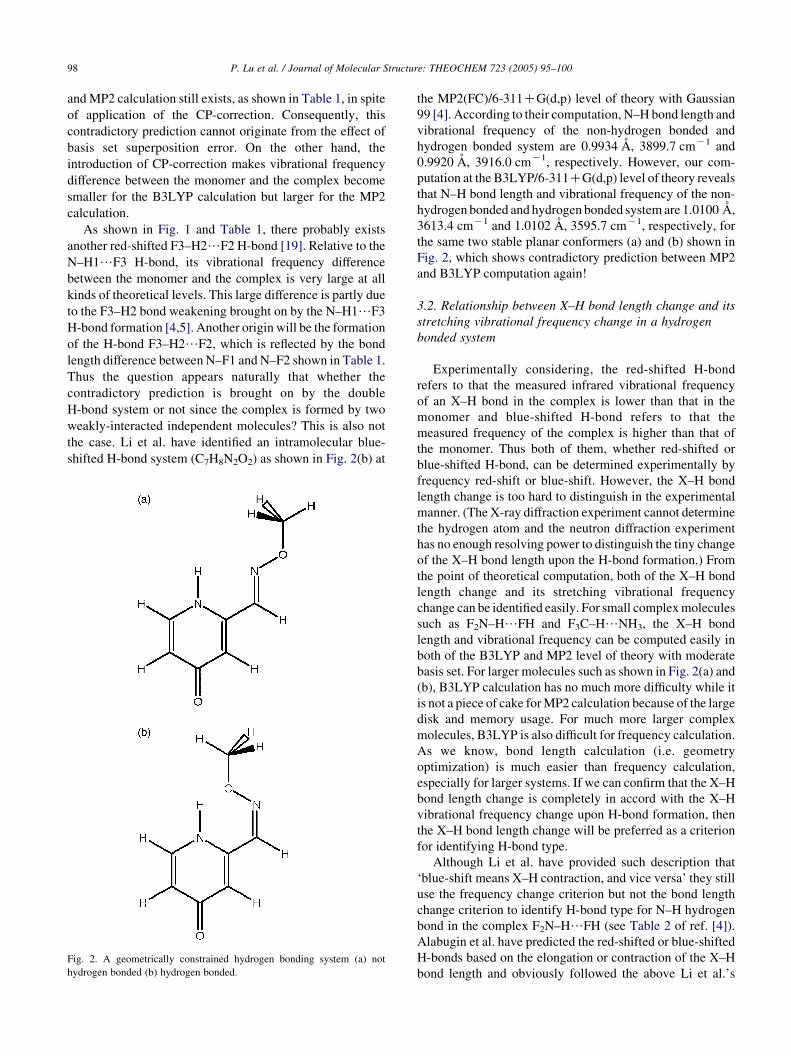
the case. Li et al. have identified an intramolecular blue-
shifted H-bond system (C7H8N2O2) as shown in Fig. 2(b) at
Fig. 2. A geometrically constrained hydrogen bonding system (a) not
hydrogen bonded (b) hydrogen bonded.
the MP2(FC)/6-311CG(d,p) level of theory with Gaussian
99 [4]. According to their computation, N–H bond length and
vibrational frequency of the non-hydrogen bonded and
hydrogen bonded system are 0.9934 A, 3899.7 cmK1 and
0.9920 A, 3916.0 cmK1, respectively. However, our com-
putation at the B3LYP/6-311CG(d,p) level of theory reveals
that N–H bond length and vibrational frequency of the non-
hydrogen bonded and hydrogen bonded system are 1.0100 A,
3613.4 cmK1 and 1.0102 A, 3595.7 cmK1, respectively, for
the same two stable planar conformers (a) and (b) shown in
Fig. 2, which shows contradictory prediction between MP2
and B3LYP computation again!
3.2. Relationship between X–H bond length change and its
stretching vibrational frequency change in a hydrogen
bonded system
Experimentally considering, the red-shifted H-bond
refers to that the measured infrared vibrational frequency
of an X–H bond in the complex is lower than that in the
monomer and blue-shifted H-bond refers to that the
measured frequency of the complex is higher than that of
the monomer. Thus both of them, whether red-shifted or
blue-shifted H-bond, can be determined experimentally by
frequency red-shift or blue-shift. However, the X–H bond
length change is too hard to distinguish in the experimental
manner. (The X-ray diffraction experiment cannot determine
the hydrogen atom and the neutron diffraction experiment
has no enough resolving power to distinguish the tiny change
of the X–H bond length upon the H-bond formation.) From
the point of theoretical computation, both of the X–H bond
length change and its stretching vibrational frequency
change can be identified easily. For small complex molecules
such as F2N–H/FH and F3C–H/NH3, the X–H bond
length and vibrational frequency can be computed easily in
both of the B3LYP and MP2 level of theory with moderate
basis set. For larger molecules such as shown in Fig. 2(a) and
(b), B3LYP calculation has no much more difficulty while it
is not a piece of cake for MP2 calculation because of the large
disk and memory usage. For much more larger complex
molecules, B3LYP is also difficult for frequency calculation.
As we know, bond length calculation (i.e. geometry
optimization) is much easier than frequency calculation,
especially for larger systems. If we can confirm that the X–H
bond length change is completely in accord with the X–H
vibrational frequency change upon H-bond formation, then
the X–H bond length change will be preferred as a criterion
for identifying H-bond type.
Although Li et al. have provided such description that
‘blue-shift means X–H contraction, and vice versa’ they still
use the frequency change criterion but not the bond length
change criterion to identify H-bond type for N–H hydrogen
bond in the complex F2N–H/FH (see Table 2 of ref. [4]).
Alabugin et al. have predicted the red-shifted or blue-shifted
H-bonds based on the elongation or contraction of the X–H
bond length and obviously followed the above Li et al.’s
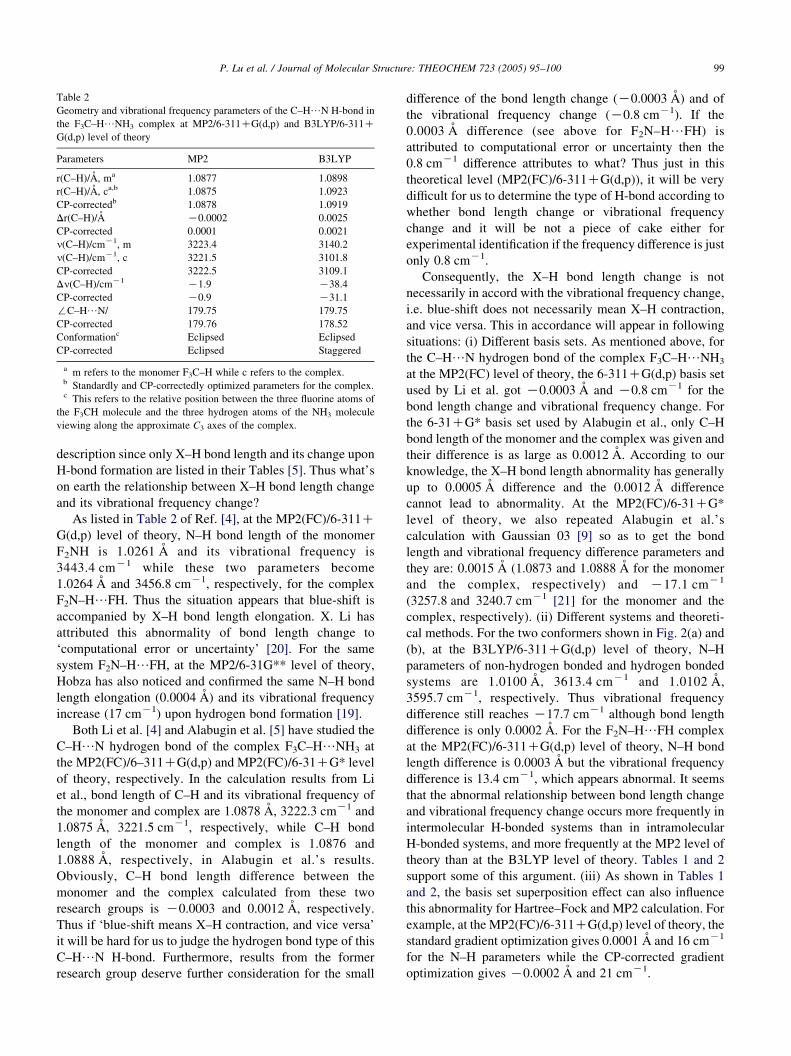
Table 2
Geometry and vibrational frequency parameters of the C–H/N H-bond in
the F3C–H/NH3 complex at MP2/6-311CG(d,p) and B3LYP/6-311C
G(d,p) level of theory
Parameters MP2 B3LYP
r(C–H)/A, ma 1.0877 1.0898
r(C–H)/A, ca,b 1.0875 1.0923
CP-correctedb 1.0878 1.0919
Dr(C–H)/A K0.0002 0.0025
CP-corrected 0.0001 0.0021
n(C–H)/cmK1, m 3223.4 3140.2
n(C–H)/cmK1, c 3221.5 3101.8
CP-corrected 3222.5 3109.1
Dn(C–H)/cmK1 K1.9 K38.4
CP-corrected K0.9 K31.1
:C–H/N/ 179.75 179.75
CP-corrected 179.76 178.52
Conformationc Eclipsed Eclipsed
CP-corrected Eclipsed Staggered
a m refers to the monomer F3C–H while c refers to the complex.b Standardly and CP-correctedly optimized parameters for the complex.c This refers to the relative position between the three fluorine atoms of
the F3CH molecule and the three hydrogen atoms of the NH3 molecule
viewing along the approximate C3 axes of the complex.
P. Lu et al. / Journal of Molecular Structure: THEOCHEM 723 (2005) 95–100 99
description since only X–H bond length and its change upon
H-bond formation are listed in their Tables [5]. Thus what’s
on earth the relationship between X–H bond length change
and its vibrational frequency change?
As listed in Table 2 of Ref. [4], at the MP2(FC)/6-311CG(d,p) level of theory, N–H bond length of the monomer
F2NH is 1.0261 A and its vibrational frequency is
3443.4 cmK1 while these two parameters become
1.0264 A and 3456.8 cmK1, respectively, for the complex
F2N–H/FH. Thus the situation appears that blue-shift is
accompanied by X–H bond length elongation. X. Li has
attributed this abnormality of bond length change to
‘computational error or uncertainty’ [20]. For the same
system F2N–H/FH, at the MP2/6-31G** level of theory,
Hobza has also noticed and confirmed the same N–H bond
length elongation (0.0004 A) and its vibrational frequency
increase (17 cmK1) upon hydrogen bond formation [19].
Both Li et al. [4] and Alabugin et al. [5] have studied the
C–H/N hydrogen bond of the complex F3C–H/NH3 at
the MP2(FC)/6–311CG(d,p) and MP2(FC)/6-31CG* level
of theory, respectively. In the calculation results from Li
et al., bond length of C–H and its vibrational frequency of
the monomer and complex are 1.0878 A, 3222.3 cmK1 and
1.0875 A, 3221.5 cmK1, respectively, while C–H bond
length of the monomer and complex is 1.0876 and
1.0888 A, respectively, in Alabugin et al.’s results.
Obviously, C–H bond length difference between the
monomer and the complex calculated from these two
research groups is K0.0003 and 0.0012 A, respectively.
Thus if ‘blue-shift means X–H contraction, and vice versa’
it will be hard for us to judge the hydrogen bond type of this
C–H/N H-bond. Furthermore, results from the former
research group deserve further consideration for the small
difference of the bond length change (K0.0003 A) and of
the vibrational frequency change (K0.8 cmK1). If the
0.0003 A difference (see above for F2N–H/FH) is
attributed to computational error or uncertainty then the
0.8 cmK1 difference attributes to what? Thus just in this
theoretical level (MP2(FC)/6-311CG(d,p)), it will be very
difficult for us to determine the type of H-bond according to
whether bond length change or vibrational frequency
change and it will be not a piece of cake either for
experimental identification if the frequency difference is just
only 0.8 cmK1.
Consequently, the X–H bond length change is not
necessarily in accord with the vibrational frequency change,
i.e. blue-shift does not necessarily mean X–H contraction,
and vice versa. This in accordance will appear in following
situations: (i) Different basis sets. As mentioned above, for
the C–H/N hydrogen bond of the complex F3C–H/NH3
at the MP2(FC) level of theory, the 6-311CG(d,p) basis set
used by Li et al. got K0.0003 A and K0.8 cmK1 for the
bond length change and vibrational frequency change. For
the 6-31CG* basis set used by Alabugin et al., only C–H
bond length of the monomer and the complex was given and
their difference is as large as 0.0012 A. According to our
knowledge, the X–H bond length abnormality has generally
up to 0.0005 A difference and the 0.0012 A difference
cannot lead to abnormality. At the MP2(FC)/6-31CG*
level of theory, we also repeated Alabugin et al.’s
calculation with Gaussian 03 [9] so as to get the bond
length and vibrational frequency difference parameters and
they are: 0.0015 A (1.0873 and 1.0888 A for the monomer
and the complex, respectively) and K17.1 cmK1
(3257.8 and 3240.7 cmK1 [21] for the monomer and the
complex, respectively). (ii) Different systems and theoreti-
cal methods. For the two conformers shown in Fig. 2(a) and
(b), at the B3LYP/6-311CG(d,p) level of theory, N–H
parameters of non-hydrogen bonded and hydrogen bonded
systems are 1.0100 A, 3613.4 cmK1 and 1.0102 A,
3595.7 cmK1, respectively. Thus vibrational frequency
difference still reaches K17.7 cmK1 although bond length
difference is only 0.0002 A. For the F2N–H/FH complex
at the MP2(FC)/6-311CG(d,p) level of theory, N–H bond
length difference is 0.0003 A but the vibrational frequency
difference is 13.4 cmK1, which appears abnormal. It seems
that the abnormal relationship between bond length change
and vibrational frequency change occurs more frequently in
intermolecular H-bonded systems than in intramolecular
H-bonded systems, and more frequently at the MP2 level of
theory than at the B3LYP level of theory. Tables 1 and 2
support some of this argument. (iii) As shown in Tables 1
and 2, the basis set superposition effect can also influence
this abnormality for Hartree–Fock and MP2 calculation. For
example, at the MP2(FC)/6-311CG(d,p) level of theory, the
standard gradient optimization gives 0.0001 A and 16 cmK1
for the N–H parameters while the CP-corrected gradient
optimization gives K0.0002 A and 21 cmK1.
P. Lu et al. / Journal of Molecular Structure: THEOCHEM 723 (2005) 95–100100
4. Conclusions
We have found a noticeable phenomenon in H-bond type
prediction: B3LYP and MP2 calculation have a contra-
dictory performance. For N–H/F H-bond in F2N–H/FH
complex, B3LYP computation predicts a red-shifted
H-bond while MP2 computation predicts a blue-shifted
one. This contradictory prediction cannot originate from
basis set superposition error effect that can be corrected by
counterpoise calculation. At present we cannot decide
which hydrogen bond type it is from the point of theory.
The relative performance of the B3LYP and MP2
computation in hydrogen bond prediction can only be
resolved with the aid of experimental infrared spectra
measurement. Next, before the experimental measurement,
such hydrogen bonded complex F2N–H/FH as theoreti-
cally predicted geometry should be synthesized. Since X–H
bond length change is very small even theoretically
considering; it is very dangerous to identify hydrogen
bond type by bond length change. The X–H bond length
change is not always in accord with its vibrational frequency
change. And this abnormality is related to theoretical
methods, basis set, and counterpoise-correction or not.
References
[1] H. Matsuura, H. Yoshida, M. Hieda, S.-y. Yamanaka, T. Harada,
K. Shin-ya, K. Ohno, J. Am. Chem. Soc. 125 (2003) 13910.
[2] R.L.T. Parreira, S.E. Galembeck, J. Am. Chem. Soc. 125 (2003)
15614.
[3] R.A. Vergenz, I. Yazji, C. Whittington, J. Daw, K.T. Tran, J. Am.
Chem. Soc. 125 (2003) 12318.
[4] X. Li, L. Liu, H.B. Schlegel, J. Am. Chem. Soc. 124 (2002) 9639.
[5] I.V. Alabugin, M. Manoharan, S. Peabody, F. Weinhold, J. Am.
Chem. Soc. 125 (2003) 5973.
[6] G.R. Desiraju, Acc. Chem. Res. 35 (2002) 565.
[7] P. Hobza, V. Spirko, H.L. Selzle, E.W. Schlag, J. Phys. Chem. A 102
(1998) 2501.
[8] P. Hobza, V. Spirko, Z. Havlas, K. Buchhold, B. Reimann, H.-
D. Barth, B. Brutschy, Chem. Phys. Lett. 299 (1999) 180.
[9] M.J. Frisch, G.W. Trucks, H.B. Schlegel, G.E. Scuseria, M.A. Robb,
J.R. Cheeseman, J.A. Montgomery, Jr., T. Vreven, K.N. Kudin, J.C.
Burant, J.M. Millam, S.S. Iyengar, J. Tomasi, V. Barone, B.
Mennucci, M. Cossi, G. Scalmani, N. Rega, G.A. Petersson, H.
Nakatsuji, M. Hada, M. Ehara, K. Toyota, R. Fukuda, J. Hasegawa, M.
Ishida, T. Nakajima, Y. Honda, O. Kitao, H. Nakai, M. Klene, X. Li,
J.E. Knox, H.P. Hratchian, J.B. Cross, C. Adamo, J. Jaramillo, R.
Gomperts, R.E. Stratmann, O. Yazyev, A.J. Austin, R. Cammi, C.
Pomelli, J.W. Ochterski, P.Y. Ayala, K. Morokuma, G.A. Voth, P.
Salvador, J.J. Dannenberg, V.G. Zakrzewski, S. Dapprich, A.D.
Daniels, M.C. Strain, O. Farkas, D.K. Malick, A.D. Rabuck, K.
Raghavachari, J.B. Foresman, J.V. Ortiz, Q. Cui, A.G. Baboul, S.
Clifford, J. Cioslowski, B.B. Stefanov, G. Liu, A. Liashenko, P.
Piskorz, I. Komaromi, R.L. Martin, D.J. Fox, T. Keith, M.A. Al-
Laham, C.Y. Peng, A. Nanayakkara, M. Challacombe, P.M.W. Gill,
B. Johnson, W. Chen, M.W. Wong, C. Gonzalez, J.A. Pople, Gaussian
03, Revision B.5, Gaussian, Inc., Pittsburgh PA, 2003.
[10] A.D. Becke, J. Chem. Phys. 98 (1993) 5648.
[11] C. Lee, W. Yang, R.G. Parr, Phys. Rev. B 37 (1988) 785.
[12] C. Møller, M.S. Plesset, Phys. Rev. 46 (1934) 618.
[13] M.J. Frisch, M. Head-Gordon, J.A. Pople, Chem. Phys. Lett. 166
(1990) 281.
[14] S. Simon, M. Duran, J.J. Dannenberg, J. Chem. Phys. 105 (1996)
11024.
[15] S.F. Boys, F. Bernardi, Mol. Phys. 19 (1970) 553.
[16] P. Hobza, Z. Halvas, Theor. Chim. Acta 99 (1998) 372.
[17] P. Hobza, Z. Halvas, Chem. Phys. Lett. 303 (1999) 447.
[18] S. Scheiner, Hydrogen Bonding. A Theoretical Perspective, Oxford
University Press, New York, 1997.
[19] P. Hobza, Int. J. Quantum Chem. 90 (2002) 1071.
[20] Xiaosong Li (Department of Chemistry, Yale University, New Haven,
CT 06520, USA. E-mail: [email protected]), personal communi-
cation, 2004.
[21] In our geometry optimization and frequency calculation, the initial
geometrical parameters of F3C–H/NH3 are taken from the Support-
ing Information (S6) of the Ref. [5]. Our optimization process proves
that their geometry is indeed a stationary point. However, their
geometry is not a local minimum but a transition state (indicated by
one imaginary frequency K16.9 cmK1. This imaginary frequency
vibrational mode corresponds to that the three hydrogen atoms of the
NH3 molecule rotate consistently along its C3 axes.).