Embed Size (px)
Citation preview
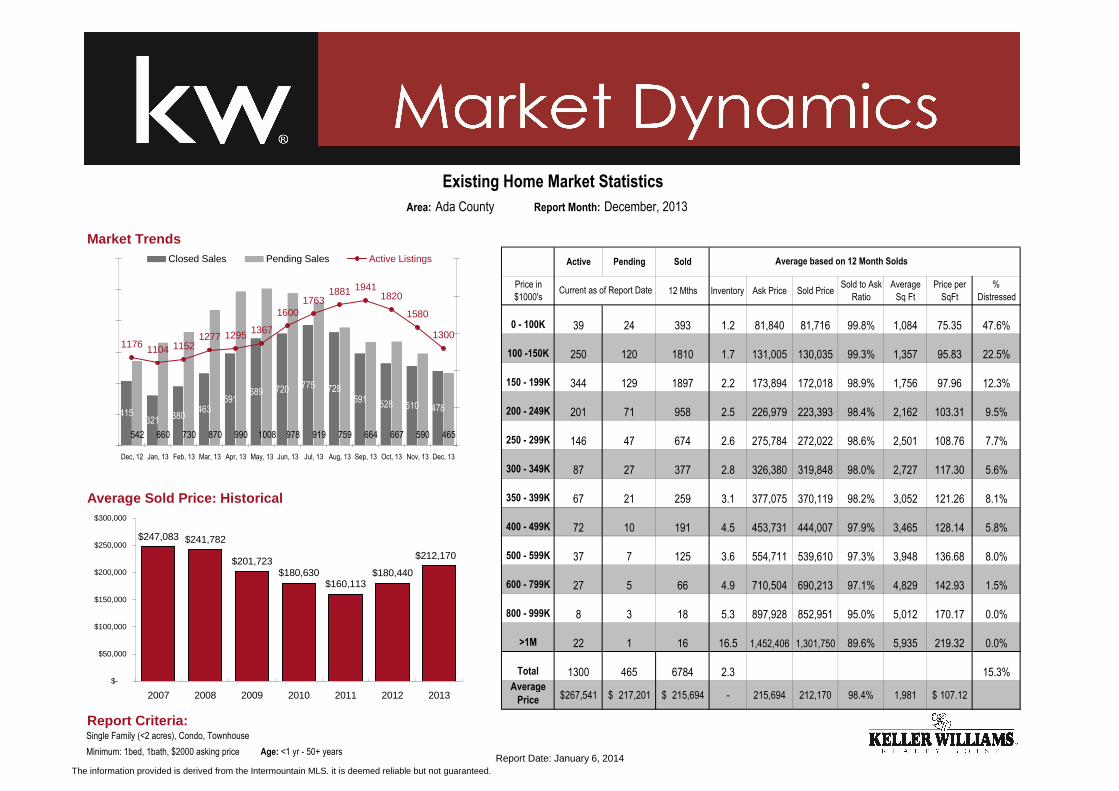
Area: Ada County Report Month: December, 2013
Market Trends
Active Pending Sold
Price in
$1000's12 Mths Inventory Ask Price Sold Price
Sold to Ask
Ratio
Average
Sq Ft
Price per
SqFt
%
Distressed
0 - 100K 39 24 393 1.2 81,840 81,716 99.8% 1,084 75.35 47.6%
100 -150K 250 120 1810 1.7 131,005 130,035 99.3% 1,357 95.83 22.5%
150 - 199K 344 129 1897 2.2 173,894 172,018 98.9% 1,756 97.96 12.3%
200 - 249K 201 71 958 2.5 226,979 223,393 98.4% 2,162 103.31 9.5%
250 - 299K 146 47 674 2.6 275,784 272,022 98.6% 2,501 108.76 7.7%
300 - 349K 87 27 377 2.8 326,380 319,848 98.0% 2,727 117.30 5.6%
Average Sold Price: Historical 350 - 399K 67 21 259 3.1 377,075 370,119 98.2% 3,052 121.26 8.1%
400 - 499K 72 10 191 4.5 453,731 444,007 97.9% 3,465 128.14 5.8%
500 - 599K 37 7 125 3.6 554,711 539,610 97.3% 3,948 136.68 8.0%
600 - 799K 27 5 66 4.9 710,504 690,213 97.1% 4,829 142.93 1.5%
800 - 999K 8 3 18 5.3 897,928 852,951 95.0% 5,012 170.17 0.0%
>1M 22 1 16 16.5 1,452,406 1,301,750 89.6% 5,935 219.32 0.0%
Total 1300 465 6784 2.3 15.3%Average
Price 267,541$ 217,201$ 215,694$ - 215,694 212,170 98.4% 1,981 107.12$
Report Criteria:Single Family (<2 acres), Condo, Townhouse
Minimum: 1bed, 1bath, $2000 asking price Age: <1 yr - 50+ years
Current as of Report Date
Existing Home Market Statistics
Average based on 12 Month Solds
$247,083 $241,782
$201,723$180,630
$160,113$180,440
$212,170
$-
$50,000
$100,000
$150,000
$200,000
$250,000
$300,000
2007 2008 2009 2010 2011 2012 2013
415321 380
463591
689 720 775 728591
528 510 478
542 660 730 870 990 1008 978 919 759 664 667 590 465
1367
16001763
1881 19411820
1580
13001176 1104
129512771152
0
200
400
600
800
1000
1200
Dec, 12 Jan, 13 Feb, 13 Mar, 13 Apr, 13 May, 13 Jun, 13 Jul, 13 Aug, 13 Sep, 13 Oct, 13 Nov, 13 Dec, 13
0
500
1000
1500
2000
2500Closed Sales Pending Sales Active Listings
The information provided is derived from the Intermountain MLS. it is deemed reliable but not guaranteed. Report Date: January 6, 2014
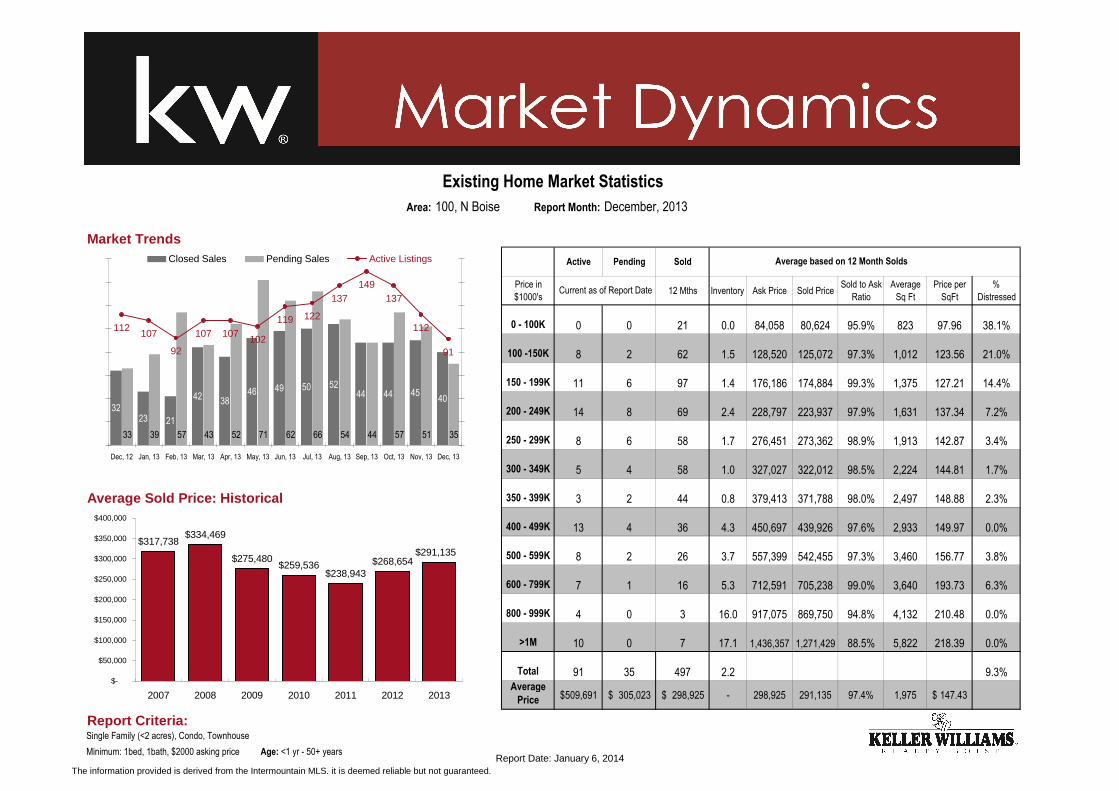
Area: 100, N Boise Report Month: December, 2013
Market Trends
Active Pending Sold
Price in
$1000's12 Mths Inventory Ask Price Sold Price
Sold to Ask
Ratio
Average
Sq Ft
Price per
SqFt
%
Distressed
0 - 100K 0 0 21 0.0 84,058 80,624 95.9% 823 97.96 38.1%
100 -150K 8 2 62 1.5 128,520 125,072 97.3% 1,012 123.56 21.0%
150 - 199K 11 6 97 1.4 176,186 174,884 99.3% 1,375 127.21 14.4%
200 - 249K 14 8 69 2.4 228,797 223,937 97.9% 1,631 137.34 7.2%
250 - 299K 8 6 58 1.7 276,451 273,362 98.9% 1,913 142.87 3.4%
300 - 349K 5 4 58 1.0 327,027 322,012 98.5% 2,224 144.81 1.7%
Average Sold Price: Historical 350 - 399K 3 2 44 0.8 379,413 371,788 98.0% 2,497 148.88 2.3%
400 - 499K 13 4 36 4.3 450,697 439,926 97.6% 2,933 149.97 0.0%
500 - 599K 8 2 26 3.7 557,399 542,455 97.3% 3,460 156.77 3.8%
600 - 799K 7 1 16 5.3 712,591 705,238 99.0% 3,640 193.73 6.3%
800 - 999K 4 0 3 16.0 917,075 869,750 94.8% 4,132 210.48 0.0%
>1M 10 0 7 17.1 1,436,357 1,271,429 88.5% 5,822 218.39 0.0%
Total 91 35 497 2.2 9.3%Average
Price 509,691$ 305,023$ 298,925$ - 298,925 291,135 97.4% 1,975 147.43$
Report Criteria:Single Family (<2 acres), Condo, Townhouse
Minimum: 1bed, 1bath, $2000 asking price Age: <1 yr - 50+ years
Current as of Report Date
Existing Home Market Statistics
Average based on 12 Month Solds
$317,738$334,469
$275,480$259,536
$238,943$268,654
$291,135
$-
$50,000
$100,000
$150,000
$200,000
$250,000
$300,000
$350,000
$400,000
2007 2008 2009 2010 2011 2012 2013
3223 21
42 3846 49 50 52
44 44 4540
33 39 57 43 52 71 62 66 54 44 57 51 35
102
119 122
137149
137
112
91
112107 107107
92
0
10
20
30
40
50
60
70
80
Dec, 12 Jan, 13 Feb, 13 Mar, 13 Apr, 13 May, 13 Jun, 13 Jul, 13 Aug, 13 Sep, 13 Oct, 13 Nov, 13 Dec, 13
0
20
40
60
80
100
120
140
160Closed Sales Pending Sales Active Listings
The information provided is derived from the Intermountain MLS. it is deemed reliable but not guaranteed. Report Date: January 6, 2014
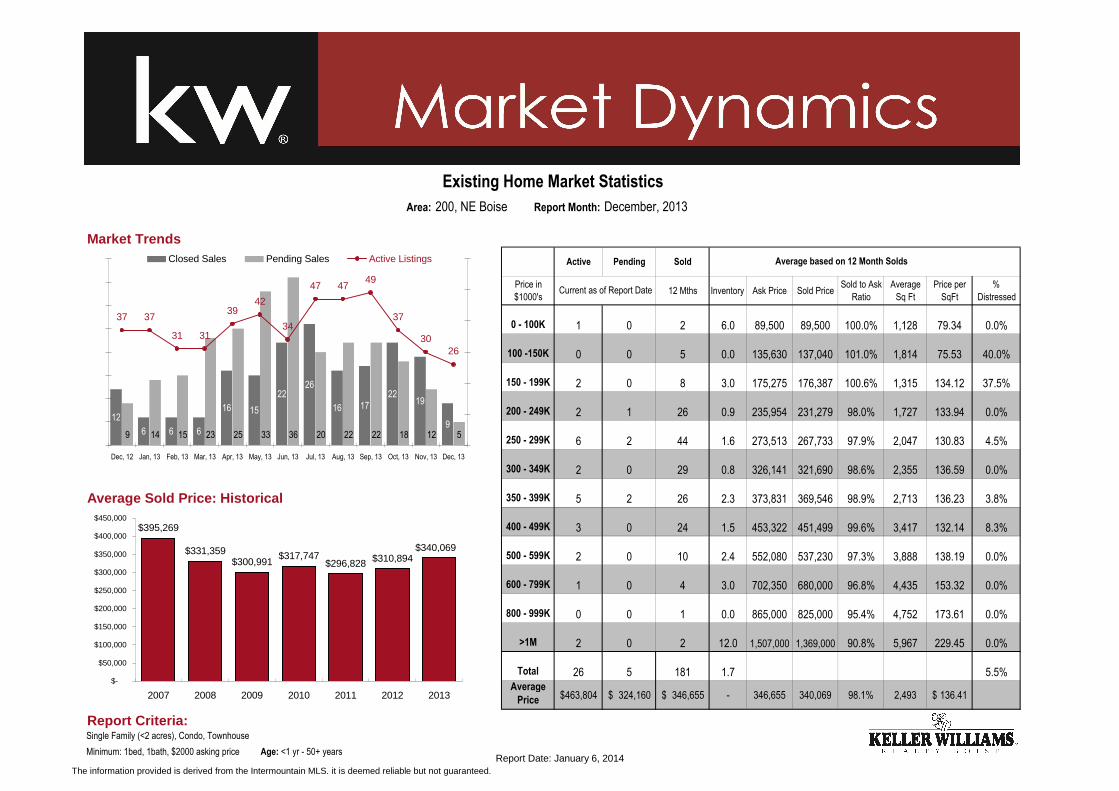
Area: 200, NE Boise Report Month: December, 2013
Market Trends
Active Pending Sold
Price in
$1000's12 Mths Inventory Ask Price Sold Price
Sold to Ask
Ratio
Average
Sq Ft
Price per
SqFt
%
Distressed
0 - 100K 1 0 2 6.0 89,500 89,500 100.0% 1,128 79.34 0.0%
100 -150K 0 0 5 0.0 135,630 137,040 101.0% 1,814 75.53 40.0%
150 - 199K 2 0 8 3.0 175,275 176,387 100.6% 1,315 134.12 37.5%
200 - 249K 2 1 26 0.9 235,954 231,279 98.0% 1,727 133.94 0.0%
250 - 299K 6 2 44 1.6 273,513 267,733 97.9% 2,047 130.83 4.5%
300 - 349K 2 0 29 0.8 326,141 321,690 98.6% 2,355 136.59 0.0%
Average Sold Price: Historical 350 - 399K 5 2 26 2.3 373,831 369,546 98.9% 2,713 136.23 3.8%
400 - 499K 3 0 24 1.5 453,322 451,499 99.6% 3,417 132.14 8.3%
500 - 599K 2 0 10 2.4 552,080 537,230 97.3% 3,888 138.19 0.0%
600 - 799K 1 0 4 3.0 702,350 680,000 96.8% 4,435 153.32 0.0%
800 - 999K 0 0 1 0.0 865,000 825,000 95.4% 4,752 173.61 0.0%
>1M 2 0 2 12.0 1,507,000 1,369,000 90.8% 5,967 229.45 0.0%
Total 26 5 181 1.7 5.5%Average
Price 463,804$ 324,160$ 346,655$ - 346,655 340,069 98.1% 2,493 136.41$
Report Criteria:Single Family (<2 acres), Condo, Townhouse
Minimum: 1bed, 1bath, $2000 asking price Age: <1 yr - 50+ years
Current as of Report Date
Existing Home Market Statistics
Average based on 12 Month Solds
$395,269
$331,359$300,991
$317,747$296,828 $310,894
$340,069
$-
$50,000
$100,000
$150,000
$200,000
$250,000
$300,000
$350,000
$400,000
$450,000
2007 2008 2009 2010 2011 2012 2013
12
6 6 6
16 15
2226
16 1722
19
99 14 15 23 25 33 36 20 22 22 18 12 5
42
34
47 4749
37
3026
37 3739
3131
0
5
10
15
20
25
30
35
40
Dec, 12 Jan, 13 Feb, 13 Mar, 13 Apr, 13 May, 13 Jun, 13 Jul, 13 Aug, 13 Sep, 13 Oct, 13 Nov, 13 Dec, 13
0
10
20
30
40
50
60Closed Sales Pending Sales Active Listings
The information provided is derived from the Intermountain MLS. it is deemed reliable but not guaranteed. Report Date: January 6, 2014
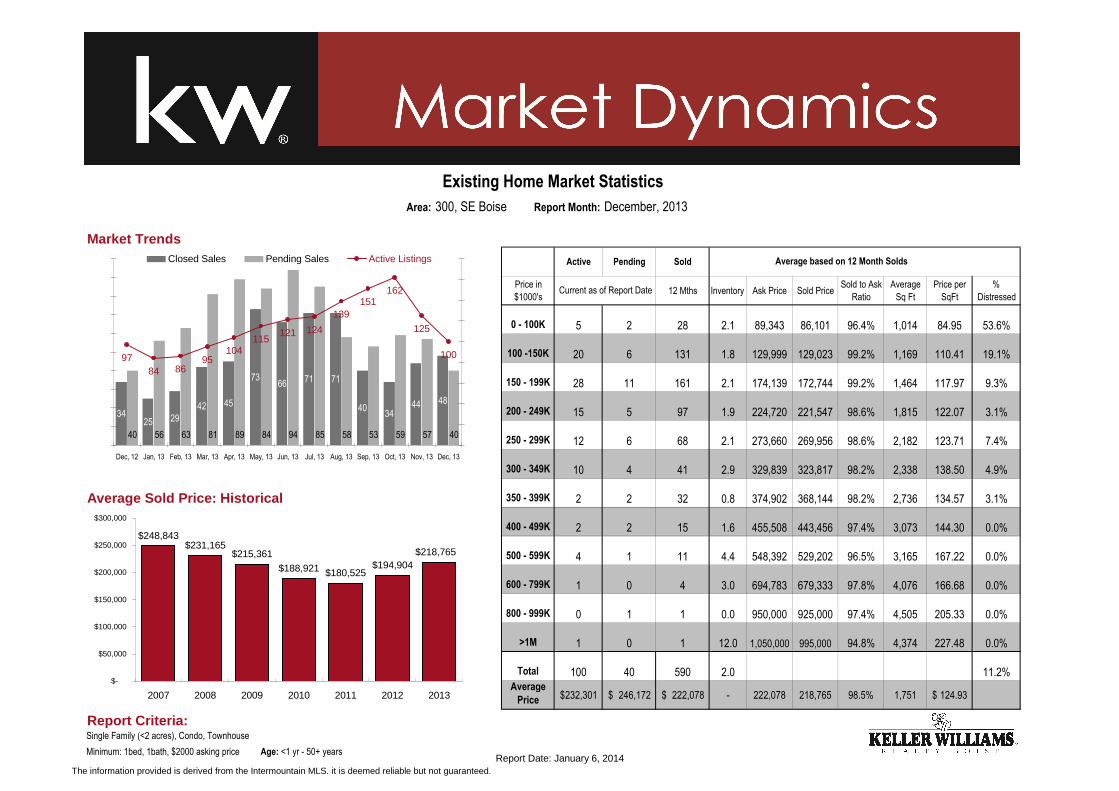
Area: 300, SE Boise Report Month: December, 2013
Market Trends
Active Pending Sold
Price in
$1000's12 Mths Inventory Ask Price Sold Price
Sold to Ask
Ratio
Average
Sq Ft
Price per
SqFt
%
Distressed
0 - 100K 5 2 28 2.1 89,343 86,101 96.4% 1,014 84.95 53.6%
100 -150K 20 6 131 1.8 129,999 129,023 99.2% 1,169 110.41 19.1%
150 - 199K 28 11 161 2.1 174,139 172,744 99.2% 1,464 117.97 9.3%
200 - 249K 15 5 97 1.9 224,720 221,547 98.6% 1,815 122.07 3.1%
250 - 299K 12 6 68 2.1 273,660 269,956 98.6% 2,182 123.71 7.4%
300 - 349K 10 4 41 2.9 329,839 323,817 98.2% 2,338 138.50 4.9%
Average Sold Price: Historical 350 - 399K 2 2 32 0.8 374,902 368,144 98.2% 2,736 134.57 3.1%
400 - 499K 2 2 15 1.6 455,508 443,456 97.4% 3,073 144.30 0.0%
500 - 599K 4 1 11 4.4 548,392 529,202 96.5% 3,165 167.22 0.0%
600 - 799K 1 0 4 3.0 694,783 679,333 97.8% 4,076 166.68 0.0%
800 - 999K 0 1 1 0.0 950,000 925,000 97.4% 4,505 205.33 0.0%
>1M 1 0 1 12.0 1,050,000 995,000 94.8% 4,374 227.48 0.0%
Total 100 40 590 2.0 11.2%Average
Price 232,301$ 246,172$ 222,078$ - 222,078 218,765 98.5% 1,751 124.93$
Report Criteria:Single Family (<2 acres), Condo, Townhouse
Minimum: 1bed, 1bath, $2000 asking price Age: <1 yr - 50+ years
Current as of Report Date
Existing Home Market Statistics
Average based on 12 Month Solds
$248,843$231,165
$215,361
$188,921 $180,525$194,904
$218,765
$-
$50,000
$100,000
$150,000
$200,000
$250,000
$300,000
2007 2008 2009 2010 2011 2012 2013
3425 29
42 45
7366 71 71
4034
44 48
40 56 63 81 89 84 94 85 58 53 59 57 40
115121 124
139151
162
125
1009784
10495
86
0
10
20
30
40
50
60
70
80
90
100
Dec, 12 Jan, 13 Feb, 13 Mar, 13 Apr, 13 May, 13 Jun, 13 Jul, 13 Aug, 13 Sep, 13 Oct, 13 Nov, 13 Dec, 13
0
20
40
60
80
100
120
140
160
180Closed Sales Pending Sales Active Listings
The information provided is derived from the Intermountain MLS. it is deemed reliable but not guaranteed. Report Date: January 6, 2014
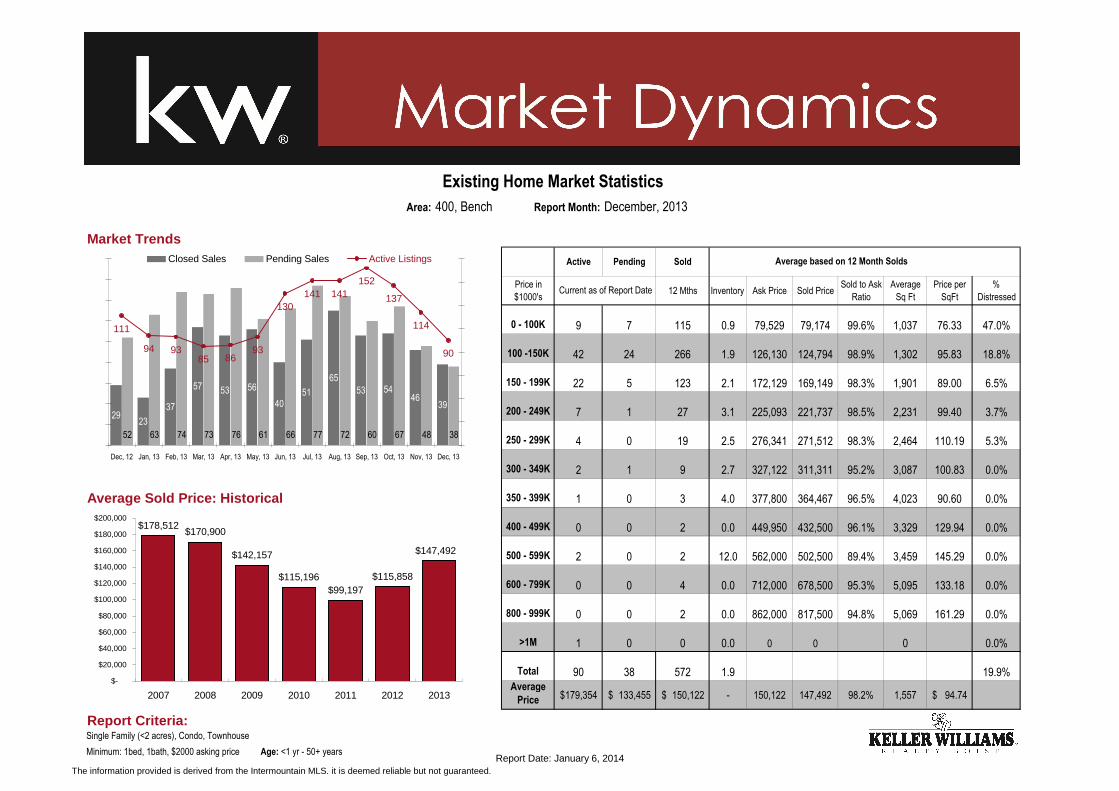
Area: 400, Bench Report Month: December, 2013
Market Trends
Active Pending Sold
Price in
$1000's12 Mths Inventory Ask Price Sold Price
Sold to Ask
Ratio
Average
Sq Ft
Price per
SqFt
%
Distressed
0 - 100K 9 7 115 0.9 79,529 79,174 99.6% 1,037 76.33 47.0%
100 -150K 42 24 266 1.9 126,130 124,794 98.9% 1,302 95.83 18.8%
150 - 199K 22 5 123 2.1 172,129 169,149 98.3% 1,901 89.00 6.5%
200 - 249K 7 1 27 3.1 225,093 221,737 98.5% 2,231 99.40 3.7%
250 - 299K 4 0 19 2.5 276,341 271,512 98.3% 2,464 110.19 5.3%
300 - 349K 2 1 9 2.7 327,122 311,311 95.2% 3,087 100.83 0.0%
Average Sold Price: Historical 350 - 399K 1 0 3 4.0 377,800 364,467 96.5% 4,023 90.60 0.0%
400 - 499K 0 0 2 0.0 449,950 432,500 96.1% 3,329 129.94 0.0%
500 - 599K 2 0 2 12.0 562,000 502,500 89.4% 3,459 145.29 0.0%
600 - 799K 0 0 4 0.0 712,000 678,500 95.3% 5,095 133.18 0.0%
800 - 999K 0 0 2 0.0 862,000 817,500 94.8% 5,069 161.29 0.0%
>1M 1 0 0 0.0 0 0 0 0.0%
Total 90 38 572 1.9 19.9%Average
Price 179,354$ 133,455$ 150,122$ - 150,122 147,492 98.2% 1,557 94.74$
Report Criteria:Single Family (<2 acres), Condo, Townhouse
Minimum: 1bed, 1bath, $2000 asking price Age: <1 yr - 50+ years
Current as of Report Date
Existing Home Market Statistics
Average based on 12 Month Solds
$178,512$170,900
$142,157
$115,196$99,197
$115,858
$147,492
$-
$20,000
$40,000
$60,000
$80,000
$100,000
$120,000
$140,000
$160,000
$180,000
$200,000
2007 2008 2009 2010 2011 2012 2013
2923
37
57 53 56
4051
65
53 5446
39
52 63 74 73 76 61 66 77 72 60 67 48 38
93
130141 141
152
137
114
90
111
948685
93
0
10
20
30
40
50
60
70
80
90
Dec, 12 Jan, 13 Feb, 13 Mar, 13 Apr, 13 May, 13 Jun, 13 Jul, 13 Aug, 13 Sep, 13 Oct, 13 Nov, 13 Dec, 13
0
20
40
60
80
100
120
140
160Closed Sales Pending Sales Active Listings
The information provided is derived from the Intermountain MLS. it is deemed reliable but not guaranteed. Report Date: January 6, 2014
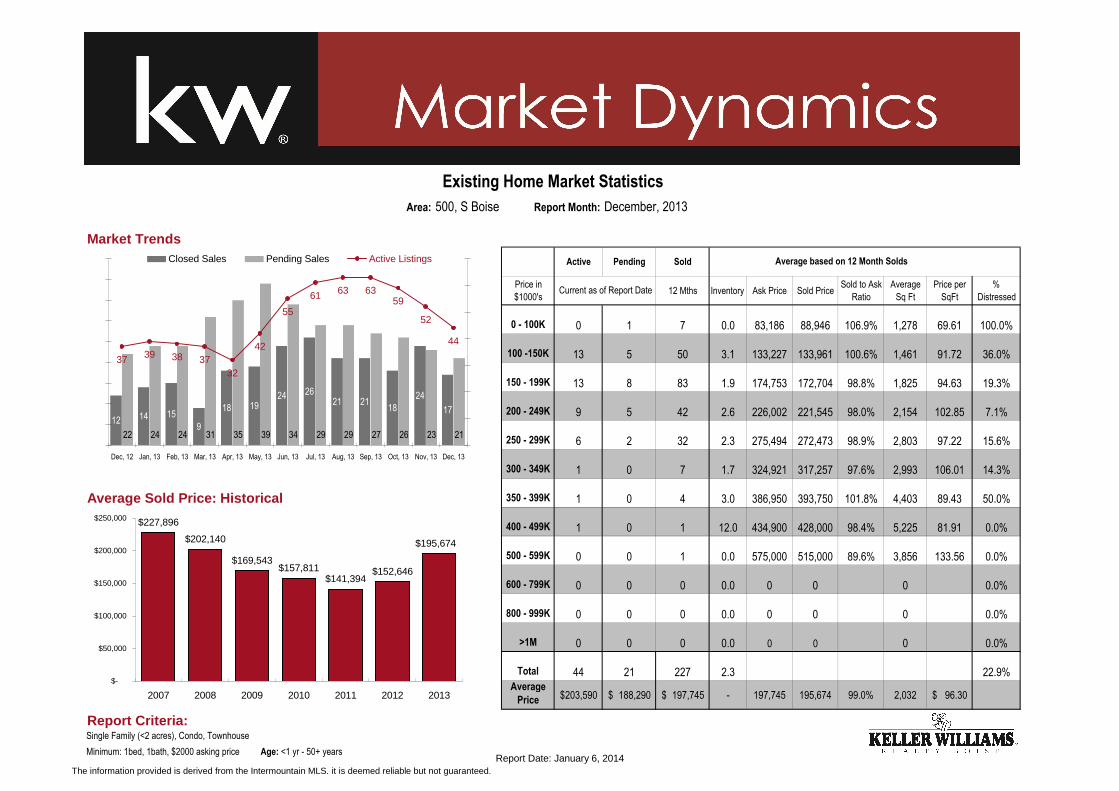
Area: 500, S Boise Report Month: December, 2013
Market Trends
Active Pending Sold
Price in
$1000's12 Mths Inventory Ask Price Sold Price
Sold to Ask
Ratio
Average
Sq Ft
Price per
SqFt
%
Distressed
0 - 100K 0 1 7 0.0 83,186 88,946 106.9% 1,278 69.61 100.0%
100 -150K 13 5 50 3.1 133,227 133,961 100.6% 1,461 91.72 36.0%
150 - 199K 13 8 83 1.9 174,753 172,704 98.8% 1,825 94.63 19.3%
200 - 249K 9 5 42 2.6 226,002 221,545 98.0% 2,154 102.85 7.1%
250 - 299K 6 2 32 2.3 275,494 272,473 98.9% 2,803 97.22 15.6%
300 - 349K 1 0 7 1.7 324,921 317,257 97.6% 2,993 106.01 14.3%
Average Sold Price: Historical 350 - 399K 1 0 4 3.0 386,950 393,750 101.8% 4,403 89.43 50.0%
400 - 499K 1 0 1 12.0 434,900 428,000 98.4% 5,225 81.91 0.0%
500 - 599K 0 0 1 0.0 575,000 515,000 89.6% 3,856 133.56 0.0%
600 - 799K 0 0 0 0.0 0 0 0 0.0%
800 - 999K 0 0 0 0.0 0 0 0 0.0%
>1M 0 0 0 0.0 0 0 0 0.0%
Total 44 21 227 2.3 22.9%Average
Price 203,590$ 188,290$ 197,745$ - 197,745 195,674 99.0% 2,032 96.30$
Report Criteria:Single Family (<2 acres), Condo, Townhouse
Minimum: 1bed, 1bath, $2000 asking price Age: <1 yr - 50+ years
Current as of Report Date
Existing Home Market Statistics
Average based on 12 Month Solds
$227,896
$202,140
$169,543$157,811
$141,394$152,646
$195,674
$-
$50,000
$100,000
$150,000
$200,000
$250,000
2007 2008 2009 2010 2011 2012 2013
12 14 15
9
18 1924 26
21 2118
24
17
22 24 24 31 35 39 34 29 29 27 26 23 21
42
55
61 63 6359
52
44
37 39
323738
0
5
10
15
20
25
30
35
40
45
Dec, 12 Jan, 13 Feb, 13 Mar, 13 Apr, 13 May, 13 Jun, 13 Jul, 13 Aug, 13 Sep, 13 Oct, 13 Nov, 13 Dec, 13
0
10
20
30
40
50
60
70Closed Sales Pending Sales Active Listings
The information provided is derived from the Intermountain MLS. it is deemed reliable but not guaranteed. Report Date: January 6, 2014

Area: 550, SW Boise Report Month: December, 2013
Market Trends
Active Pending Sold
Price in
$1000's12 Mths Inventory Ask Price Sold Price
Sold to Ask
Ratio
Average
Sq Ft
Price per
SqFt
%
Distressed
0 - 100K 2 0 21 1.1 80,038 81,693 102.1% 1,136 71.91 33.3%
100 -150K 13 9 136 1.1 132,999 132,419 99.6% 1,404 94.30 24.3%
150 - 199K 33 18 226 1.8 175,627 173,458 98.8% 1,884 92.05 13.3%
200 - 249K 23 8 93 3.0 225,871 222,267 98.4% 2,277 97.61 10.8%
250 - 299K 10 3 49 2.4 278,143 274,340 98.6% 2,663 103.01 2.0%
300 - 349K 7 1 18 4.7 322,733 314,417 97.4% 3,192 98.50 22.2%
Average Sold Price: Historical 350 - 399K 2 2 14 1.7 376,207 371,193 98.7% 3,615 102.68 14.3%
400 - 499K 2 0 0 0.0 0 0 0 0.0%
500 - 599K 0 0 0 0.0 0 0 0 0.0%
600 - 799K 0 0 0 0.0 0 0 0 0.0%
800 - 999K 0 0 0 0.0 0 0 0 0.0%
>1M 0 0 0 0.0 0 0 0 0.0%
Total 92 41 557 2.0 15.6%Average
Price 211,976$ 191,183$ 188,818$ - 188,818 186,527 98.8% 1,959 95.23$
Report Criteria:Single Family (<2 acres), Condo, Townhouse
Minimum: 1bed, 1bath, $2000 asking price Age: <1 yr - 50+ years
Current as of Report Date
Existing Home Market Statistics
Average based on 12 Month Solds
$223,476$207,194
$166,842$151,210
$136,680
$159,277
$186,527
$-
$50,000
$100,000
$150,000
$200,000
$250,000
2007 2008 2009 2010 2011 2012 2013
37 31 29 3244 50
6477
5750 50
2944
39 44 56 71 82 97 86 74 62 53 39 48 41
110
124 126
140147 144
123
928882
9493
78
0
20
40
60
80
100
120
Dec, 12 Jan, 13 Feb, 13 Mar, 13 Apr, 13 May, 13 Jun, 13 Jul, 13 Aug, 13 Sep, 13 Oct, 13 Nov, 13 Dec, 13
0
20
40
60
80
100
120
140
160Closed Sales Pending Sales Active Listings
The information provided is derived from the Intermountain MLS. it is deemed reliable but not guaranteed. Report Date: January 6, 2014
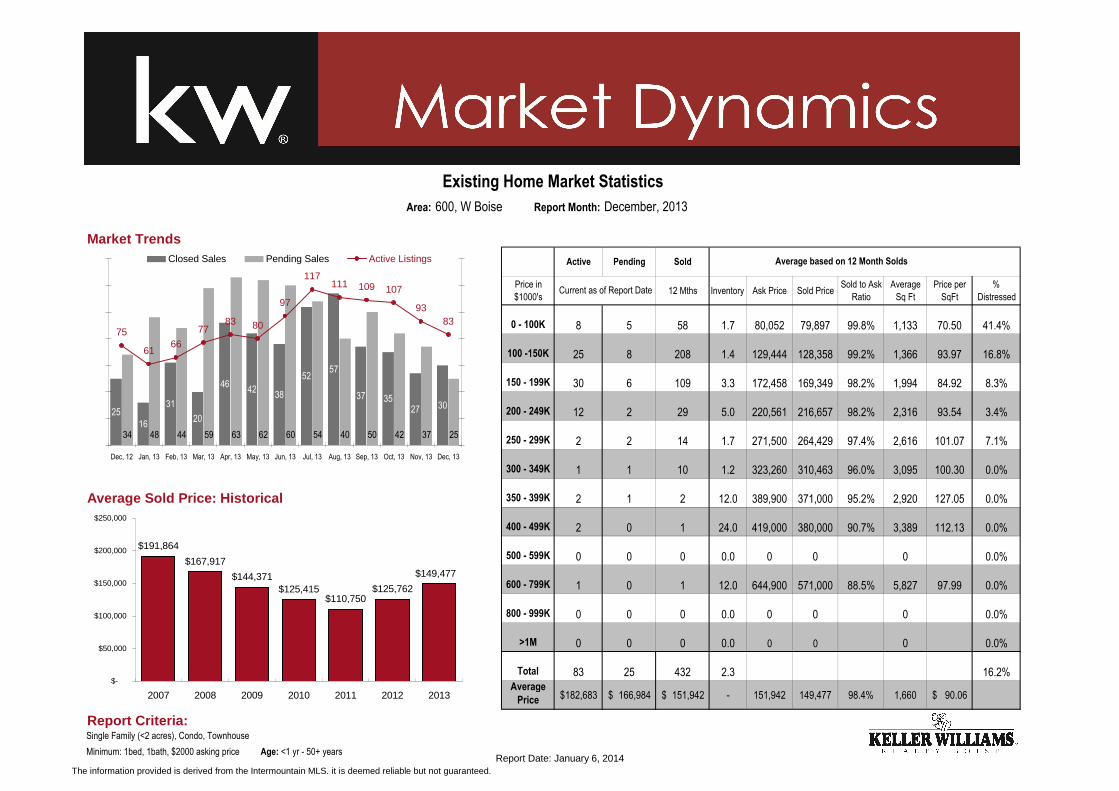
Area: 600, W Boise Report Month: December, 2013
Market Trends
Active Pending Sold
Price in
$1000's12 Mths Inventory Ask Price Sold Price
Sold to Ask
Ratio
Average
Sq Ft
Price per
SqFt
%
Distressed
0 - 100K 8 5 58 1.7 80,052 79,897 99.8% 1,133 70.50 41.4%
100 -150K 25 8 208 1.4 129,444 128,358 99.2% 1,366 93.97 16.8%
150 - 199K 30 6 109 3.3 172,458 169,349 98.2% 1,994 84.92 8.3%
200 - 249K 12 2 29 5.0 220,561 216,657 98.2% 2,316 93.54 3.4%
250 - 299K 2 2 14 1.7 271,500 264,429 97.4% 2,616 101.07 7.1%
300 - 349K 1 1 10 1.2 323,260 310,463 96.0% 3,095 100.30 0.0%
Average Sold Price: Historical 350 - 399K 2 1 2 12.0 389,900 371,000 95.2% 2,920 127.05 0.0%
400 - 499K 2 0 1 24.0 419,000 380,000 90.7% 3,389 112.13 0.0%
500 - 599K 0 0 0 0.0 0 0 0 0.0%
600 - 799K 1 0 1 12.0 644,900 571,000 88.5% 5,827 97.99 0.0%
800 - 999K 0 0 0 0.0 0 0 0 0.0%
>1M 0 0 0 0.0 0 0 0 0.0%
Total 83 25 432 2.3 16.2%Average
Price 182,683$ 166,984$ 151,942$ - 151,942 149,477 98.4% 1,660 90.06$
Report Criteria:Single Family (<2 acres), Condo, Townhouse
Minimum: 1bed, 1bath, $2000 asking price Age: <1 yr - 50+ years
Current as of Report Date
Existing Home Market Statistics
Average based on 12 Month Solds
$191,864
$167,917
$144,371$125,415
$110,750$125,762
$149,477
$-
$50,000
$100,000
$150,000
$200,000
$250,000
2007 2008 2009 2010 2011 2012 2013
2516
31
20
4642
38
5257
37 3527 30
34 48 44 59 63 62 60 54 40 50 42 37 25
80
97
117111 109 107
9383
75
61
8377
66
0
10
20
30
40
50
60
70
Dec, 12 Jan, 13 Feb, 13 Mar, 13 Apr, 13 May, 13 Jun, 13 Jul, 13 Aug, 13 Sep, 13 Oct, 13 Nov, 13 Dec, 13
0
20
40
60
80
100
120
140Closed Sales Pending Sales Active Listings
The information provided is derived from the Intermountain MLS. it is deemed reliable but not guaranteed. Report Date: January 6, 2014
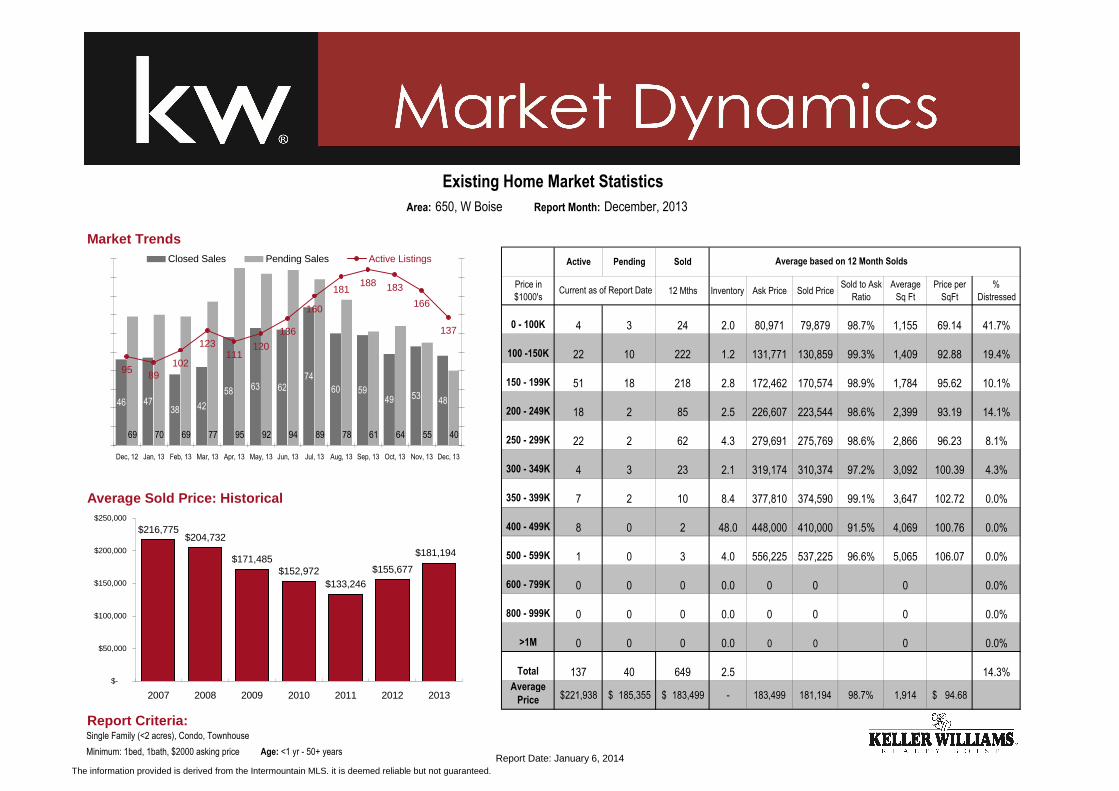
Area: 650, W Boise Report Month: December, 2013
Market Trends
Active Pending Sold
Price in
$1000's12 Mths Inventory Ask Price Sold Price
Sold to Ask
Ratio
Average
Sq Ft
Price per
SqFt
%
Distressed
0 - 100K 4 3 24 2.0 80,971 79,879 98.7% 1,155 69.14 41.7%
100 -150K 22 10 222 1.2 131,771 130,859 99.3% 1,409 92.88 19.4%
150 - 199K 51 18 218 2.8 172,462 170,574 98.9% 1,784 95.62 10.1%
200 - 249K 18 2 85 2.5 226,607 223,544 98.6% 2,399 93.19 14.1%
250 - 299K 22 2 62 4.3 279,691 275,769 98.6% 2,866 96.23 8.1%
300 - 349K 4 3 23 2.1 319,174 310,374 97.2% 3,092 100.39 4.3%
Average Sold Price: Historical 350 - 399K 7 2 10 8.4 377,810 374,590 99.1% 3,647 102.72 0.0%
400 - 499K 8 0 2 48.0 448,000 410,000 91.5% 4,069 100.76 0.0%
500 - 599K 1 0 3 4.0 556,225 537,225 96.6% 5,065 106.07 0.0%
600 - 799K 0 0 0 0.0 0 0 0 0.0%
800 - 999K 0 0 0 0.0 0 0 0 0.0%
>1M 0 0 0 0.0 0 0 0 0.0%
Total 137 40 649 2.5 14.3%Average
Price 221,938$ 185,355$ 183,499$ - 183,499 181,194 98.7% 1,914 94.68$
Report Criteria:Single Family (<2 acres), Condo, Townhouse
Minimum: 1bed, 1bath, $2000 asking price Age: <1 yr - 50+ years
Current as of Report Date
Existing Home Market Statistics
Average based on 12 Month Solds
$216,775$204,732
$171,485$152,972
$133,246
$155,677
$181,194
$-
$50,000
$100,000
$150,000
$200,000
$250,000
2007 2008 2009 2010 2011 2012 2013
46 4738 42
58 63 6274
60 5949 53 48
69 70 69 77 95 92 94 89 78 61 64 55 40
120
136
160
181188 183
166
137
95 89
111123
102
0
10
20
30
40
50
60
70
80
90
100
Dec, 12 Jan, 13 Feb, 13 Mar, 13 Apr, 13 May, 13 Jun, 13 Jul, 13 Aug, 13 Sep, 13 Oct, 13 Nov, 13 Dec, 13
0
20
40
60
80
100
120
140
160
180
200Closed Sales Pending Sales Active Listings
The information provided is derived from the Intermountain MLS. it is deemed reliable but not guaranteed. Report Date: January 6, 2014
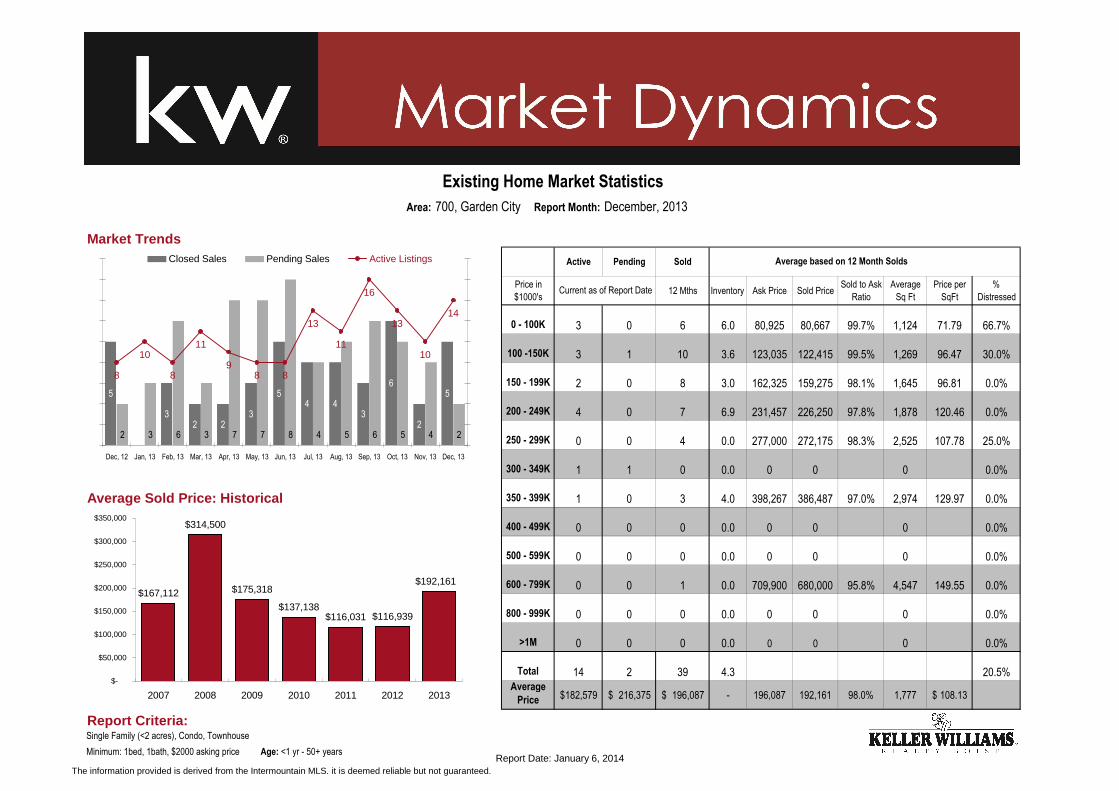
Area: 700, Garden City Report Month: December, 2013
Market Trends
Active Pending Sold
Price in
$1000's12 Mths Inventory Ask Price Sold Price
Sold to Ask
Ratio
Average
Sq Ft
Price per
SqFt
%
Distressed
0 - 100K 3 0 6 6.0 80,925 80,667 99.7% 1,124 71.79 66.7%
100 -150K 3 1 10 3.6 123,035 122,415 99.5% 1,269 96.47 30.0%
150 - 199K 2 0 8 3.0 162,325 159,275 98.1% 1,645 96.81 0.0%
200 - 249K 4 0 7 6.9 231,457 226,250 97.8% 1,878 120.46 0.0%
250 - 299K 0 0 4 0.0 277,000 272,175 98.3% 2,525 107.78 25.0%
300 - 349K 1 1 0 0.0 0 0 0 0.0%
Average Sold Price: Historical 350 - 399K 1 0 3 4.0 398,267 386,487 97.0% 2,974 129.97 0.0%
400 - 499K 0 0 0 0.0 0 0 0 0.0%
500 - 599K 0 0 0 0.0 0 0 0 0.0%
600 - 799K 0 0 1 0.0 709,900 680,000 95.8% 4,547 149.55 0.0%
800 - 999K 0 0 0 0.0 0 0 0 0.0%
>1M 0 0 0 0.0 0 0 0 0.0%
Total 14 2 39 4.3 20.5%Average
Price 182,579$ 216,375$ 196,087$ - 196,087 192,161 98.0% 1,777 108.13$
Report Criteria:Single Family (<2 acres), Condo, Townhouse
Minimum: 1bed, 1bath, $2000 asking price Age: <1 yr - 50+ years
Current as of Report Date
Existing Home Market Statistics
Average based on 12 Month Solds
$167,112
$314,500
$175,318
$137,138$116,031 $116,939
$192,161
$-
$50,000
$100,000
$150,000
$200,000
$250,000
$300,000
$350,000
2007 2008 2009 2010 2011 2012 2013
5
0
32 2
3
54 4
3
6
2
5
2 3 6 3 7 7 8 4 5 6 5 4 2
8 8
13
11
16
13
10
14
8
109
11
8
0
1
2
3
4
5
6
7
8
9
Dec, 12 Jan, 13 Feb, 13 Mar, 13 Apr, 13 May, 13 Jun, 13 Jul, 13 Aug, 13 Sep, 13 Oct, 13 Nov, 13 Dec, 13
0
2
4
6
8
10
12
14
16
18Closed Sales Pending Sales Active Listings
The information provided is derived from the Intermountain MLS. it is deemed reliable but not guaranteed. Report Date: January 6, 2014
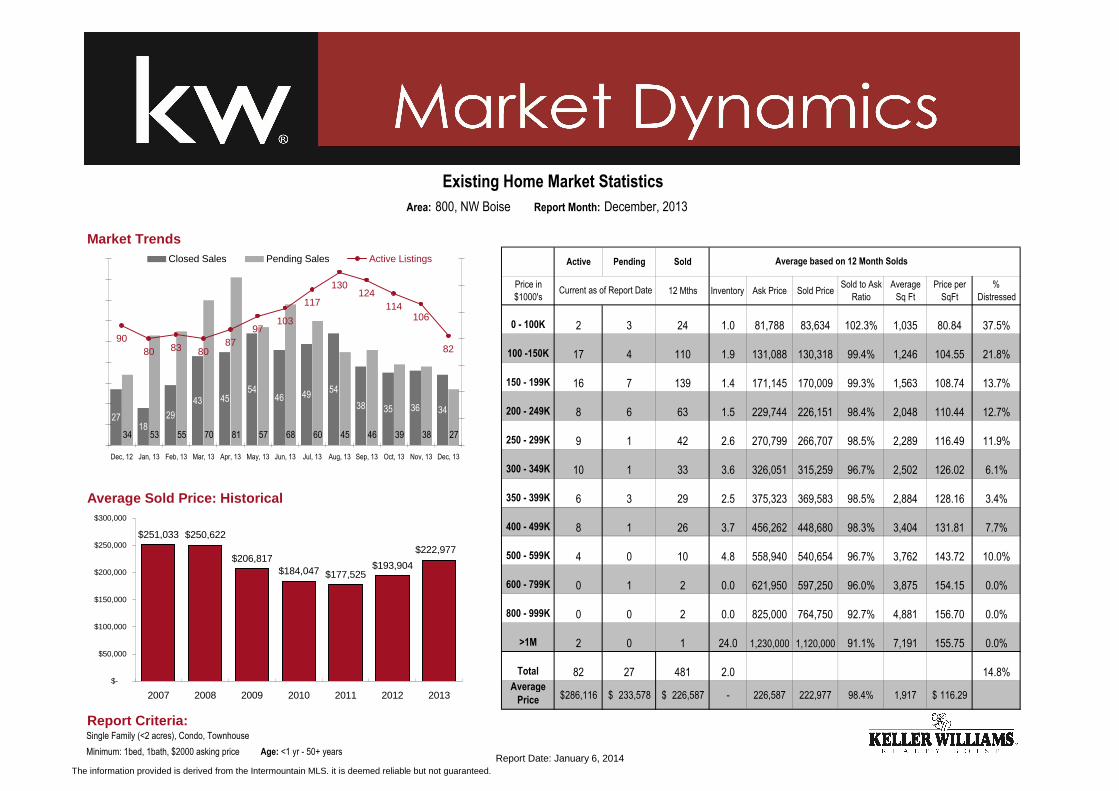
Area: 800, NW Boise Report Month: December, 2013
Market Trends
Active Pending Sold
Price in
$1000's12 Mths Inventory Ask Price Sold Price
Sold to Ask
Ratio
Average
Sq Ft
Price per
SqFt
%
Distressed
0 - 100K 2 3 24 1.0 81,788 83,634 102.3% 1,035 80.84 37.5%
100 -150K 17 4 110 1.9 131,088 130,318 99.4% 1,246 104.55 21.8%
150 - 199K 16 7 139 1.4 171,145 170,009 99.3% 1,563 108.74 13.7%
200 - 249K 8 6 63 1.5 229,744 226,151 98.4% 2,048 110.44 12.7%
250 - 299K 9 1 42 2.6 270,799 266,707 98.5% 2,289 116.49 11.9%
300 - 349K 10 1 33 3.6 326,051 315,259 96.7% 2,502 126.02 6.1%
Average Sold Price: Historical 350 - 399K 6 3 29 2.5 375,323 369,583 98.5% 2,884 128.16 3.4%
400 - 499K 8 1 26 3.7 456,262 448,680 98.3% 3,404 131.81 7.7%
500 - 599K 4 0 10 4.8 558,940 540,654 96.7% 3,762 143.72 10.0%
600 - 799K 0 1 2 0.0 621,950 597,250 96.0% 3,875 154.15 0.0%
800 - 999K 0 0 2 0.0 825,000 764,750 92.7% 4,881 156.70 0.0%
>1M 2 0 1 24.0 1,230,000 1,120,000 91.1% 7,191 155.75 0.0%
Total 82 27 481 2.0 14.8%Average
Price 286,116$ 233,578$ 226,587$ - 226,587 222,977 98.4% 1,917 116.29$
Report Criteria:Single Family (<2 acres), Condo, Townhouse
Minimum: 1bed, 1bath, $2000 asking price Age: <1 yr - 50+ years
Current as of Report Date
Existing Home Market Statistics
Average based on 12 Month Solds
$251,033 $250,622
$206,817$184,047 $177,525
$193,904
$222,977
$-
$50,000
$100,000
$150,000
$200,000
$250,000
$300,000
2007 2008 2009 2010 2011 2012 2013
2718
29
43 4554
46 4954
38 35 36 34
34 53 55 70 81 57 68 60 45 46 39 38 27
97103
117
130124
114106
8290
8087
8083
0
10
20
30
40
50
60
70
80
90
Dec, 12 Jan, 13 Feb, 13 Mar, 13 Apr, 13 May, 13 Jun, 13 Jul, 13 Aug, 13 Sep, 13 Oct, 13 Nov, 13 Dec, 13
0
20
40
60
80
100
120
140Closed Sales Pending Sales Active Listings
The information provided is derived from the Intermountain MLS. it is deemed reliable but not guaranteed. Report Date: January 6, 2014
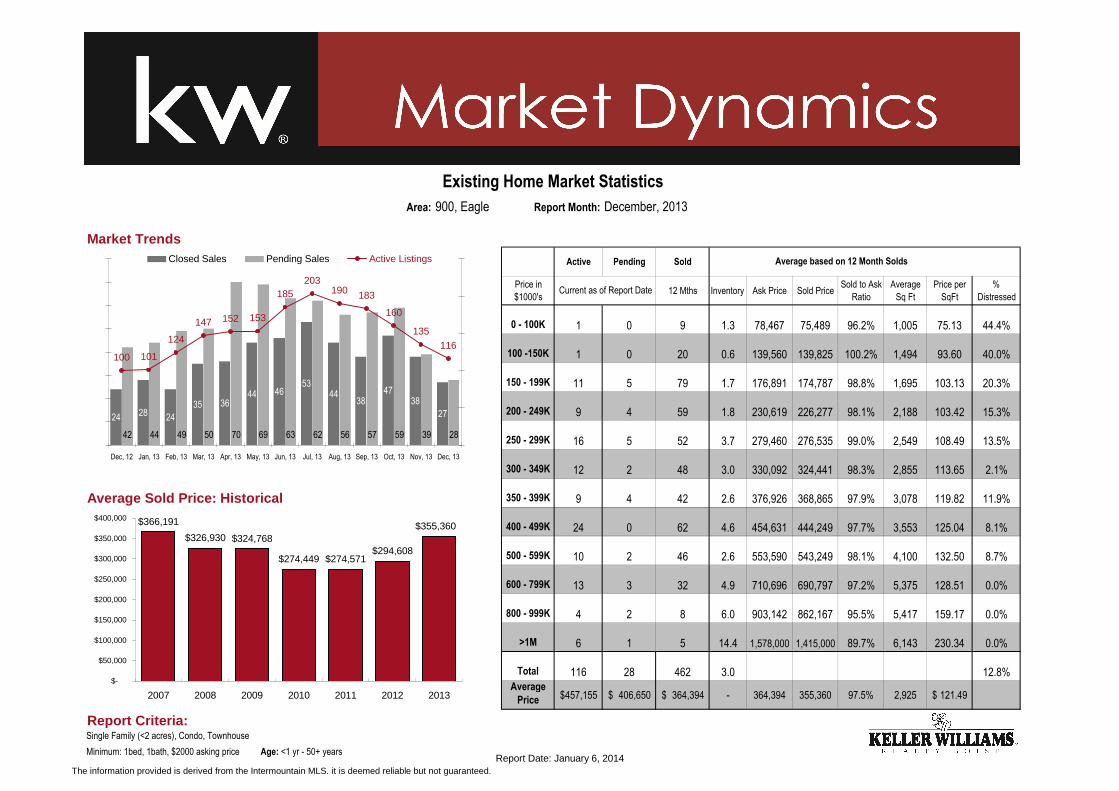
Area: 900, Eagle Report Month: December, 2013
Market Trends
Active Pending Sold
Price in
$1000's12 Mths Inventory Ask Price Sold Price
Sold to Ask
Ratio
Average
Sq Ft
Price per
SqFt
%
Distressed
0 - 100K 1 0 9 1.3 78,467 75,489 96.2% 1,005 75.13 44.4%
100 -150K 1 0 20 0.6 139,560 139,825 100.2% 1,494 93.60 40.0%
150 - 199K 11 5 79 1.7 176,891 174,787 98.8% 1,695 103.13 20.3%
200 - 249K 9 4 59 1.8 230,619 226,277 98.1% 2,188 103.42 15.3%
250 - 299K 16 5 52 3.7 279,460 276,535 99.0% 2,549 108.49 13.5%
300 - 349K 12 2 48 3.0 330,092 324,441 98.3% 2,855 113.65 2.1%
Average Sold Price: Historical 350 - 399K 9 4 42 2.6 376,926 368,865 97.9% 3,078 119.82 11.9%
400 - 499K 24 0 62 4.6 454,631 444,249 97.7% 3,553 125.04 8.1%
500 - 599K 10 2 46 2.6 553,590 543,249 98.1% 4,100 132.50 8.7%
600 - 799K 13 3 32 4.9 710,696 690,797 97.2% 5,375 128.51 0.0%
800 - 999K 4 2 8 6.0 903,142 862,167 95.5% 5,417 159.17 0.0%
>1M 6 1 5 14.4 1,578,000 1,415,000 89.7% 6,143 230.34 0.0%
Total 116 28 462 3.0 12.8%Average
Price 457,155$ 406,650$ 364,394$ - 364,394 355,360 97.5% 2,925 121.49$
Report Criteria:Single Family (<2 acres), Condo, Townhouse
Minimum: 1bed, 1bath, $2000 asking price Age: <1 yr - 50+ years
Current as of Report Date
Existing Home Market Statistics
Average based on 12 Month Solds
$366,191
$326,930 $324,768
$274,449 $274,571$294,608
$355,360
$-
$50,000
$100,000
$150,000
$200,000
$250,000
$300,000
$350,000
$400,000
2007 2008 2009 2010 2011 2012 2013
24 28 24
35 3644 46
5344
3847
38
27
42 44 49 50 70 69 63 62 56 57 59 39 28
153
185203
190 183
160
135116
100 101
152147
124
0
10
20
30
40
50
60
70
80
Dec, 12 Jan, 13 Feb, 13 Mar, 13 Apr, 13 May, 13 Jun, 13 Jul, 13 Aug, 13 Sep, 13 Oct, 13 Nov, 13 Dec, 13
0
50
100
150
200
250Closed Sales Pending Sales Active Listings
The information provided is derived from the Intermountain MLS. it is deemed reliable but not guaranteed. Report Date: January 6, 2014

Area: 950, Star Report Month: December, 2013
Market Trends
Active Pending Sold
Price in
$1000's12 Mths Inventory Ask Price Sold Price
Sold to Ask
Ratio
Average
Sq Ft
Price per
SqFt
%
Distressed
0 - 100K 0 0 4 0.0 85,050 82,750 97.3% 934 88.60 25.0%
100 -150K 13 1 44 3.5 136,418 133,702 98.0% 1,460 91.57 22.7%
150 - 199K 13 1 43 3.6 178,203 176,019 98.8% 2,008 87.64 18.6%
200 - 249K 16 2 40 4.8 229,252 225,850 98.5% 2,467 91.55 17.5%
250 - 299K 7 3 8 10.5 269,413 264,771 98.3% 2,721 97.32 0.0%
300 - 349K 2 0 4 6.0 324,450 319,625 98.5% 3,045 104.97 0.0%
Average Sold Price: Historical 350 - 399K 4 0 12 4.0 374,750 360,525 96.2% 3,478 103.65 33.3%
400 - 499K 2 0 8 3.0 456,376 445,578 97.6% 4,762 93.57 25.0%
500 - 599K 2 1 5 4.8 544,663 537,875 98.8% 4,313 124.71 40.0%
600 - 799K 1 0 1 12.0 625,000 625,000 100.0% 3,793 164.78 0.0%
800 - 999K 0 0 0 0.0 0 0 0 0.0%
>1M 0 0 0 0.0 0 0 0 0.0%
Total 60 8 169 4.3 20.1%Average
Price 242,147$ 263,075$ 224,904$ - 224,904 220,702 98.1% 2,327 94.86$
Report Criteria:Single Family (<2 acres), Condo, Townhouse
Minimum: 1bed, 1bath, $2000 asking price Age: <1 yr - 50+ years
Current as of Report Date
Existing Home Market Statistics
Average based on 12 Month Solds
$237,020 $245,587
$194,119
$166,136 $162,471$180,601
$220,702
$-
$50,000
$100,000
$150,000
$200,000
$250,000
$300,000
2007 2008 2009 2010 2011 2012 2013
7
118 8
2119
23
1513
18
7
12 13
15 12 16 23 22 22 21 19 18 16 16 13 8
60 60
74 7377
6964
60
3137
4952
45
0
5
10
15
20
25
Dec, 12 Jan, 13 Feb, 13 Mar, 13 Apr, 13 May, 13 Jun, 13 Jul, 13 Aug, 13 Sep, 13 Oct, 13 Nov, 13 Dec, 13
0
10
20
30
40
50
60
70
80
90Closed Sales Pending Sales Active Listings
The information provided is derived from the Intermountain MLS. it is deemed reliable but not guaranteed. Report Date: January 6, 2014
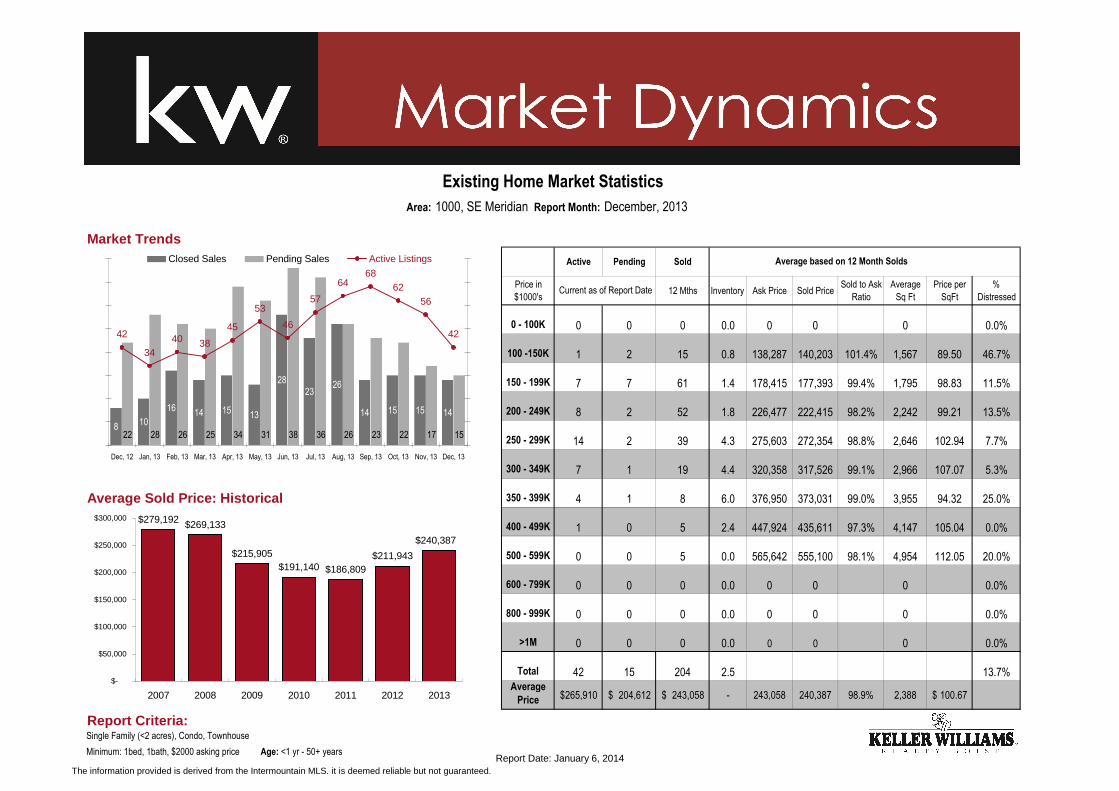
Area: 1000, SE Meridian Report Month: December, 2013
Market Trends
Active Pending Sold
Price in
$1000's12 Mths Inventory Ask Price Sold Price
Sold to Ask
Ratio
Average
Sq Ft
Price per
SqFt
%
Distressed
0 - 100K 0 0 0 0.0 0 0 0 0.0%
100 -150K 1 2 15 0.8 138,287 140,203 101.4% 1,567 89.50 46.7%
150 - 199K 7 7 61 1.4 178,415 177,393 99.4% 1,795 98.83 11.5%
200 - 249K 8 2 52 1.8 226,477 222,415 98.2% 2,242 99.21 13.5%
250 - 299K 14 2 39 4.3 275,603 272,354 98.8% 2,646 102.94 7.7%
300 - 349K 7 1 19 4.4 320,358 317,526 99.1% 2,966 107.07 5.3%
Average Sold Price: Historical 350 - 399K 4 1 8 6.0 376,950 373,031 99.0% 3,955 94.32 25.0%
400 - 499K 1 0 5 2.4 447,924 435,611 97.3% 4,147 105.04 0.0%
500 - 599K 0 0 5 0.0 565,642 555,100 98.1% 4,954 112.05 20.0%
600 - 799K 0 0 0 0.0 0 0 0 0.0%
800 - 999K 0 0 0 0.0 0 0 0 0.0%
>1M 0 0 0 0.0 0 0 0 0.0%
Total 42 15 204 2.5 13.7%Average
Price 265,910$ 204,612$ 243,058$ - 243,058 240,387 98.9% 2,388 100.67$
Report Criteria:Single Family (<2 acres), Condo, Townhouse
Minimum: 1bed, 1bath, $2000 asking price Age: <1 yr - 50+ years
Current as of Report Date
Existing Home Market Statistics
Average based on 12 Month Solds
$279,192 $269,133
$215,905$191,140 $186,809
$211,943
$240,387
$-
$50,000
$100,000
$150,000
$200,000
$250,000
$300,000
2007 2008 2009 2010 2011 2012 2013
8 10
16 14 15 13
2823
26
14 15 15 14
22 28 26 25 34 31 38 36 26 23 22 17 15
53
46
57
6468
6256
4242
34
45
3840
0
5
10
15
20
25
30
35
40
Dec, 12 Jan, 13 Feb, 13 Mar, 13 Apr, 13 May, 13 Jun, 13 Jul, 13 Aug, 13 Sep, 13 Oct, 13 Nov, 13 Dec, 13
0
10
20
30
40
50
60
70
80Closed Sales Pending Sales Active Listings
The information provided is derived from the Intermountain MLS. it is deemed reliable but not guaranteed. Report Date: January 6, 2014
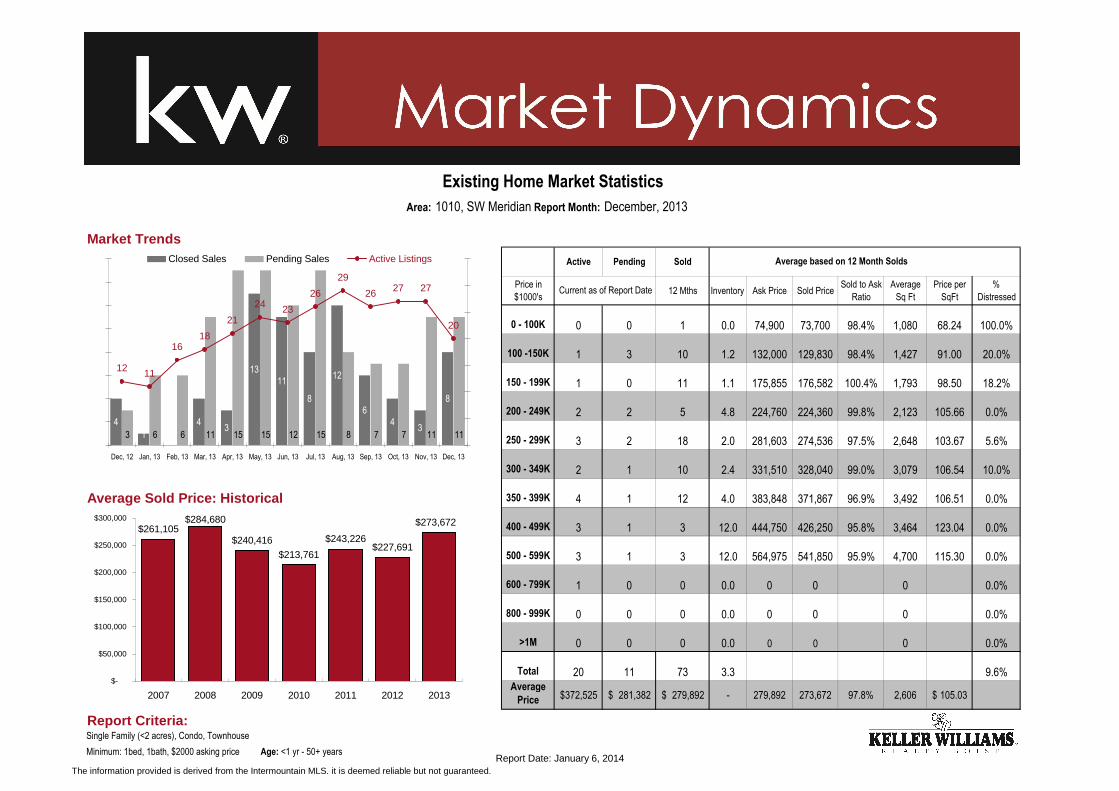
Area: 1010, SW Meridian Report Month: December, 2013
Market Trends
Active Pending Sold
Price in
$1000's12 Mths Inventory Ask Price Sold Price
Sold to Ask
Ratio
Average
Sq Ft
Price per
SqFt
%
Distressed
0 - 100K 0 0 1 0.0 74,900 73,700 98.4% 1,080 68.24 100.0%
100 -150K 1 3 10 1.2 132,000 129,830 98.4% 1,427 91.00 20.0%
150 - 199K 1 0 11 1.1 175,855 176,582 100.4% 1,793 98.50 18.2%
200 - 249K 2 2 5 4.8 224,760 224,360 99.8% 2,123 105.66 0.0%
250 - 299K 3 2 18 2.0 281,603 274,536 97.5% 2,648 103.67 5.6%
300 - 349K 2 1 10 2.4 331,510 328,040 99.0% 3,079 106.54 10.0%
Average Sold Price: Historical 350 - 399K 4 1 12 4.0 383,848 371,867 96.9% 3,492 106.51 0.0%
400 - 499K 3 1 3 12.0 444,750 426,250 95.8% 3,464 123.04 0.0%
500 - 599K 3 1 3 12.0 564,975 541,850 95.9% 4,700 115.30 0.0%
600 - 799K 1 0 0 0.0 0 0 0 0.0%
800 - 999K 0 0 0 0.0 0 0 0 0.0%
>1M 0 0 0 0.0 0 0 0 0.0%
Total 20 11 73 3.3 9.6%Average
Price 372,525$ 281,382$ 279,892$ - 279,892 273,672 97.8% 2,606 105.03$
Report Criteria:Single Family (<2 acres), Condo, Townhouse
Minimum: 1bed, 1bath, $2000 asking price Age: <1 yr - 50+ years
Current as of Report Date
Existing Home Market Statistics
Average based on 12 Month Solds
$261,105$284,680
$240,416
$213,761
$243,226$227,691
$273,672
$-
$50,000
$100,000
$150,000
$200,000
$250,000
$300,000
2007 2008 2009 2010 2011 2012 2013
4
1 0
43
1311
8
12
64
3
8
3 6 6 11 15 15 12 15 8 7 7 11 11
24 23
26
29
26 27 27
20
12 11
21
1816
0
2
4
6
8
10
12
14
16
Dec, 12 Jan, 13 Feb, 13 Mar, 13 Apr, 13 May, 13 Jun, 13 Jul, 13 Aug, 13 Sep, 13 Oct, 13 Nov, 13 Dec, 13
0
5
10
15
20
25
30
35Closed Sales Pending Sales Active Listings
The information provided is derived from the Intermountain MLS. it is deemed reliable but not guaranteed. Report Date: January 6, 2014

Area: 1020, NE Meridian Report Month: December, 2013
Market Trends
Active Pending Sold
Price in
$1000's12 Mths Inventory Ask Price Sold Price
Sold to Ask
Ratio
Average
Sq Ft
Price per
SqFt
%
Distressed
0 - 100K 1 2 12 1.0 84,349 84,250 99.9% 1,068 78.90 50.0%
100 -150K 10 10 112 1.1 135,907 136,797 100.7% 1,417 96.53 33.0%
150 - 199K 42 9 152 3.3 173,993 172,626 99.2% 1,678 102.88 7.9%
200 - 249K 16 7 88 2.2 226,696 224,617 99.1% 2,322 96.73 12.5%
250 - 299K 11 3 71 1.9 278,226 274,450 98.6% 2,644 103.81 8.5%
300 - 349K 14 1 30 5.6 324,570 319,757 98.5% 2,949 108.42 13.3%
Average Sold Price: Historical 350 - 399K 7 0 8 10.5 380,575 372,425 97.9% 3,371 110.47 0.0%
400 - 499K 2 2 3 8.0 461,975 455,750 98.7% 4,430 102.88 0.0%
500 - 599K 0 0 1 0.0 567,500 493,000 86.9% 4,994 98.72 100.0%
600 - 799K 0 0 1 0.0 699,900 675,000 96.4% 5,414 124.68 0.0%
800 - 999K 0 0 0 0.0 0 0 0 0.0%
>1M 0 0 0 0.0 0 0 0 0.0%
Total 103 34 478 2.6 16.1%Average
Price 228,162$ 191,944$ 204,565$ - 204,565 202,694 99.1% 2,003 101.21$
Report Criteria:Single Family (<2 acres), Condo, Townhouse
Minimum: 1bed, 1bath, $2000 asking price Age: <1 yr - 50+ years
Current as of Report Date
Existing Home Market Statistics
Average based on 12 Month Solds
$237,134$211,861
$178,568$161,705 $154,444
$171,443
$202,694
$-
$50,000
$100,000
$150,000
$200,000
$250,000
2007 2008 2009 2010 2011 2012 2013
35
15
27 29
4641
6759
49 50
29 3327
30 45 43 65 58 83 65 75 64 46 38 43 34
84
103 107116
123 123 121
103
65 68
97
8382
0
10
20
30
40
50
60
70
80
90
Dec, 12 Jan, 13 Feb, 13 Mar, 13 Apr, 13 May, 13 Jun, 13 Jul, 13 Aug, 13 Sep, 13 Oct, 13 Nov, 13 Dec, 13
0
20
40
60
80
100
120
140Closed Sales Pending Sales Active Listings
The information provided is derived from the Intermountain MLS. it is deemed reliable but not guaranteed. Report Date: January 6, 2014

Area: 1030, NW Meridian Report Month: December, 2013
Market Trends
Active Pending Sold
Price in
$1000's12 Mths Inventory Ask Price Sold Price
Sold to Ask
Ratio
Average
Sq Ft
Price per
SqFt
%
Distressed
0 - 100K 0 0 30 0.0 87,553 88,284 100.8% 1,184 74.54 56.7%
100 -150K 27 15 233 1.4 133,167 132,192 99.3% 1,418 93.24 26.2%
150 - 199K 42 19 303 1.7 174,237 172,154 98.8% 1,796 95.84 12.5%
200 - 249K 31 14 160 2.3 226,546 222,883 98.4% 2,260 98.60 6.9%
250 - 299K 15 8 92 2.0 272,865 270,256 99.0% 2,713 99.61 7.6%
300 - 349K 6 5 36 2.0 327,471 321,179 98.1% 3,126 102.75 5.6%
Average Sold Price: Historical 350 - 399K 8 0 8 12.0 365,438 363,088 99.4% 3,536 102.69 25.0%
400 - 499K 1 0 2 6.0 458,708 445,000 97.0% 4,270 104.23 0.0%
500 - 599K 1 0 2 6.0 539,999 525,000 97.2% 4,994 105.14 0.0%
600 - 799K 1 0 0 0.0 0 0 0 0.0%
800 - 999K 0 0 1 0.0 899,999 835,000 92.8% 5,610 148.84 0.0%
>1M 0 0 0 0.0 0 0 0 0.0%
Total 132 61 867 1.8 15.9%Average
Price 217,523$ 202,232$ 190,783$ - 190,783 188,442 98.8% 1,945 96.88$
Report Criteria:Single Family (<2 acres), Condo, Townhouse
Minimum: 1bed, 1bath, $2000 asking price Age: <1 yr - 50+ years
Current as of Report Date
Existing Home Market Statistics
Average based on 12 Month Solds
$225,216
$203,188
$173,426$158,607
$145,398$160,519
$188,442
$-
$50,000
$100,000
$150,000
$200,000
$250,000
2007 2008 2009 2010 2011 2012 2013
44 42 4759
72
100 105 10392
7260 63
53
73 80 88 116 141 141 129 113 87 69 77 63 61
142
187 192
220211
189
162
132129 124136
147
124
0
20
40
60
80
100
120
140
160
Dec, 12 Jan, 13 Feb, 13 Mar, 13 Apr, 13 May, 13 Jun, 13 Jul, 13 Aug, 13 Sep, 13 Oct, 13 Nov, 13 Dec, 13
0
50
100
150
200
250Closed Sales Pending Sales Active Listings
The information provided is derived from the Intermountain MLS. it is deemed reliable but not guaranteed. Report Date: January 6, 2014
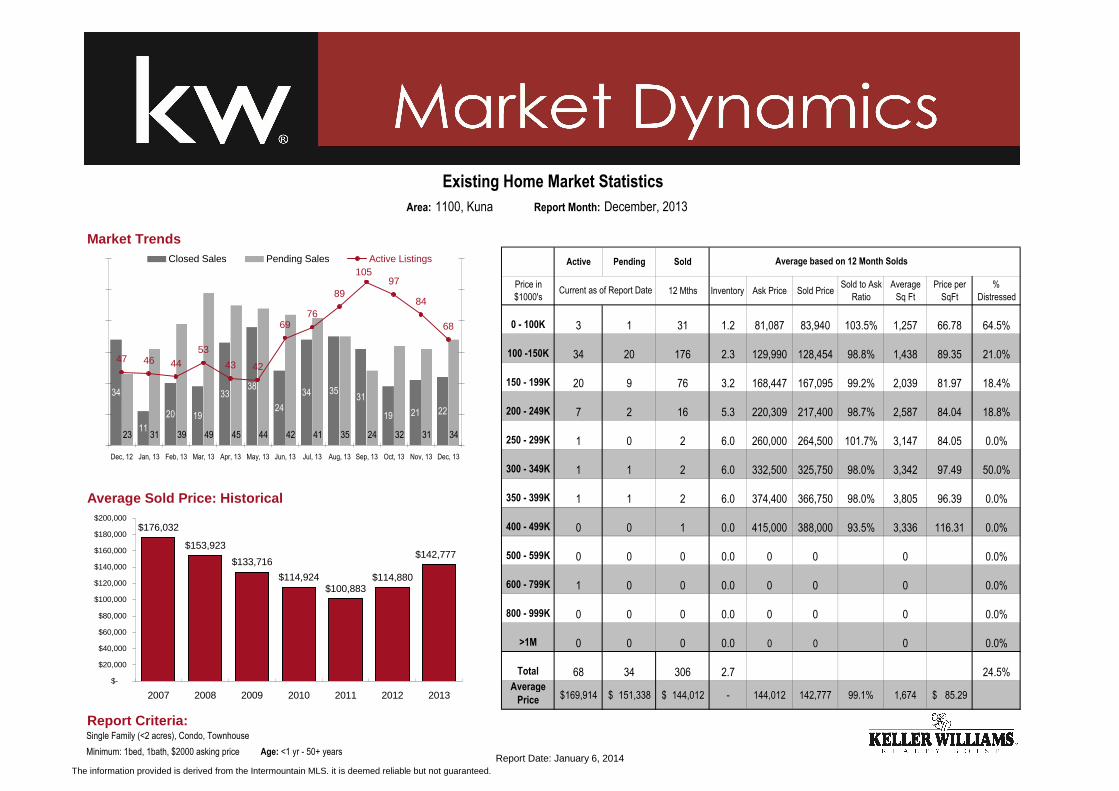
Area: 1100, Kuna Report Month: December, 2013
Market Trends
Active Pending Sold
Price in
$1000's12 Mths Inventory Ask Price Sold Price
Sold to Ask
Ratio
Average
Sq Ft
Price per
SqFt
%
Distressed
0 - 100K 3 1 31 1.2 81,087 83,940 103.5% 1,257 66.78 64.5%
100 -150K 34 20 176 2.3 129,990 128,454 98.8% 1,438 89.35 21.0%
150 - 199K 20 9 76 3.2 168,447 167,095 99.2% 2,039 81.97 18.4%
200 - 249K 7 2 16 5.3 220,309 217,400 98.7% 2,587 84.04 18.8%
250 - 299K 1 0 2 6.0 260,000 264,500 101.7% 3,147 84.05 0.0%
300 - 349K 1 1 2 6.0 332,500 325,750 98.0% 3,342 97.49 50.0%
Average Sold Price: Historical 350 - 399K 1 1 2 6.0 374,400 366,750 98.0% 3,805 96.39 0.0%
400 - 499K 0 0 1 0.0 415,000 388,000 93.5% 3,336 116.31 0.0%
500 - 599K 0 0 0 0.0 0 0 0 0.0%
600 - 799K 1 0 0 0.0 0 0 0 0.0%
800 - 999K 0 0 0 0.0 0 0 0 0.0%
>1M 0 0 0 0.0 0 0 0 0.0%
Total 68 34 306 2.7 24.5%Average
Price 169,914$ 151,338$ 144,012$ - 144,012 142,777 99.1% 1,674 85.29$
Report Criteria:Single Family (<2 acres), Condo, Townhouse
Minimum: 1bed, 1bath, $2000 asking price Age: <1 yr - 50+ years
Current as of Report Date
Existing Home Market Statistics
Average based on 12 Month Solds
$176,032
$153,923
$133,716
$114,924$100,883
$114,880
$142,777
$-
$20,000
$40,000
$60,000
$80,000
$100,000
$120,000
$140,000
$160,000
$180,000
$200,000
2007 2008 2009 2010 2011 2012 2013
34
11
20 19
3338
24
34 3531
19 21 22
23 31 39 49 45 44 42 41 35 24 32 31 34
42
6976
89
10597
84
68
47 46 43
5344
0
10
20
30
40
50
60
Dec, 12 Jan, 13 Feb, 13 Mar, 13 Apr, 13 May, 13 Jun, 13 Jul, 13 Aug, 13 Sep, 13 Oct, 13 Nov, 13 Dec, 13
0
20
40
60
80
100
120Closed Sales Pending Sales Active Listings
The information provided is derived from the Intermountain MLS. it is deemed reliable but not guaranteed. Report Date: January 6, 2014