Embed Size (px)
Citation preview
Colorado Parks & Wildlife 2015 Strategic Plan
Existing Conditions, Trends, and Projections
Colorado Parks & Wildlife
Policy and Planning Unit
May 2015
2 | P a g e
Contents Executive summary ....................................................................................................................................... 3
1. Introduction .......................................................................................................................................... 6
2. State Demographics and Population Change ....................................................................................... 6
2.1 Population trends and projections ............................................................................................... 6
2.2 Aging of the population ................................................................................................................ 9
2.3 Diversification of the population ................................................................................................ 10
2.4 Climate change ............................................................................................................................ 12
3. Trends in Outdoor Recreation ............................................................................................................ 13
3.1 Overall Participation Numbers .................................................................................................... 14
3.2 Activity by region ........................................................................................................................ 16
3.3 State Park visitation and public preferences .............................................................................. 17
3.4 Fishing Participation .................................................................................................................... 21
3.5 Hunting Participation .................................................................................................................. 22
3.6 Youth and Hispanic participation ................................................................................................ 24
4. Public Opinion and Preferences for Natural Resource and Recreation Priorities .............................. 25
5. Public satisfaction with CPW............................................................................................................... 27
3 | P a g e
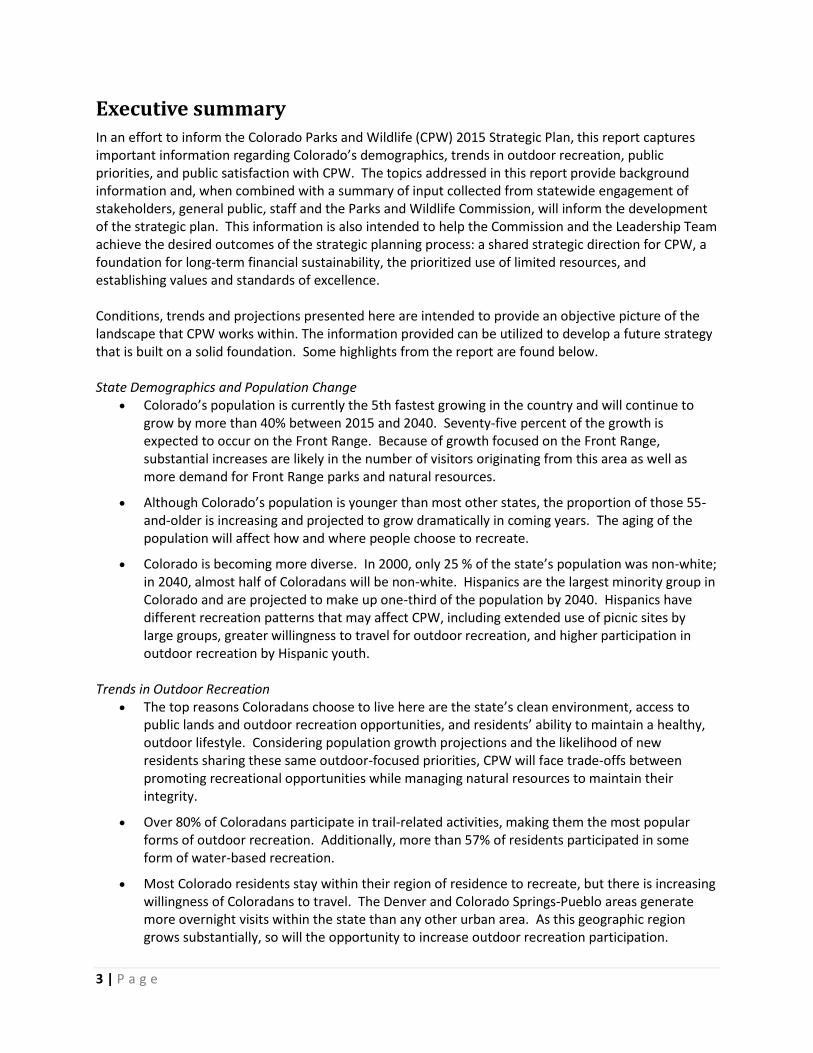
Executive summary In an effort to inform the Colorado Parks and Wildlife (CPW) 2015 Strategic Plan, this report captures important information regarding Colorado’s demographics, trends in outdoor recreation, public priorities, and public satisfaction with CPW. The topics addressed in this report provide background information and, when combined with a summary of input collected from statewide engagement of stakeholders, general public, staff and the Parks and Wildlife Commission, will inform the development of the strategic plan. This information is also intended to help the Commission and the Leadership Team achieve the desired outcomes of the strategic planning process: a shared strategic direction for CPW, a foundation for long-term financial sustainability, the prioritized use of limited resources, and establishing values and standards of excellence. Conditions, trends and projections presented here are intended to provide an objective picture of the landscape that CPW works within. The information provided can be utilized to develop a future strategy that is built on a solid foundation. Some highlights from the report are found below. State Demographics and Population Change
Colorado’s population is currently the 5th fastest growing in the country and will continue to grow by more than 40% between 2015 and 2040. Seventy-five percent of the growth is expected to occur on the Front Range. Because of growth focused on the Front Range, substantial increases are likely in the number of visitors originating from this area as well as more demand for Front Range parks and natural resources.
Although Colorado’s population is younger than most other states, the proportion of those 55-and-older is increasing and projected to grow dramatically in coming years. The aging of the population will affect how and where people choose to recreate.
Colorado is becoming more diverse. In 2000, only 25 % of the state’s population was non-white; in 2040, almost half of Coloradans will be non-white. Hispanics are the largest minority group in Colorado and are projected to make up one-third of the population by 2040. Hispanics have different recreation patterns that may affect CPW, including extended use of picnic sites by large groups, greater willingness to travel for outdoor recreation, and higher participation in outdoor recreation by Hispanic youth.
Trends in Outdoor Recreation The top reasons Coloradans choose to live here are the state’s clean environment, access to
public lands and outdoor recreation opportunities, and residents’ ability to maintain a healthy, outdoor lifestyle. Considering population growth projections and the likelihood of new residents sharing these same outdoor-focused priorities, CPW will face trade-offs between promoting recreational opportunities while managing natural resources to maintain their integrity.
Over 80% of Coloradans participate in trail-related activities, making them the most popular forms of outdoor recreation. Additionally, more than 57% of residents participated in some form of water-based recreation.
Most Colorado residents stay within their region of residence to recreate, but there is increasing willingness of Coloradans to travel. The Denver and Colorado Springs-Pueblo areas generate more overnight visits within the state than any other urban area. As this geographic region grows substantially, so will the opportunity to increase outdoor recreation participation.
4 | P a g e
Colorado State Parks visitation has generally been increasing over the last 10-15 years. More than 98% of Coloradans have at least one state park within 50 miles of where they live, and more than half of the state’s population (56%) lives within 50 miles of six or more state parks. Greater than two-thirds of all park visitors come from the Metro and North Central regions though, proportionally, park visitation from most regions of the state is high (42-48%).
Fishing is the fourth most popular activity by proportion of Coloradans’ participation. Although the overall trend for participation in angling since 1985 shows a decline, numbers have generally been increasing after reaching a low in 2000. As compared to hunting, participation in angling is high among younger adults, particularly between ages 22 and 37. Fishing participation slowly declines after age 65 until most participants are no longer fishing by age 80.
License holder numbers for hunting continue to display a general decline since a high in 1998, although a closer look at hunting applications and license sales suggests that the demand for big game hunting licenses exceeds supply and the number of licenses sold is largely driven by quota numbers. The largest cohort of big game hunters is between 47 and 57 years old. The size of this age group is decreasing as hunters stop hunting, without concomitant recruitment of younger age classes.
Nationally, 63% of youth participated in outdoor recreation in 2012. Despite declining participation rates from 2006 to 2009 which have since stabilized, youth still greatly outnumber the relative proportion of adults involved in outdoor recreation. The share of adolescent girls in outdoor recreation fell while participation by boys has increased slightly.
Public Opinion and Preferences for Natural Resource and Recreation Priorities
A general survey of Coloradans revealed preference for parks with fewer amenities compared to those that are more developed. Surveys of state park users indicate that they place a high level of importance on open lands and wilderness, but, along with scenery, many users highly value cleanliness, safety and facilities when they visit state parks.
Wildlife viewing opportunities and dirt trails are high priorities for the general public, with about half of general public respondents to a CPW poll ranking these as high priority or essential investments.
Land conservation and preserving natural areas regularly rank high in competing priorities for Coloradans. Maintenance of existing facilities was seen as important, not just addition of new infrastructure or public land. Maintaining public access is a high priority arising from Great Outdoors Colorado’s public surveys, surpassed only by protecting Colorado's land, water and wildlife.
Public Satisfaction with CPW
Generally, satisfaction levels for CPW’s work are relatively high. Surveys conducted prior to the merger of Colorado Division of Parks and Outdoor Recreation (State Parks) and the Colorado Division of Wildlife (DOW) indicated that public impressions of the agencies were favorable overall. Most Coloradans surveyed thought that State Parks was doing a good job of managing the state parks system, and that trust was high in DOW’s ability to manage fish and wildlife populations.
Anglers are generally pleased with their fishing in Colorado, as 66% of residents and 80% of non-residents rate their experiences as very or somewhat satisfying. The most important factors to
5 | P a g e
anglers are the opportunity to fish in a variety of waters and having a large diversity of types of fish to catch. Also important is being able to eat the fish that they catch.
Hunters are satisfied overall with their experience hunting in Colorado. The proportion of hunters rating their experience as very or somewhat satisfying outnumbered those rating somewhat or very unsatisfied by at least a 2:1 margin for elk, deer, mountain lion, and pronghorn. Resident hunters feel that the most important factors in the sport are being able to hunt every year and to harvest the animal for meat. Non-residents prefer hunting every 3-5 years to take a larger, more mature animal and are less interested in harvesting an animal for meat. Access to public lands is also a priority for hunters.
6 | P a g e
1. Introduction In an effort to inform the Colorado Parks and Wildlife (CPW) 2015 Strategic Plan, this report captures
and summarizes important information regarding changes in Colorado’s demographics, trends in
outdoor recreation, public priorities regarding recreation opportunities and natural resource
management, and public satisfaction with CPW. The topics addressed in this report provide background
information and, when combined with a summary of input collected from statewide engagement of
stakeholders, general public, staff and the Parks and Wildlife Commission will inform the development
of the strategic plan. This information is also intended to help the Commission and the Leadership Team
achieve the desired outcomes of the strategic planning process: a shared strategic direction for CPW, a
foundation for long-term financial sustainability, the prioritized use of limited resources, and
establishing values and standards of excellence.
Conditions, trends, and projections presented are intended to provide an objective picture of the
landscape that CPW does and will work within for the strategic planning process. The information
provided can be utilized to develop a future strategy that is built on a solid foundation. The intention of
this report is different than the ‘2013 Customer and Market Trends Report’,1 which provided
interpretations and implications of various customer and market trends. However, some data from that
2013 report are updated in this report.
2. State Demographics and Population Change
2.1 Population trends and projections
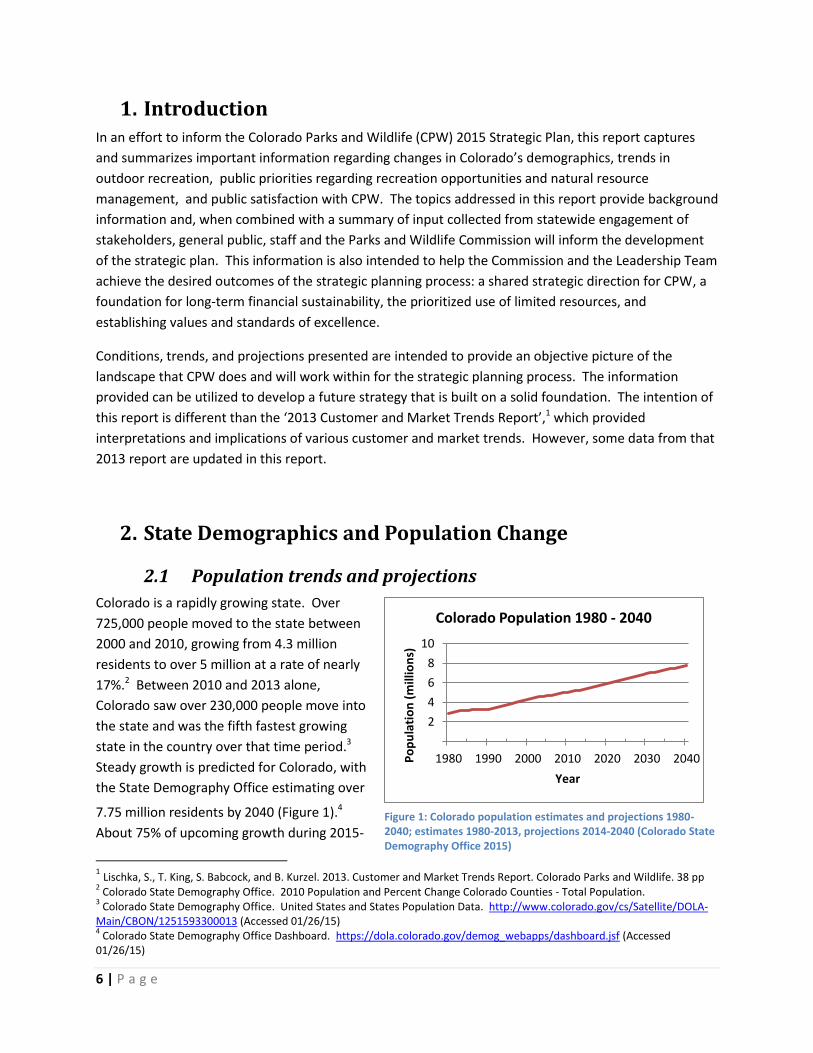
Colorado is a rapidly growing state. Over
725,000 people moved to the state between
2000 and 2010, growing from 4.3 million
residents to over 5 million at a rate of nearly
17%.2 Between 2010 and 2013 alone,
Colorado saw over 230,000 people move into
the state and was the fifth fastest growing
state in the country over that time period.3
Steady growth is predicted for Colorado, with
the State Demography Office estimating over
7.75 million residents by 2040 (Figure 1).4
About 75% of upcoming growth during 2015-
1 Lischka, S., T. King, S. Babcock, and B. Kurzel. 2013. Customer and Market Trends Report. Colorado Parks and Wildlife. 38 pp
2 Colorado State Demography Office. 2010 Population and Percent Change Colorado Counties - Total Population.
3 Colorado State Demography Office. United States and States Population Data. http://www.colorado.gov/cs/Satellite/DOLA-
Main/CBON/1251593300013 (Accessed 01/26/15) 4 Colorado State Demography Office Dashboard. https://dola.colorado.gov/demog_webapps/dashboard.jsf (Accessed
01/26/15)
2
4
6
8
10
1980 1990 2000 2010 2020 2030 2040 Po
pu
lati
on
(m
illio
ns)
Year
Colorado Population 1980 - 2040
Figure 1: Colorado population estimates and projections 1980-2040; estimates 1980-2013, projections 2014-2040 (Colorado State Demography Office 2015)
7 | P a g e
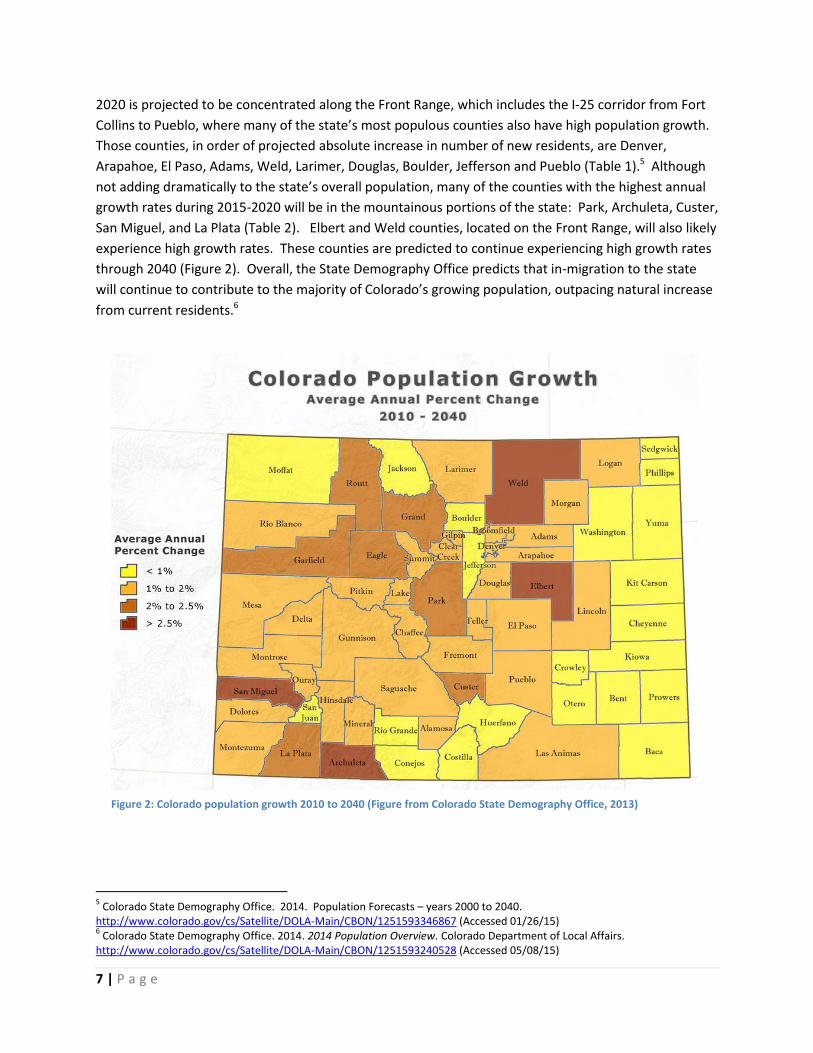
2020 is projected to be concentrated along the Front Range, which includes the I-25 corridor from Fort
Collins to Pueblo, where many of the state’s most populous counties also have high population growth.
Those counties, in order of projected absolute increase in number of new residents, are Denver,
Arapahoe, El Paso, Adams, Weld, Larimer, Douglas, Boulder, Jefferson and Pueblo (Table 1).5 Although
not adding dramatically to the state’s overall population, many of the counties with the highest annual
growth rates during 2015-2020 will be in the mountainous portions of the state: Park, Archuleta, Custer,
San Miguel, and La Plata (Table 2). Elbert and Weld counties, located on the Front Range, will also likely
experience high growth rates. These counties are predicted to continue experiencing high growth rates
through 2040 (Figure 2). Overall, the State Demography Office predicts that in-migration to the state
will continue to contribute to the majority of Colorado’s growing population, outpacing natural increase
from current residents.6
5 Colorado State Demography Office. 2014. Population Forecasts – years 2000 to 2040.
http://www.colorado.gov/cs/Satellite/DOLA-Main/CBON/1251593346867 (Accessed 01/26/15) 6 Colorado State Demography Office. 2014. 2014 Population Overview. Colorado Department of Local Affairs.
http://www.colorado.gov/cs/Satellite/DOLA-Main/CBON/1251593240528 (Accessed 05/08/15)
Figure 3: Colorado population growth 2010 to 2040 (Figure from Colorado State Demography Office, 2013) Figure 2: Colorado population growth 2010 to 2040 (Figure from Colorado State Demography Office, 2013)

Table 1: Top ten counties for projected absolute growth from 2015-2020. The total represents 75% of the state's growth in 2015-2020. (Colorado State Demography Office, 2014)
County Population increase
Denver 53,882
Arapahoe 47,613
El Paso 54,571
Adams 44,611
Weld 45,977
Larimer 32,034
Douglas 35,002
Boulder 17,654
Jefferson 23,982
Pueblo 13,274
Total 368,600
Table 2: Ten counties for highest projected annual growth rate 2015-2020. (Colorado State Demography Office, 2014)
County Average annual growth rate (%)
Total projected growth
Elbert 6.6 9,839
Park 4.2 4,072
Archuleta 3.4 863
Custer 3.4 2,382
San Miguel 3.3 1,521
Weld 3.1 45,977
La Plata 3.0 9,277
Eagle 2.9 8,956
Garfield 2.9 9,558
Lake 2.8 1,192
Not all areas of the state are growing, however, as 17 counties lost population between 2000 and 2010.
Most of the shrinking counties are located in the Eastern Plains and South Central regions of the state.
The counties with rates of population decline more than 10% in the period 2000-2010 are Cheyenne (-
17.7 %), Baca (-16.4%), Huerfano (-14.6%), Mineral (-14.3%), Kiowa (-13.8%), Sedgwick (-13.4%), Prowers
(-13.3%), Jackson (-11.6%), and Lincoln (-10.2%).7 This is part of a continuation of the larger rural-to-
urban migration trend, seen in counties across the United States between 1980 and 2000, as a result of
shrinking rural economies and labor demand.8 Increases and decreases in growth rates are magnified in
counties with small populations as small changes in the number of residents can result in
disproportionately large changes in county growth rates.
With the increase in the state’s population comes more pressure for land development. Recent
estimates indicate that 90,000 acres per year of rural and natural land is being lost to development and
the number of acres of developed land in Colorado reached 2.5 million in 2000.9 The state lost more
than 1.25 million acres of agricultural land between 1997 and 2002.10 Largely as a result of land
development, Colorado’s unique ecosystems are decreasing in extent and biodiversity. Important
ecosystems at risk are shortgrass prairie, sand sage, and greasewood. A 2006 report estimated about
50% of shortgrass prairie remains in a natural state, and that much of the habitat loss is largely due to
agricultural conversion.11
7 Colorado Department of Local Affairs. 2010 Population and Percent Change Colorado Counties - Total Population.
8 Wells, C. “The Great Plains Drain.” The Economist. January 17, 2008. http://www.economist.com/node/10534077 (Accessed
02/03/15) 9 Colorado Conservation Trust, 2007. Conservation at a Crossroads.
10 Environment Colorado Research and Policy Center. 2006. Losing Ground-Colorado’s Vanishing Agricultural Landscape.
11 Neely, B., S. Kettler, J. Horsman, C. Pague, R. Rondeau, R. Smith, L. Grunau, P. Comer, G. Belew, F. Pusateri, B. Rosenlund, D.
Runner, K. Sochi, J. Sovell, D. Anderson, T. Jackson and M. Klavetter. 2006. Central Shortgrass Prairie Ecoregional Assessment and Partnership Initiative. The Nature Conservancy of Colorado and the Shortgrass Prairie Partnership. 124 pp. and Appendices.
9 | P a g e
CPW has both opportunities and challenges that may present themselves from the rapidly increasing
population. This is likely to be especially magnified in the Front Range, where population growth is
going to be most significant.
2.2 Aging of the population
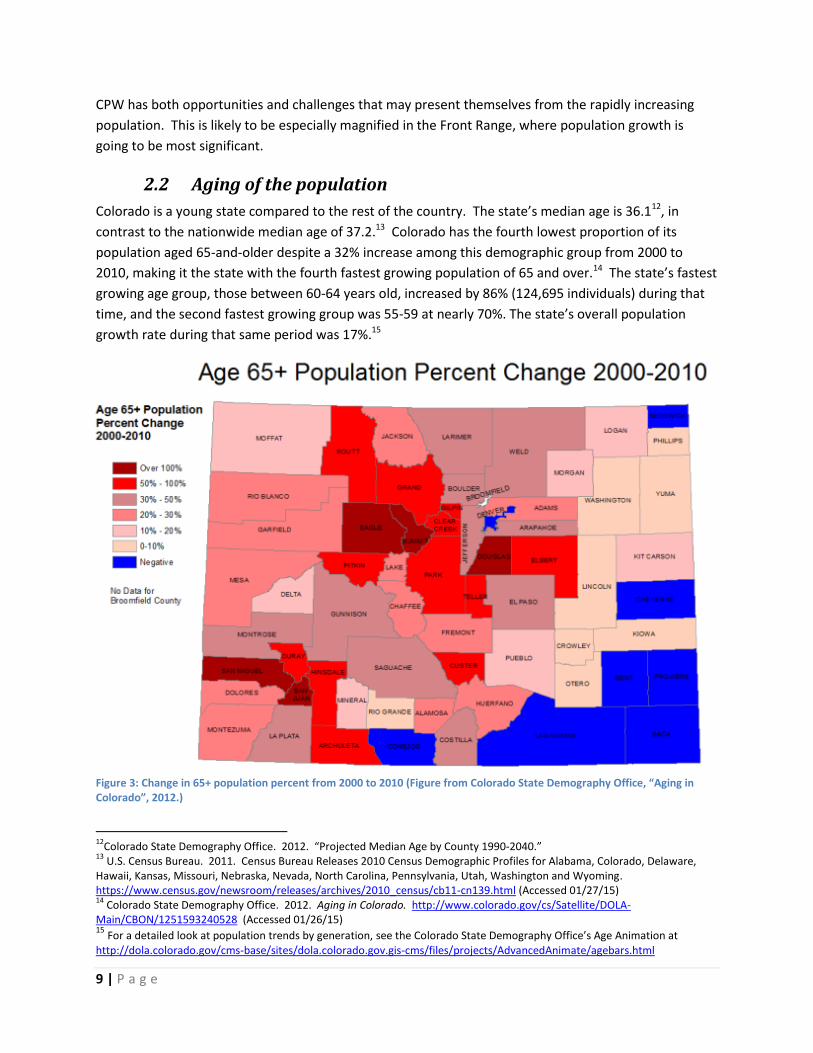
Colorado is a young state compared to the rest of the country. The state’s median age is 36.112, in
contrast to the nationwide median age of 37.2.13 Colorado has the fourth lowest proportion of its
population aged 65-and-older despite a 32% increase among this demographic group from 2000 to
2010, making it the state with the fourth fastest growing population of 65 and over.14 The state’s fastest
growing age group, those between 60-64 years old, increased by 86% (124,695 individuals) during that
time, and the second fastest growing group was 55-59 at nearly 70%. The state’s overall population
growth rate during that same period was 17%.15
12
Colorado State Demography Office. 2012. “Projected Median Age by County 1990-2040.” 13
U.S. Census Bureau. 2011. Census Bureau Releases 2010 Census Demographic Profiles for Alabama, Colorado, Delaware, Hawaii, Kansas, Missouri, Nebraska, Nevada, North Carolina, Pennsylvania, Utah, Washington and Wyoming. https://www.census.gov/newsroom/releases/archives/2010_census/cb11-cn139.html (Accessed 01/27/15) 14
Colorado State Demography Office. 2012. Aging in Colorado. http://www.colorado.gov/cs/Satellite/DOLA-Main/CBON/1251593240528 (Accessed 01/26/15) 15
For a detailed look at population trends by generation, see the Colorado State Demography Office’s Age Animation at http://dola.colorado.gov/cms-base/sites/dola.colorado.gov.gis-cms/files/projects/AdvancedAnimate/agebars.html
Figure 3: Change in 65+ population percent from 2000 to 2010 (Figure from Colorado State Demography Office, “Aging in Colorado”, 2012.)
10 | P a g e
The Eastern Plains and San Luis Valley have the largest share of their populations age 65 and older,
though more than 45% of the state’s over-65 population lives along the Front Range in Jefferson,
Denver, Arapahoe, and El Paso counties. From 2000 to 2010, the largest change in over-65 share of
population was in resort-oriented mountain counties (e.g., Eagle, Summit and San Juan) and Douglas
County (Figure 3). Many of these counties had low 65+ populations to begin with, but the trends show
that a smaller base of older adults is rapidly growing as the populations of the counties age.
Although only 11% of the state’s population is currently over the age of 65, this portion is expected to
increase by 150% between 2010 and 2030. This is almost exclusively due to the natural aging of the
state’s 1.3 million Baby Boomers (age 46-64 in 2010) as opposed to in-migration of 65+ adults, which is
relatively low. In 2010-2040, the fastest over-65 growth will be along Front Range counties and Western
Slope resort-oriented counties.16 As the state’s population ages, individual households will see shifts in
income, leisure time, and activity preferences which will all impact the outdoor recreation sector. In
Oregon, aging recreationalists were found to make fewer visits to backcountry areas in federal lands,
instead opting for outdoor recreation in nearby or easy access locations more often provided by state
and local agencies.17 Additionally, the baby boomer generation is maintaining better levels of health
later into life, have higher levels of income, and are known to “work hard, play hard and spend hard”18
in outdoor recreation pursuits. By 2030, one million Coloradans are expected to age out of the
workforce.19 A shift of this magnitude in the population could have dramatic impacts on outdoor
recreation demand as individuals may change how they prioritize expenses on outdoor activities among
competing household expenditures.
2.3 Diversification of the population
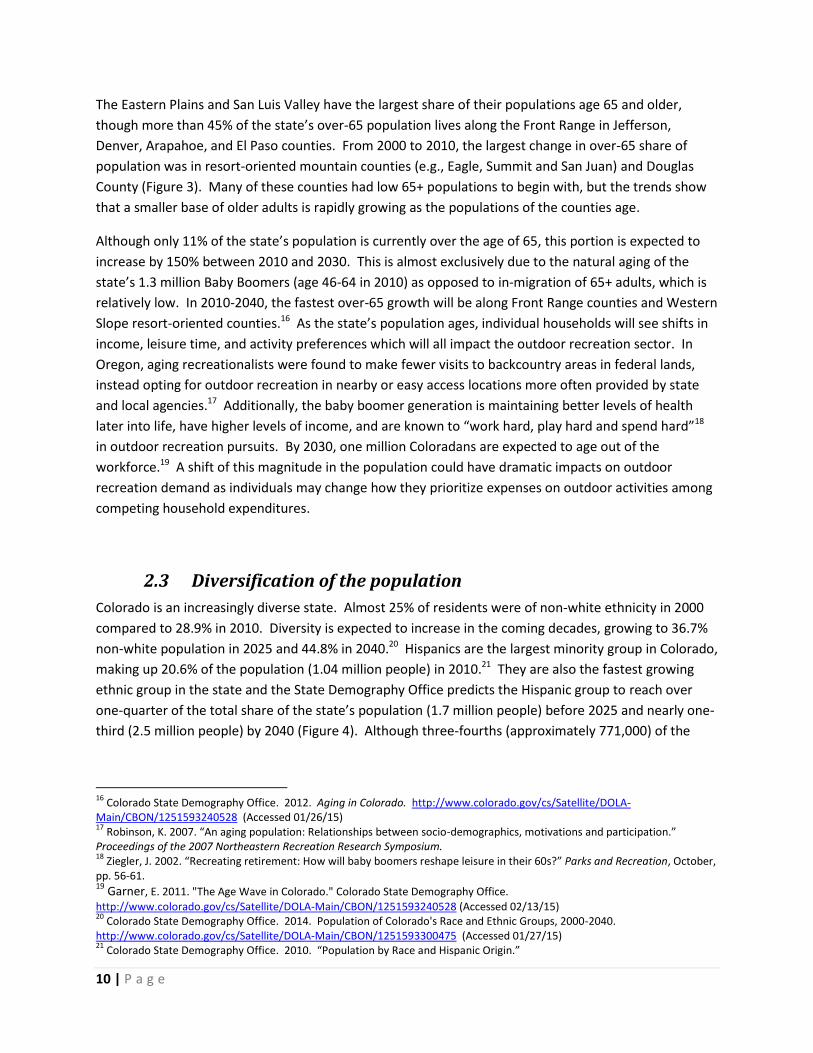
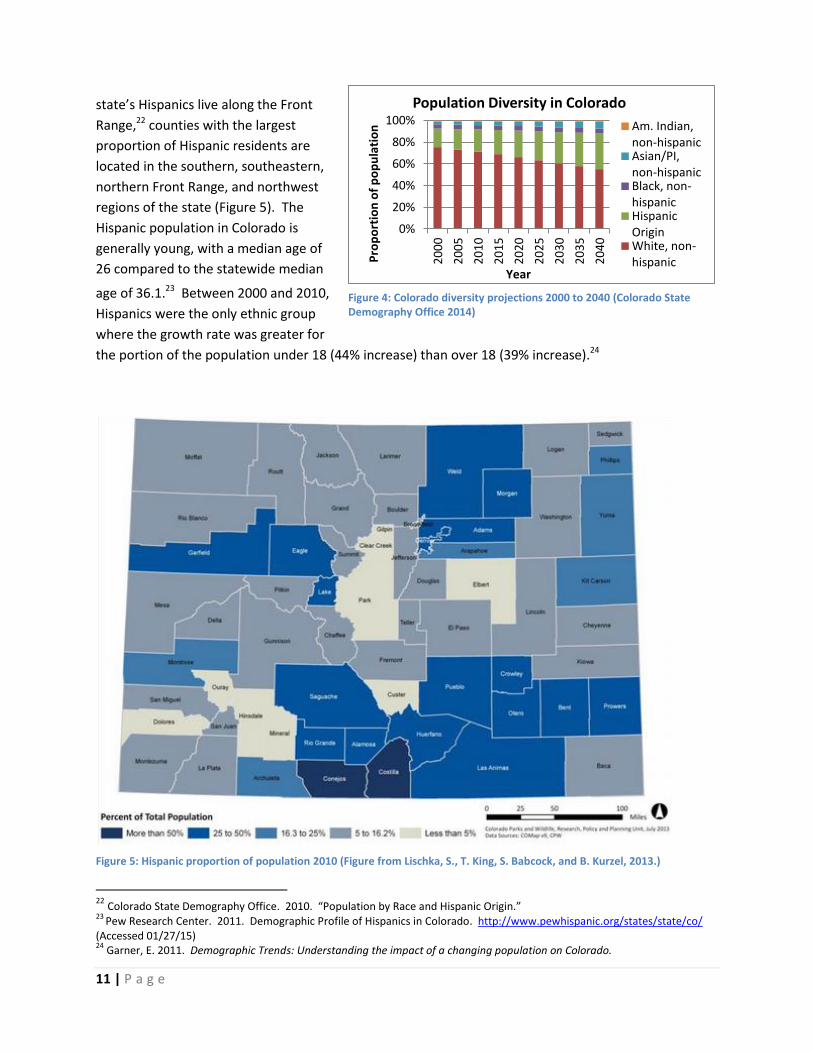
Colorado is an increasingly diverse state. Almost 25% of residents were of non-white ethnicity in 2000
compared to 28.9% in 2010. Diversity is expected to increase in the coming decades, growing to 36.7%
non-white population in 2025 and 44.8% in 2040.20 Hispanics are the largest minority group in Colorado,
making up 20.6% of the population (1.04 million people) in 2010.21 They are also the fastest growing
ethnic group in the state and the State Demography Office predicts the Hispanic group to reach over
one-quarter of the total share of the state’s population (1.7 million people) before 2025 and nearly one-
third (2.5 million people) by 2040 (Figure 4). Although three-fourths (approximately 771,000) of the
16
Colorado State Demography Office. 2012. Aging in Colorado. http://www.colorado.gov/cs/Satellite/DOLA-Main/CBON/1251593240528 (Accessed 01/26/15) 17
Robinson, K. 2007. “An aging population: Relationships between socio-demographics, motivations and participation.” Proceedings of the 2007 Northeastern Recreation Research Symposium. 18
Ziegler, J. 2002. “Recreating retirement: How will baby boomers reshape leisure in their 60s?” Parks and Recreation, October, pp. 56-61. 19
Garner, E. 2011. "The Age Wave in Colorado." Colorado State Demography Office. http://www.colorado.gov/cs/Satellite/DOLA-Main/CBON/1251593240528 (Accessed 02/13/15) 20
Colorado State Demography Office. 2014. Population of Colorado's Race and Ethnic Groups, 2000-2040. http://www.colorado.gov/cs/Satellite/DOLA-Main/CBON/1251593300475 (Accessed 01/27/15) 21
Colorado State Demography Office. 2010. “Population by Race and Hispanic Origin.”
11 | P a g e
state’s Hispanics live along the Front
Range,22 counties with the largest
proportion of Hispanic residents are
located in the southern, southeastern,
northern Front Range, and northwest
regions of the state (Figure 5). The
Hispanic population in Colorado is
generally young, with a median age of
26 compared to the statewide median
age of 36.1.23 Between 2000 and 2010,
Hispanics were the only ethnic group
where the growth rate was greater for
the portion of the population under 18 (44% increase) than over 18 (39% increase).24
Figure 5: Hispanic proportion of population 2010 (Figure from Lischka, S., T. King, S. Babcock, and B. Kurzel, 2013.)
22
Colorado State Demography Office. 2010. “Population by Race and Hispanic Origin.” 23
Pew Research Center. 2011. Demographic Profile of Hispanics in Colorado. http://www.pewhispanic.org/states/state/co/ (Accessed 01/27/15) 24
Garner, E. 2011. Demographic Trends: Understanding the impact of a changing population on Colorado.
0%
20%
40%
60%
80%
100%
20
00
20
05
20
10
20
15
20
20
20
25
20
30
20
35
20
40
Pro
po
rtio
n o
f p
op
ula
tio
n
Year
Population Diversity in Colorado
Am. Indian, non-hispanic Asian/PI, non-hispanic Black, non-hispanic Hispanic Origin White, non-hispanic
Figure 4: Colorado diversity projections 2000 to 2040 (Colorado State Demography Office 2014)
12 | P a g e
Research on Hispanic preferences and expectations regarding outdoor recreation reveal interesting
insights. Hispanics indicated that spending time with immediate and extended family is important and
that spending leisure time together is key to maintaining and strengthening family ties. They also
reported having only one day off per week, which would mean that outdoor trips are usually just for the
day. Studies on group sizes at outdoor recreation sites showed an average of 8 to 15 people per group,
with some groups having more than 100 people. Picnics for Hispanic families may last between 6 to 10
hours as meals are prepared from scratch, resulting in long occupancy at picnic sites.25 Similar to the
trend of Hispanic youth spending more time outside, national research indicates Hispanics spend more
time than non-Hispanics visiting beaches and historic sites, and cycling.26
Conservation and environmental protection are priorities in the Hispanic community, according to the
2015 Conservation in the West poll. Protecting natural areas for future generations and conserving
wildlife habitat were the top two priorities among Hispanics for public lands, rated as very important by
91 percent and 84 percent of respondents, respectively.27 These came higher than ensuring public
access for outdoor recreation, development for minerals or energy, and livestock grazing. Hispanics
expressed greater concern for nearly all environmental issues than overall respondents.
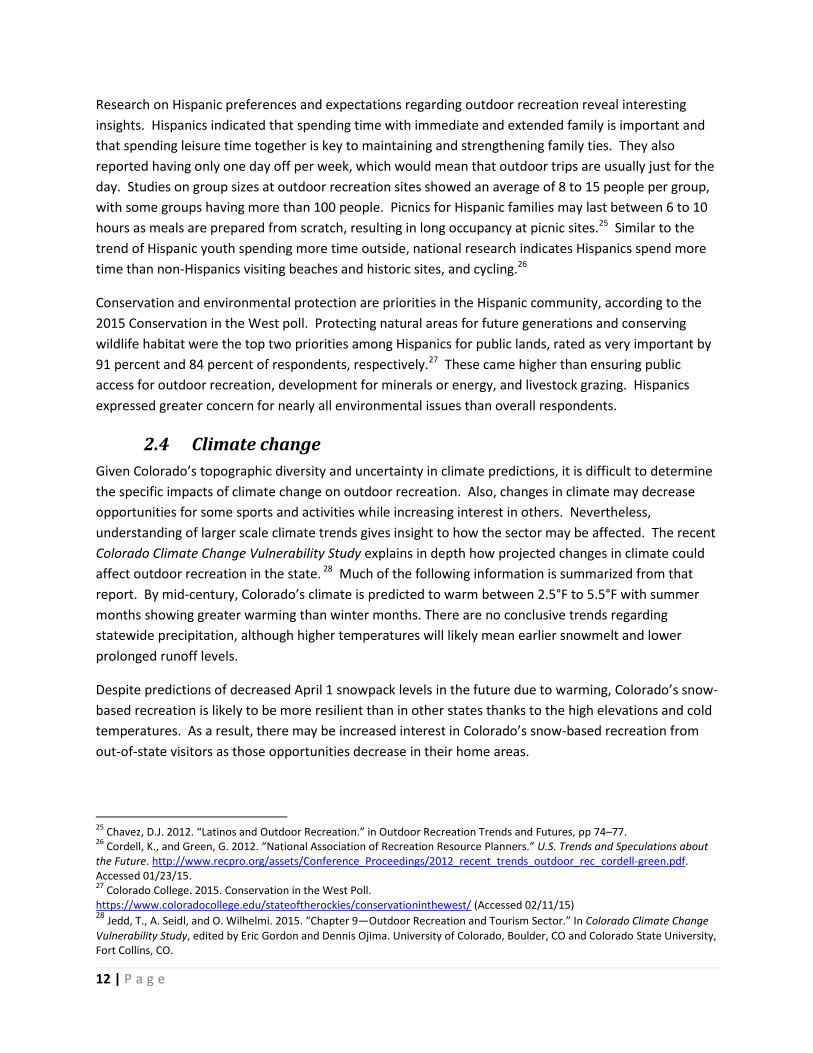
2.4 Climate change
Given Colorado’s topographic diversity and uncertainty in climate predictions, it is difficult to determine
the specific impacts of climate change on outdoor recreation. Also, changes in climate may decrease
opportunities for some sports and activities while increasing interest in others. Nevertheless,
understanding of larger scale climate trends gives insight to how the sector may be affected. The recent
Colorado Climate Change Vulnerability Study explains in depth how projected changes in climate could
affect outdoor recreation in the state. 28 Much of the following information is summarized from that
report. By mid-century, Colorado’s climate is predicted to warm between 2.5°F to 5.5°F with summer
months showing greater warming than winter months. There are no conclusive trends regarding
statewide precipitation, although higher temperatures will likely mean earlier snowmelt and lower
prolonged runoff levels.
Despite predictions of decreased April 1 snowpack levels in the future due to warming, Colorado’s snow-
based recreation is likely to be more resilient than in other states thanks to the high elevations and cold
temperatures. As a result, there may be increased interest in Colorado’s snow-based recreation from
out-of-state visitors as those opportunities decrease in their home areas.
25
Chavez, D.J. 2012. “Latinos and Outdoor Recreation.” in Outdoor Recreation Trends and Futures, pp 74–77. 26
Cordell, K., and Green, G. 2012. “National Association of Recreation Resource Planners.” U.S. Trends and Speculations about the Future. http://www.recpro.org/assets/Conference_Proceedings/2012_recent_trends_outdoor_rec_cordell-green.pdf. Accessed 01/23/15. 27
Colorado College. 2015. Conservation in the West Poll. https://www.coloradocollege.edu/stateoftherockies/conservationinthewest/ (Accessed 02/11/15) 28
Jedd, T., A. Seidl, and O. Wilhelmi. 2015. “Chapter 9—Outdoor Recreation and Tourism Sector.” In Colorado Climate Change
Vulnerability Study, edited by Eric Gordon and Dennis Ojima. University of Colorado, Boulder, CO and Colorado State University, Fort Collins, CO.
13 | P a g e
Increased temperatures, longer growing seasons, and more arid conditions will likely result in more
overall vegetation growth, leading to the possibility of more frequent and higher intensity forest fires.29
More and larger wildfires can reduce access for outdoor recreation, damage infrastructure like roads,
trails and buildings, and lead to closures in other areas to reduce the dangers of new human-caused
wildfires. Similarly, extreme flood events can cause severe damage to recreation-based infrastructure
leading to reduced access and area closures.
Changes in plant and animal behavior and distribution will likely decrease outdoor recreation
opportunities for most related activities. Coldwater fish species, which are largely favored by anglers in
Colorado, will see a reduction in habitat in lowland areas with lower streamflows and increased
temperatures. Terrestrial habitat for game and non-game species is predicted to decline in suitability
resulting from more frequent drought conditions. Colorado Parks and Wildlife has already reported on
negatively impacted pheasant populations30 and deer herds31 owing to reduced habitat amount and
quality. As habitat changes, generalist species (e.g. coyotes, raccoons) are likely to better adapt to the
new conditions better specialist species (e.g. moose, marmots). Consequently, there may be fewer
opportunities for wildlife watchers to see unique species.
With increased summer temperatures, demand for water-based recreation is predicted to increase as
visitors take advantage of swimming, boating, paddling, and other water sports to help cool off. This will
likely come despite reduced levels in reservoirs and rivers resulting from greater evaporation rates and
more demands on water resources from downstream users. As a result, reservoir based recreation may
become more crowded and the viability of river-based activities could be negatively impacted. Already,
declines have been observed in white-water rafting in drought years.32
3. Trends in Outdoor Recreation Coloradans rank a clean environment and outdoor recreation opportunities as the top reasons they live
in the state. In the 2015 Conservation in the West poll, residents said having clean air, water and a
healthy environment was the leading reason for why they choose to live here: 90% of those polled rated
it as a significant factor as to why they chose to live in Colorado.33 More than one half of respondents
said living near public lands and having the chance to enjoy them (55%), as well as an outdoor lifestyle
(54%), had a strong impact on the choice to call Colorado home. A clean environment, proximity to
public lands, and an outdoor lifestyle, rated higher than all other options, including economic
opportunities, quality of public schools, and cost of living.
29
Williamson, S., M. Ruth, K. Ross, and D. Irani. 2008. Economic impacts of climate change on Colorado. The Center for Integrative Environmental Research. 30
Colorado Parks and Wildlife. 2013. “Drought continues to factor in pheasant/quail hunting.” Colorado Parks and Wildlife Press Release. http://dnr.state.co.us/newsapp/press.asp?PressId=8647 (Accessed 05/08/15) 31
Colorado Parks and Wildlife. 2013. “Public can comment on deer management planning in southwest Colorado.” Colorado Parks and Wildlife Press Release. http://dnr.state.co.us/newsapp/press.asp?pressid=8644 (Accessed 05/08/15) 32
Shrestha, P. and K. Schoengold. 2008. “Potential Economic Impact of Drought on Rafting Activity.” Cornhusker Economics, Paper 362. http://digitalcommons.unl.edu/cgi/viewcontent.cgi?article=1363&context=agecon_cornhusker (Accessed 05/08/15) 33
Colorado College. 2015. Conservation in the West Poll. https://www.coloradocollege.edu/stateoftherockies/conservationinthewest/ (Accessed 02/11/15)
14 | P a g e
Colorado is known for its outdoor reputation, and Coloradans are an active group. The 2014 State
Comprehensive Outdoor Recreation Plan (SCORP) reports that 90% of state residents participated in
some form of outdoor activity in the previous year and two thirds of residents recreated in the outdoors
at least once a week on average.34 The report also states that 60% of Coloradans expect to greatly
increase or somewhat increase their level of outdoor recreation participation in the next five years. This
may have significant implications on CPW’s ability to provide the high level of service that it does
currently.
3.1 Overall Participation Numbers
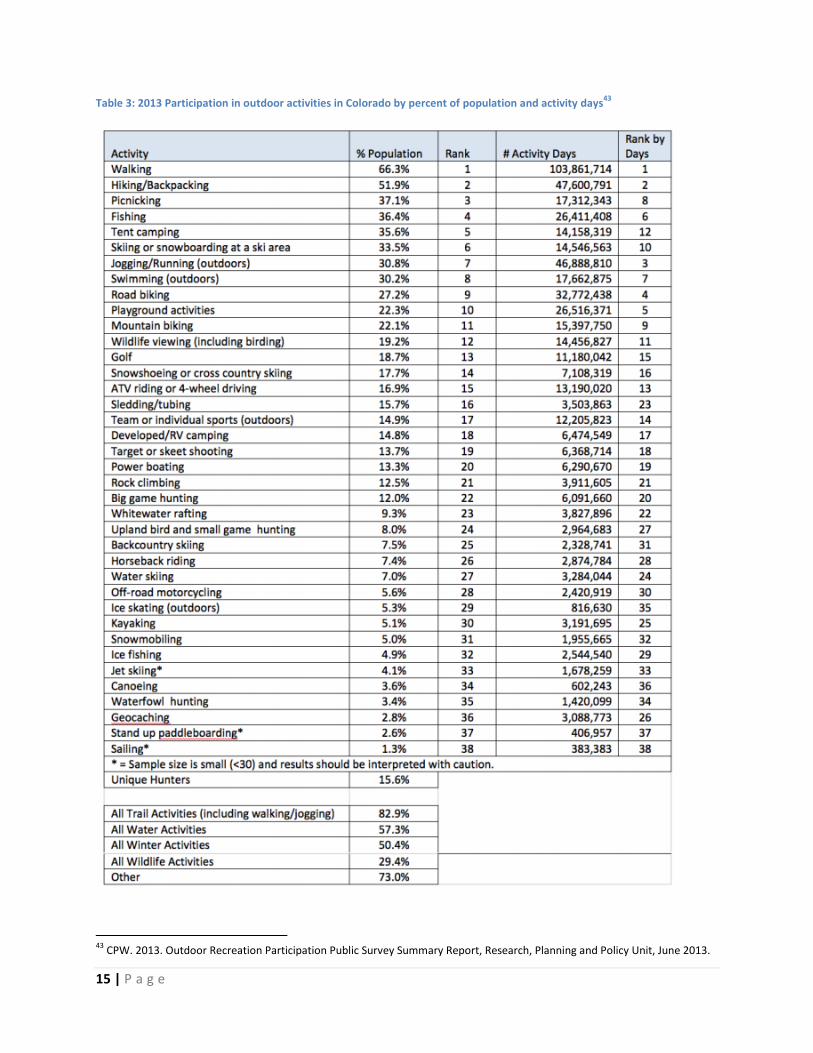
Across the state, walking and hiking/backpacking are the most popular outdoor activities, determined by
total statewide number of activity days as well as the percentage of the population participating (Table
3).35 An activity day is counted as any amount of time spent on an activity in a given day, whether for
less than an hour or all day, and regardless of whether or not the activity was the primary reason for
recreating outdoors.36 More than 80% of all Coloradans participate in trail- or road-based recreation
opportunities (e.g., walking, hiking, jogging, bicycling, off-highway vehicle use, etc.) and over 50% of
Coloradans participate in water-based recreation such as fishing, boating, water skiing, and whitewater
rafting.37 Great Outdoors Colorado found activity popularity rankings to be similar based on survey
responses in 2014, with over 60% of respondents participating in trail recreation, picnicking, water
recreation, and wildlife watching.38 Additionally, almost 1.5 million Colorado residents over the age of 15
participate in some form of wildlife-watching.39
Although the SCORP reports that day trips make up 80% of outdoor recreation trips, state residents are
taking more overnight trips. Coloradans accounted for 36% of the state’s overnight visitors in 2013,
down slightly from 40% in 201240 but still a large contributor compared to just over 20% in 1992.41 The
Denver and Colorado Springs-Pueblo urban areas generated more overnight visits in the state than any
other urban area in the country.42 Research for the SCORP report found that for overnight outdoor trips,
tent camping is the most preferred (43%), followed by hotels and motels (32%) and RV camping (18%).
These preferences may be relevant to CPW’s future strategies related to amenities in State Parks.
34
CPW. 2014. State Comprehensive Outdoor Recreation Plan. 35
Lischka, S., T. King, S. Babcock, and B. Kurzel. 2013. Customer and Market Trends Report. Colorado Parks and Wildlife. 38 pp. 36
National Survey on Recreation and the Environment (NSRE): 2000-2002. The Interagency National Survey Consortium,
Coordinated by the USDA Forest Service, Recreation, Wilderness, and Demographics Trends Research Group, Athens, GA and the Human Dimensions Research Laboratory, University of Tennessee, Knoxville, TN. 37
CPW. 2014. State Comprehensive Outdoor Recreation Plan. Page 36. 38
Great Outdoors Colorado. 2014. Great Outdoors Colorado Situation Analysis. Page 20. 39
U.S.Department of the Interior, U.S.Fish and Wildlife Service, and U.S.Department of Commerce, U.S.Census Bureau.2011
National Survey of Fishing, Hunting, and Wildlife-Associated Recreation. 40
Longwoods International. 2013. “Colorado Travel Year 2013.” http://www.colorado.com/sites/default/master/files/Colorado2013VisitorFinalReportOnline_final.pdf (Accessed 02/13/15) 41
Longwoods International. 2011. “Colorado Travel Year 2011.” http://industry.colorado.com/research/longwoods-international (Accessed 02/13/15) 42
Longwoods International. 2013. “Colorado Travel Year 2013.” http://www.colorado.com/sites/default/master/files/Colorado2013VisitorFinalReportOnline_final.pdf (Accessed 02/13/15)
15 | P a g e
Table 3: 2013 Participation in outdoor activities in Colorado by percent of population and activity days43
43
CPW. 2013. Outdoor Recreation Participation Public Survey Summary Report, Research, Planning and Policy Unit, June 2013.
16 | P a g e
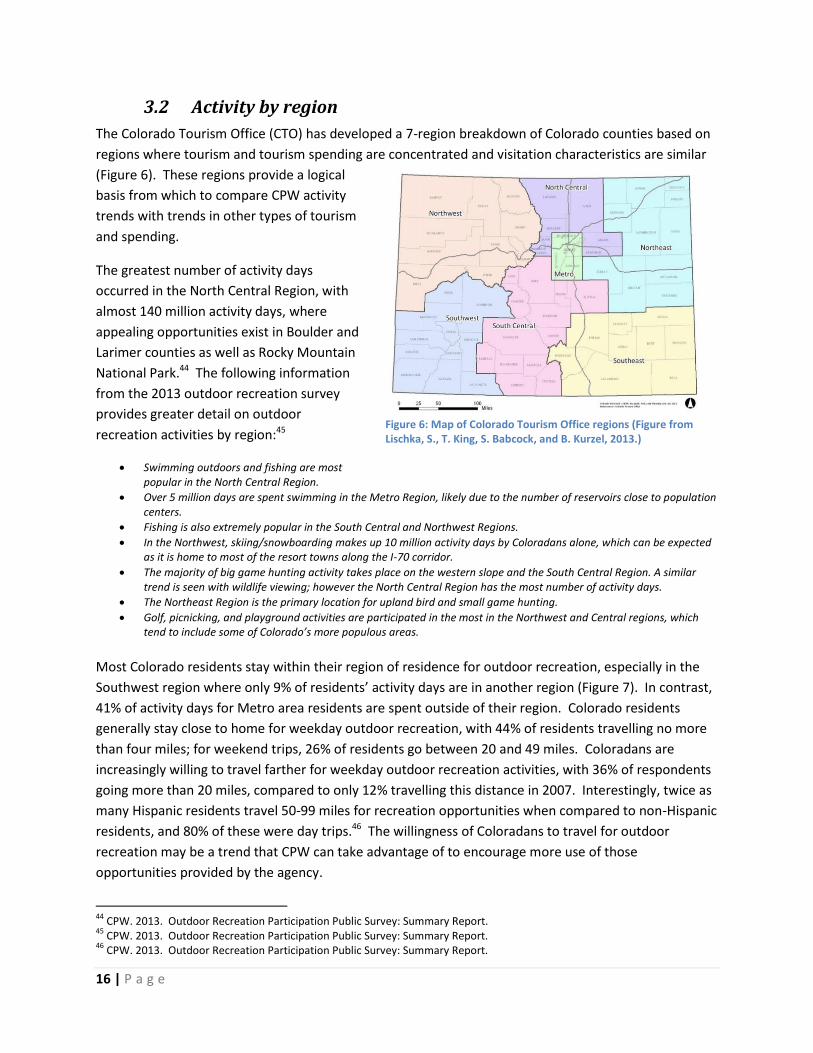
3.2 Activity by region
The Colorado Tourism Office (CTO) has developed a 7-region breakdown of Colorado counties based on
regions where tourism and tourism spending are concentrated and visitation characteristics are similar
(Figure 6). These regions provide a logical
basis from which to compare CPW activity
trends with trends in other types of tourism
and spending.
The greatest number of activity days
occurred in the North Central Region, with
almost 140 million activity days, where
appealing opportunities exist in Boulder and
Larimer counties as well as Rocky Mountain
National Park.44 The following information
from the 2013 outdoor recreation survey
provides greater detail on outdoor
recreation activities by region:45
Swimming outdoors and fishing are most popular in the North Central Region.
Over 5 million days are spent swimming in the Metro Region, likely due to the number of reservoirs close to population centers.
Fishing is also extremely popular in the South Central and Northwest Regions.
In the Northwest, skiing/snowboarding makes up 10 million activity days by Coloradans alone, which can be expected as it is home to most of the resort towns along the I-70 corridor.
The majority of big game hunting activity takes place on the western slope and the South Central Region. A similar trend is seen with wildlife viewing; however the North Central Region has the most number of activity days.
The Northeast Region is the primary location for upland bird and small game hunting.
Golf, picnicking, and playground activities are participated in the most in the Northwest and Central regions, which tend to include some of Colorado’s more populous areas.
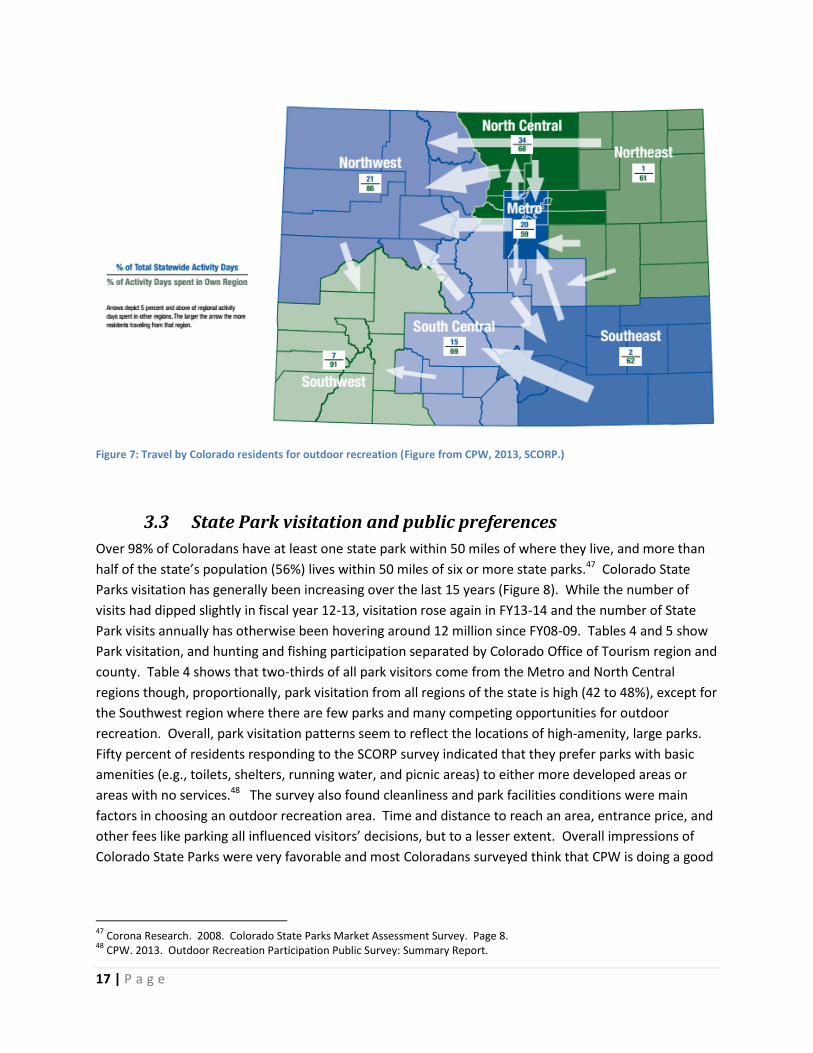
Most Colorado residents stay within their region of residence for outdoor recreation, especially in the
Southwest region where only 9% of residents’ activity days are in another region (Figure 7). In contrast,
41% of activity days for Metro area residents are spent outside of their region. Colorado residents
generally stay close to home for weekday outdoor recreation, with 44% of residents travelling no more
than four miles; for weekend trips, 26% of residents go between 20 and 49 miles. Coloradans are
increasingly willing to travel farther for weekday outdoor recreation activities, with 36% of respondents
going more than 20 miles, compared to only 12% travelling this distance in 2007. Interestingly, twice as
many Hispanic residents travel 50-99 miles for recreation opportunities when compared to non-Hispanic
residents, and 80% of these were day trips.46 The willingness of Coloradans to travel for outdoor
recreation may be a trend that CPW can take advantage of to encourage more use of those
opportunities provided by the agency.
44
CPW. 2013. Outdoor Recreation Participation Public Survey: Summary Report. 45
CPW. 2013. Outdoor Recreation Participation Public Survey: Summary Report. 46
CPW. 2013. Outdoor Recreation Participation Public Survey: Summary Report.
Figure 5: Map of Colorado Tourism Office regions (from Lischka, S., T. King, S. Babcock, and B. Kurzel, 2013.) Figure 6: Map of Colorado Tourism Office regions (Figure from Lischka, S., T. King, S. Babcock, and B. Kurzel, 2013.)
17 | P a g e
Figure 7: Travel by Colorado residents for outdoor recreation (Figure from CPW, 2013, SCORP.)
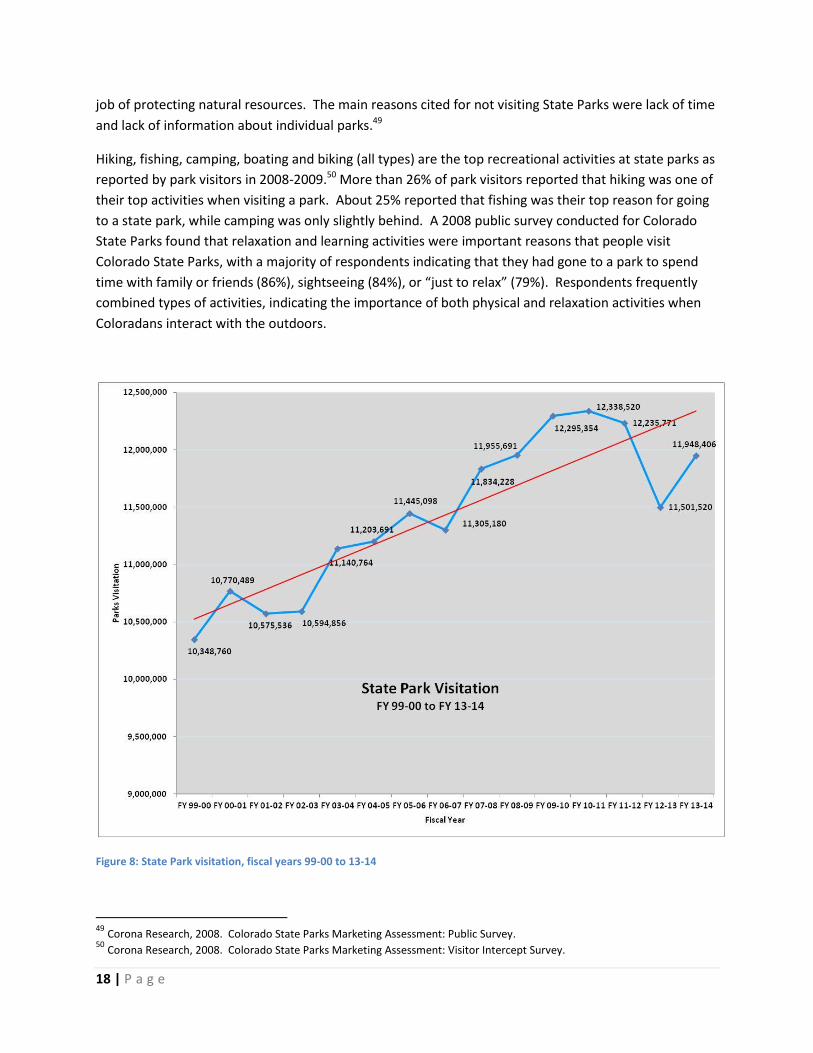
3.3 State Park visitation and public preferences
Over 98% of Coloradans have at least one state park within 50 miles of where they live, and more than
half of the state’s population (56%) lives within 50 miles of six or more state parks.47 Colorado State
Parks visitation has generally been increasing over the last 15 years (Figure 8). While the number of
visits had dipped slightly in fiscal year 12-13, visitation rose again in FY13-14 and the number of State
Park visits annually has otherwise been hovering around 12 million since FY08-09. Tables 4 and 5 show
Park visitation, and hunting and fishing participation separated by Colorado Office of Tourism region and
county. Table 4 shows that two-thirds of all park visitors come from the Metro and North Central
regions though, proportionally, park visitation from all regions of the state is high (42 to 48%), except for
the Southwest region where there are few parks and many competing opportunities for outdoor
recreation. Overall, park visitation patterns seem to reflect the locations of high-amenity, large parks.
Fifty percent of residents responding to the SCORP survey indicated that they prefer parks with basic
amenities (e.g., toilets, shelters, running water, and picnic areas) to either more developed areas or
areas with no services.48 The survey also found cleanliness and park facilities conditions were main
factors in choosing an outdoor recreation area. Time and distance to reach an area, entrance price, and
other fees like parking all influenced visitors’ decisions, but to a lesser extent. Overall impressions of
Colorado State Parks were very favorable and most Coloradans surveyed think that CPW is doing a good
47
Corona Research. 2008. Colorado State Parks Market Assessment Survey. Page 8. 48
CPW. 2013. Outdoor Recreation Participation Public Survey: Summary Report.
18 | P a g e
job of protecting natural resources. The main reasons cited for not visiting State Parks were lack of time
and lack of information about individual parks.49
Hiking, fishing, camping, boating and biking (all types) are the top recreational activities at state parks as
reported by park visitors in 2008-2009.50 More than 26% of park visitors reported that hiking was one of
their top activities when visiting a park. About 25% reported that fishing was their top reason for going
to a state park, while camping was only slightly behind. A 2008 public survey conducted for Colorado
State Parks found that relaxation and learning activities were important reasons that people visit
Colorado State Parks, with a majority of respondents indicating that they had gone to a park to spend
time with family or friends (86%), sightseeing (84%), or “just to relax” (79%). Respondents frequently
combined types of activities, indicating the importance of both physical and relaxation activities when
Coloradans interact with the outdoors.
Figure 8: State Park visitation, fiscal years 99-00 to 13-14
49
Corona Research, 2008. Colorado State Parks Marketing Assessment: Public Survey. 50
Corona Research, 2008. Colorado State Parks Marketing Assessment: Visitor Intercept Survey.

19 | P a g e
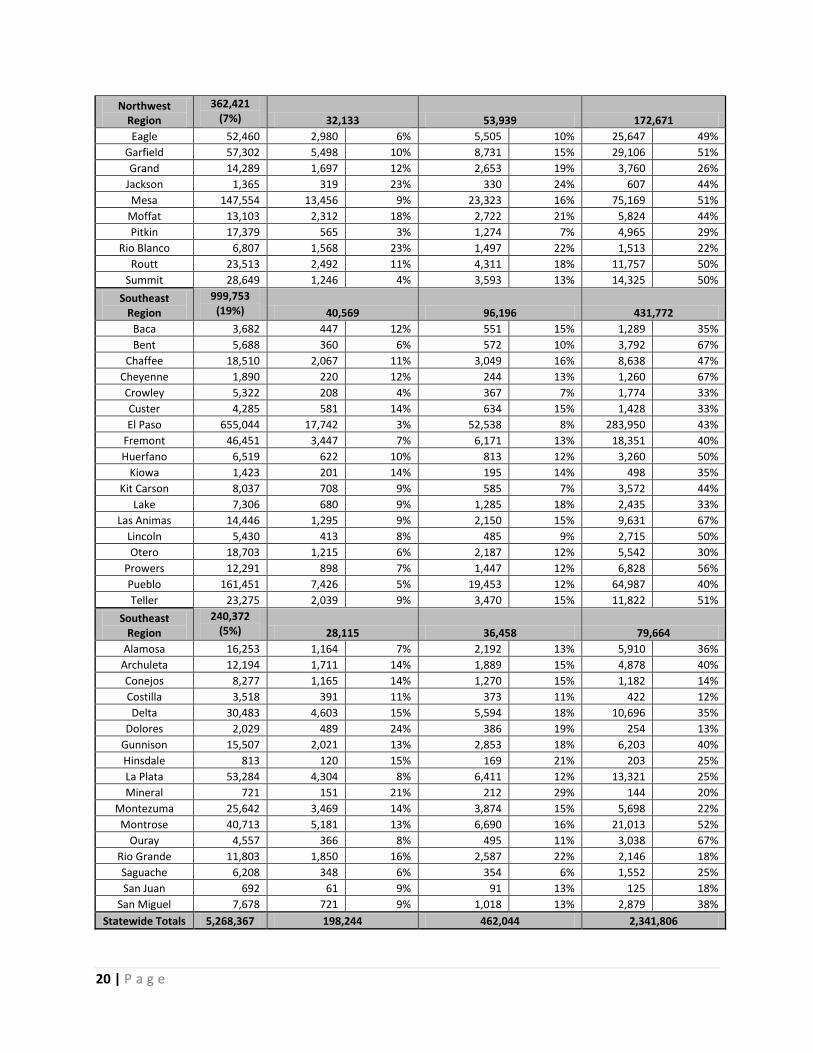
Table 4: Hunting, fishing, and park visitation numbers in 2013 by Colorado Tourism Office region
Table 5: 2013 Hunting, fishing, and park visitation by county (organized by CPW Region).
Hunting Fishing Park Visitation
CPW Regions 2013
Population
Number of Unique
Hunters51
% of
Population
Number of Unique
Fishermen52
% of
Population
Unique Park
Visitors53
% of
Population
Northeast Region
3,665,821 (70%) 97,427 275,451 1,657,699
Adams 469,193 11,413 2% 36,770 8% 227,488 48%
Arapahoe 607,070 9,042 1% 33,977 6% 295,394 49%
Boulder 310,048 5,867 2% 19,550 6% 145,749 47%
Broomfield 59,471 1,775 3% 5,350 9% 22,599 38%
Clear Creek 9,031 368 4% 737 8% 2,007 22%
Denver 649,495 5,440 1% 29,505 5% 286,259 44%
Douglas 305,963 9,133 3% 22,919 7% 122,985 40%
Elbert 23,733 1,555 7% 2,197 9% 11,867 50%
Gilpin 5,601 322 6% 561 10% 1,400 25%
Jefferson 551,798 19,093 3% 54,262 10% 250,148 45%
Larimer 315,988 13,208 4% 31,011 10% 139,162 44%
Logan 22,450 1,573 7% 2,559 11% 12,472 56%
Morgan 28,404 1,754 6% 3,280 12% 11,046 39%
Park 16,121 1,481 9% 2,409 15% 7,816 48%
Phillips 4,356 447 10% 421 10% 653 15%
Sedgwick 2,360 248 11% 318 13% 787 33%
Washington 4,803 493 10% 532 11% 640 13%
Weld 269,785 13,257 5% 28,158 10% 117,380 44%
Yuma 10,151 958 9% 935 9% 1,846 18%
51
Number of resident hunters with home address zip codes in the county (2013 license year). 52
Number of resident anglers with home address zip codes in the county (2013 license year). 53
Number of unique visitors to state parks who resided in county, as reported in 2008 Market Assessment Study (Corona Research, 2009). Updated to reflect 2013 population (U.S. Census Bureau, 2014).
Hunting Fishing Park Visitation
2013 Population
Number of Unique Hunters
Percentage of Statewide Hunters
% of Population
Number of Unique Fishermen
Percentage of Statewide Fishermen
% of Population
Number of Unique Park Visitors
% of Population
Northeast 111,614 8,369 4% 7% 11,556 3% 10% 46,858 42%
North Central 1,986,716 53,477 27% 2% 150,764 33% 8% 928,580 47%
Northwest 362,421 32,133 16% 8% 53,939 12% 15% 172,671 48%
Southeast 229,525 12,672 6% 5% 27,735 6% 12% 97,599 43%
South Central 817,772 33,106 17% 4% 76,544 17% 9% 345,798 42%
Southwest 193,592 23,046 12% 11% 29,470 6% 15% 68,307 35%
Metro 1,566,727 35,441 18% 2% 112,036 24% 7% 681,991 44%
20 | P a g e
Northwest Region
362,421 (7%) 32,133 53,939 172,671
Eagle 52,460 2,980 6% 5,505 10% 25,647 49%
Garfield 57,302 5,498 10% 8,731 15% 29,106 51%
Grand 14,289 1,697 12% 2,653 19% 3,760 26%
Jackson 1,365 319 23% 330 24% 607 44%
Mesa 147,554 13,456 9% 23,323 16% 75,169 51%
Moffat 13,103 2,312 18% 2,722 21% 5,824 44%
Pitkin 17,379 565 3% 1,274 7% 4,965 29%
Rio Blanco 6,807 1,568 23% 1,497 22% 1,513 22%
Routt 23,513 2,492 11% 4,311 18% 11,757 50%
Summit 28,649 1,246 4% 3,593 13% 14,325 50%
Southeast Region
999,753 (19%) 40,569 96,196 431,772
Baca 3,682 447 12% 551 15% 1,289 35%
Bent 5,688 360 6% 572 10% 3,792 67%
Chaffee 18,510 2,067 11% 3,049 16% 8,638 47%
Cheyenne 1,890 220 12% 244 13% 1,260 67%
Crowley 5,322 208 4% 367 7% 1,774 33%
Custer 4,285 581 14% 634 15% 1,428 33%
El Paso 655,044 17,742 3% 52,538 8% 283,950 43%
Fremont 46,451 3,447 7% 6,171 13% 18,351 40%
Huerfano 6,519 622 10% 813 12% 3,260 50%
Kiowa 1,423 201 14% 195 14% 498 35%
Kit Carson 8,037 708 9% 585 7% 3,572 44%
Lake 7,306 680 9% 1,285 18% 2,435 33%
Las Animas 14,446 1,295 9% 2,150 15% 9,631 67%
Lincoln 5,430 413 8% 485 9% 2,715 50%
Otero 18,703 1,215 6% 2,187 12% 5,542 30%
Prowers 12,291 898 7% 1,447 12% 6,828 56%
Pueblo 161,451 7,426 5% 19,453 12% 64,987 40%
Teller 23,275 2,039 9% 3,470 15% 11,822 51%
Southeast Region
240,372 (5%) 28,115 36,458 79,664
Alamosa 16,253 1,164 7% 2,192 13% 5,910 36%
Archuleta 12,194 1,711 14% 1,889 15% 4,878 40%
Conejos 8,277 1,165 14% 1,270 15% 1,182 14%
Costilla 3,518 391 11% 373 11% 422 12%
Delta 30,483 4,603 15% 5,594 18% 10,696 35%
Dolores 2,029 489 24% 386 19% 254 13%
Gunnison 15,507 2,021 13% 2,853 18% 6,203 40%
Hinsdale 813 120 15% 169 21% 203 25%
La Plata 53,284 4,304 8% 6,411 12% 13,321 25%
Mineral 721 151 21% 212 29% 144 20%
Montezuma 25,642 3,469 14% 3,874 15% 5,698 22%
Montrose 40,713 5,181 13% 6,690 16% 21,013 52%
Ouray 4,557 366 8% 495 11% 3,038 67%
Rio Grande 11,803 1,850 16% 2,587 22% 2,146 18%
Saguache 6,208 348 6% 354 6% 1,552 25%
San Juan 692 61 9% 91 13% 125 18%
San Miguel 7,678 721 9% 1,018 13% 2,879 38%
Statewide Totals 5,268,367 198,244 462,044 2,341,806
21 | P a g e
Focus group research on residents’ attitudes regarding Colorado’s state parks showed that visitors see
the state parks’ primary purpose as preservation and recreation. They also saw state parks as offering
valuable education opportunities regarding wildlife and green space.54
A survey recently conducted by CPW gives some insight into services provided by a variety of entities
including state, federal and local governments on public lands. 55 This survey revealed that half of
Coloradans preferred public lands with basic services to either more developed areas or areas without
any services. Respondents mentioned services like toilets, shelters, running water, and picnic areas.
Interestingly, open lands and wilderness ranked highest in importance among land types with 70% of
Coloradans rating them as extremely or very important. Forests with fishing and dispersed camping
ranked second (64%), followed by developed parks, playgrounds, and recreational ball fields (40%), and
areas with extensive trails and camping (33%).
Regarding priorities for a pleasant experience at Colorado State Parks, visitors ranked cleanliness,
scenery and surroundings, safety, and facilities as the most important factors.56 Visitors and non-visitors
placed high importance on facilities for camping. Specifically, non-visitors highlighted clean bathrooms,
showers, picnic areas and tables, and paved parking lots and roads. Park visitors mentioned fire pits,
developed and primitive camp sites, and RV dumpsites, in addition to clean bathrooms and showers.57
3.4 Fishing Participation
When compared to other outdoor activities in the SCORP Public Survey, fishing ranked fourth in
popularity for outdoor activities in Colorado. The majority of anglers live in the Metro region and along
the Front Range corridor, though rural counties often have a higher proportion of residents that
purchase licenses (Tables 4 and 5).58 Several rural counties in the state (Rio Blanco, Dolores, Jackson,
Mineral and Hinsdale) had the highest proportion of residents who purchased fishing licenses, but more
urban counties (Jefferson, El Paso, Adams and Larimer) contained a larger total number of anglers.
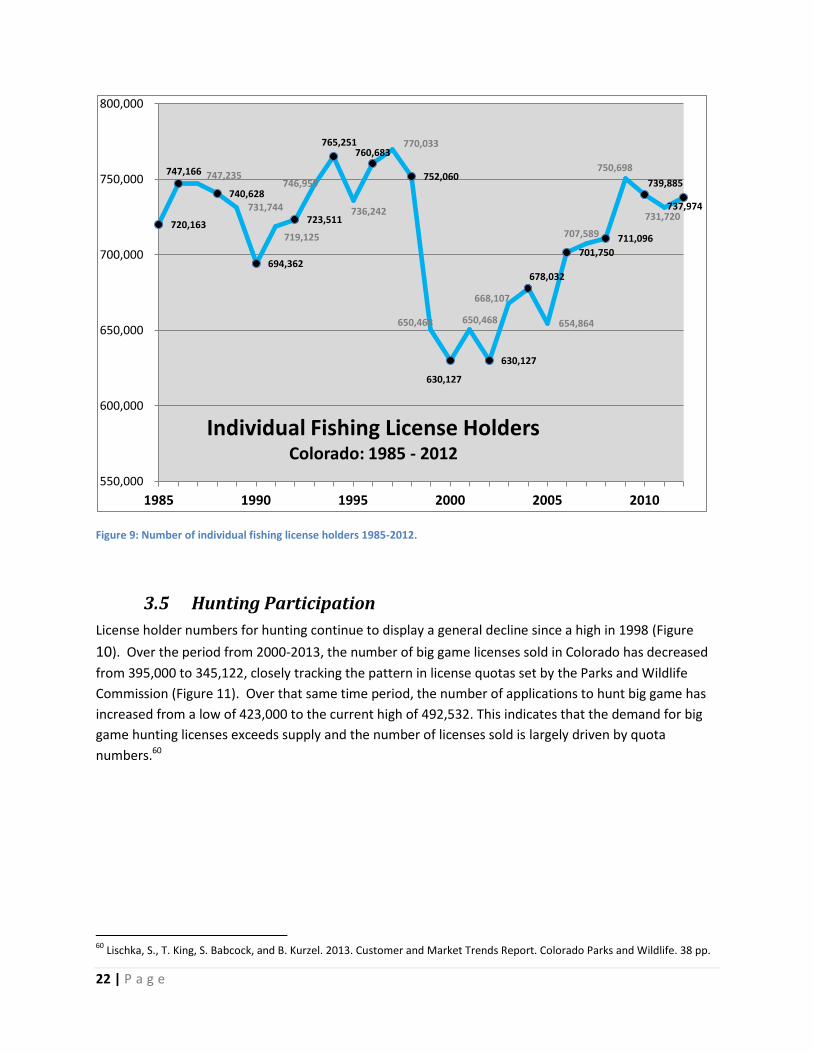
Although the overall trend for participation in angling since 1985 shows a decline (Figure 9), numbers
have generally been increasing after reaching a low in 2000 of 630,000 fishing license holders. There
were 664,051 individuals who purchased fishing licenses in Colorado in 2012.
The cohort of residents anglers that are between 48 and 58 years old make up the largest group of
fishing license purchasers over the last 15 years. As compared to hunting, participation in angling is high
among young adults, particularly between ages 22 and 37. Fishing participation slowly declines after
age 65 until most participants are no longer fishing by age 80. Interestingly, older adults (age 62 to 65)
make up the majority of non-resident fishing license purchasers and the group is increasing in size, likely
due to increased leisure time while still being young enough to participate actively.59
54
Corona 2008. Colorado State Parks Marketing Assessment: Visitor and Non-Visitor Perceptions. 55
CPW. 2013. Outdoor Recreation Participation Public Survey Summary Report. 56
Corona Research. 2008. Colorado State Parks Marketing Assessment: Visitor Intercept Survey. 57
Corona Research. 2008. Colorado State Parks Marketing Assessment: Visitor and Non-Visitor Perceptions. 58
CPW. 2013. Customer and Market Trends Report. 59
Lischka, S., T. King, S. Babcock, and B. Kurzel. 2013. Customer and Market Trends Report. Colorado Parks and Wildlife. 38 pp.
22 | P a g e
Figure 9: Number of individual fishing license holders 1985-2012.
3.5 Hunting Participation
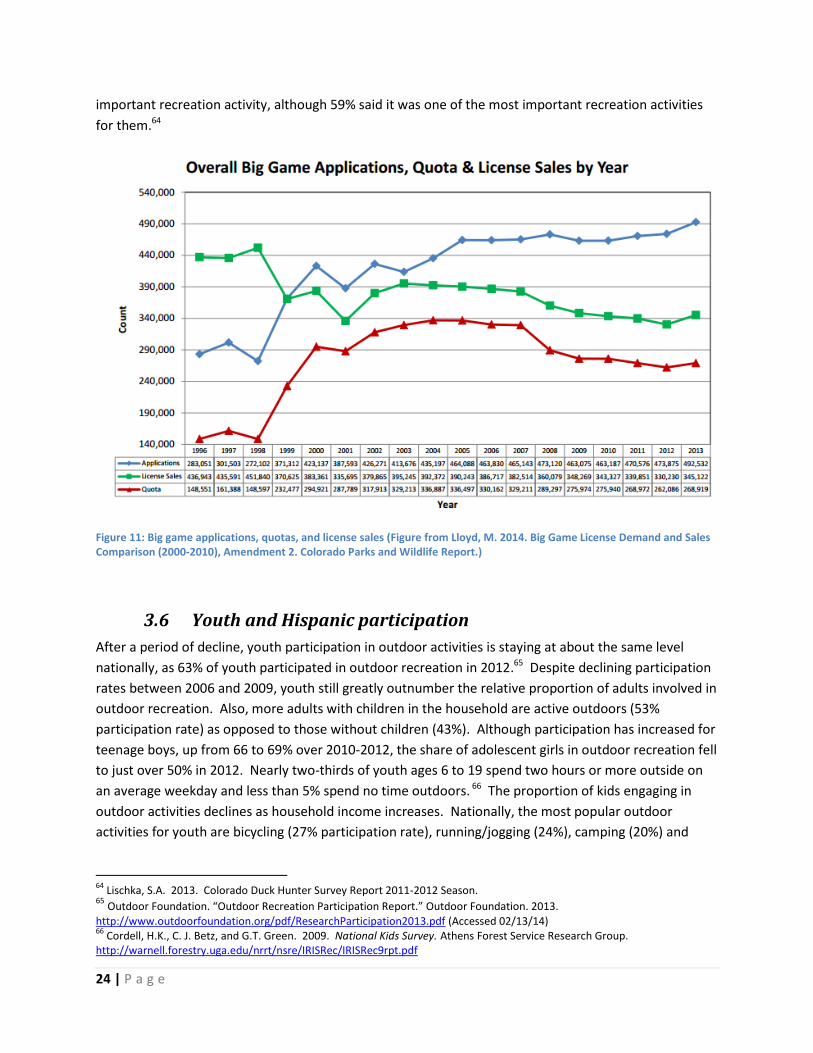
License holder numbers for hunting continue to display a general decline since a high in 1998 (Figure
10). Over the period from 2000-2013, the number of big game licenses sold in Colorado has decreased
from 395,000 to 345,122, closely tracking the pattern in license quotas set by the Parks and Wildlife
Commission (Figure 11). Over that same time period, the number of applications to hunt big game has
increased from a low of 423,000 to the current high of 492,532. This indicates that the demand for big
game hunting licenses exceeds supply and the number of licenses sold is largely driven by quota
numbers.60
60
Lischka, S., T. King, S. Babcock, and B. Kurzel. 2013. Customer and Market Trends Report. Colorado Parks and Wildlife. 38 pp.
720,163
747,166 747,235
740,628
731,744
694,362
719,125
723,511
746,959
765,251
736,242
760,683 770,033
752,060
650,468
630,127
650,468
630,127
668,107
678,032
654,864
701,750
707,589 711,096
750,698
739,885
731,720 737,974
550,000
600,000
650,000
700,000
750,000
800,000
1985 1990 1995 2000 2005 2010
Individual Fishing License Holders Colorado: 1985 - 2012

23 | P a g e
Figure 10: Number of individual hunting license holders 1985-2012.
The largest cohort of big game hunters is between 47 and 57 years old. The size of this age group is
decreasing as hunters stop hunting, without concomitant recruitment of younger age classes.61
Longitudinal tracking shows the primary cohort of small game hunters is also aging, though it is losing
participants more quickly than big game hunters. Participation in most hunting activities drops nearly to
zero around age 73-75, with an exception for small game hunting where participation continues past
age 80 for some residents.
According to the 2014 Big Game Attitude Survey, big game hunters feel that the sport is a very
important part of their recreation-based opportunities.62 Of big game hunters, 38% said that it was their
most important recreation activity, an additional 44% feel it is one of their most important recreation
activities, and hunters chose the chance to hunt every year as their top priority among a variety of
options regarding the quality of hunting opportunities.63 Duck hunting is important to duck hunters,
though not to the same degree as big game hunters. Only 12% of duck hunters said it was their most
61
Lischka, S., T. King, S. Babcock, and B. Kurzel. 2013. Customer and Market Trends Report. Colorado Parks and Wildlife. 38 pp. 62
Lischka, S.A., and L. Mengak. 2014. 2014 Big Game Hunter Attitude Survey Technical Report. 63
Lischka, S.A., and L. Mengak. 2014. 2014 Big Game Hunter Attitude Survey Technical Report.
310,898
304,498
315,434
325,761
340,911
327,979
326,962
301,910
313,346
301,710
295,895
349,491 352,823
362,927
328,879
337,475
298,292
300,574 309,801
318,971
312,151 306,179
304,432 294,168
288,086
286,363
280,302
281,201
250,000
270,000
290,000
310,000
330,000
350,000
370,000
1985 1990 1995 2000 2005 2010
Individual Hunting License Holders Colorado: 1985 - 2012
24 | P a g e
important recreation activity, although 59% said it was one of the most important recreation activities
for them.64
Figure 11: Big game applications, quotas, and license sales (Figure from Lloyd, M. 2014. Big Game License Demand and Sales Comparison (2000-2010), Amendment 2. Colorado Parks and Wildlife Report.)
3.6 Youth and Hispanic participation
After a period of decline, youth participation in outdoor activities is staying at about the same level
nationally, as 63% of youth participated in outdoor recreation in 2012.65 Despite declining participation
rates between 2006 and 2009, youth still greatly outnumber the relative proportion of adults involved in
outdoor recreation. Also, more adults with children in the household are active outdoors (53%
participation rate) as opposed to those without children (43%). Although participation has increased for
teenage boys, up from 66 to 69% over 2010-2012, the share of adolescent girls in outdoor recreation fell
to just over 50% in 2012. Nearly two-thirds of youth ages 6 to 19 spend two hours or more outside on
an average weekday and less than 5% spend no time outdoors. 66 The proportion of kids engaging in
outdoor activities declines as household income increases. Nationally, the most popular outdoor
activities for youth are bicycling (27% participation rate), running/jogging (24%), camping (20%) and
64
Lischka, S.A. 2013. Colorado Duck Hunter Survey Report 2011-2012 Season. 65
Outdoor Foundation. “Outdoor Recreation Participation Report.” Outdoor Foundation. 2013. http://www.outdoorfoundation.org/pdf/ResearchParticipation2013.pdf (Accessed 02/13/14) 66
Cordell, H.K., C. J. Betz, and G.T. Green. 2009. National Kids Survey. Athens Forest Service Research Group. http://warnell.forestry.uga.edu/nrrt/nsre/IRISRec/IRISRec9rpt.pdf
25 | P a g e
fishing (20%).67 The most activity days per year for youth are spent running (82 outings per runner),
cycling (71 outings per cyclist), and skateboarding (58 outings per skateboarder).
Focus group research performed as part of the 2014 SCORP sought to understand more about how
youth participated in outdoor recreation and what influences their recreation choices. The most
popular activities that youth identified included team sports (e.g., basketball and soccer), cycling,
skateboarding, and running; more traditional outdoor activities like hiking, camping, hunting, and fishing
were not mentioned frequently. This work revealed the importance of education and word of mouth in
getting youth outdoors. Awareness of recreation opportunities, costs, safety, and accessibility is
important to make getting outdoors easier for youth.68 Similarly, Great Outdoors Colorado focus group
research with youth revealed common barriers to youth outdoor recreation participation include
limitations on time and money, limited access to nearby natural areas, lack of information regarding
activities, and the perception that getting outdoors is difficult.69 Being with family and friends is a top
motivator for engaging in outdoor activities for youth ages 6-12; this factor becomes less important in
adolescence and young adulthood when the motivation becomes more focused on exercise and being
physically fit.70
Participation of Hispanic youth in outdoor recreation is higher compared to white and black youth, with
a higher percentage from this group spending four or more hours outside. Barriers to overall Hispanic
participation are largely similar to those identified by GOCO’s youth focus groups with the addition that
feeling unwelcome can limit willingness to participate in outdoor activities.71
While often not considered ‘youth’ in the typical sense, Colorado’s young adults have a strong affinity
for the outdoors. Eighty-four percent of voters age 18-32 in the 2015 Conservation in the West poll
rated clean air, water, and environment as a reason why they live in the West.72 Almost as important
were a healthy, outdoor lifestyle and cost of living. Though nearly all (98%) reported visiting public lands
in the last year, they have concerns that future generations may not follow suit. Nearly eight out of ten
(79%) said children not spending enough time outside was a problem.
4. Public Opinion and Preferences for Natural Resource and
Recreation Priorities Land conservation and preserving natural areas regularly rank high in competing priorities for
Coloradans. Residents gave highest priority to protecting wilderness/open lands in a 2013 survey,
67
Outdoor Foundation. 2013. “Outdoor Recreation Participation Report.” Outdoor Foundation.
http://www.outdoorfoundation.org/pdf/ResearchParticipation2013.pdf (Accessed 02/13/14) 68
CPW. 2014. SCORP. 69
Great Outdoors Colorado. 2015. Strategic Plan. 70
Outdoor Foundation. 2013. “Outdoor Recreation Participation Report.” Outdoor Foundation. http://www.outdoorfoundation.org/pdf/ResearchParticipation2013.pdf (Accessed 02/13/14) 71
Great Outdoors Colorado. 2015. Strategic Plan. 72
Colorado College. 2015. Conservation in the West Poll. https://www.coloradocollege.edu/stateoftherockies/conservationinthewest/ (Accessed 02/11/15)
26 | P a g e
where 72% of respondents deemed it high priority or essential.73 When Great Outdoors Colorado polled
the public, stakeholders, and the Parks & Wildlife Commission about their funding priorities, all three
groups gave top tier ranking to “protecting land along lakes, rivers and streams”, “preserving open space
and parks”, and “protecting habitat for watchable wildlife or threatened species”.74 During GOCO’s
public listening tour, the highest priority for citizens was protecting land, water and wildlife through
“conservation of large landscapes”, “investment in healthy river corridors and wildlife habitat”, and
“balancing outdoor recreation with wildlife vitality”.75 A majority of respondents to a 2008 public survey
believed that there should be more publicly-owned land in Colorado,76 and 72% of respondents to a
survey at state parks would be most pleased with future additions of new park lands.77 Nearly half of
park visitors in a 2009 survey stated that an increase in primitive, isolated campsites would be
appreciated;78 41% of surveyed visitors in 2008 wanted backcountry experiences and one third said that
they would visit state parks more often if there were additional primitive areas.79 CPW’s 2013 survey
found that dispersed camping in public lands ranked higher (62%) in land type priorities than large,
developed outdoor recreation lands (33%).80
Trails have been a stated priority for Colorado State Parks users and non-users alike. In 2008, the visitor
intercept survey found that 32% of respondents thought more non-motorized trails would increase
visitation to state parks.81 In a public survey in the same year, 70% of respondents said that the addition
of trails would influence them to visit state parks more frequently.82 Fifty-five percent of active state
park users said a top priority should be maintenance of existing trails.83 Seventy-two percent of
respondents to a survey conducted at state parks said trails would be top priority for future park
changes,84 and in 2013, almost half of respondents to a CPW outdoor recreation survey indicated that
dirt trails are essential.85
Wildlife viewing areas and opportunities were ranked as high priority or essential investment priority for
public lands by nearly half of general public respondents in 2013.86 This similar theme is reflected in the
2009 survey of state park visitors where two-thirds said they would be happy with additional wildlife
viewing areas and more than half would increase their park visitation with more wildlife viewing
opportunities.87
73
CPW. 2013. Outdoor Recreation Participation Public Survey Summary Report. 74
Great Outdoors Colorado. 2014. Great Outdoors Colorado Situation Analysis. 75
Great Outdoors Colorado. 2014. Great Outdoors Colorado Situation Analysis. 76
Corona Research. 2008. Colorado State Parks Marketing Assessment: Public Survey. 77
Corona Research. 2009. Colorado State Parks Marketing Assessment: Future Directions. 78
Corona Research. 2009. Colorado State Parks Marketing Assessment: Future Directions. 79
Corona Research. 2008. Colorado State Parks Marketing Assessment: Visitor Intercept Survey. 80
CPW. 2013. Outdoor Recreation Participation Public Survey Summary Report. 81
Corona Research. 2008. Colorado State Parks Marketing Assessment: Visitor Intercept Survey. 82
Corona Research. 2008. Colorado State Parks Marketing Assessment: Public Survey. 83
Corona Research. 2008. Colorado State Parks Marketing Assessment: Public Survey. 84
Corona Research. 2009. Colorado State Parks Marketing Assessment: Future Directions. 85
CPW 2013. Outdoor Recreation Participation Public Survey Summary Report. 86
CPW 2013. Outdoor Recreation Participation Public Survey Summary Report. 87
Corona Research. 2009. Colorado State Parks Marketing Assessment: Future Directions.
27 | P a g e
In Great Outdoors Colorado’s 2014 listening meetings, almost 20% of participants said that “outdoor
access for all” was their first priority in outdoor recreation, surpassed only by protecting “Colorado’s
land, water, and wildlife”. While these two goals are admirable, they are not necessarily always
compatible. Trade-offs may be necessary when balancing management of land for suitable habitat with
the competing end of increased access and visitation. There was particular emphasis placed on outdoor
opportunities for youth, low-income families, and Hispanic populations.88 In regard to fees for accessing
state parks, most visitors (66%) believed that it was appropriate to charge additional fees for specific
activities to ensure that park entrance fees could be kept at low as possible.89 For example, respondents
supported a fee structure where campers would pay a higher rate for nicer, more developed campsites
or premium facilities. These findings support an activity-based fee structure, where users are charged
based on the type of use. This same group of visitors indicated that they would prefer an increase in
park fees if that translated directly into upgraded facilities and better management of natural
resources.90 As with competing priorities of protecting habitat and increased access, upgrading facilities
and improving natural resource management may be at odds with each other. Similarly, in a more
recent survey, Colorado residents said that maintenance of existing infrastructure and facilities was
more important than developing new facilities or investing in new educational programs and visitor
services on public lands.91
In regards to public opinion about wildlife conservation, respondents to a statewide public survey said
that their top priorities were “protecting fish and wildlife that are at risk of becoming endangered,
protecting high priority habitats to support many different types of fish and wildlife, and researching and
eliminating diseases in wildlife.”92 There is also more public support for prioritizing native species over
non-native species, and game species were deemed more important than non-game species. Almost
two-thirds of respondents felt that endangered species were highest priority among other non-game
fish and wildlife. Urban residents tend to have different values toward wildlife, tending to see them as
on more equal footing with humans, as compared to residents in less urban areas.93 Given the likely
increase in urban Coloradans, this tendency is notable.
5. Public satisfaction with CPW The majority of data regarding public satisfaction comes from surveys conducted for the Colorado
Division of Parks and Outdoor Recreation (State Parks) and the Colorado Division of Wildlife (DOW),
before those two agencies merged in 2011 to form Colorado Parks and Wildlife.
88
Great Outdoors Colorado 2014. Great Outdoors Colorado Situation Analysis. 89
Corona Research. 2009. Colorado State Parks Marketing Assessment: Future Directions. 90
Corona Research. 2009. Colorado State Parks Marketing Assessment: Future Directions. 91
CPW 2013. Outdoor Recreation Participation Public Survey Summary Report. 92
Teel, T.L., Dayer, A.A., and Bright, A.D. 2006. “Wildlife Values in the West.” 93
Teel, T.L., and Manfredo, M.J. 2009. “Understanding the Diversity of Public Interests in Wildlife Conservation.” Conservation Biology 24 (1): 1128-139.
28 | P a g e
Overall, Coloradans see the state park system as a benefit. For state parks, 97% of general public survey
respondents felt state parks are “a good thing” for Colorado.94 Sixty-one percent of respondents’
impressions of the agency were very favorable in a 2008 public survey and another 28% had a
somewhat favorable impression; in contrast, somewhat and very unfavorable opinions only accounted
for 2%.95 In the same study, 80% of respondents believed that Colorado State Parks was doing either a
good or very good job of managing park natural resources. Visitors generally enjoy their experiences at
State Parks, indicated by excellent or good ratings from 92% of visitors, and the level of service provided
by park rangers was also recognized where 81% of visitors who came into contact with park staff had an
excellent or good interaction. Among park features, visitors gave the highest ratings to scenery,
customer service, and safety.96
Focus groups revealed that the majority of both users and non-users alike see Colorado state parks as
crowded, and visitors feel that crowds are larger than in the past. There is also the perception that state
parks are safe, both among park users and non-users. Across the state, visitors feel safe in the parks and
people appreciate the visible presence of rangers.97 Both park users and non-user overwhelmingly feel
that state parks are an asset for residents and offer valuable outdoor recreation opportunities as well as
bringing economic benefits through attracting tourists.98
Awareness about Colorado State Parks is an area of improvement where the agency could make
significant inroads to creating new users and enhancing name and brand recognition. Although 83% of
public poll respondents said they visited a state park in the previous two years, 43% of those who
answered affirmatively could not name the park they visited or mistook another outdoor area as a state
park.99 Similarly, when asked about the total number of state parks, those identified as park visitors
estimated there to be between 20 and 150 parks and non-visitors estimated between 6 and 200.100.
Interestingly, both users and non-users have the perception that Colorado’s state parks are located near
larger populations and metropolitan areas,101 again indicating unfamiliarity with the State Parks system.
Seventy percent of the public said that they trusted DOW to properly manage fish and wildlife
populations according to a 2006 survey conducted for Colorado Division of Wildlife. 102 This indication of
trust is significant given that less than 50% of respondents trusted state or federal governments to “do
what is right” at the state and national levels, respectively. Similar to the public’s high level of
satisfaction with Colorado State Parks, 80% of respondents thought DOW’s overall performance good or
excellent. However, the study also revealed less than half of respondents trusted the agency to make
wildlife management decisions without public input and, similarly, less than half believed that DOW did
a good job seeking their input or that their opinions would be taken into account in the agency’s
94
Corona Research. 2008. Colorado State Parks 2008/2009 Marketing Assessment: Executive Summary of Findings and Recommendations. 95
Corona Research. 2008. Colorado State Parks Marketing Assessment: Public Survey. 96
Corona Research. 2008. Colorado State Parks Marketing Assessment: Visitor Intercept Survey. 97
Corona Research. 2008. Colorado State Parks Marketing Assessment: Visitor and Non-Visitor Perceptions. 98
Corona Research. 2008. Colorado State Parks Marketing Assessment: Visitor and Non-Visitor Perceptions. 99
Corona Research. 2008. Colorado State Parks Marketing Assessment: Public Survey. 100
Corona Research. 2008. Colorado State Parks Marketing Assessment: Visitor and Non-Visitor Perceptions. 101
Corona Research. 2008. Colorado State Parks Marketing Assessment: Visitor and Non-Visitor Perceptions. 102
Teel, T.L., Dayer, A.A., and Bright, A.D. 2006. “Wildlife Values in the West.”
29 | P a g e
decision making process. Smaller proportions of respondents felt that DOW adequately accounted for
their interests (33%) and that their opinions were heard (25%).
Big game hunters were largely satisfied with their hunting experiences, based on a 2014 survey. 103 The
proportion of hunters rating their experience as very or somewhat satisfying outnumbered those rating
somewhat or very unsatisfied by at least a 2:1 margin for elk, deer, mountain lion, and pronghorn; the
satisfied-unsatisfied margin was closer for only for black bear though the difference was only slightly less
at 1.8:1. Resident hunters feel that the most important factors in the sport are being able to hunt every
year and to harvest the animal for meat. Non-residents prefer hunting every 3-5 years to take a larger,
more mature animal and are less interested in harvesting an animal for meat. Access to public lands is
also a priority for hunters.
Anglers are similarly satisfied with fishing in Colorado: 66% of residents and 80% of non-residents
reported to be very or somewhat satisfied with their experiences.104 The most important factors to
anglers are the opportunity to fish in a variety of waters and having a large diversity of types of fish to
catch. Also important is being able to eat the fish that they catch.
103
Lischka, S.A., and L. Mengak. 2014. 2014 Big Game Hunter Attitude Survey Technical Report. 104
Lischka, S.A. 2013. 2012 Colorado Angler Survey Report.