Embed Size (px)
Citation preview

Exhibit Q Threatened and Endangered Plant and Animal Species Boardman to Hemingway Transmission Line Project
1221 West Idaho Street Boise, Idaho 83702 Todd Adams, Project Leader Zach Funkhouser, Permitting (208) 388-2740 (208) 388-5375 [email protected] [email protected]
Preliminary Application for Site Certificate
February 2013

Boardman to Hemingway Transmission Line Project Exhibit Q
PRELIMINARY APPLICATION FOR SITE CERTIFICATE Page Q-i
TABLE OF CONTENTS 1.0 INTRODUCTION ........................................................................................................... Q-1 2.0 APPLICABLE RULES AND STATUTES ..................................................................... Q-1
2.1 Requirements of Exhibit Q – OAR 345-021-0010(1)(q) ....................................... Q-1 2.2 Project Order Requirements................................................................................. Q-2
3.0 ANALYSIS .................................................................................................................... Q-3 3.1 Analysis Area ....................................................................................................... Q-3 3.2 Methods ............................................................................................................... Q-4
3.2.1 Initial Desktop Review .............................................................................. Q-4 3.2.2 Field Surveys ............................................................................................ Q-5
3.3 Information Required by OAR 345-021-0010(1)(q) ............................................ Q-12 3.3.1 Species Occurrence and Potential Adverse Effects ............................... Q-12 3.3.2 Measures to Avoid and Reduce Adverse Impacts .................................. Q-37 3.3.3 Potential Impacts to Plants Covered under a Conservation
Program .................................................................................................. Q-40 3.3.4 Potential Impacts to Plants without Conservation Programs .................. Q-40 3.3.5 Potential Impacts to Wildlife ................................................................... Q-43 3.3.6 Monitoring Plan ....................................................................................... Q-44
4.0 CONCLUSION ............................................................................................................ Q-44 5.0 SUBMITTAL AND APPROVAL COMPLIANCE MATRICES ..................................... Q-45 6.0 RESPONSE TO COMMENTS FROM REVIEWING AGENCIES AND THE
PUBLIC ....................................................................................................................... Q-46 7.0 REFERENCES ............................................................................................................ Q-46

Boardman to Hemingway Transmission Line Project Exhibit Q
PRELIMINARY APPLICATION FOR SITE CERTIFICATE Page Q-ii
LIST OF TABLES Table Q-1. Biological Surveys Related to Exhibit Q ....................................................... Q-6 Table Q-2. Federal or State Listed Threatened and Endangered Species Potentially
Present within the Analysis Area ................................................................ Q-12 Table Q-3. Stream Crossings (i.e., areas spanned by the transmission line) that Contain
Federal or State Listed Fish Species .......................................................... Q-20 Table Q-4. Populations of Federal or State Listed Plant Species Located within the
Project’s Currently Proposed Disturbance Footprint (based on existing databases and survey data) ....................................................................... Q-28
Table Q-5. Submittal Requirements Matrix ................................................................... Q-45 Table Q-6. Approval Standard ...................................................................................... Q-45 Table Q-7. Reviewing Agency and Public Comments .................................................. Q-46
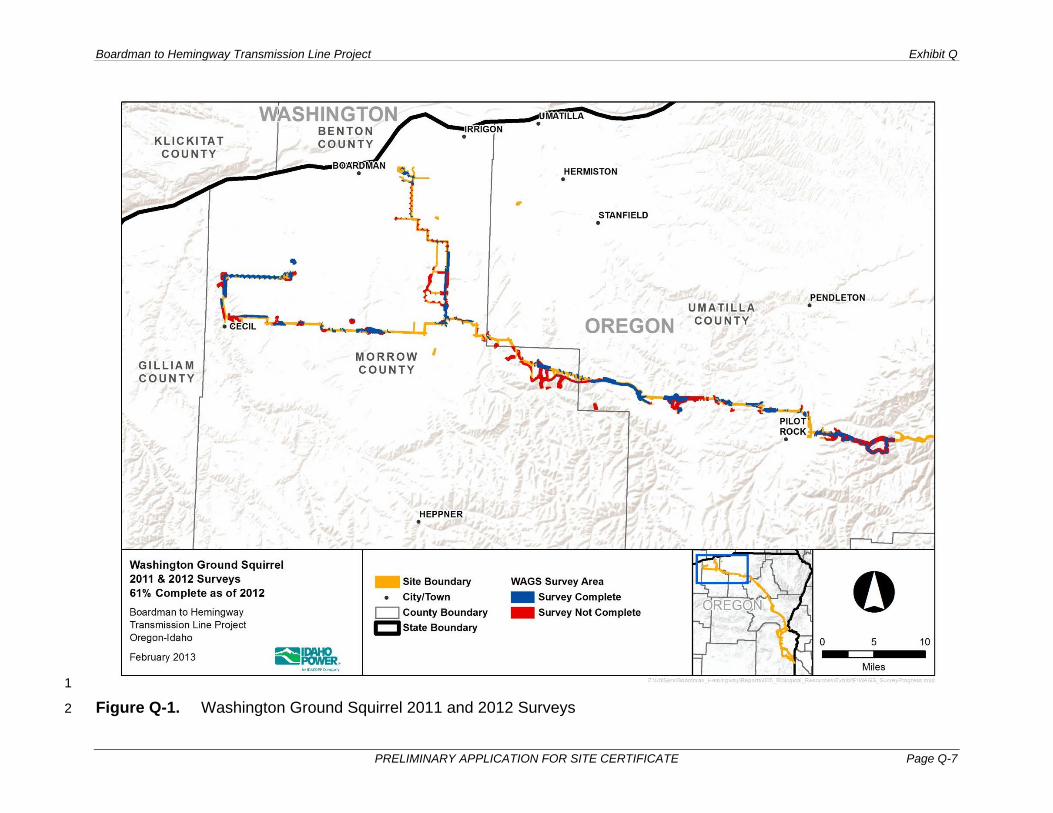
LIST OF FIGURES Figure Q-1. Washington Ground Squirrel 2011 and 2012 Surveys ................................. Q-7 Figure Q-2. Special Status Plant 2011 and 2012 Surveys ............................................... Q-8 Figure Q-3. Terrestrial Visual Encounter Survey Areas 2011 and 2012 .......................... Q-9

Boardman to Hemingway Transmission Line Project Exhibit Q
PRELIMINARY APPLICATION FOR SITE CERTIFICATE Page Q-iii
ACRONYMS AND ABBREVIATIONS Note: Not all acronyms and abbreviations listed will appear in this Exhibit.
°C degrees Celsius 4WD 4-wheel-drive A ampere A/ph amperes/phase AC alternating current ACDP Air Contaminant Discharge Permit ACEC Area of Critical Environmental Concern ACSR aluminum conductor steel reinforced AIMP Agricultural Impact Mitigation Plan AMS Analysis of the Management Situation aMW average megawatt ANSI American National Standards Institute APE Area of Potential Effect APLIC Avian Power Line Interaction Committee ARPA Archaeological Resource Protection Act ASC Application for Site Certificate ASP Archaeological Survey Plan ASCE American Society of Civil Engineers AST aboveground storage tank ASTM American Society of Testing and Materials ATC available transmission capacity ATV all-terrain vehicle AUM animal unit month B2H Boardman to Hemingway Transmission Line Project BCCP Baker County Comprehensive Plan BCZSO Baker County Zoning and Subdivision Ordinance BLM Bureau of Land Management BMP best management practice BPA Bonneville Power Administration BOR Bureau of Reclamation C and D construction and demolition CAA Clean Air Act CadnaA Computer-Aided Noise Abatement CAFE Corona and Field Effects CAP Community Advisory Process CBM capacity benefit margin CFR Code of Federal Regulations CH critical habitat CIP critical infrastructure protection CL centerline cm centimeter cmil circular mil COA Conservation Opportunity Area CO2e carbon dioxide equivalent

Boardman to Hemingway Transmission Line Project Exhibit Q
PRELIMINARY APPLICATION FOR SITE CERTIFICATE Page Q-iv
COM Plan Construction, Operations, and Maintenance Plan CPCN Certificate of Public Convenience and Necessity cps cycle per second CRP Conservation Reserve Program CRT cathode-ray tube CRUP Cultural Resource Use Permit CSZ Cascadia Subduction Zone CTUIR Confederated Tribes of the Umatilla Indian Reservation CWA Clean Water Act of 1972 CWR Critical Winter Range dB decibel dBA A-weighted decibel DC direct current DoD Department of Defense DOE U.S. Department of Energy DOGAMI Oregon Department of Geology and Mineral Industries DPS Distinct Population Segment DSL Oregon Department of State Lands EA environmental assessment EDRR Early Detection and Rapid Response EIS Environmental Impact Statement (DEIS for Draft and FEIS
for Final) EFSC or Council Energy Facility Siting Council EFU Exclusive Farm Use EHS extra high strength EMF electric and magnetic fields EPA Environmental Protection Agency EPC Engineer, Procure, Construct EPM environmental protection measure EPRI Electric Power Research Institute ERO Electric Reliability Organization ERU Exclusive Range Use ESA Endangered Species Act ESCP Erosion and Sediment Control Plan ESU Evolutionarily Significant Unit EU European Union FAA Federal Aviation Administration FCC Federal Communication Commission FEMA Federal Emergency Management Agency FERC Federal Energy Regulatory Commission FFT find, fix, track, and report FLPMA Federal Land Policy and Management Act Forest Plan Land and Resource Management Plan FPA Forest Practices Act FSA Farm Services Agency FWS U.S. Fish and Wildlife Service G gauss
Boardman to Hemingway Transmission Line Project Exhibit Q
PRELIMINARY APPLICATION FOR SITE CERTIFICATE Page Q-v
GeoBOB Geographic Biotic Observation GF Grazing Farm Zone GHG greenhouse gas GHz gigahertz GIL gas insulated transmission line GIS geographic information system GPS Global Positioning System GRMW Grande Ronde Model Watershed GRP Grassland Reserve Program HAC Historic Archaeological Cultural HCNRA Hells Canyon National Recreation Area HPFF high pressure fluid-filled HPMP Historic Properties Management Plan HUC Hydrologic Unit Code Hz hertz I-84 Interstate 84 ICC International Code Council ICES International Committee on Electromagnetic Safety ICNIRP International Commission on Non-Ionizing Radiation Protection IDAPA Idaho Administrative Procedures Act IDEQ Idaho Department of Environmental Quality IDFG Idaho Department of Fish and Game IDWR Idaho Department of Water Resources ILS intensive-level survey IM Instructional Memorandum INHP Idaho Natural Heritage Program INRMP Integrated Natural Resources Management Plan IPC Idaho Power Company IPUC Idaho Public Utilities Commission IRP integrated resource plan IRPAC IRP Advisory Council ISDA Idaho State Department of Agriculture JPA Joint Permit Application KCM thousand circular mils kHz kilohertz km kilometer KOP Key Observation Point kV kilovolt kV/m kilovolt per meter kWh kilowatt-hour Ldn day-night sound level Leq equivalent sound level lb pound LCDC Land Conservation and Development Commission LDMA Lost Dutchman’s Mining Association LiDAR light detection and ranging LIT Local Implementation Team

Boardman to Hemingway Transmission Line Project Exhibit Q
PRELIMINARY APPLICATION FOR SITE CERTIFICATE Page Q-vi
LMP land management plan LOLE Loss of Load Expectation LRMP land and resource management plan LUBA Land Use Board of Appeals LWD large woody debris m meter mA milliampere MA Management Area MAIFI Momentary Average Interruption Frequency Index MCC Malheur County Code MCCP Morrow County Comprehensive Plan MCE Maximum Credible Earthquake MCZO Morrow County Zoning Ordinance mG milligauss MHz megahertz mm millimeter MMI Modified Mercalli Intensity MP milepost MPE maximum probable earthquake MRI magnetic resonance imaging MVAR megavolt ampere reactive Mw mean magnitude MW megawatt µV/m microvolt per meter N2O nitrous oxide NAIP National Agriculture Imagery Program NED National Elevation Dataset NEMS National Energy Modeling System NEPA National Environmental Policy Act of 1969 NERC North American Electric Reliability Corporation NESC National Electrical Safety Code NF National Forest NFPA National Fire Protection Association NFS National Forest System NGDC National Geophysical Data Center NHD National Hydrography Dataset NHOTIC National Historic Oregon Trail Interpretive Center NHT National Historic Trail NIEHS National Institute of Environmental Health Sciences NIST National Institute of Standards and Technology NOAA National Oceanic and Atmospheric Administration NOAA Fisheries National Oceanic and Atmospheric Administration Fisheries
Division NOI Notice of Intent to File an Application for Site Certificate NOV Notice of Violation NPDES National Pollutant Discharge Elimination System NRCS Natural Resources Conservation Service
Boardman to Hemingway Transmission Line Project Exhibit Q
PRELIMINARY APPLICATION FOR SITE CERTIFICATE Page Q-vii
NRHP National Register of Historic Places NSR noise sensitive receptor NTTG Northern Tier Transmission Group NWGAP Northwest Regional Gap Analysis Landcover Data NWI National Wetlands Inventory NWPP Northwest Power Pool NWR National Wildlife Refuge NWSRS National Wild and Scenic Rivers System NWSTF Naval Weapons Systems Training Facility O3 ozone O&M operation and maintenance OAIN Oregon Agricultural Information Network OAR Oregon Administrative Rules OATT Open Access Transmission Tariff ODA Oregon Department of Agriculture ODEQ Oregon Department of Environmental Quality ODF Oregon Department of Forestry ODFW Oregon Department of Fish and Wildlife ODOE Oregon Department of Energy ODOT Oregon Department of Transportation OHGW overhead ground wire OHV off-highway vehicle OPGW optical ground wire OPRD Oregon Parks and Recreation Department OPS U.S. Department of Transportation, Office of Pipeline Safety OPUC Public Utility Commission of Oregon OR Oregon (State) Highway ORBIC Oregon Biodiversity Information Center ORS Oregon Revised Statutes ORWAP Oregon Rapid Wetland Assessment Protocol OS Open Space OSDAM Oregon Streamflow Duration Assessment Methodology OSHA Occupational Safety and Health Administration OSSC Oregon Structural Specialty Code OSWB Oregon State Weed Board OWC Oregon Wetland Cover P Preservation PA Programmatic Agreement pASC Preliminary Application for Site Certificate PAT Project Advisory Team PCE Primary Constituent Element PEM palustrine emergent PFO palustrine forested PGA peak ground acceleration PGE Portland General Electric PGH Preliminary General Habitats Pike Pike Energy Solutions

Boardman to Hemingway Transmission Line Project Exhibit Q
PRELIMINARY APPLICATION FOR SITE CERTIFICATE Page Q-viii
PNSN Pacific Northwest Seismic Network POD Plan of Development POMU Permit to Operate, Maintain and Use a State Highway Approach PPH Preliminary Priority Habitats Project Boardman to Hemingway Transmission Line Project PSD Prevention of Significant Deterioration PSS palustrine scrub-shrub R Retention R-F removal-fill RCM Reliability Centered Maintenance RCRA Resource Conservation and Recovery Act ReGAP Regional Gap Analysis Project RFP request for proposal RLS reconnaissance-level survey RMP resource management plan ROD Record of Decision ROE right of entry RNA research natural area ROW right-of-way SAIDI System Average Interruption Duration Index SAIFI System Average Interruption Frequency Index SC Sensitive Critical SEORMP Southeastern Oregon Resource Management Plan SF6 sulfur hexafluoride Shaw Shaw Environmental and Infrastructure, Inc. SHPO State Historic Preservation Office SLIDO Statewide Landslide Inventory Database for Oregon SMS Scenery Management System SMU Species Management Unit SPCC Spill Prevention, Containment, and Countermeasures SRMA Special Recreation Management Area SRSAM Salmon Resources and Sensitive Area Mapping SSURGO Soil Survey Geographic Database STATSGO State Soil Geographic Database SUP special-use permit SV Sensitive Vulnerable SWPPP Stormwater Pollution Prevention Plan T/A/Y tons/acre/year TDG Total Dissolved Gas TES threatened, endangered, and sensitive (species) TG Timber Grazing TMIP Transmission Maintenance and Inspection Plan TNC The Nature Conservancy tpy tons per year TSD treatment, storage, and disposal TV television TVES Terrestrial Visual Encounter Surveys
Boardman to Hemingway Transmission Line Project Exhibit Q
PRELIMINARY APPLICATION FOR SITE CERTIFICATE Page Q-ix
TVMP Transmission Vegetation Management Program UBAR Umatilla Basin Aquifer Restoration UBWC Umatilla Basin Water Commission UCDC Umatilla County Development Code UCZPSO Union County Zoning, Partition and Subdivision Ordinance UDP Unanticipated Discovery Plan U.S. United States USACE U.S. Army Corps of Engineers U.S.C. United States Code USDA U.S. Department of Agriculture USFS U.S. Department of Agriculture, Forest Service USGS U.S. Geological Survey UWIN Utah Wildlife in Need V/C volume to capacity V volt VAHP Visual Assessment of Historic Properties VMS Visual Management System VQO Visual Quality Objective VRM Visual Resource Management WAGS Washington ground squirrel WCU Wilderness Characteristic Unit WECC Western Electricity Coordinating Council WHO World Health Organization WMA Wildlife Management Area WOS waters of the state WOUS waters of the United States WPCF Water Pollution Control Facility WR winter range WRCC Western Regional Climate Center WRD (Oregon) Water Resources Division WRP Wetland Reserve Program WWE West-wide Energy XLPE cross-linked polyethylene

Boardman to Hemingway Transmission Line Project Exhibit Q
PRELIMINARY APPLICATION FOR SITE CERTIFICATE Page Q-1
Exhibit Q 1 Threatened and Endangered Plant and Animal Species 2
1.0 INTRODUCTION 3
Exhibit Q provides an analysis of threatened and endangered plant and animal species for the 4 Boardman to Hemingway Transmission Line Project (Project). Exhibit Q demonstrates that 5 Idaho Power Company (IPC) will comply with the approval standard for state listed threatened 6 and endangered plant and animal species in accordance with Oregon Administrative Rule 7 (OAR) 345-022-0070 based on information provided pursuant to OAR 345-021-0010(1)(q), 8 paragraphs (A) through (G). 9
The term “special status species” will be used at times in Exhibit Q to collectively refer to 10 federally- and state-listed threatened and endangered species identified as potentially affected 11 by the Project. Impacts to State Sensitive Species as well as non-listed fish and wildlife species 12 and their habitats are addressed in Exhibit P. 13
2.0 APPLICABLE RULES AND STATUTES 14
In accordance with the Energy Facility Siting Council (EFSC or Council) Threatened and 15 Endangered Species Standard, OAR 345-022-0070: 16
To issue a site certificate, the Council, after consultation with appropriate state agencies, 17 must find that: 18
(1) For plant species that the Oregon Department of Agriculture has listed as threatened 19 or endangered under ORS 564.105(2), the design, construction and operation of the 20 proposed facility, taking into account mitigation: 21
(a) Are consistent with the protection and conservation program, if any, that the 22 Oregon Department of Agriculture has adopted under ORS 564.105(3); or 23
(b) If the Oregon Department of Agriculture has not adopted a protection and 24 conservation program, are not likely to cause a significant reduction in the 25 likelihood of survival or recovery of the species; and 26
(2) For wildlife species that the Oregon Fish and Wildlife Commission has listed as 27 threatened or endangered under ORS 496.172(2), the design, construction and 28 operation of the proposed facility, taking into account mitigation, are not likely to cause a 29 significant reduction in the likelihood of survival or recovery of the species. 30
2.1 Requirements of Exhibit Q – OAR 345-021-0010(1)(q) 31
To demonstrate compliance with the Threatened and Endangered Species Standard, and in 32 accordance with OAR 345-021-0010(1)(q), Exhibit Q must include the following: 33
(A) Based on appropriate literature and field study, identification of all threatened or 34 endangered species listed under ORS 496.172(2), ORS 564.105(2) or 16 USC § 1533 35 that may be affected by the proposed facility. 36
(B) For each species identified under (A), a description of the nature, extent, locations 37 and timing of its occurrence in the analysis area and how the facility might adversely 38 affect it. 39

Boardman to Hemingway Transmission Line Project Exhibit Q
PRELIMINARY APPLICATION FOR SITE CERTIFICATE Page Q-2
(C) For each species identified under (A), a description of measures proposed by the 1 applicant, if any, to avoid or reduce adverse impact. 2
(D) For each plant species identified under (A), a description of how the proposed 3 facility, including any mitigation measures, complies with the protection and conservation 4 program, if any, that the Oregon Department of Agriculture has adopted under ORS 5 564.105(3). 6
(E) For each plant species identified under paragraph (A), if the Oregon Department of 7 Agriculture has not adopted a protection and conservation program under ORS 8 564.105(3), a description of significant potential impacts of the proposed facility on the 9 continued existence of the species and on the critical habitat of such species and 10 evidence that the proposed facility, including any mitigation measures, is not likely to 11 cause a significant reduction in the likelihood of survival or recovery of the species. 12
(F) For each animal species identified under (A), a description of significant potential 13 impacts of the proposed facility on the continued existence of such species and on the 14 critical habitat of such species and evidence that the proposed facility, including any 15 mitigation measures, is not likely to cause a significant reduction in the likelihood of 16 survival or recovery of the species. 17
(G) The applicant’s proposed monitoring program, if any, for impacts to threatened and 18 endangered species. 19
2.2 Project Order Requirements 20
The Project Order states that all requirements of OAR 345-021-0010(1)(q) apply to Exhibit Q. 21 Additionally, the Project Order includes the following requirements: 22
OAR Chapter 635, Division 100 (Wildlife Diversity Plan) and ODFW’s website contain 23 the State list of threatened and endangered wildlife species. The applicant should 24 include in its application for a site certificate a list of both state-listed and federally-listed 25 threatened and endangered wildlife species and State Sensitive Species that have 26 potential to occur in the analysis area. The applicant should identify these species based 27 on a review of literature, consultation with knowledgeable individuals, and reference to 28 the list of species published by the Biodiversity Information Center. 29
As discussed in Section V(p) above, the applicant has proposed a “phased survey” 30 approach for data collection during the site certificate review process, and the 31 Department understands that the applicant’s data at the time of application submittal 32 might be incomplete. Nevertheless, Exhibit Q should include as much information as 33 possible about the results of the field surveys conducted to date for threatened and 34 endangered species and state sensitive species on state, private, and federal lands. The 35 schedule for future surveys, and the estimated date that results will be available, should 36 also be incorporated into Exhibit Q. 37
As for other biological resources, the information should include the survey 38 methodology, exact survey areas, and the results of all surveys. Surveys must be 39 performed by qualified survey personnel during the season or seasons appropriate to 40 the detection of the species in question. 41
Exhibit Q should include analysis of how the evidence provided supports a finding by the 42 Council that the proposed facility meets the Council’s threatened and endangered 43 species standard. Provide proposed site certificate conditions for the Council’s 44 consideration related to requirements for the applicant to complete all unfinished surveys 45

Boardman to Hemingway Transmission Line Project Exhibit Q
PRELIMINARY APPLICATION FOR SITE CERTIFICATE Page Q-3
within the project’s site boundary prior to construction. The proposed site certificate 1 conditions should also address submittal requirements for reporting future survey 2 results, and the applicant’s proposed approach to document approval of final results by 3 agencies or the Council prior to commencing construction activities. 4
As documented in Table Q-5 (Submittal Requirements Matrix), IPC has drafted Exhibit Q to 5 respond to each paragraph of OAR 345-021-0010(1)(q) described above, as well as the 6 additional requirements set forth in the Project Order. 7
3.0 ANALYSIS 8
3.1 Analysis Area 9
Pursuant to the Project Order, the analysis area for Exhibit Q is the area within the Site 10 Boundary and 0.5 mile from the Site Boundary. The Site Boundary is defined in OAR 345-001-11 0010(55) as “the perimeter of the site of a proposed energy facility, its related or supporting 12 facilities, all temporary laydown and staging areas, and all corridors and micrositing corridors 13 proposed by the applicant.” The Site Boundary for the Project includes the following related and 14 supporting facilities in Oregon: 15
• Proposed Corridor: 277.2 miles of 500-kilovolt (kV) transmission line corridor, 5.0 miles 16 of double circuit 138/69-kV transmission line corridor, and 0.3 miles of 138-kV 17 transmission line corridor. 18
• Alternate Corridor Segments: Seven alternate corridor segments consisting of 19 approximately 134.1 miles that could replace certain segments of the Proposed Corridor. 20 IPC has proposed these alternate corridor segments in order to allow flexibility for IPC 21 and EFSC, as well as federal agencies, to reconcile competing resource constraints in 22 several key locations. 23
• One proposed substation expansion of 3 acres; two alternate substation sites (one 3-24 acre substation expansion and one new 20-acre substation). IPC ultimately needs to 25 construct and operate only one substation expansion or substation in the Boardman 26 area. 27
• Eight communication station sites of less than one acre each in size; four alternate 28 communication station sites along alternate corridor segments. 29
• Temporary and permanent access roads. 30
• Temporary multi-use areas, pulling and tensioning sites, and fly yards. 31
The features of the Project are fully described in Exhibit B and the Site Boundary for each 32 Project feature is described in Exhibit C, Table C-21. The location of the Project (Site Boundary) 33 is outlined in Exhibit C 34

Boardman to Hemingway Transmission Line Project Exhibit Q
PRELIMINARY APPLICATION FOR SITE CERTIFICATE Page Q-4
3.2 Methods 1
After consultation with applicable federal and state agencies, IPC determined that field surveys 2 and data collection for the Project would be conducted via a phased study approach, which 3 utilized three phases (see Exhibit P, Attachment P-3).1 During Phase 1 (i.e., the initial desktop 4 review), IPC compiled existing biological information from multiple data sources regarding the 5 occurrence of special status species within the Site Boundary. In Phase 2, IPC’s consultants 6 undertook comprehensive field survey efforts in portions of the Site Boundary for which IPC was 7 granted access. Phase 3 has not yet occurred, but will consist of all preconstruction surveys that 8 may be necessary to identify special status species locations for avoidance and mitigation 9 compliance with temporal or spatial restrictions, micro-siting route changes, or to complete 10 surveys and provide analysis on previously unsurveyed areas. 11
3.2.1 Initial Desktop Review 12
Existing data were initially utilized to determine the preliminary list of federally- or state-listed 13 species that could potentially occur within the analysis area. Databases and literature from the 14 Oregon Biodiversity Information Center2 (ORBIC 2008, 2010, 2012), StreamNet (StreamNet 15 2010), Oregon Department of Fish and Wildlife (ODFW 2008), Oregon Department of Agriculture 16 (ODA 2008), U.S. Department of Agriculture, Forest Service (USFS 2008), Bureau of Land 17 Management (BLM 2008), the Geographic Biotic Observation (GeoBOB) database (BLM 2012a), 18 watershed basin plans, ODFW native fish status report (ODFW 2005), Federal Register 19 notifications, Bonneville Power Administration and Northwest Power and Conservation Council 20 reports, and the National Oceanic and Atmospheric Administration Fisheries Division (NOAA 21 Fisheries 2009) were reviewed for information on the location of federally- or state-listed species. 22 Fish were assumed present in all perennial streams, while fish were assumed present in 23 intermittent streams if the Oregon Streamflow Duration Assessment Method (OSDAM) data 24 indicated that the stream contained macro-invertebrates (see the discussion of OSDAM data and 25 the wetland surveys in Exhibits P and J), or if agency biologists indicated that an intermittent 26 stream contained fish when water is present. Specific federally- or state-listed fish species were 27 considered present in the analysis area if agency biologists indicated that these species may be 28 present, or if literature or databases contained occurrences or descriptions of these fish within 29 the steams or their reaches crossed by the analysis area (as opposed to the assumption of 30 general fish presence made for all perennial streams and specific intermittent streams). For all 31 other wildlife species, they were considered potentially present if they had an occurrence within 32 0.5 mile of the Site Boundary, or if their range and suitable habitat overlapped this area. For plant 33 species, they were considered potentially present if they had an occurrence within 5 miles of the 34 Site Boundary, or if their range and suitable habitat overlapped this area; a larger study area was 35 used for plants due to the high level of uncertainty in existing databases regarding plant 36 locations. However, as a lack of documented occurrence in an area does not constitute a true 37 lack of occurrence by a species, local agency experts were consulted, and field surveys were 38 conducted to better identify the list of species that could potentially occur within the analysis area 39 (see discussion in Section 3.2.2). 40
1 Note that the original dates of the phased survey effort proposed in the Biological Survey Work Plan (i.e., Attachment P-3) do not always directly correspond to the dates in which these surveys were actually conducted; several of the surveys outlined in the Biological Survey Work Plan were conducted earlier (i.e., in an earlier year) than proposed in Attachment P-3. See Table P-1 for a list of dates in which surveys were completed. 2 ORBIC requested that occurrence locations for these rare species be kept confidential; upon request, they may be available from Oregon Department of Energy with approval from ORBIC.

Boardman to Hemingway Transmission Line Project Exhibit Q
PRELIMINARY APPLICATION FOR SITE CERTIFICATE Page Q-5
3.2.2 Field Surveys 1
On August 22, 2008, a meeting was held in Baker City, Oregon, with land managers and 2 biologists from the ODFW, Idaho Department of Fish and Game (IDFG), USFS, U.S. Fish and 3 Wildlife Service (FWS), NOAA Fisheries, and the BLM. The purpose of this meeting was to 4 establish an interagency/intergovernmental working group that would determine the list of 5 species that could potentially occur near the Project, as well as identify the surveys and 6 protocols that would be required to identify wildlife/fish species, rare plant species, wetlands, 7 vegetation, and general habitats in the analysis area. Subsequent meetings with ODFW 8 biologists were held in Baker City on September 30, 2008, and in Pendleton, Oregon, on 9 October 17, 2008. A meeting with the IDFG was held in Boise, Idaho, on February 9, 2009. A 10 draft of the Biological Survey Work Plan, which contained the proposed biological surveys and 11 their protocols, was submitted to agency specialists on February 10, 2009. On February 17, 12 2009, a meeting with the Oregon Department of Energy (ODOE), ODFW, USFS, FWS, NOAA 13 Fisheries, and BLM was conducted to discuss the surveys and protocols proposed in the draft 14 Biological Work Plan. Shortly after, IPC initiated the Community Advisory Process (CAP) to 15 develop a broader range of possible routes for the Project. Following completion of the CAP, a 16 second interagency meeting involving representatives of the ODFW, BLM, USFS, ODOE, 17 NOAA Fisheries, and FWS was held on October 26, 2010, to obtain additional input on species 18 and habitats along IPC’s Proposed Corridor and alternate corridor segments. Input from agency 19 specialists was used to identify the federally- or state-listed species that could occur within the 20 analysis area, those that would require field surveys, and the species targeted during concurrent 21 field surveys. The Revised Final Biological Survey Work Plan (dated April 2011) contains a list 22 of all agency required biological surveys, as well as a detailed description of the final protocols 23 used (see Exhibit P, Attachment P-3). 24
IPC attempted to gain access rights to all areas that would require surveys. On federally- and 25 state-managed lands, this was accomplished through coordination with the respective agencies. 26 On privately owned lands, individual permission from each landowner is required prior to 27 accessing the land. In some cases, private landowners did not allow IPC access rights to their 28 lands; therefore, IPC has not completed surveys for the areas to which access rights to private 29 lands were not granted by the landowner. Table Q-1 lists the various biological surveys that 30 were conducted (relative to Exhibit Q), the survey protocols that were used, the dates of these 31 surveys, the approximate acreage of area requiring surveys, the total acreage that has been 32 surveyed to date, and the strategy that would be followed in order to complete a 100 percent 33 survey coverage of the necessary area. These areas are shown in Figures Q-1 through Q-3. 34

Boardman to Hemingway Transmission Line Project Exhibit Q
PRELIMINARY APPLICATION FOR SITE CERTIFICATE Page Q-6
Table Q-1. Biological Surveys Related to Exhibit Q 1
Survey Name Protocol Used
Total Area Requiring Surveys
(acre)
Surveys Completed to
Date (acre / date) Compliance Strategy
Washington Ground Squirrel
Status and Habitat Use of the Washington Ground Squirrel (Spermophilus washingtoni) on State of Oregon Lands (Morgan and Nugent 1999); see Attachment P-8
16,761; see Figure Q-1
10,270 / May 2012 IPC will survey all previously unsurveyed parcels (i.e., areas where access to private lands has not been granted) after it obtains right-of-entry and prior to construction on those parcels. IPC will use the same protocols used during its earlier surveys, and will provide the results of the surveys to ODOE prior to construction.
Special Status Plant Survey
The BLM’s “Intuitive Controlled Survey” method was used to identify special status plants and their habitat (BLM 2012b).
31,696; see Figure Q-2
14,961 / July 2012 IPC will survey all previously unsurveyed parcels (i.e., areas where access to private lands has not been granted) after it obtains right-of-entry and prior to construction on those parcels. IPC will use the same protocols used during its earlier surveys, and will provide the results of the surveys to ODOE prior to construction.
Terrestrial Visual Encounter Survey (TVES)
USFS Multiple Species Inventory and Monitoring Technical Guide (Manley et al. 2006) ; see Attachment P-8
31,638; see Figure Q-3
25,869 / July 2012 IPC will survey all previously unsurveyed parcels (i.e., areas where access to private lands has not been granted) after it obtains right-of-entry and prior to construction on those parcels. IPC will use the same protocols used during its earlier surveys, and will provide the results of the surveys to ODOE prior to construction.
Boardman to Hemingway Transmission Line Project Exhibit Q
PRELIMINARY APPLICATION FOR SITE CERTIFICATE Page Q-7
1
Figure Q-1. Washington Ground Squirrel 2011 and 2012 Surveys 2

Boardman to Hemingway Transmission Line Project Exhibit Q
PRELIMINARY APPLICATION FOR SITE CERTIFICATE Page Q-8
1
Figure Q-2. Special Status Plant 2011 and 2012 Surveys 2

Boardman to Hemingway Transmission Line Project Exhibit Q
PRELIMINARY APPLICATION FOR SITE CERTIFICATE Page Q-9
1 Figure Q-3. Terrestrial Visual Encounter Survey Areas 2011 and 2012 2

Boardman to Hemingway Transmission Line Project Exhibit Q
PRELIMINARY APPLICATION FOR SITE CERTIFICATE Page Q-10
The following subsections provide a summary of the surveys that were conducted for federally- 1 or state-listed wildlife and fish species or their habitats, the areas that were surveyed under 2 these protocols, as well as those areas that still require surveys (i.e., areas or land parcels 3 where access to private lands was not granted). Descriptions of the general surveys that are not 4 directly related to federally- or state-listed wildlife and fish species can be found in Exhibit P 5 (e.g., sage-grouse [Centrocercus urophasianus] surveys or wetland surveys). Complete field 6 survey coverage of the species-specific survey areas will be required as a condition of the Site 7 Certificate for the Project. 8
3.2.2.1 Washington Ground Squirrel Surveys 9
The protocols used during the Washington ground squirrel (Urocitellus [Spermophilus] 10 washingtoni) surveys were based on the survey methods described in Morgan and Nugent 11 (1999). The exact details and justifications for these methods are provided in the Revised Final 12 Biological Survey Work Plan (see Exhibit P, Attachment P-3), as well as the Washington 13 Ground Squirrel Surveys technical report (see Exhibit P, Attachment P-8). The following is a 14 brief summary of the timing and scope of these surveys. 15
Washington ground squirrel surveys followed the methodology developed in Morgan and 16 Nugent (1999). The survey area for Washington ground squirrel includes the Site Boundary and 17 an area within 785 feet of the Site Boundary within areas of suitable Washington ground squirrel 18 habitat. During surveys, a crew of two to eight biologists walked meandering line transects, each 19 spaced 165 feet (50 meters) apart, to provide survey coverage of the habitat within the survey 20 area. The surveys were conducted between approximately 7:30 a.m. and 3:00 p.m. Surveys 21 were not conducted when wind conditions were above 15 miles per hour. Professional judgment 22 was used when wind speeds were greater than 6 miles per hour or when visibility was poor, as 23 both of these conditions could limit the observer’s ability to detect alarm calls or observe sign. 24 Surveys commenced at least one hour after sunrise to allow for temperatures to increase 25 sufficiently to support ground squirrel activity. The survey area was surveyed twice, once in April 26 and once in May of 2011, to correspond with the highest Washington ground squirrel activity 27 period (i.e., when juveniles have emerged and alarm calls are most frequent). 28
Colonies were designated active when Washington ground squirrel activity was confirmed 29 through visual detection of a squirrel, audio confirmations (hearing alarm or social calls), and/or 30 fresh Washington ground squirrel scat near burrows. Scat samples were collected at active 31 burrows for confirmation of squirrel presence. A burrow was identified as potential if it was a 32 hole that was freshly dug (no vegetation or cobwebs), structurally sound, and the appropriate 33 size for this species, but no other Washington ground squirrel sign (scat, visual, audio) was 34 observed. Each site was resurveyed approximately 2 weeks after the first survey; spacing the 35 surveys apart by roughly 2 weeks ensured that ground squirrel activity would be captured 36 despite any local differences in activity level throughout the season. During the second survey, 37 all potential burrows identified during the first survey were revisited and any confirmed activity 38 was documented. During the second survey, 165-foot-wide transects were walked 39 perpendicularly to the first survey transects in order to maximize coverage of the habitat. In 40 areas where no or few potential burrows were found during the first survey, surveyors had the 41 option of walking offset transects parallel to, but between, the original transects (i.e., offset by 42 roughly 82 feet). Any potential burrows identified during the first survey were approached at a 43 90 degree angle during the second survey to minimize the chance of missing a visual or audio 44 detection due to landscape features or prevailing wind directions. 45

Boardman to Hemingway Transmission Line Project Exhibit Q
PRELIMINARY APPLICATION FOR SITE CERTIFICATE Page Q-11
3.2.2.2 Special Status Plant Surveys 1
The protocols used during the special status plant surveys, as well as the exact details and 2 justifications of these protocols, are detailed in the Revised Final Biological Survey Work Plan 3 (see Exhibit P, Attachment P-3), as well as the Special Status Plant Surveys technical report 4 (see Exhibit P, Attachment P-8). The following is a brief summary of the timing and scope of 5 these surveys. 6
The survey area for special status plant surveys is the Site Boundary. Botanists familiar with the 7 federally- or state-listed species potentially present within the survey area performed surveys 8 using systematic pedestrian transects. The suitable habitat polygons for federally- or state-listed 9 plants were identified through geographic information system (GIS) analysis of National 10 Agriculture Imagery Program (NAIP), Northwest Regional Gap Analysis Landcover Data 11 (NWGAP), and ORBIC occurrence data. These suitable habitat polygons were the areas 12 targeted for surveys; they were located in the field by botanists using a survey grade (one meter 13 accuracy) Global Positioning System (GPS) unit. Spacing between the individual botanists was 14 adjusted based on habitat, in order to achieve 100 percent visual coverage. 15
When a federally- or state-listed species was located, a GPS position was recorded (point 16 locations were recorded for individual occurrences or communities occupying an area less than 17 10 meters in diameter, while polygons were recorded for larger communities). Photographs 18 were taken and the data were recorded on the Oregon Rare Plant Occurrence form. Field crews 19 used GPS technology for data collection activities. Trimble GeoXT survey grade receivers 20 loaded with Environmental Systems Research Institute (or ESRI) ArcPAD 10 software were 21 used by crews conducting field surveys. 22
Because phenology and local climate vary along the Project’s length, surveys were conducted 23 in three periods. Survey Period 1 occurred from April 24 to May 2, 2011, between mileposts 24 (MPs) 265 and 285 (these MPs fall within the Snake River Plain ecoregion). Survey Period 2 25 occurred from May 31 to June 8, 2011, between MPs 21 and 150 (these MPs fall within a 26 stretch that encompasses portions of both the Columbia Plateau and Blue Mountain 27 ecoregions). Survey Period 3 occurred from July 5 to July 14, 2011, between MPs 298 and 150 28 (these MPs fall within a portion of the Project that passes through the Snake River Plain and a 29 small portion of the Northern Basin and Range before transition to the Blue Mountain 30 ecoregion). 31
3.2.2.3 Terrestrial Visual Encounter Survey (TVES) 32
The protocols used during the Terrestrial Visual Encounter Surveys (TVES) were adapted from 33 the USFS Multiple Species Inventory and Monitoring Technical Guide (Manley et al. 2006). The 34 exact details and justifications for these methods are provided in the Revised Final Biological 35 Survey Work Plan (Exhibit P, Attachment P-3), as well as the Terrestrial Visual Encounter 36 Surveys Technical Report (Exhibit P, Attachment P-8). The following is a brief summary of the 37 timing and scope of these surveys. 38
The TVES is a walking survey that identifies species presence through evidence of use. TVES 39 include visual and auditory confirmation of a species, and evidence of sign such as burrows, 40 nests, feathers, fecal material, and tracks. The focus of the TVES was on special status species 41 (e.g., federal Endangered Species Act– [ESA-] listed species, state-listed species, and State 42 Sensitive species) as well as their habitat; however, all species encountered during TVES were 43 identified to the extent practical. In addition, these special status species were surveyed 44 concurrently with other Project related protocol surveys using the TVES method (Manley et al. 45 2006). In addition to functioning as a general wildlife survey, TVES also recorded ecological 46

Boardman to Hemingway Transmission Line Project Exhibit Q
PRELIMINARY APPLICATION FOR SITE CERTIFICATE Page Q-12
systems, noxious weed populations, unique habitats, potential wetlands, and areas where 1 proposed roads may cross streams or drainages. 2
The survey area for the TVES is the Site Boundary. To conduct the TVES, three observers 3 systematically surveyed the Site Boundary for wildlife and their sign, and documented 4 vegetation communities by traversing the Site Boundary along evenly spaced meandering 5 transects. One observer walked the centerline while the other two observers walked at a 6 distance of 150 feet to 175 feet from either side of the centerline. This methodology allowed the 7 observers to cover the entire corridor in one pass. Three observers were used to reduce 8 observer fatigue, improve consistency in identifications by comparing observations, and provide 9 a second opinion for difficult identifications. 10
3.2.2.4 Preconstruction Surveys 11
IPC will implement preconstruction surveys to determine if any additional areas have become 12 occupied by special status species since the initial Phase 2 surveys. The species targeted for 13 surveys during preconstruction surveys include those listed in Table 1 of the Revised Final 14 Biological Survey Work Plan (Exhibit P, Attachment P-3). Preconstruction surveys would include 15 surveys for all state and federal listed terrestrial species; however, listed fish species would be 16 assumed in all waters where their presence has been identified previously. The results of these 17 preconstruction surveys would be used to microsite Project components outside of occupied 18 areas to the extent feasible. Preconstruction surveys would also be required in certain areas if 19 the Project’s Site Boundary changes after Phase 2 surveys have been conducted (e.g., the 20 surveys discussed in Exhibit P, Sections 3.3.1.4 and in Exhibit Q, Sections 3.2.2.1 to 3.2.2.3), 21 and when IPC obtains access to previously unsurveyed parcels. 22
The ODFW has provided guidance on Washington ground squirrel preconstruction surveys, and 23 has indicated that surveys for this species are valid for 3 years. Therefore, preconstruction 24 surveys will be required for the Washington ground squirrel because construction will occur after 25 2013. 26
3.3 Information Required by OAR 345-021-0010(1)(q) 27
3.3.1 Species Occurrence and Potential Adverse Effects 28
OAR 345-021-0010(1)(q)(A) 29
Based on appropriate literature and field study, identification of all threatened or endangered species 30 listed under ORS 496.172(2), ORS 564.105(2) or 16 USC § 1533 that may be affected by the 31 proposed facility. 32
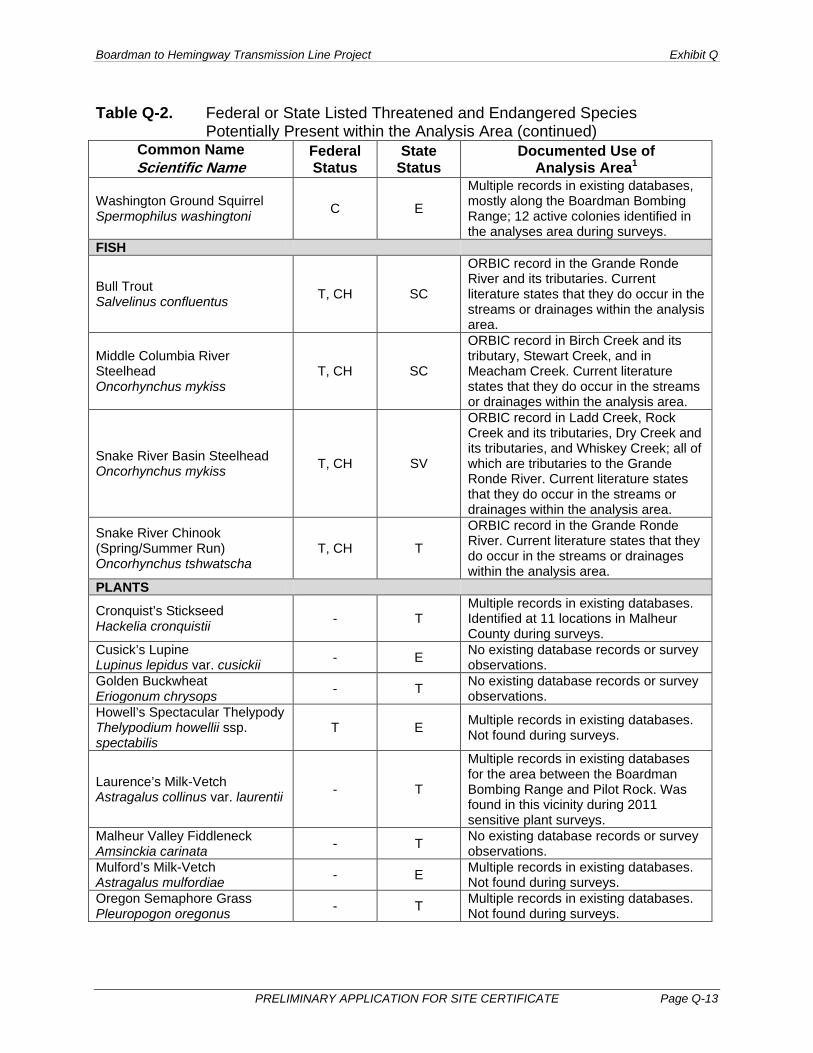
Table Q-2 lists the federally- or state-listed species that are expected to occur within the analysis area, 33 based on the initial review of existing data, consultations with the interagency/intergovernmental 34 working group, and the results of field studies conducted to date (see Section 3.2). 35
Table Q-2. Federal or State Listed Threatened and Endangered Species Potentially 36 Present within the Analysis Area 37
Common Name Scientific Name
Federal Status
State Status
Documented Use of Analysis Area1
WILDLIFE Gray Wolf Canis lupus
E (west of Highway
395) E
Two records in existing databases for the Baker County area. Not found during surveys.
38
Boardman to Hemingway Transmission Line Project Exhibit Q
PRELIMINARY APPLICATION FOR SITE CERTIFICATE Page Q-13
Table Q-2. Federal or State Listed Threatened and Endangered Species Potentially Present within the Analysis Area (continued)
Common Name Scientific Name
Federal Status
State Status
Documented Use of Analysis Area1
Washington Ground Squirrel Spermophilus washingtoni C E
Multiple records in existing databases, mostly along the Boardman Bombing Range; 12 active colonies identified in the analyses area during surveys.
FISH
Bull Trout Salvelinus confluentus T, CH SC
ORBIC record in the Grande Ronde River and its tributaries. Current literature states that they do occur in the streams or drainages within the analysis area.
Middle Columbia River Steelhead Oncorhynchus mykiss
T, CH SC
ORBIC record in Birch Creek and its tributary, Stewart Creek, and in Meacham Creek. Current literature states that they do occur in the streams or drainages within the analysis area.
Snake River Basin Steelhead Oncorhynchus mykiss T, CH SV
ORBIC record in Ladd Creek, Rock Creek and its tributaries, Dry Creek and its tributaries, and Whiskey Creek; all of which are tributaries to the Grande Ronde River. Current literature states that they do occur in the streams or drainages within the analysis area.
Snake River Chinook (Spring/Summer Run) Oncorhynchus tshwatscha
T, CH T
ORBIC record in the Grande Ronde River. Current literature states that they do occur in the streams or drainages within the analysis area.
PLANTS Cronquist’s Stickseed Hackelia cronquistii - T
Multiple records in existing databases. Identified at 11 locations in Malheur County during surveys.
Cusick’s Lupine Lupinus lepidus var. cusickii - E No existing database records or survey
observations. Golden Buckwheat Eriogonum chrysops - T No existing database records or survey
observations. Howell’s Spectacular Thelypody Thelypodium howellii ssp. spectabilis
T E Multiple records in existing databases. Not found during surveys.
Laurence’s Milk-Vetch Astragalus collinus var. laurentii - T
Multiple records in existing databases for the area between the Boardman Bombing Range and Pilot Rock. Was found in this vicinity during 2011 sensitive plant surveys.
Malheur Valley Fiddleneck Amsinckia carinata - T No existing database records or survey
observations. Mulford’s Milk-Vetch Astragalus mulfordiae - E Multiple records in existing databases.
Not found during surveys. Oregon Semaphore Grass Pleuropogon oregonus - T Multiple records in existing databases.
Not found during surveys.

Boardman to Hemingway Transmission Line Project Exhibit Q
PRELIMINARY APPLICATION FOR SITE CERTIFICATE Page Q-14
Table Q-2. Federal or State Listed Threatened and Endangered Species Potentially Present within the Analysis Area (continued)
Common Name Scientific Name
Federal Status
State Status
Documented Use of Analysis Area1
Packard’s Mentzelia Mentzelia packardiae - T
No existing database records or survey observations. Furthermore, suitable habitat for this species (ashy soil) does not occur within the portion of the Project that crosses this species habitat; therefore, this species is highly unlikely to occur within the analysis area.
Red-Fruited Lomatium Lomatium erythrocarpum - E No existing database records or survey
observations. Salt Heliotrope Heliotropium curassavicum - E Multiple records in existing databases.
Not found during surveys. Smooth Mentzelia Mentzelia mollis - E Multiple records in existing databases.
Not found in Oregon during surveys.
Snake River Goldenweed Pyrrocoma radiata - E
Multiple records in existing databases. Identified at 11 locations in Baker County during surveys.
Sterile Milk-Vetch (a.k.a. Cusick’s Milk-vetch) Astragalus cusickii var. sterilis
- T Multiple records in existing databases. Not found during surveys.
T = Threatened; E = Endangered; C = Candidate for listing; CH = Critical Habitat designated under the federal 1 Endangered Species Act; 2 SC = State Sensitive Critical; SV = State Sensitive Vulnerable 3 1 Based on results of Project-specific surveys, as well as the databases discussed in Section 3.2.1 (e.g., 2012 ORBIC 4 or GeoBOB data) 5 6
OAR 345-021-0010(1)(q)(B) 7
For each species identified under (A), a description of the nature, extent, locations and timing of its 8 occurrence in the analysis area and how the facility might adversely affect it. 9
Both temporary and permanent impacts to federally- or state-listed species and their habitats 10 could occur from the construction, operations, and retirement of the Project. 11
Temporary impacts during construction include direct impacts, such as ground disturbance to 12 areas that would be restored to preconstruction conditions following completion of the Project; 13 these include areas along temporary access roads, multi-use areas, fly yards, pulling and 14 tensioning sites, and construction areas around tower pads. Temporary impacts from 15 construction would also include indirect impacts, such as general disturbance of wildlife 16 resulting from noise, dust, and/or the presence of workers and construction equipment in and 17 near wildlife habitats. Temporary impacts during operations would result from the periodic 18 disturbance associated with inspection and maintenance of the line; while temporary impacts 19 associated with retirement of the Project would be similar to those described for construction. 20 These impacts would result in a temporary loss of habitat quality or utility, which would last for 21 the duration of the disturbance, as well as the length of the recovery period for ground 22 disturbances. The recovery period for agricultural areas that were directly disturbed could be as 23 short as 1 to 3 years; grasslands and herbaceous wetlands would generally recover within 24 3 to 7 years; shrublands may require 30 to 100 years to recover (with the longer recovery 25 periods associated with disturbances in mature sage-brush habitats located in arid regions or for 26

Boardman to Hemingway Transmission Line Project Exhibit Q
PRELIMINARY APPLICATION FOR SITE CERTIFICATE Page Q-15
specific sage-brush species; e.g., Artemisia tridentata ssp. wyomingensis); and forested and 1 woodland areas could take anywhere from 50 to many hundreds of years to reach 2 preconstruction conditions (depending on the condition of the area prior to construction). Arid 3 sites with naturally sparse vegetation, as well as those with saline or alkaline soils, shallow soils, 4 compacted soils, or areas that have a high erosion potential, may be difficult to restore and 5 could require special techniques or repeated revegetation efforts by IPC; for additional 6 information, refer to the draft Reclamation and Revegetation Plan in Exhibit P, Attachment P-4. 7
Permanent impacts would be associated with areas that are disturbed during construction (by 8 both direct and indirect impacts), but which are not restored to preconstruction conditions. 9 Permanent indirect impacts would include an increased risk for the spread or establishment of 10 invasive plant species (which can degrade habitats and exclude native species from areas), and 11 increased access to areas previously inaccessible to the public due to the construction of 12 Project-related roads (which can further degrade habitats as a result of increased human 13 presence). Permanent direct impacts would be primarily associated with ground disturbances 14 that are not restored to preconstruction conditions (e.g., areas under tower bases and the 15 footprint of substations). Permanent impacts would occur along new access roads, new or 16 expanded substations, and tower bases, as well as within the permanent right-of-way (ROW) 17 along portions of the Project that cross forested/woodland habitats and vegetative maintenance 18 zones. These impacts would either result in a loss of habitat utility (e.g., in areas occupied by 19 tower bases) or a conversion of one habitat type to another (e.g., conversion of forested 20 habitats to shrub and grass habitats under the transmission line). The draft Vegetation 21 Management Plan (Exhibit P, Attachment P-5) contains a detailed description of the types of 22 impacts that would occur within the portion of the ROW located in forested and woodland 23 habitats. Exhibit B describes the Project in detail, as well as the associated construction and 24 operational activities that could result in soil disturbance and habitat impacts. 25
The following subsections discuss the life histories, habitat requirements, current threats, and 26 likelihood of occurrence within the analysis area for each special status species. It also presents 27 a summary of potential species-specific impacts for each federally- or state-listed special status 28 species identified in Table Q-2. Sections 3.3.3, 3.3.4, and 3.3.5 discuss the potential for Project 29 related impacts to affect the continued existence of each species or its critical habitat (if 30 applicable). 31
3.3.1.1 Wildlife 32
Gray Wolf 33
Background 34 The gray wolf was federally listed as endangered in 1974. However, as of May 2011, gray 35 wolves in Oregon have been removed from the federal threatened and endangered species list; 36 except for wolves located west of Highway 395, where they are still federally listed as 37 endangered (76 Federal Register 25590). They are also state-listed as endangered in Oregon 38 (ORBIC 2010). 39
Habitat 40 Wolves are considered habitat generalists, and do not require a specific habitat type for survival. 41 Habitat for wolves is largely based on the density of prey species found within a given area as 42 well as the absence of human activity. Therefore, they could be present along any portion of the 43 Project regardless of habitat type. 44

Boardman to Hemingway Transmission Line Project Exhibit Q
PRELIMINARY APPLICATION FOR SITE CERTIFICATE Page Q-16
Threats 1 The main threat to this species in Oregon would be direct mortality resulting from poaching. 2
Occurrence 3 Wolves were considered extirpated from Oregon, but they have recently been sighted in the 4 Imnaha, Wenaha, and Walla Walla Wildlife Management Units in northeastern Oregon (located 5 approximately 20 to 35 miles north of the Project) and these wolf sightings are believed to 6 represent resident packs (ODFW 2011a). These wolves emigrated naturally from Idaho. 7 Furthermore, ORBIC has a museum record (from 1972) of a gray wolf from Baker County, near 8 its border with Union County. 9
Potential Adverse Effects 10 Because the gray wolf is considered a habitat generalist, habitat loss resulting from the Project’s 11 construction would not have a measurable effect on this species. Wolves have large home 12 ranges and habitually travel long distances, so they could occasionally utilize the analysis area. 13 Direct impacts to wolves are unlikely; however, visual and noise disturbance during construction 14 (i.e., indirect impacts) would likely cause wolves to avoid the area, thus resulting in a slight shift 15 in movement patterns or behaviors if they were present in the area during construction activities. 16
Washington Ground Squirrel 17
Background 18 The FWS has received a petition to list the Washington ground squirrel under the federal ESA. 19 However, in November 1994, the FWS determined that listing the Washington ground squirrel 20 was warranted but precluded by higher priority species, thereby designating the Washington 21 ground squirrel as a candidate species. The Washington ground squirrel is currently state-listed 22 in Oregon as endangered. 23
Habitat 24 Washington ground squirrels are associated with sagebrush-steppe and native bunchgrass 25 habitats, generally located below 800 feet in elevation (Eder 2002). They use areas with high 26 sagebrush canopy cover. The presence of deep, weak, undisturbed soil (i.e., Warden soil) in 27 which they dig their burrows seems to be an essential habitat component (FWS 2004). 28
Threats 29 The biggest factor causing the decline of this species is habitat loss (NatureServe 2011). In its 30 2010 review, the FWS concluded that due to widespread risks, the magnitude of threats to this 31 species is high (75 Federal Register 69239). Although the Washington ground squirrel faces 32 both imminent and non-imminent threats, FWS stated that the threats are non-imminent at the 33 scale of the entire range of this species. This was based on the enactment of the Candidate 34 Conservation Agreement and that impacts from future agricultural and wind developments will 35 be minimized due to the Oregon State ESA and Columbia Basin Ecoregion wind energy 36 guidelines (75 Federal Register 69239). The FWS has assigned a listing priority number of 5 to 37 the Washington ground squirrel (on a scale of 1 to 12, with 1 indicating the highest listing 38 priority; 75 Federal Register 69239). 39
Occurrence 40 There are multiple records for Washington ground squirrels along the portion of the analysis 41 area located in Morrow County (Morgan and Nugent 1999; Marr 2004; NWC and WEST 2005; 42 PPM Energy 2006; NWC 2008; ORBIC 2008, 2010, 2012). Furthermore, Project surveys have 43

Boardman to Hemingway Transmission Line Project Exhibit Q
PRELIMINARY APPLICATION FOR SITE CERTIFICATE Page Q-17
identified 12 active colonies along the portion of the analysis area located in Morrow County, 1 with colony sizes ranging from 0.05 acre to 41 acres. 2
Potential Adverse Effects 3 As discussed in Exhibit P, Washington ground squirrel colonies as well as a 785-foot buffer 4 around the colony (restricted to suitable habitat) were classified as Category 1 habitats under 5 the ODFW Fish and Wildlife Habitat Mitigation Policy (OAR 635-415-0025). IPC will attempt to 6 avoid impacts to Category 1 habitat for the Washington ground squirrel. Construction activities 7 near Washington ground squirrel Category 1 habitats would be restricted to times outside of this 8 species’ activity period (March through June), thereby minimizing impacts to any habitat or 9 individuals located outside of the 785-foot buffer. 10
Potential indirect impacts may include increases in predation pressures on squirrels (resulting 11 from the consolidation of raptors and ravens along the new transmission line due increased 12 avian perching opportunities. It is possible that the transmission line and its structures could 13 become an attractant to raptor and ravens for nesting and perching habitats (Gilmer and Wiehe 14 1977; Knight and Kawashima 1993; Steenhof et al. 1993; Connelly et al. 2004; Manzer and 15 Hannon 2005; Coates and Delehanty 2010). The numbers of ravens and raptors that use 16 existing transmission lines for perching habitat can become quite substantial. For example, a 17 study conducted along a 500-kV transmission line that spanned from south-central Idaho to 18 south-central Oregon found approximately 2,100 ravens at a single roost that spanned 19 approximately 4 miles of the line and 15 towers (Engel et al. 1992). Although the presence of 20 this 500-kV transmission line likely resulted in an increase in the number of ravens within the 21 roosts, Engel et al. (1992) concluded that each of the major roosts found during the study were 22 situated in an area where ravens had roosted communally before the line was constructed. If 23 the Project’s transmission line and structures becomes an attractant to raptor and raven, and 24 their numbers increase along the Project, this factor coupled with the reduced shrub cover in 25 areas recovering from construction disturbances (i.e., a reduction in hiding cover for small 26 animals), could result in increased predation rates on prey species. The extent that these 27 impacts could occur depends on the hunting range of predatory avian species. For example, 28 non-breeding pairs of ravens have been documented to travel an average of 4.3 miles (6.9 29 kilometers) and up to 40.5 miles (65.2 kilometers) in Idaho from roost sites to food sources and 30 16.8 miles (27 kilometers) in Michigan (ranging from 0.5 to 91.3 miles [0.8 to 147.0 kilometers]), 31 with breeding pairs often traveling up to 0.8 mile (1.3 kilometer) while searching food (i.e., they 32 were flying to a landfill), and 0.35 mile (0.56 kilometer) while hunting (Engel and Young 1992; 33 Boarman and Heinrich 1999). Golden eagle hunting ranges vary by season and location, but are 34 typically very large (e.g., they can be around 161.6 square miles [260 square kilometers]; 35 DeGraaf and Yamasaki 2000). These impacts would be greatest in areas where existing 36 perching opportunities are not present (i.e., in open habitats where the Project is not located 37 adjacent to existing lines); however, the entire length of the route located near Washington 38 ground squirrel colonies is co-located with existing power-lines. Therefore, for the portion of the 39 Project located near Washington ground squirrel colonies, the Project is not expected to provide 40 new perching opportunities to areas that do not already contain these opportunities. 41
3.3.1.2 Fish 42
Various terms are used by regulatory agencies to define groups of fish species, including those 43 that are considered sensitive. NOAA Fisheries uses the term Distinct Population Segments 44 (DPSs) for specific steelhead interbreeding groups, and Evolutionarily Significant Units (ESUs) 45 for similar groups of salmon. The FWS also uses the term DPS for similar groups of fish under 46 their jurisdiction (e.g., bull trout). The State of Oregon uses the term Species Management Units 47
Boardman to Hemingway Transmission Line Project Exhibit Q
PRELIMINARY APPLICATION FOR SITE CERTIFICATE Page Q-18
(SMUs) for fish of interest that are interbreeding members of the same species present in the 1 same geographic region. 2
Bull Trout 3
Background 4 The bull trout DPS was listed as threatened under the federal ESA in June 1998 within the 5 Columbia River basin (63 Federal Register 31647), and throughout the United States in 6 November 1999 (64 Federal Register 58910). Three Oregon state-listed critical sensitive SMUs 7 are present in basins crossed by the Project, including the Umatilla, Grande Ronde, and 8 Malheur SMUs (ORBIC 2010, 2012). However, the only SMU that could potentially be affected 9 by the Project (based on waterbodies crossed) is the Grande Ronde SMU. 10
Critical habitat for the bull trout has been designated under the federal ESA. Critical habitat for 11 bull trout includes stream channels up to the ordinary high water line or bank-full elevation 12 where this species occurs. The Primary Constituent Elements (PCEs) of this critical habitat are: 13 1) springs, seeps, groundwater sources, and connectivity to supply suitable water quality; 2) 14 migratory habitat with minimal obstructions; 3) abundant food base; 4) complex streams, rivers, 15 lakes, and marine shoreline; 5) water temperatures ranging from 36 to 59°F (2 to 15°C) 16 including refuge habitat when temperatures are in the upper range; 6) sufficient quality substrate 17 for successful spawning, egg incubation, and rearing (e.g., less than 12 percent fines); 7) 18 natural hydrograph; 8) sufficient water quality for normal activities; and 9) few or no non-native 19 predators. The mainstem of the Grande Ronde River is the only designated critical habitat for 20 the bull trout crossed by the Project. 21
Habitat 22 Bull trout have a varied life history exhibiting both resident and migratory life-history strategies; 23 migratory bull trout spawn in streams and juveniles mature in larger rivers, lakes, or saltwater. In 24 inland forms, many areas include populations that undergo large regional seasonal migrations 25 such as: 1) movements between early rearing areas, 2) movements from juvenile to adult 26 rearing areas, and 3) movement to and from spawning areas. Connectivity between stream 27 areas is therefore considered a major factor in species and local population area preservation. 28 Four general factors are considered critical for proper conditions for bull trout habitat: clean 29 water, cold water, a complex stream habitat environment, and stable connections between 30 watersheds. Among salmonids in the Northwest, bull trout require some of the coldest and 31 cleanest water systems to survive, and are often considered an indicator of environmental 32 quality in watersheds (Wydoski and Whitney 2003). 33
Threats 34 No overall threat analysis has been developed for bull trout by the FWS; however, general 35 categories of threat were noted in the 5-year status review (FWS 2008), including dams, forest 36 practices, livestock grazing, agriculture, transportation systems, mining, residential and urban 37 development, fisheries management, and natural actions such as fires and floods. 38
Occurrence 39 Bull trout are native to the Pacific Northwest and western Canada. They historically occurred in 40 major river drainages from the McCloud River in northern California, and the Jarbidge River in 41 Nevada north to the headwaters of the Yukon River in Northwest Territories and east into 42 Oregon, Montana, and Alberta. 43
Bull trout in the analysis area are found in the Umatilla, Grande Ronde, Malheur, and Powder 44 river systems. Known distribution in the Umatilla River is located downstream of any proposed 45

Boardman to Hemingway Transmission Line Project Exhibit Q
PRELIMINARY APPLICATION FOR SITE CERTIFICATE Page Q-19
crossings, including the Umatilla River mainstem and Meacham Creek, which the Project 1 crosses along its headwaters. In the Malheur and Powder river systems, the stream crossings 2 by the Project are located downstream of bull trout habitat. However, bull trout are present along 3 the portion of the analysis area that crosses the Grande Ronde River’s mainstem. This area is 4 considered migratory habitat for bull trout in this system, but not a spawning or rearing 5 environment (StreamNet 2011). 6
The Grande Ronde region (i.e., the only region that is crossed by the Project and may contain 7 bull trout; see discussion above) is considered primarily a migration route for bull trout 8 (StreamNet 2011). The major spawning areas in the Grande Ronde system are Minam, Lostine, 9 and Wenaha rivers and Lookingglass Creek (Nowak 2004). Bull trout have both resident (Little 10 Minam) and fluvial (migratory between small and large stream) populations, which are common 11 in this system. There is some movement in and out of the Grande Ronde river system by these 12 bull trout. Upstream spawning migration occurs from mid-April through June and again in 13 October through November (ODFW 2011b). Movement in the mainstem Grande Ronde in 14 summer, however, is limited by temperature (Nowak 2004). Bull trout spawn in September and 15 October in this system (ODFW 2011b). Egg incubation through fry emergence in tributaries may 16 extend through April (ODFW 2011b). After juveniles have reared in the tributaries, they may 17 move back downstream, primarily in spring or fall. 18
Potential Adverse Effects 19 Impacts to federally- or state-listed fish species, such as the bull trout, could occur at locations 20 where the Project either crosses areas that contain these species or at crossings directly 21 upstream of occupied areas (approximately 200 feet upstream3), as well as occupied areas that 22 are not directly crossed but which are located adjacent to general soil disturbance and 23 vegetative clearing. The amount of soil disturbance adjacent to waterbodies, as well as the 24 number of waterbody crossings, the types of waterbodies crossed (e.g., intermittent or 25 seasonally dry ephemeral, versus perennial streams), and the methods used to cross these 26 waterbodies (i.e., transmission line spanning waterbodies versus access roads directly crossing 27 them), would affect the type and magnitude of impacts that could occur to federally- or state-28 listed fish species or their habitats. Potential Project-related impacts to fish species/habitats 29 include alterations to suspended sediments, sedimentation, temperature, large woody debris 30 (LWD) input, as well as impacts related to the toxic effect of spills and use of chemicals adjacent 31 to or within waterbodies. As currently proposed, the transmission line would span fish-bearing 32 streams; however, no new road crossings are proposed for any fish-bearing streams, as all 33 proposed road crossing of fish-bearing streams would utilize existing access roads. Therefore, 34 impacts to fish passage, as well as impacts related to fish salvage, are not likely to occur. The 35 potential impacts of this Project on waterbodies and fish species are discussed in more detail 36 within the following subsections. Table Q-3 lists the stream crossings (i.e., areas spanned by 37 the transmission line) that contain federally- or state-listed fish species, as well as the amount of 38 soil disturbance adjacent to the waterbody, and the amount of forested riparian vegetation that 39 would be removed at each crossing. 40
3 Research by Ritter (1984) suggests that noticeable increases in suspended sediment (e.g., over 20 milligrams per liter [mg/L]) would not likely occur within 100 feet downstream for small perennial streams and possibly about 200 feet for large perennial streams crossed by roads or transmission lines where actions actually disturb the stream bank or bottom (see further discussion in the “Turbidity and Sedimentation” section).

Boardman to Hemingway Transmission Line Project Exhibit Q
PRELIMINARY APPLICATION FOR SITE CERTIFICATE Page Q-20
Table Q-3. Stream Crossings (i.e., areas spanned by the transmission line) that Contain Federal or State Listed Fish Species 1
Facility County Subbasin
Name Subbasin
HUC MP Stream Name
Stream Type
Terrestrial Habitat
Known Habitat Use3
Fish Species Documented at or
1,000 feet Downstream of the Crossing2
Riparian Vegetation
Type1
Total Soil Impact within
500 feet of Stream
(acre)
Impact to Forested Riparian C
hino
ok
Salm
on
Stee
lhea
d
Bul
l Tro
ut
Glass Hill Alternate Corridor Segment
Union County, OR
Upper Grande Ronde
17060104 5.3 Graves
Creek Perennial Forested None None Spawning X
6.6 Rock Creek Perennial Shrub None None Spawning X
Proposed Corridor
Umatilla County, OR
Umatilla 17070103
72.9 Birch Creek Perennial Forested 0.7 0.7 Spawning X
75.9 Little McKay Creek
Intermittent Shrub 0.1 None Historical X
84 McKay Creek Perennial Forested 2.5 2.5 Historical X
Union County, OR
Upper Grande Ronde
17060104
102.7 Dry Creek Perennial Forested None None Spawning X
107.7 Grande Ronde River
Perennial Forested None None Spawning/Rearing X X X
109.9 Graves Creek Intermittent Forested None None Spawning X
110.1 Rock Creek Perennial Shrub None None Spawning X
110.8 Sheep Creek Perennial Forested None None Spawning X
117.1 Tributary to Rock Creek
Intermittent Forested None None Spawning X
122.4 Ladd Creek Perennial Forested None None Historical X
1 Riparian areas are defined as one site-potential tree height in forested areas, and the 100-year floodplain in non-forested areas. 2 2 Chinook salmon, steelhead, and bull trout are all listed as threatened under the federal Endangered Species Act. 3 HUC = Hydrologic Unit Code; MP = milepost 4

Boardman to Hemingway Transmission Line Project Exhibit Q
PRELIMINARY APPLICATION FOR SITE CERTIFICATE Page Q-21
Riparian Vegetation Removal 1 Removal of riparian vegetation can have several potential adverse effects to aquatic systems, 2 including an increase in erosion, reduced filtration of run-off, destabilization of stream banks, 3 reduction of stream shade, reduced input of important terrestrial food source (i.e., allochthonous 4 input), and a decrease in the availability of LWD. Riparian vegetation loss would initially occur 5 during construction; however, ongoing vegetation maintenance in forested habitats would result 6 in a permanent loss of trees within the Site Boundary of the transmission line. As this Project 7 crosses through mostly low lying shrubland vegetation, and forested/woodland habitats are 8 mostly located in the Blue Mountains region, removal of trees in riparian areas is expected to be 9 low. Furthermore, in areas spanned by the transmission line, trees would not be removed as 10 long as the height of the tree (once mature) would not come within 50 feet of the wires (see 11 Attachment P-5, draft Vegetation Management Plan, in Exhibit P). Construction of new access 12 roads across forested riparian areas would, however, result in removal of trees within the extent 13 of the road bed. These roads would typically consist of a 14- to 16-foot-wide cleared areas on 14 flat ground, but may be up to 30 feet wide in some sloping areas to accommodate cut or fill; 15 however, no new road crossings are proposed for any fish bearing streams (as all proposed 16 crossing of fish bearing streams would utilize existing access roads). 17
Stream temperature can be affected by removal of streamside vegetation. Cool stream 18 temperatures are required for proper completion of life cycle functions of salmon and trout in 19 Northwest streams. Warm water temperatures can limit rearing, spawning, egg incubations, and 20 migration of salmon and trout (ODEQ 1995; McCullough 1999; McCullough et al. 2001; Sauter 21 et al. 2001; Ecology 2002; EPA 2003). For example, the maximum temperature in the short-22 term (i.e., less than a week) that may cause direct mortality of salmon and trout range from 23 about 71.6 to 78.8°F (22 to 26°C) depending on the species (EPA 2003; Ecology 2002; ODEQ 24 1995). Regarding bull trout specifically, under laboratory conditions, bull trout mortality has been 25 documented in less than 24 hours when bull trout are exposed to temperatures of 26°C or more 26 (Selong et al. 2001). Fatal temperature limits for Chinook have been recorded at 25ºC 27 (acclimation temperature 20 and 24°C) by Brett (1952), and 24.9°C (acclimation temperature 28 21.1°C) by Orsi (1971). Hicks (2000) recommended that daily maximum temperatures remain 29 below 19° to 20°C to prevent directly lethal conditions to steelhead. Furthermore, rearing habitat 30 quality may be reduced when temperature exceeds 12 to 20°C for extended periods, depending 31 on species and food availability (EPA 2003), and bull trout do not typically utilize habitats where 32 the water temperatures exceed 15°C. 33
Temperature changes from loss of riparian vegetation are likely to be varied among streams. 34 Generally, the larger the relative area exposed to solar radiation, the greater the magnitude of 35 temperature change. Total temperature change across a cleared area, however, would be 36 greater in smaller streams than in larger ones, due largely to shallower depth and lower volume 37 of water in smaller streams. However, as most of the riparian areas in the analysis area 38 currently consist of shrubs and grasses, and much of this vegetation would not be permanently 39 cleared by the Project, retained streamside vegetation is likely suitable to maintain adequate 40 shade and would prevent temperature increases. DeWalle (2010) examined models of the effect 41 of buffer height, width, and vegetation density on maintaining adequate shade on streams. He 42 concluded that for a moderate to high density of canopy thickness, a ratio of buffer height to 43 stream width of five would maintain adequate stream shade. This suggests that streams in the 44 range of about 3 to 7 feet wide, with a vegetation buffer of 15 and 35 feet high or wide, may be 45 adequately buffered to maintain temperature if the density of vegetation is high, indicating even 46 a moderate retention of vegetation could help moderate stream water temperatures crossed by 47 the Project. As a result, Project actions would not likely result in a substantial temperature 48 increase that could result in a biological effect at most locations that contain fish resources. 49
Boardman to Hemingway Transmission Line Project Exhibit Q
PRELIMINARY APPLICATION FOR SITE CERTIFICATE Page Q-22
Turbidity and Sedimentation 1 The clearing of vegetation, installation of culverts, as well as the presence and use of access 2 roads can increase the input of sedimentation into adjacent waterbodies. Salmon and trout 3 species have been shown to be very sensitive to elevated levels of suspended sediment, 4 turbidity, and fine accumulation to stream bottoms (Spence et al. 1996; Meehan 1991; Anderson 5 et al. 1996; Lloyd et al. 1987; Newcomb and Jensen 1996; Servizi and Martens 1992; Bisson 6 and Bilby 1982; Sigler et al. 1984; Hicks et al. 1991). Increased turbidity and sedimentation can 7 impact fish behavior and physiological processes (e.g., blood chemistry, gill trauma, immune 8 system resistance), and can result in reduced growth, health, and an increase in the risk of 9 mortality. Sediment entering the water column can be redeposited on downstream substrates, 10 which could bury aquatic macroinvertebrates (an important food source for salmon and trout). 11 Additionally, downstream sedimentation could impact spawning habitat, spawning activities, 12 eggs, larvae, and juvenile fish survival, as well as benthic community diversity and health. 13 Because the impacts of increased sedimentation and turbidity are typically limited to the period 14 of work / soil disturbance, the duration of these impacts is expected to be relatively short. 15 However, specific site characteristics including flow, substrate composition, relative disturbance, 16 and other factors could extend the duration of construction related sedimentation. Construction 17 of access roads across waterbodies and culvert installation, as well as any other in-water work, 18 is typically a major contributor to waterbody sedimentation; however, no new access roads 19 across fish-bearing streams are proposed for the Project. Use of existing access roads, soil 20 disturbance adjacent to waterbodies, as well as clearing of vegetation in areas where the line 21 would span waterbodies would, however, contribute to the risk of erosion and sedimentation. 22
Ritter (1984) developed a model estimating downstream distance and concentration of 23 suspended sediment from construction of a pipeline from wet bottom trenching (i.e., a very 24 significant form of stream bottom disturbance). This form of bottom disturbance is likely much 25 greater than what would occur from normal stream crossing related to transmission line 26 construction activities (including road and culvert construction). Transmission line disturbance is 27 likely more similar to the “dry” crossing pipeline construction type, in which bottom disturbance 28 is isolated from flowing water (e.g., empirical suspended sediment data by Reid et al. [2002] 29 found that dry, open-cut pipeline installation produced about one-seventh the amount of 30 sediment produced by wet cut pipeline methods). Adjusting the Ritter (1984) wet bottom 31 trenching model for the lower suspended sediment concentration (in proportion to estimates for 32 dry crossing method) suggests that noticeable increases in suspended sediment (e.g., over 20 33 milligrams per liter [mg/L]) would not likely occur within 100 feet downstream for small perennial 34 streams and possibly about 200 feet for large perennial streams crossed by roads or 35 transmission lines where actions actually disturb the stream bank or bottom. This estimate is 36 likely still higher than what is likely to occur from most stream crossings that would occur as a 37 result of the Project. It should be noted that turbidity levels (as measured in nephelometric 38 turbidity units [NTUs]) are strongly correlated with suspended sediment levels (Lloyd et al. 1987; 39 Rosetta 2005) and would follow similar patterns of change in magnitude. 40
Based on the above literature on construction effects at stream crossings, downstream 41 sediment travel in streams is likely to be generally low. It is expected that effects would 42 generally be limited to a few hundred feet below disturbances. Furthermore, IPC has developed 43 measures to limit the risk of erosion and sedimentation; these measures are contained in the 44 draft Reclamation and Revegetation Plan (Exhibit P, Attachment P-4), the draft Vegetation 45 Management Plan (Exhibit P, Attachment P-5), and the Spill Prevention, Control, and 46 Countermeasure Plan (see Exhibit P, Attachment P-6, draft Species Conservation Plan, as well 47 as Exhibit J). 48
Boardman to Hemingway Transmission Line Project Exhibit Q
PRELIMINARY APPLICATION FOR SITE CERTIFICATE Page Q-23
Fish Passage 1 Unrestricted access to habitat is important for both resident and anadromous salmonids. 2 Upstream-migrating fish require access to suitable spawning gravel and juvenile fish must be 3 able to disperse upstream and downstream to take advantage of available rearing habitat. If 4 culverts are poorly designed, constructed, or maintained, they can affect the population of entire 5 stream drainages. Currently, no culverts are proposed for fish-bearing streams and no new 6 access roads across fish-bearing streams are proposed for this Project; however, if culvert 7 installation is required, IPC would install all culverts in accordance with ODFW fish passage 8 rules and approvals. In addition, culverts (if required) would be installed in accordance with BLM 9 and USFS requirements on federally-managed lands (see Section 3.3.2). As a result of these 10 requirements, recommendations, and project designs, the Project is unlikely to adversely affect 11 fish passage. 12
Spills of Toxic Materials 13 Another potential impact to fish habitat during construction is the risk of hazardous materials 14 entering surface water supplies. For example, petroleum products entering streams can have 15 direct toxic effects to fish and indirect effects by impacting aquatic macroinvertebrates (i.e., a 16 major food source for fish). With the use of heavy and light equipment within construction sites, 17 there is the potential for spills of fuel and oils from storage containers, equipment working in or 18 near streams, and fuel transfers. In addition, the construction of the tower footings would require 19 the pouring of concrete. If wet concrete or concrete cleaning water enters streams, it could have 20 an adverse effect on fish (e.g., stress or injury) and other aquatic organisms resulting from 21 elevation of pH levels. Herbicides used near waterbodies (used to control invasive plant 22 species) can leach into waterbodies, or run off into waterbodies during rain events. These 23 herbicides can have adverse effects on fish species, resulting in reduced fitness or mortality. 24
To reduce the risk of oils, wet concrete, or wash water entering streams, IPC would follow the 25 avoidance and minimization measures outlined in Spill Prevention, Containment, and 26 Countermeasures (SPCC) Plan (see Exhibit P, Attachment P-6, draft Species Conservation 27 Plan, as well as Exhibit J, which contains some of the preliminary measures that would be 28 followed), which will developed by the project Engineering Procurement, and Construction 29 contractor and submitted to ODOE prior to commencing construction of the Project. Both 30 Attachment P-6 and Exhibit J contain measures that would prevent hazardous substances from 31 entering fish-bearing streams. Use of herbicides would be restricted to applicable 32 agency/landowner approved methods and herbicide types (see Exhibit P, Attachment P-4, draft 33 Reclamation and Revegetation Plan; and Attachment P-6, draft Species Conservation Plan), 34 which would include restrictions on where herbicides could be used (e.g., restriction on use near 35 waterbodies). 36
Fish Salvage 37 Fish salvage (i.e., removal or exclusion of fish from an area) is often necessary during 38 installation of culverts in perennial streams. Potential adverse effects of fish salvage include fish 39 injury, stress, and direct mortality. Injury and stress could result in the individual fish becoming 40 more susceptible to infection or predation, thereby resulting in mortality. However, as no culvert 41 installation is currently proposed for fish-bearing streams, no fish salvage is expected to occur 42 for this Project. 43
Middle Columbia River Steelhead 44
Background 45 The Middle Columbia River steelhead DPS is listed as threatened under the federal ESA. 46

Boardman to Hemingway Transmission Line Project Exhibit Q
PRELIMINARY APPLICATION FOR SITE CERTIFICATE Page Q-24
Critical habitat for Middle Columbia River steelhead includes stream channels in the designated 1 streams with lateral extent up to the ordinary high water line or bankfull elevation; lakes to the 2 perimeter of the waterbody or ordinary high water (whichever is greater); and estuarine and 3 nearshore marine areas contiguous with the shoreline at extreme high water out to a depth no 4 greater than 98 feet relative to mean low water, where these fish occur (70 Federal Register 5 52630). The PCEs are: 1) freshwater spawning sites (spawning, incubation, and larval 6 development), 2) freshwater rearing sites (with physical and biological properties to support 7 juvenile development), 3) freshwater migration corridors (with physical and biological properties 8 to support juvenile and adult movements), 4) estuarine areas (with physical and biological 9 properties to support smoltification, juvenile and adult growth and survival), 5) nearshore marine 10 areas (with physical and biological properties to support growth and survival), and 6) offshore 11 marine areas (with physical and biological properties to support growth and survival). Critical 12 habitat would be crossed by the Project along Birch Creek. The mainstem Umatilla River and 13 Meacham Creek also have critical habitat, but these are located downstream of the corridor and 14 would not be crossed by the Project. 15
Habitat 16 The Middle Columbia River steelhead are summer run fish, with the exception of the Klickitat 17 River which has both summer and winter runs. Most Middle Columbia River juveniles become 18 smolts at age 2, and spend 1 to 2 years in saltwater before returning to freshwater where they 19 may remain up to a year prior to spawning (Busby et al. 1996). Downstream entry into the 20 Middle Columbia River by summer steelhead varies somewhat by system; entry to the John Day 21 River begins about August and extends through May, which may be similar to entry to the 22 Umatilla (which is the closest system timing reported; Busby et al. 1996). Upstream migration 23 within the rivers also varies, with peak movement in the Umatilla from September through mid-24 June (ODFW 2011b). Adults remain in the river system until spawning occurs the following 25 spring (late February to early June; ODFW 2011b). Incubation and emergence occurs from 26 about mid-February into early July for the Umatilla mainstem (ODFW 2011b). Smolt 27 outmigration occurs in February through June in the Umatilla mainstem (ODFW 2011b). 28
Threats 29 Threats to this DPS and causes for its listing include water diversion for agricultural use, 30 hydropower development on the Columbia River, hatchery introgression, predation, and harvest 31 both within their natal rivers and the Columbia River (NMFS 1996). Additional locally adverse 32 conditions include water quality concerns, impassable barriers, habitat quality and complexity, 33 and flow regime modification. Many eastside Umatilla River system waterbodies have been 34 listed as temperature impaired, with water in some tributaries exceeding 70°F during the 35 summer. This species recovery plan (NMFS 2009) noted the following as the current major 36 limiting factors and threats for recovery for the Umatilla River system: 1) degraded tributary 37 habitat from elevated sediment and increased temperature blocking passage, degraded 38 floodplain and channel structure; 2) hatchery effects from out of basin strays; 3) 39 predation/competition/disease both with local (resident fish) and outside (mainstem and estuary) 40 fish; and 4) mainstem Columbia River passage issues including delay and direct mortality. 41
Occurrence 42 Abundance of the DPS has changed markedly over time. Historical run size to the Columbia 43 River was estimated to be about 300,000 fish, but by the late 1980s was estimated at only 44 39,000 wild fish (Busby et al. 1996). By the time of listing in 1999, the populations remained 45 considerably below historical levels, especially in the major river systems including the Yakima, 46 John Day, and Deschutes (64 Federal Register 14517). However, there have been substantial 47 population increases in recent years (71 Federal Register 834). Based on a 2005 status review, 48 returns to the Umatilla basin have increased relative to the previous analysis (Good et al. 2005). 49

Boardman to Hemingway Transmission Line Project Exhibit Q
PRELIMINARY APPLICATION FOR SITE CERTIFICATE Page Q-25
Steelhead abundance in the Umatilla remains relatively low at about 65 percent of the interim 1 recovery targets, but returns have generally improved since 1999. 2
The major river systems in which this DPS are found include the Yakima, Umatilla, John Day, 3 Deschutes, Fifteen Mile Creek, Touched, and Klickitat rivers; with the largest producer of DPS 4 (at the time of listing) including the Deschutes, John Day, and Klickitat rivers (Busby et al. 5 1996). Summer steelhead are present at the proposed crossing of Birch Creek within the 6 Umatilla River system (see Table Q-3). 7
Potential Adverse Effects 8 This species does occur within the analysis area; therefore, potential adverse impacts are 9 possible. Potential impacts to this species as well as the measures to reduce the risk of these 10 impacts would be similar to those described for the bull trout. 11
Snake River Basin Steelhead 12
Background 13 The Snake River Basin steelhead DPS is listed as threatened under the federal ESA (71 14 Federal Register 834). 15
Critical habitat for Snake River Basin steelhead has the same functional definition as for the 16 Middle Columbia River steelhead (see discussion above) relative to extent of marine, estuarine, 17 and stream channel water levels (70 Federal Register 52630). The PCEs are also the same, 18 and include spawning, freshwater rearing, migration corridor, estuarine, and offshore marine 19 habitat. The transmission line would span this designated critical habitat at five streams (one 20 crossing at each stream), including the Grande Ronde River, and Dry, Graves, Rock, and 21 Sheep creeks. In addition, Graves and Rock creeks are each crossed by access roads 22 associated with the Proposed Corridor (see Table Q-3); however, no road crossings associated 23 with alternate corridor segments cross steelhead’s critical habitat. 24
Habitat 25 The Snake River Basin steelhead are summer-run fish, with what is known as “A” and “B” runs 26 that are based on time of river entry, with the A run beginning in May and the B run beginning in 27 July (Busby et al. 1996). Juveniles of the Snake River system typically smolt at age 2, with 28 some fish smolting at age 3. A and B runs typically spend 1 and 2 years, respectively, in 29 saltwater before returning to freshwater where they may remain up to a year prior to spawning 30 (Busby et al. 1996). Summer steelhead entry varies somewhat by system (Busby et al. 1996). 31 Upstream migration in the upper Grande Ronde River occurs from mid-February through April 32 (ODFW 2011b). Adults remain in the river system until spawning occurs, which in the Grande 33 Ronde River is April and May (ODFW 2011b). Incubation and emergence occurs from April 34 through June in the Grande Ronde (ODFW 2011b). Smolt outmigration occurs any month of the 35 year in the Grande Ronde (ODFW 2011b) although most outmigration of steelhead smolts in the 36 Snake River System occurs from April through June. 37
Threats 38 Threats to this DPS and causes for its listing include logging, water diversion for agricultural 39 use, hydropower development on the Columbia and Snake rivers, hatchery introgression, 40 habitat blockages, mining, as well as sport, commercial, and tribal harvest (NMFS 1996). 41 Adverse conditions related to the Grande Ronde area include water quality concerns, habitat 42 quality and complexity, and flow regime modification. Many eastside Grande Ronde River 43 system waterbodies have been listed as temperature impaired, with water in some tributaries 44 exceeding 70°F during the summer. A recovery plan that includes the Washington State portion 45 of the Grande Ronde River (NMFS 2009) noted the current major threats and limiting factors for 46

Boardman to Hemingway Transmission Line Project Exhibit Q
PRELIMINARY APPLICATION FOR SITE CERTIFICATE Page Q-26
this recovery region, including: 1) degraded stream habitat from elevated sediment, reduced 1 flow and increased temperature, decreased riparian conditions, and lack of channel function and 2 form; 2) mainstem Columbia and Snake river passage issues including migration delay and 3 direct mortality of adult and juveniles, gas super saturation, and predation; 3) potential cross of 4 hatchery fish with native fish in spawning areas; and 4) outside habitat conditions (mainstem, 5 estuary, and ocean) (NMFS 2006). 6
Occurrence 7 Historical estimates of total natural run size of the Snake River steelhead DPS are not available, 8 but half of the Columbia Basin steelhead production is believed to occur in the Snake River 9 system (Good et al. 2005). Counts over a dam on the lower Clearwater River were 40,000 to 10 60,000 in the 1960s, and runs in the Salmon River system were substantial at that time. The 11 Grand Ronde River had escapement of more than 15,000 in the 1960s (Good et al. 2005). A 5-12 year average escapement over Lower Granite Dam on the Snake River just prior to the 2006 13 listing was only 9,400 natural steelhead (Busby et al. 1996). In recent years, however, there 14 have been substantial population increases (71 Federal Register 834). Based on a 2005 status 15 review, returns to the Upper Grande Ronde River have generally increased relative to the early 16 1990s (Good et al. 2005). Interim target abundance for a monitored tributary in the upper 17 Grande Ronde River has been averaging 1,547 fish, which is greater than the 1,400 fish interim 18 recovery target number. 19
This DPS of steelhead is found in the Washington, Idaho, and Oregon regions of the Snake 20 River basin and is present in major Snake River tributaries downstream of Hells Canyon Dam 21 including the Salmon, Clearwater, Tucannon, Imnaha, Wallowa, and Grande Ronde rivers 22 (Busby et al. 1996). Additionally, six artificial propagation programs are considered part of this 23 DPS (71 Federal Register 834); however, none of these are in the Grande Ronde River Basin. 24 In the Grande Ronde system, the DPS is present at several stream crossings along the 25 Proposed Corridor including the Grande Ronde River and Dry, Graves, Rock, and Sheep 26 creeks. According to StreamNet, all crossings are considered spawning and rearing habitat. 27 Graves and Rock creeks, where steelhead are known to be present, are crossed by some of the 28 Project roads (see Table Q-3). Project activities may affect the DPS in the Grande Ronde 29 system. 30
Potential Adverse Effects 31 This species does occur within the analysis area; therefore, potential adverse impacts are 32 possible. Potential impacts to this species as well as the measures to reduce the risk of these 33 impacts would be similar to those described for the bull trout. 34
Snake River Chinook (Spring/Summer Run) 35
Background 36 The Snake River spring/summer-run Chinook salmon ESU is listed as threatened under the 37 federal ESA (70 Federal Register 37160), and is also state-listed as threatened by Oregon. 38
Critical habitat for Snake River spring/summer-run Chinook salmon has the same functional 39 definition as the Middle Columbia River steelhead (see discussion above) relative to extent of 40 marine, estuarine, and stream channel water levels (70 Federal Register 52630). The PCEs are 41 also the same, including spawning, freshwater rearing, migration corridors, estuarine, and 42 offshore marine habitat. The only designated critical habitat crossed by the Project is the main 43 channel of the Grande Ronde River. 44

Boardman to Hemingway Transmission Line Project Exhibit Q
PRELIMINARY APPLICATION FOR SITE CERTIFICATE Page Q-27
Habitat 1 The Snake River Basin spring/summer-run Chinook salmon has both race types in the basin. 2 Generally, the spring run begins passing dams on the Columbia River system in early March 3 through early June while the summer run begins in June extending through August (Good et al. 4 2005). The smolts are considered “stream type,” typically spending a year in freshwater before 5 migrating out to the ocean in the spring of their second year. The Grande Ronde River has only 6 spring-run fish. Most adults in the Grande Ronde system return primarily as 4 year olds, 7 spending 2 years in the ocean (Myers et al. 1998). Upstream migration of this ESU within the 8 Snake River system also varies, ranging from late March through July depending on the system. 9 For Grande Ronde River spring-run Chinook salmon, upstream migration occurs from April 10 through mid-July (Myers et al. 1998). Holding may span April through September, and spawning 11 in the Grande Ronde River occurs from mid-August through September (ODFW 2011b). 12 Incubation and emergence occurs from about mid-August through March (ODFW 2011b). 13 Downstream juvenile fish movement may extend from September through mid-May (ODFW 14 2011b), with migration to the ocean accruing March through May (Nowak 2004). 15
Threats 16 Threats to this ESU and causes for its listing include water withdrawal and irrigation, timber 17 harvest, road construction, livestock grazing, mining, major hydroelectric development on the 18 Columbia and Snake rivers, freshwater predation from native and non-native organisms 19 (especially at dams), marine predation, and several natural factors like ocean conditions (e.g., 20 decadal cycle) and global factors like climate change (NMFS 1998). Adverse conditions related 21 to the Grande Ronde area include water quality concerns, habitat quality and complexity, and 22 flow regime modification. A recovery plan that includes only the Washington State portion of the 23 Grande Ronde River for all listed fish in the region (NMFS 2009) noted the following current 24 major threats and limiting factors for recovery of the lower Snake River system: 1) degraded 25 stream habitat from elevated sediment, reduced flow and increased temperature, decreased 26 riparian conditions, and lack of channel function and form; 2) mainstem Columbia and Snake 27 river passage issues including migration delay and direct mortality of adults and juveniles, gas 28 super-saturation, and predation; 3) potential cross of hatchery fish with native fish in spawning 29 areas; 4) and outside habitat conditions (mainstem, estuary, and ocean) (NMFS 2009). 30
Occurrence 31 Abundance has decreased from historical levels; however, as noted in the 2005 status review, 32 there had been recent increasing trends in the later 1990s period, and a large increase in 2001 33 (Good et al. 2005). The historical run size to the Snake River basin is not known, but is thought 34 to be about 40 percent of the total spring/summer run of the Columbia River system production, 35 which may have been about 1.5 million fish per year (Good et al. 2005). The average 5-year 36 return (1997–2001) over Lower Granite Dam has been 3,700 spring- and 6,000 summer-run 37 fish, respectively (Good et al. 2005). The Grande Ronde River had one of the higher short-term 38 increases in production rate over this ESU’s range, although total escapement to the upper 39 basin remains low. 40
The only location where this ESU would be present in the analysis area is in the mainstem 41 Grande Ronde River. None of the local tributaries are considered habitat for this species 42 (StreamNet 2011). The mainstem Grande Ronde is a migration and rearing corridor and not a 43 spawning area for Chinook salmon (SteamNet 2011). 44
Potential Adverse Effects 45 This species does occur within the analysis area; therefore, potential adverse impacts are 46 possible. Potential impacts to this species as well as the measures to reduce the risk of these 47 impacts would be similar to those described for the bull trout. 48

Boardman to Hemingway Transmission Line Project Exhibit Q
PRELIMINARY APPLICATION FOR SITE CERTIFICATE Page Q-28
3.3.1.3 Plants 1
Cronquist’s Stickseed 2
Background, Habitat, and Threats 3 Cronquist’s stickseed is state-listed as threatened in Oregon. This perennial species is in the 4 borage family and resembles the common garden forget-me-not (Myosotis sylvatica). It can 5 grow between 6 inches and 2 feet tall. This plant has hairy branched stems and relatively large 6 evergreen basal leaves up to 8 inches long; stem leaves are smaller than basal leaves 7 (ORNHIC 2010a). Flowers are white tinted with blue, and are present in May; seeds mature in 8 June. This plant occurs in Malheur and Baker counties where it grows in shrub-steppe habitat 9 on sandy, north-facing slopes (ORNHIC 2010a). Habitat loss and degradation via grazing and 10 urban/rural developments have adversely affected this species. Herbicide use, as well as 11 altered fire regimes resulting from invasions by fire-prone exotic weeds, also likely contribute to 12 the current threats to this species (ODA 2011). 13
Occurrence 14 There are multiple occurrences of Cronquist’s stickseed along the portion of the analysis area 15 located in Malheur County (based on existing databases); and 11 occurrences of this species 16 were detected in Malheur County during surveys of the analysis area. Some of the known 17 occurrences (based on existing databases) are located within the currently proposed 18 disturbance footprint4 of the Project (see Table Q-4). 19
Table Q-4. Populations of Federal or State Listed Plant Species Located within the 20 Project’s Currently Proposed Disturbance Footprint (based on existing 21 databases and survey data) 22
Facility Disturbance Type Cro
nqui
st's
Stic
ksee
d
Laur
ence
's M
ilk-V
etch
Mul
ford
's M
ilk-V
etch
Snak
e R
iver
Gol
denw
eed
Proposed Corridor and Substation
Existing Access Road Needing Improvement 21 42 - 53
Existing Access Road Needing Improvement and Other Disturbance Types - - - 72
New Access Road 21 - - 13 Tower Base - - - - Work Areas 11 13 - 32 Multiple Disturbance Types Not Including Existing Access Roads 21 - 11 -
Proposed 138/69-kV Rebuild
Existing Access Road Needing Improvement - - - 11 New Access Road - - - 13
23 4 The disturbance footprint consists of all areas that would be disturbed during construction of the Project; this is not the same thing as the Site Boundary which includes areas that would not be directly disturbed.

Boardman to Hemingway Transmission Line Project Exhibit Q
PRELIMINARY APPLICATION FOR SITE CERTIFICATE Page Q-29
Table Q-4. Populations of Federal or State Listed Plant Species Located within the 1 Project’s Currently Proposed Disturbance Footprint (based on existing 2 databases and survey data) (continued) 3
Facility Disturbance Type Cro
nqui
st's
Stic
ksee
d
Laur
ence
's M
ilk-V
etch
Mul
ford
's M
ilk-V
etch
Snak
e R
iver
Gol
denw
eed
Proposed 138/69-kV Rebuild (cont.)
Tower Base - - - 13
Work Areas - - - 11
Multiple Disturbance Types Not Including Existing Access Roads - - - 11
Malheur S Alternate Corridor Segment
Existing Access Road Needing Improvement 11 - 11 - New Access Road 11 - - - Tower Base 13 - - - Multiple Disturbance Types Not Including Existing Access Roads 21 - - -
Double Mountain Alternate Corridor Segment
New Access Road - - - - Tower Base - - - - Work Areas - - - - Multiple Disturbance Types Not Including Existing Access Roads 11 - - -
Willow Creek Alternate Corridor Segment
Multiple Disturbance Types Not Including Existing Access Roads - - - 11
1 Values from existing databases. 4 2 Values from both existing databases and Project-related surveys. 5 3 Values from Project-related surveys. 6
Potential Adverse Effects 7 This species was detected during Project surveys, and there are known occurrences (based on 8 existing databases) within the analysis area. Therefore, this species does occur within the 9 analysis area, and adverse impacts could be possible without proper avoidance and 10 minimization. If construction activities were allowed to occur within areas occupied by 11 Cronquist’s stickseed, this species would experience direct mortality via crushing, burial, or 12 grubbing. Soil disturbance could promote the spread or establishment of invasive plant species, 13 which could compete with and eventually exclude Cronquist’s stickseed from the area. 14 Furthermore, Project-related control and treatment of invasive plant species (e.g., weed removal 15 and/or use of herbicides) can result in collateral damage to non-targeted species if conducted 16 improperly. Invasive plant species can also increase the risk of fires, which can adversely affect 17 federally- or state-listed plant species. In addition, without proper construction and restoration 18 techniques, soil disturbance could result in erosion, thereby reducing or eliminating habitat 19 quality for federally- or state-listed plant species. However, these potential impacts would be 20 avoided and/or minimized by the measures discussed below as well as in Section 3.3.2. 21

Boardman to Hemingway Transmission Line Project Exhibit Q
PRELIMINARY APPLICATION FOR SITE CERTIFICATE Page Q-30
In order to prevent direct impacts from occurring to federally- or state-listed plant species, 1 preconstruction surveys would be conducted and all known and newly identified occurrences 2 (based on existing databases as well as survey results) would be avoided by micro-siting 3 Project components away from occupied areas whenever practical (disturbances would be 4 excluded within buffer distance recommended by the ODA). It is anticipated that the placement 5 of newly proposed developments (e.g., new access roads, fly yards, tower locations) could be 6 adjusted to avoid directly impacting federally- or state-listed plant species occurrences; 7 however, it would be much harder to avoid plants that are located along existing disturbances 8 (e.g., existing access roads that would be improved as part of the Project). For example, re-9 routing an existing road in order to avoid a sensitive plant species could result in additional 10 impacts to other sensitive resources due to the construction of a new road-bed as opposed to 11 utilizing an existing road-bed. As shown in Table Q-4, most of the occurrences of Cronquist’s 12 stickseed located within the currently proposed disturbance footprint are in areas where the 13 Project alignment could be micro-sited to avoid these occurrences (e.g., new access roads, fly 14 yards, tower locations); however, two occurrences along the Proposed Corridor and one 15 occurrence along the Malheur S Alternate Corridor Segment are located along an existing 16 access road that would need improvement. If avoidance of these occurrences cannot be 17 achieved during the road improvement, impacts would be minimized by the measures discussed 18 in Section 3.3.2 as well as the draft Species Conservation Plan (see Exhibit P, Attachment P-6). 19 In addition, topsoil in all disturbed areas (including suitable habitats for federally- or state-listed 20 plant species where no detections of these species have occurred) would be stored separately 21 from subsoil layers and would be restored back to the area from which it was removed (thereby 22 conserving the soil-stored seedbank; see Section 3.3.2). 23
Some indirect impacts to federally- or state-listed plant species could occur even if the plants 24 are avoided during construction. Indirect impacts could include soil erosion, spread of invasive 25 weeds, and alteration of fire regimes. The avoidance, minimization, and mitigation measures 26 discussed in Section 3.3.2 would be implemented to reduce the risk and magnitude of indirect 27 impacts to federally- or state-listed plant species. 28
Cusick’s Lupine 29
Background, Habitat, and Threats 30 Cusick’s lupine is state-listed as endangered in Oregon. This perennial in the pea family grows 31 in open, arid areas on ash deposits; it is typically found growing among dense sagebrush and 32 on nearly unvegetated slopes (ORNHIC 2010a). This lupine typically grows to approximately 33 15 inches tall with a somewhat matting habit; it has crowded racemes of white to bluish flowers 34 (Hitchcock et al. 1961). Cusick’s lupine flowers in mid-June. Cusick’s lupine’s small population 35 size and potentially low genetic variability exposes this species to an increased risk of 36 extirpation resulting from stochastic events (e.g., disease or poor growing years). Additional 37 risks to this species include off-road vehicle use, grazing by livestock, and losses due to native 38 herbivores (ODA 2011). 39
Occurrence 40 There are only 5 known populations of Cusick’s lupine, all of which are found in a specific area 41 of Baker County, Oregon (BLM 2009), which is located outside of the analysis area. Therefore, 42 there are no known occurrences of Cusick’s lupine within the analysis area, and this species 43 was not detected during Project surveys. 44
Potential Adverse Effects 45 Potential impacts to this species are highly unlikely to occur, as it is not known or suspected to 46 occur within or near the analysis area. However, if it was to occur in the analysis area, potential 47

Boardman to Hemingway Transmission Line Project Exhibit Q
PRELIMINARY APPLICATION FOR SITE CERTIFICATE Page Q-31
impacts as well as the measures to reduce the risk of these impacts would be similar to those 1 described for Cronquist’s stickseed. 2
Golden Buckwheat 3
Background, Habitat, and Threats 4 Golden buckwheat is state-listed as threatened in Oregon. This woody perennial herb grows in 5 a matted form, close to the ground. The leaves are clustered on basal off-shoots, and are 6 covered on both surfaces with dense wooly hairs. Clusters of capitate yellow flowers bloom from 7 June through September (OSU 2010). This species grows in sparsely vegetated areas with a 8 basalt rock substrate between 4,200 and 4,500 feet in elevation (OSU 2010). Threats to this 9 species include habitat degradation resulting from off-road vehicle use, grazing, and trampling 10 by livestock (ODA 2011). 11
Occurrence 12 Golden buckwheat is found in two counties in Oregon, including Malheur County (ORNHIC 13 2010b); however, there are no known occurrences of golden buckwheat within the analysis 14 area. Furthermore, this species was not detected during Project surveys, indicating that it may 15 not be present in the analysis area; however, suitable habitat for this species (i.e., basalt rocky 16 barren areas with in Malheur County) does occur within the analysis area. 17
Potential Adverse Effects 18 As there are no known records of this species within the analysis area, and it was not detected 19 during surveys, it is possible that golden buckwheat does not occur in this area. However, as 20 suitable habitat for this species does occur in the analysis area it is also possible that this 21 species occurs in this area but has simply not been detected to date, indicating that adverse 22 impacts are possible without proper avoidance and minimization. Potential impacts to this 23 species as well as the measures to reduce the risk of these impacts would be similar to those 24 described for Cronquist’s stickseed. 25
Howell’s Spectacular Thelypody 26
Background, Habitat, and Threats 27 Howell’s spectacular thelypody was included as a federally threatened species under the federal 28 ESA in June 1999 (64 Federal Register 8393). This species is also state-listed as endangered 29 in Oregon. This plant is a biennial forb in the mustard family that can grow to 2 feet tall. It has a 30 basal rosette of leaves that are approximately 2 inches long with wavy edges; the stem leaves 31 are smaller and do not have wavy margins (ODA 2008). This plant is found in alkali meadows 32 that are seasonally wet in the spring and at an elevation between 3,000 and 3,500 feet. 33 Typically, Howell’s spectacular thelypody habitat includes areas that have not been disturbed by 34 agriculture and are dominated by basin wildrye (Leymus cinereus) with greasewood 35 (Sarcobatus vermiculatus) and alkali saltgrass (Distichlis stricta; FWS 2002). It has been found 36 in Union, Baker, and Malheur counties; documented populations are located in the 37 Baker-Powder Valley and the Willow Valley. Of the 11 documented populations, only 2 are 38 protected (FWS 2002). The habitat of Howell’s spectacular thelypody has been disturbed 39 primarily for agriculture uses although grazing, invasive species, and other human activities also 40 threaten the species. This biennial species is short-lived and depends on frequent seed 41 production for its continued survival. This species also needs adequate moisture to thrive; 42 therefore, droughts can have adverse impacts to the species (CPC 2010). 43
Occurrence 44 There are several occurrences of Howell’s spectacular thelypody within the portion of the 45 analysis area located in the North Powder and Baker Valley areas; the closest occurrence is 0.5 46

Boardman to Hemingway Transmission Line Project Exhibit Q
PRELIMINARY APPLICATION FOR SITE CERTIFICATE Page Q-32
mile from the Site Boundary (based on existing databases). There is also an occurrence of this 1 species within 5 miles of the Flagstaff Alternate Corridor Segment, with the closest occurrence 2 located 3.5 miles from the Site Boundary (based on existing databases). However, these known 3 occurrences are all located outside of the currently proposed disturbance footprint. Furthermore, 4 this species was not detected during Project surveys. 5
Potential Adverse Effects 6 Although this species was not detected during Project surveys, there are known occurrences 7 (based on existing databases) within the analysis area, and suitable habitat is present. 8 Therefore, Howell’s spectacular thelypody may occur within areas potentially affected by the 9 Project and adverse impacts could be possible without proper avoidance and minimization. 10 Potential impacts to this species as well as the measures to reduce the risk of these impacts 11 would be similar to those described for Cronquist’s stickseed. 12
Laurence’s Milk-Vetch 13
Background, Habitat, and Threats 14 Laurence’s milk-vetch is state-listed as threatened in Oregon. Laurence’s milk-vetch is a 15 perennial between 4 and 20 inches tall with branched leaflets that are pinnately compound. 16 Blooming of cream or yellow flowers occurs in May through July, and they develop pendulant 17 seed pods between June and August. Laurence’s milk-vetch is often found along the edges of 18 streams or roadsides adjacent to cultivated land in areas with loess deposits, although it may 19 also be found growing in coarser substrates; it occurs in bluebunch wheatgrass 20 (Pseudoroegneria spicata)–Idaho fescue (Festuca idahoensis) dominated grasslands (ORNHIC 21 2010a). As this species is dependent on pollinators to produce seed and cannot self-fertilize, it 22 is sensitive to impacts/losses that occur to its pollinators. Furthermore, this species is sensitive 23 to habitat loss and degradation resulting from agricultural development, grazing, road 24 maintenance activities, and invasions by exotic weeds, as well as seed predation by insects 25 (ODA 2011). 26
Occurrence 27 Laurence’s milk-vetch is found in four counties in Oregon, including Morrow and Umatilla 28 counties (ORNHIC 2010b). There are several occurrences within the portion of the analysis 29 area located in Morrow and Umatilla counties (based on existing databases). Furthermore, this 30 species has been found west of Pilot Rock Oregon (between Alkali Canyon and Slusher 31 Canyon) during Project-specific sensitive plant surveys. As shown in Table Q-4, there are five 32 occurrences within the currently proposed disturbance footprint, four of which are located within 33 the disturbance footprint of existing access roads that would need improvements. 34
Potential Adverse Effects 35 This species is known to occur within the analysis area, based on both existing data as well as 36 survey results. In addition, this species is located within the Project’s currently proposed 37 disturbance footprint (including three occurrences located along existing access roads). The 38 potential impacts to this species as well as the measures to reduce the risk of these impacts 39 would be similar to those described for Cronquist’s stickseed. 40
Malheur Valley Fiddleneck 41
Background, Habitat, and Threats 42 Malheur Valley fiddleneck is state-listed as threatened in Oregon. This annual herb from the 43 borage family grows between 4 and 8 inches tall. It has alternate, lanceolate leaves and bristly 44 hairs located primarily on the leaves. Tubular yellow flowers bloom between April and June 45 (OSU 2010). This species typically grows on rocky, sparsely vegetated slopes in the Owyhee 46
Boardman to Hemingway Transmission Line Project Exhibit Q
PRELIMINARY APPLICATION FOR SITE CERTIFICATE Page Q-33
uplands of Malheur County, Oregon, near 2,740 to 3,100 feet in elevation (ORNHIC 2010a). 1 This species is known to hybridize with the more common Amsinckia tessellate. Threats to this 2 species include habitat loss and degradation resulting from grazing, invasion by exotic species, 3 and mining developments (ODA 2011). 4
Occurrence 5 Six populations of Malheur Valley fiddleneck are known, all of which are located in eastern 6 Oregon but are outside of the analysis area. There are no known occurrences of Malheur Valley 7 fiddleneck within the analysis area (based on existing databases), and this species was not 8 detected during Project surveys. 9
Potential Adverse Effects 10 Impacts to this species are unlikely to occur, as all known populations are located outside of the 11 analysis area. However, if this species was to occur in the analysis area, potential impacts as 12 well as the measures to reduce the risk of these impacts would be similar to those described for 13 Cronquist’s stickseed. 14
Mulford’s Milk-Vetch 15
Background, Habitat, and Threats 16 Mulford’s milk-vetch is state-listed as endangered in Oregon. This milk-vetch is a perennial herb 17 with opposite leaflets and a terminal leaflet regularly spaced along the stem. Mulford’s milk-18 vetch is 4 to 12 inches tall and flowers from late April through June. White flowers, which can 19 age to yellow and are occasionally tinted purple, are clustered in racemes of 5 to 20 flowers. 20 Pendulous seed pods are present from May through June (ORNHIC 2010a). It is commonly 21 found at elevations between 2,100 and 2,800 feet along sandy, southerly facing ridges. 22 Remaining populations are usually restricted to roadsides. This species was listed as 23 endangered in Oregon because it is restricted to 29 known locations within a 460-square-mile 24 area, none of which are currently protected (ORNHIC 2010a). 25
Occurrence 26 Mulford’s milk-vetch is known to occur in Malheur County, Oregon (ORNHIC 2010b). There are 27 several occurrences of Mulford’s milk-vetch within the portion of the analysis area located in 28 Malheur County (based on existing databases). There are three populations located within the 29 Site Boundary for the Proposed Corridor and a single population within the Site Boundary for 30 the Malheur S Alternate (based on existing databases). There are also several occurrences of 31 this species within the Site Boundary for the Double Mountain Alternate Corridor Segment; the 32 closest being less than 0.25 mile away. Furthermore, suitable habitat for this species (i.e., 33 shrub-steppe or desert shrub located in Malheur County) occurs within the analysis area. As 34 shown in Table Q-4, one known occurrence is located within the Project’s disturbance footprint 35 for the Malheur S Alternate (along an existing access road that needs improvement) and one 36 known occurrence along the Proposed Corridor (located along disturbance footprints not related 37 to existing access roads). However, this species was not detected during Project surveys. 38
Potential Adverse Effects 39 Although this species was not detected during Project surveys, there are known occurrences 40 (based on existing databases) within the analysis area, and suitable habitat is present. In 41 addition, two of the known occurrences are located within the Project’s potential disturbance 42 footprint (based on existing databases). Therefore, it is likely that Mulford’s milk-vetch occurs 43 within the analysis area, and adverse impacts could be possible without proper avoidance and 44 minimization. Potential impacts to this species as well as the measures to reduce the risk of 45 these impacts would be similar to those described for Cronquist’s stickseed. 46

Boardman to Hemingway Transmission Line Project Exhibit Q
PRELIMINARY APPLICATION FOR SITE CERTIFICATE Page Q-34
Oregon Semaphore Grass 1
Background, Habitat, and Threats 2 Oregon semaphore grass is state-listed as threatened in Oregon. It is a perennial in the grass 3 family that grows to 20 to 35 inches tall. It has slender rhizomes with purplish-red scales. Culms 4 are erect with overlapping sheaths. The ligule is about 0.16 inch long, white, and lacerate. Leaf 5 blades are erect, flat, 3 to 7 inches long, and abruptly narrowed into an acute apex. Flowering 6 occurs in June, and seeds mature through mid-August (CPC 2010). This grass grows in 7 shallowly inundated meadows between 2,450 and 3,950 feet in elevation. This species is known 8 to have low seed viability and spreads predominantly by rhizomes, which may contribute to a 9 limited genetic diversity (CPC 2010). 10
Occurrence 11 There are only two known populations of Oregon semaphore grass, including one in Union 12 County (ORNHIC 2010b). There are several occurrences of Oregon semaphore grass within the 13 portion of the analysis area located in Union County (i.e., individual occurrences from one 14 population; based on existing databases), the closest occurrence is located 0.3 mile from the 15 Site Boundary, and suitable habitat for this species (i.e., emergent wetlands in Union County) 16 does occur within the analysis area. However, the known occurrences of this species are all 17 located outside of the Project’s disturbance footprint. Furthermore, this species was not 18 detected during Project surveys. 19
Potential Adverse Effects 20 Although this species was not detected during Project surveys and its known distribution is 21 restricted to two populations, there are known occurrences (based on existing databases) within 22 the analysis area, and suitable habitat is present. Therefore, it is possible that Oregon 23 semaphore grass occurs within areas potentially affected by the Project, and that adverse 24 impacts are possible without proper avoidance and minimization. Potential impacts to this 25 species as well as the measures to reduce the risk of these impacts would be similar to those 26 described for Cronquist’s stickseed. 27
Packard’s Mentzelia 28
Background, Habitat, and Threats 29 Packard’s mentzelia is state-listed as threatened in Oregon. It is a small, upright annual with 30 linear leaves. This species grows in barren, excessively dry ash deposits with unusually high 31 amounts of potassium (CPC 2010). Single yellow flowers bloom from May to mid-June, after 32 which the plant forms seeds and dies. This plant is known to occur from 2,900 to 5,900 feet in 33 elevation in Malheur County, Oregon (ORNHIC 2010b). Threats to this species include habitat 34 loss and degradation resulting from off-road vehicle use, road construction, mining 35 developments, and invasion by exotic species (ODA 2011). 36
Occurrence 37 There are no known occurrences of Packard’s mentzelia within the analysis area (based on 38 existing databases), and it was not detected during Project surveys. Furthermore, this species 39 grows in a specific soil type (i.e., ashy soil) not known to be present within the portion of the 40 analysis area located in Malheur County; therefore, this species is unlikely to occur in the 41 analysis area. 42
Potential Adverse Effects 43 Potential impacts to this species are highly unlikely to occur, as it is not known to occur within or 44 near the analysis area and suitable habitat is not likely to occur in this area either. However, if 45

Boardman to Hemingway Transmission Line Project Exhibit Q
PRELIMINARY APPLICATION FOR SITE CERTIFICATE Page Q-35
this species was to occur in the analysis area, impacts, as well as the measures to reduce the 1 risk of these impacts, would be similar to those described for Cronquist’s stickseed. 2
Red-Fruited Lomatium 3
Background, Habitat, and Threats 4 Red-fruited lomatium is state-listed as endangered in Oregon. This small, perennial herb is in 5 the carrot family and grows in the Blue Mountains on rocky slopes in coarse soil and in areas 6 with a southerly or easterly aspect between 7,500 and 8,500 feet in elevation (USFS 2005). The 7 red-fruited lomatium grows to a height of 7 inches, although its leaves are generally located 8 close to ground level. Yellow or white flowers emerge in June, just prior to leaf emergence; red 9 fruits are large and conspicuous. The primary threats to this species include impacts from 10 mountain goats (e.g., grazing pressures, and crushing due to dust-wallowing by goats), as well 11 as impacts related to recreational hikers (ODA 2011). 12
Occurrence 13 Red-fruited lomatium is known to occur within Baker County, Oregon, but there are no known 14 occurrences of red-fruited lomatium within the analysis area (based on existing databases), and 15 it was not detected during Project surveys. However, suitable habitat for this species does occur 16 within the analysis area. 17
Potential Adverse Effects 18 As there are no known records of this species within the analysis area, and it was not detected 19 during surveys, it is possible that red-fruited lomatium does not occur in this area. However, as 20 suitable habitat for this species does occur in the analysis area it is also possible that this 21 species occurs in this area but has simply not been detected to date, indicating that adverse 22 impacts are possible without proper avoidance and minimization. Potential impacts to this 23 species as well as the measures to reduce the risk of these impacts would be similar to those 24 described for Cronquist’s stickseed. 25
Salt Heliotrope 26
Background, Habitat, and Threats 27 Salt heliotrope is state-listed as endangered in Oregon. It is a tap-rooted, short-lived perennial 28 or annual herb in the borage family that grows in saline areas in dry, open forests, woodlands, 29 and grasslands up to 6,700 feet in elevation (Calflora 2011). This succulent plant has only stem 30 leaves and blue or white flowers in terminal racemes (Hitchcock and Cronquist 1973). Current 31 threats to this species are uncertain. 32
Occurrence 33 There are several occurrences of salt heliotrope within the analysis area (based on existing 34 databases). The closest occurrence is located 0.4 mile from the Site Boundary for the Flagstaff 35 Alternate (based on existing databases). The closest occurrence to the Proposed Corridor is 36 located 1.6 mile from the Site Boundary (based on existing databases). However, the known 37 occurrences of this species are all located outside of the Project’s disturbance footprint. 38 Furthermore, this species was not detected during Project surveys. 39
Potential Adverse Effects 40 Although this species was not detected during Project surveys, there are known occurrences 41 (based on existing databases) within the analysis area, and suitable habitat is present. 42 Therefore, salt heliotrope may occur within areas potentially affected by the Project, and 43 adverse impacts could be possible without proper avoidance and minimization. Potential 44

Boardman to Hemingway Transmission Line Project Exhibit Q
PRELIMINARY APPLICATION FOR SITE CERTIFICATE Page Q-36
impacts to this species as well as the measures to reduce the risk of these impacts would be 1 similar to those described for Cronquist’s stickseed. 2
Smooth Mentzelia 3
Background, Habitat, and Threats 4 Smooth mentzelia is state-listed as endangered in Oregon. It is a small annual that may grow to 5 a height of 2 to 4.5 inches. Blooming of yellow flowers clustered in a terminal head occurs in 6 May and June. This species grows on nearly barren volcanic ash and clay soils, including 7 montmorillonite. This plant is also adapted to very dry soils with high levels of potassium (CPC 8 2010). This species is found in the Succor Creek drainage in Malheur County, Oregon, at 9 elevations around 4,500 feet. It is likely that smooth mentzelia populations are sensitive to 10 climatic fluctuation, with drastic reductions in population sizes observed during drought years 11 (ODA 2011); other threats to this species include impacts associated with off-road vehicle use, 12 trampling by livestock, as well as habitat loss/degradation associated with invasion by exotic 13 species and mining developments (ODA 2011). 14
Occurrence 15 There are several occurrences of smooth mentzelia within the portion of the analysis area 16 located in Malheur County (based on existing databases). One known population of smooth 17 mentzelia is located within the Site Boundary for the Proposed Corridor (based on existing 18 databases); however, this known occurrence is located outside of the Project’s disturbance 19 footprint. Furthermore, this species was not detected during Project surveys. 20
Potential Adverse Effects 21 Although this species was not detected during Project surveys, there are known occurrences 22 (based on existing databases) within the analysis area, and suitable habitat is present. 23 Therefore, smooth mentzelia may occur within the analysis area, and adverse impacts could be 24 possible without proper avoidance and minimization. Potential impacts to this species as well as 25 the measures to reduce the risk of these impacts would be similar to those described for 26 Cronquist’s stickseed. 27
Snake River Goldenweed 28
Background, Habitat, and Threats 29 The Snake River goldenweed is state-listed as endangered in Oregon. It is a robust perennial in 30 the aster family that may grow between 15 and 35 inches tall. This species has a basal group of 31 leaves with long petioles; the leaf blades may be almost 20 inches long and are broadly 32 elliptical. The large yellow flower heads may be single or in corymbs, and typically bloom 33 between June and September. This plant is only known to grow in the Snake River Canyon in 34 northeast Oregon and Idaho at elevations ranging from approximately 1,950 to 7,900 feet 35 (ORNHIC 2010b; eFloras 2010). Threats to this species include livestock grazing, seed 36 predation by insects, and competition with exotic species (ODA 2011). 37
Occurrence 38 There are multiple occurrences of Snake River goldenweed within the portion of the analysis 39 area located in Baker and Malheur counties (based on existing databases), and 11 occurrences 40 were detected in Baker County during surveys. Furthermore, as shown in Table Q-4, multiple 41 occurrences are located within the Project’s disturbance footprint, some of which are located 42 within the disturbance footprint of existing access roads that would need improvement. 43

Boardman to Hemingway Transmission Line Project Exhibit Q
PRELIMINARY APPLICATION FOR SITE CERTIFICATE Page Q-37
Potential Adverse Effects 1 This species was detected during Project surveys, and there are known occurrences (based on 2 existing databases) within the analysis area. In addition, these known occurrences are located 3 within the Project’s currently proposed disturbance footprint (including one occurrence located 4 along an existing access road). Therefore, Snake River goldenweed may occur within areas 5 potentially affected by the Project, and adverse impacts could be possible without proper 6 avoidance and minimization. Potential impacts to this species as well as the measures to 7 reduce the risk of these impacts would be similar to those described for Cronquist’s stickseed. 8
Sterile Milk-Vetch (a.k.a. Cusick’s Milk-Vetch) 9
Background, Habitat, and Threats 10 Sterile milk-vetch is state-listed as threatened in Oregon. It is a hairy, perennial forb that grows 11 to approximately 2 to 6 inches tall (ORNHIC 2010a). The stems are stiff and thin with narrow, 12 wiry, widely spaced leaves. This plant flowers and sets fruit between June and July. Each 13 flowering stem has 2 to 5 white flowers that turn yellow as the flowers age. The pendulous seed 14 pods are green with purple blotches. This species has a limited range, confined to the 30-mile 15 length of the Owyhee River in Idaho and in Malheur County, Oregon (ORNHIC 2010a). Sterile 16 milk-vetch grows in barren, sparsely vegetated areas on ash deposits (ORNHIC 2010a). There 17 are 75 known occurrences of this species; of these, only 8 are protected. 18
Occurrence 19 Although this species was not detected during Project surveys, there are multiple occurrences 20 of sterile milk-vetch the portion of the analysis area near the Owyhee Reservoir (based on 21 existing databases). The closest occurrence is 0.6 mile from the Site Boundary for the Malheur 22 S Alternate. However, none of these known occurrences are located within the Project’s 23 disturbance footprint. 24
Potential Adverse Effects 25 Although this species was not detected during Project surveys, there are known occurrences 26 (based on existing databases) within the analysis area; however, quality habitat (i.e., ashy soils) 27 is not present. Therefore, sterile milk-vetch may occur within the analysis area, and adverse 28 impacts could be possible without proper avoidance and minimization. Potential impacts to this 29 species as well as the measures to reduce the risk of these impacts would be similar to those 30 described for Cronquist’s stickseed. 31
3.3.2 Measures to Avoid and Reduce Adverse Impacts 32
OAR 345-021-0010(1)(q)(C) 33
For each species identified under (A), a description of measures proposed by the applicant, if any, to 34 avoid or reduce adverse impact 35
3.3.2.1 Avoidance and Minimization Prior to Construction 36
During initial routing of the Project, avoidance of sensitive resources was taken into 37 consideration by IPC. Sensitive resources areas that were avoided to the extent practical during 38 the initial siting process included, but were not limited to, BLM-designated areas of critical 39 environmental concern (ACECs), BLM-designated wilderness study areas, all waterbodies 40 (including wetlands, wild and scenic rivers, special status streams), ESA-listed critical habitats, 41 areas with sensitive wildlife resources (e.g., sage-grouse leks, Washington ground squirrel 42 colonies, raptor nests), visually sensitive areas (e.g., USFS-designated visual resource retention 43 and preservation lands), USFS-designated inventoried roadless areas, city and town 44 boundaries, the Boardman Bombing Range, and irrigated cropland. Furthermore, the Project 45

Boardman to Hemingway Transmission Line Project Exhibit Q
PRELIMINARY APPLICATION FOR SITE CERTIFICATE Page Q-38
was designed to follow existing developments and utility corridors, such as existing roads and 1 power lines, to the extent practical, to consolidate impacts of the Project in areas that have 2 already been disturbed as opposed to impacting undisturbed areas. IPC also conducted 3 extensive public outreach, in the form of the CAP, as well as consulting with land-managing 4 agencies regarding possible route locations for the Project. As avoidance of one sensitive 5 resource can often result in the route becoming located within range of another sensitive 6 resource (e.g., avoiding forested habitats can result in the route passing through shrubland 7 habitats), input from the public and land-managing agencies has resulted in alternate corridor 8 segments that weigh avoidance of one resource against another. Details regarding the siting 9 process and the constraints considered during the development of the Proposed Corridor and 10 alternate corridor segments are presented in the Project Siting Studies (IPC 2010, 2012; also 11 Exhibit B, Attachments B-1 and B-2). 12
To prevent direct impacts from occurring to federal and state listed species, preconstruction 13 surveys would be conducted and all known and newly identified occurrences (based on existing 14 databases as well as survey results) would be avoided. Listed fish species would be assumed in 15 all waters where their presence has been identified previously, and best management practices 16 (BMPs) to minimize impacts to fish species would be implemented in all fish-bearing waters. 17 Preconstruction surveys would aid in determining if any additional areas have become occupied 18 by threatened or endangered species since the initial Phase 2 surveys. 19
All practical efforts would be made to avoid sensitive plants that are located along existing roads 20 that need improvement (e.g., improvements may be able to avoid the plants if they are located 21 along the road’s outer shoulder; see the draft Species Conservation Plan found in Exhibit P, 22 Attachment P-6 for more details); however, complete avoidance of these plants may not be 23 possible (e.g., if the plant is growing on the inner shoulder or the middle or the travel path). For 24 these instances, the affected plant would be transplanted to a new location outside of the 25 disturbance footprint. Permission from the applicable management agency would be obtained 26 prior to relocating the plant, if applicable (e.g., the FWS would be contacted prior to moving 27 listed plants located on federally managed lands). In addition, as the likelihood of successfully 28 transplanting these federal and state listed species plants is uncertain, seeds from these plants 29 would also be collected and planted to new locations (if seeds are available at the time of 30 construction) and portions of the soil-stored seedbank would be relocated as well. The location 31 for transplanting as well as sowing of the collected seeds would be selected based on agency 32 input as well as suitable on-site conditions (i.e., re-planting/sowing in suitable habitats that are 33 not currently planned for future disturbance). It is assumed that the site for replanting and/or 34 sowing would be in the general vicinity of the plant’s original location. Furthermore, an incidental 35 take permit (under the ESA) would be required for any federally listed plant located on federally-36 managed lands may be impacted by the Project.5 A Public Land Action Permit would be 37 required for any Oregon State–listed plant that is located on Oregon State–anaged lands that 38 requires transplanting (based on current information, there is only one population of Snake 39 River Goldenweed located on state-managed lands that may require relocation, and 40 subsequently a Public Land Action Permit). The exact location, number, and species 41 composition of listed plant species within the Project area would be determined during 42 preconstruction surveys. 43
3.3.2.2 Avoidance and Minimization during Construction 44
To avoid and minimize impacts to sensitive wildlife and fish species during construction, all 45 agency-required spatial and timing restrictions would be followed on the lands that they manage 46 unless the agencies approve an exception (see Exhibit P, Attachment P-6). These restrictions 47 5 Based on current information, there are no federally-listed plant species located on federally managed lands that would require transplanting.

Boardman to Hemingway Transmission Line Project Exhibit Q
PRELIMINARY APPLICATION FOR SITE CERTIFICATE Page Q-39
have been designated by federal and state agencies for various resources, and include 1 restrictions on when and where disturbance activities can occur. Adherence to these agency 2 required spatial and timing restrictions would minimize the potential impact of Project related 3 disturbances to sensitive resources. The agencies would only approve an exception to these 4 restrictions (through their established exception process) if they determine that activities would 5 not impact the sensitive resource that year (e.g., the area is not utilized by the targeted resource 6 during that season). Unlike the federal agency restrictions, for the most part the ODFW does not 7 have required spatial and timing restrictions (with some exceptions), but instead provides 8 recommended spatial and timing restrictions; IPC has taken these agency recommendations 9 and guidelines (i.e., measures that are not legally required) into consideration when developing 10 the draft Species Conservation Plan (see Exhibit P, Attachment P-6). 11
IPC will develop a set of maps that depict the extent of federal and state listed species within 12 the Project area. These maps will be maintained at the Project site, and will show applicable 13 buffer zones and temporal restrictions on disturbances near or within sensitive areas. Sensitive 14 areas will be flagged on-site, when applicable (e.g., flagging of some areas may not be 15 advisable due to the potential to attract predators to these flagged areas) to ensure avoidance 16 during construction. Construction personnel will attend mandatory training on the importance of 17 protecting sensitive resources, as well as the need to adhere to all applicable restrictions and 18 permit requirements (see the Species Conservation Plan found in Exhibit P, Attachment P-6 for 19 more details). 20
No culverts are proposed for installation within fish-bearing streams at this time. However, if 21 culverts are needed, they would be installed in accordance with ODFW fish passage rules and 22 would require ODFW approval, in order to minimize impacts to water and fish resources (see 23 Exhibit J). On federally managed-lands, BLM and USFS requirements regarding culvert 24 installation would also be followed (see Exhibit J). 25
Areas that are not needed for permanent Project maintenance and/or operation would be 26 restored to preconstruction conditions, as described in Attachments P-4 and P-6 of Exhibit P. In 27 addition, measures would be taken to minimize the introduction or spread of noxious- and 28 invasive-plant species during construction. These revegetation efforts, as well as the measures 29 to reduce the risk of noxious- and invasive-plant species introduction and/or spread are outlined 30 in IPC’s draft Reclamation and Revegetation Plan (Exhibit P, Attachment P-4). 31
Furthermore, BMPs and environmental protection measures (EPMs) would be implemented 32 during construction to minimize erosion, reduce the risk of fire, minimize disturbance to wildlife, 33 minimize harassment or accidental vehicular collisions with wildlife, as well as to ensure 34 successful reclamation of temporarily disturbed areas following construction. These measures 35 are listed in Exhibit P, Attachment P-4 (i.e., the draft Reclamation and Revegetation Plan) and 36 Exhibit P, Attachment P-6 (the draft Species Conservation Plan). 37
3.3.2.3 Minimization and Mitigation during Operation 38
After construction is complete, IPC will restore the habitat to preconstruction conditions, as 39 described in Attachments P-4 and P-6. Working conditions along the transmission line would 40 also be maintained to minimize damage to the line and structures, and avoid interruptions in the 41 delivery of power. IPC has developed BMPs and EPMs that would be implemented during the 42 Project’s operation, including measures to ensure successful reclamation of disturbed areas, 43 reduce the risk of introducing or spreading noxious- and invasive-plant species, minimize 44 unauthorized use of access roads, and requirements for reporting any wildlife mortalities to the 45 applicable agencies. These measures are listed in the Draft Species Conservation Plan (see 46 Exhibit P, Attachment P-6). 47

Boardman to Hemingway Transmission Line Project Exhibit Q
PRELIMINARY APPLICATION FOR SITE CERTIFICATE Page Q-40
3.3.3 Potential Impacts to Plants Covered under a Conservation Program 1
OAR 345-021-0010(1)(q)(D) 2
For each plant species identified under (A), a description of how the proposed facility, including any 3 mitigation measures, complies with the protection and conservation program, if any, that the Oregon 4 Department of Agriculture has adopted under ORS 564.105(3) 5
Howell’s spectacular thelypody is the only listed plant species found in Table Q-1 that has a 6 protection or conservation program. The goals of this program are to investigate the biology and 7 ecology of this rare plant using greenhouse studies and to perfect techniques for raising and 8 replanting this species. Greenhouse-grown individuals were transferred to the wild to create 9 seven new populations along Baldock Slough in Baker County, Oregon, and seeds were also 10 sown. As of June 2008, all seven of these populations persist. The Project crosses Baldock 11 Slough; therefore, the locations of these outplanting sites would be marked and avoided to 12 prevent impacts to these plants. In addition, preconstruction surveys would be conducted to 13 determine whether any locations of Howell’s spectacular thelypody lie within the route, and any 14 locations found would be avoided. Therefore, the new population sites established through this 15 conservation program, as well as any natural populations of this species, are unlikely to be 16 directly compromised by the Project. Potential indirect impacts would be avoided and minimized 17 through implementation of the measures discussed in Section 3.3.2. As a result, the Project is 18 not likely to cause a significant reduction in the likelihood of survival or recovery of Howell’s 19 spectacular thelypody. 20
3.3.4 Potential Impacts to Plants without Conservation Programs 21
OAR 345-021-0010(1)(q)(E) 22
For each plant species identified under paragraph (A), if the Oregon Department of Agriculture has not 23 adopted a protection and conservation program under ORS 564.105(3), a description of significant 24 potential impacts of the proposed facility on the continued existence of the species and on the critical 25 habitat of such species and evidence that the proposed facility, including any mitigation measures, is 26 not likely to cause a significant reduction in the likelihood of survival or recovery of the species 27
None of the plant species in Table Q-1, except for the Howell’s spectacular thelypody, are 28 currently covered by a conservation program. If construction activities were allowed to occur 29 within areas occupied by these species, plants would experience direct mortality via crushing, 30 burial, or grubbing. In order to prevent direct impacts from occurring to federal and state listed 31 plant species, preconstruction surveys would be conducted and all known and newly identified 32 occurrences (based on existing databases as well as survey results) would be avoided by 33 micro-siting Project components away from occupied areas whenever practical (disturbances 34 would be excluded within the buffer distance required by the ODA). It is anticipated that the 35 placement of newly proposed developments (e.g., new access roads, fly yards, tower locations) 36 could be adjusted to avoid directly impacting federal and state listed plant species occurrences; 37 however, it would be much harder to avoid plants that are located along existing disturbances 38 (e.g., existing access roads that would be improved as part of the Project). For example, 39 rerouting an existing road to avoid a sensitive plant species could result in additional impacts to 40 other sensitive resources due to the construction of a new road-bed as opposed to utilizing an 41 existing road-bed. If avoidance of federally- and state-listed plants located along existing roads 42 cannot be achieved during road improvement, impacts would be minimized by the measures 43 discussed in Section 3.3.2 (e.g., re-locating existing plants, or collecting seeds and replanting). 44 To protect plants that may not be visible above ground during preconstruction surveys (e.g., 45 those present in the soil stored seed-bank), cleared topsoil would be stored separately from 46 subsoil layers, and would be restored back in the area from which it was removed. Therefore, 47 mortality is not expected and direct impacts to listed plants are expected to be minimal. Indirect 48

Boardman to Hemingway Transmission Line Project Exhibit Q
PRELIMINARY APPLICATION FOR SITE CERTIFICATE Page Q-41
impacts to federally- and state-listed plants could include soil erosion, spread of invasive weeds, 1 and alteration of fire regimes. Measures would be implemented in order to avoid and minimize 2 the effects of these potential indirect impacts (see Section 3.3.2). 3
3.3.4.1 Cronquist’s Stickseed 4
Cronquist’s stickseed was detected during surveys, and there are multiple known occurrences 5 of this species within the analysis area (based on existing databases). Therefore, this species is 6 likely present in areas potentially affected by the Project, and adverse impacts to this species 7 are possible without proper avoidance and minimization. However, due to the proposed 8 preconstruction surveys, the commitment to avoid or reduce impacts to all known or newly 9 discovered plants, the segregation of topsoil to preserve soil stored seedbanks, as well as the 10 general BMPs and avoidance measures discussed in Section 3.3.2, the Project is not likely to 11 cause a significant reduction in the likelihood of survival or recovery of Cronquist’s stickseed. 12
3.3.4.2 Cusick’s Lupine 13
Cusick’s lupine was not detected during surveys, and is suspected to only occur within five 14 known populations, all of which are located outside of the analysis area. Therefore, it is likely 15 that this species does not occur within the analysis area and no Project-related impacts to this 16 species are expected to occur. As a result, the Project is not likely to cause a significant 17 reduction in the likelihood of survival or recovery of Cusick’s lupine. 18
3.3.4.3 Golden Buckwheat 19
There are no known occurrences of golden buckwheat within the analysis area, and it was not 20 detected during surveys; however, suitable habitat for this species does occur within the 21 analysis area. Therefore, it is possible that this species occurs within the analysis area as well, 22 but has not been detected by surveys to date; indicating that adverse impacts to this species 23 are possible without proper avoidance and minimization. However, due to the proposed 24 preconstruction surveys, the commitment to avoid or reduce impacts to all known or newly 25 discovered plants, the segregation of topsoil to preserve soil-stored seedbanks, as well as the 26 general BMPs and avoidance measures discussed in Section 3.3.2, the Project is not likely to 27 cause a significant reduction in the likelihood of survival or recovery of golden buckwheat. 28
3.3.4.4 Laurence’s Milk-Vetch 29
Laurence’s milk-vetch was detected during Project surveys (in the vicinity of the Boardman 30 Bombing Range and Pilot Rock), and there are multiple known occurrences of this species 31 within the analysis area (based on existing databases and Project surveys). Therefore, adverse 32 impacts to this species are possible without proper avoidance and minimization. However, due 33 to the proposed preconstruction surveys, the commitment to avoid or reduce impacts to all 34 known or newly discovered plants, the segregation of topsoil to preserve soil-stored seedbanks, 35 as well as the general BMPs and avoidance measures discussed in Section 3.3.2, the Project is 36 not likely to cause a significant reduction in the likelihood of survival or recovery of Laurence’s 37 milk-vetch. 38
3.3.4.5 Malheur Valley Fiddleneck 39
Malheur Valley fiddleneck was not detected during surveys, and is suspected to only occur 40 within six known populations, all of which are located outside of the analysis area. Therefore, it 41 is likely that this species does not occur within the analysis area and no Project-related impacts 42 to this species are expected to occur. As a result, the Project is not likely to cause a significant 43 reduction in the likelihood of survival or recovery of Malheur Valley fiddleneck. 44

Boardman to Hemingway Transmission Line Project Exhibit Q
PRELIMINARY APPLICATION FOR SITE CERTIFICATE Page Q-42
3.3.4.6 Mulford’s Milk-Vetch 1
Although Mulford’s milk-vetch was not detected during surveys, there are multiple known 2 occurrences of this species within the analysis area (based on existing databases). Therefore, 3 this species may be present in areas potentially affected by the Project, and adverse impacts to 4 this species are possible without proper avoidance and minimization. However, due to the 5 proposed preconstruction surveys, the commitment to avoid or reduce impacts to all known or 6 newly discovered plants, the segregation of topsoil to preserve soil stored seedbanks, as well as 7 the general BMPs and avoidance measures discussed in Section 3.3.2, the Project is not likely 8 to cause a significant reduction in the likelihood of survival or recovery of Mulford’s milk-vetch. 9
3.3.4.7 Oregon Semaphore Grass 10
Although Oregon semaphore grass was not detected during surveys, there are multiple known 11 occurrences of this species within the analysis area (based on existing databases). Therefore, 12 this species may be present in areas potentially affected by the Project, and adverse impacts to 13 this species are possible without proper avoidance and minimization. However, due to the 14 proposed preconstruction surveys, the commitment to avoid or reduce impacts to all known or 15 newly discovered plants, the segregation of topsoil to preserve soil-stored seedbanks, as well 16 as the general BMPs and avoidance measures discussed in Section 3.3.2, the Project is not 17 likely to cause a significant reduction in the likelihood of survival or recovery of Oregon 18 semaphore grass. 19
3.3.4.8 Packard’s Mentzelia 20
Packard’s mentzelia was not detected during surveys, and there are no known occurrences of 21 this species within or near the analysis area. Furthermore, suitable habitat for this species is not 22 known to occur within the analysis area. Therefore, it is likely that this species does not occur 23 within the analysis area and no Project-related impacts to this species are expected to occur. As 24 a result, the Project is not likely to cause a significant reduction in the likelihood of survival or 25 recovery of Packard’s mentzelia. 26
3.3.4.9 Red-Fruited Lomatium 27
There are no known occurrences of red-fruited lomatium within the analysis area, and it was not 28 detected during surveys; however, suitable habitat for this species does occur within the 29 analysis area. Therefore, it is possible that this species occurs within the analysis area, but has 30 not been detected by surveys to date; indicating that adverse impacts to this species are 31 possible without proper avoidance and minimization. However, due to the proposed 32 preconstruction surveys, the commitment to avoid or reduce impacts to all known or newly 33 discovered plants, the segregation of topsoil to preserve soil-stored seedbanks, as well as the 34 general BMPs and avoidance measures discussed in Section 3.3.2, the Project is not likely to 35 cause a significant reduction in the likelihood of survival or recovery of red-fruited lomatium. 36
3.3.4.10 Salt Heliotrope 37
Although salt heliotrope was not detected during surveys, there are multiple known occurrences 38 of this species within the analysis area (based on existing databases). Therefore this species 39 may be present in areas potentially affected by the Project, and adverse impacts to this species 40 are possible without proper avoidance and minimization. However, due to the proposed 41 preconstruction surveys, the commitment to avoid or reduce impacts to all known or newly 42 discovered plants, the segregation of topsoil to preserve soil-stored seedbanks, as well as the 43 general BMPs and avoidance measures discussed in Section 3.3.2, the Project is not likely to 44 cause a significant reduction in the likelihood of survival or recovery of salt heliotrope. 45

Boardman to Hemingway Transmission Line Project Exhibit Q
PRELIMINARY APPLICATION FOR SITE CERTIFICATE Page Q-43
3.3.4.11 Smooth Mentzelia 1
Although smooth mentzelia was not detected during surveys, there are multiple known 2 occurrences of this species within the analysis area (based on existing databases). Therefore, 3 this species may be present in areas potentially affected by the Project, and adverse impacts to 4 this species are possible without proper avoidance and minimization. However, due to the 5 proposed preconstruction surveys, the commitment to avoid or reduce impacts to all known or 6 newly discovered plants, the segregation of topsoil to preserve soil-stored seedbanks, as well 7 as the general BMPs and avoidance measures discussed in Section 3.3.2, the Project is not 8 likely to cause a significant reduction in the likelihood of survival or recovery of smooth 9 mentzelia. 10
3.3.4.12 Snake River Goldenweed 11
Snake River goldenweed was detected during surveys, and there are multiple known 12 occurrences of this species within the analysis area (based on existing databases). Therefore 13 this species may be present in areas potentially affected by the Project, and adverse impacts to 14 this species are possible without proper avoidance and minimization. However, due to the 15 proposed preconstruction surveys, the commitment to avoid or reduce impacts to all known or 16 newly discovered plants, the segregation of topsoil to preserve soil-stored seedbanks, as well 17 as the general BMPs and avoidance measures discussed in Section 3.3.2, the Project is not 18 likely to cause a significant reduction in the likelihood of survival or recovery of Snake River 19 goldenweed. 20
3.3.4.13 Sterile Milk-Vetch (a.k.a. Cusick’s Milk-Vetch) 21
Sterile milk-vetch was not detected during surveys, however, there are known occurrences of 22 this species near the analysis area. Therefore, this species may be present in areas potentially 23 affected by the Project, and adverse impacts to this species are possible without proper 24 avoidance and minimization. However, due to the proposed preconstruction surveys, the 25 commitment to avoid or reduce impacts to all known or newly discovered plants, the segregation 26 of topsoil to preserve soil-stored seedbanks, as well as the general BMPs and avoidance 27 measures discussed in Section 3.3.2, the Project is not likely to cause a significant reduction in 28 the likelihood of survival or recovery of sterile milk-vetch. 29
3.3.5 Potential Impacts to Wildlife 30
OAR 345-021-0010(1)(q)(F) 31
For each animal species identified under (A), a description of significant potential impacts of the 32 proposed facility on the continued existence of such species and on the critical habitat of such species 33 and evidence that the proposed facility, including any mitigation measures, is not likely to cause a 34 significant reduction in the likelihood of survival or recovery of the species. 35
The potential Project impacts to each of the federally- and state-listed wildlife species identified 36 in this Exhibit are discussed in Section 3.3.1. This section addresses the potential impacts of the 37 Project on the likelihood of survival or recovery of each special status wildlife species or their 38 federal ESA-designated critical habitats, when the avoidance and minimization measures 39 discussed in Section 3.3.2 are also taken into consideration. 40
3.3.5.1 Gray Wolf 41
Gray wolves have not been detected within the analysis area to date; however, as they typically 42 range over broad regions and are habitat generalists, it is possible that they could occur within 43 the analysis area during Project construction, operation, and retirement. However, the Project 44 would not impact habitats considered unique to wolf populations, and the likelihood that they 45

Boardman to Hemingway Transmission Line Project Exhibit Q
PRELIMINARY APPLICATION FOR SITE CERTIFICATE Page Q-44
would occur in the general area is low. Furthermore, general avoidance and minimization 1 measures would be implemented in order to limit the impact of the Project on wildlife and their 2 habitats (see Section 3.3.2). Therefore, the Project is not likely to cause a significant reduction 3 in the likelihood of survival or recovery of the gray wolf. 4
3.3.5.2 Washington Ground Squirrel 5
As discussed in Exhibit P, Washington ground squirrel colonies as well as a 785-foot buffer 6 around the colony (restricted to suitable habitat) were classified as Category 1 habitats under 7 the ODFW Fish and Wildlife Habitat Mitigation Policy (OAR 635-415-0025). IPC will attempt to 8 avoid direct impacts to Category 1 habitat for the Washington ground squirrel. Potential indirect 9 impacts of the Project include increased predation as a result of increased perching 10 opportunities for raptors and ravens provided by the new transmission line. However, this 11 impact would also be limited through the avoidance of all Category 1 squirrel habitats, and the 12 fact that the Project is co-located with existing transmission lines near Washington ground 13 squirrel colonies. Therefore, the Project is not likely to cause a significant reduction in the 14 likelihood of survival or recovery of the Washington ground squirrel. 15
3.3.5.3 Special Status Fish Species (i.e., Bull Trout, Middle Columbia River 16 Steelhead, Snake River Basin Steelhead, Snake River Chinook) 17
Federal- and state-listed fish species do occur within some of the waterbodies that would be 18 crossed by the Project (see Table Q-3). Potential impacts to these species could result from the 19 clearing of riparian vegetation, soil disturbance adjacent to waterbodies, potential alterations to 20 fish movement due to culverts, the risk of toxins entering waterbodies, and the risk of injury or 21 mortality resulting from fish salvage. However, impacts to these federally- and state-listed fish 22 species and their federal ESA-designated critical habitat would be avoided and minimized 23 through the measures discussed in Sections 3.3.1 and 3.3.2. As a result, the Project is not likely 24 to cause a significant reduction in the likelihood of survival or recovery of the bull trout, Middle 25 Columbia River steelhead, Snake River Basin steelhead, or the Snake River Chinook. If the 26 Project’s design is altered such that a listed fish species would be taken, IPC would obtain an 27 incidental take permit (under the ESA). 28
3.3.6 Monitoring Plan 29
OAR 345-021-0010(1)(p)(G) 30
A description of the applicant’s proposed monitoring plans to evaluate the success of the measures 31 described in (G). 32
The draft Reclamation and Revegetation Plan (Attachment P-4 of Exhibit P) and draft Habitat 33 Mitigation Plan (Exhibit P, Attachment P-7) contain a description of the monitoring plan that 34 would be implemented to determine if the revegetation and mitigation efforts are successful. 35 The draft Species Conservation Plan (Exhibit P, Attachment P-6) and the draft Habitat Mitigation 36 Plan (Attachment P-7) discuss monitoring plans related to wildlife and their habitats. 37
4.0 CONCLUSION 38
Exhibit Q contains evidence upon which the Council can make findings under OAR 345-022-0070 39 and conclude that the design, construction, and operation of the Project, taking into account 40 mitigation, are (1) consistent with the protection and conservation programs that the ODA has 41 adopted under Oregon Revised Statute (ORS) 564.105(3) for listed plant species (when applicable); 42 (2) not likely to cause a significant reduction in the likelihood of survival or recovery of the listed fish 43 and wildlife species; and (3) not likely to cause a significant reduction in listed plant species for 44 which the ODA has not adopted a protection and conservation program. 45

Boardman to Hemingway Transmission Line Project Exhibit Q
PRELIMINARY APPLICATION FOR SITE CERTIFICATE Page Q-45
5.0 SUBMITTAL AND APPROVAL COMPLIANCE MATRICES 1
Tables Q-5 and Q-6 provide cross references between the Exhibit submittal requirements of 2 OAR 345-021-0010 and the Council’s Approval standards of OAR 345-022-0000 and where 3 they are discussed in this Exhibit. 4
Table Q-5. Submittal Requirements Matrix 5 Requirement Location
OAR 345-021-0010 (q) Exhibit Q. Information about threatened and endangered plant and animal species that may be affected by the proposed facility, providing evidence to support a finding by the Council as required by OAR 345-022-0070. The applicant shall include:
Exhibit Q
(A) Based on appropriate literature and field study, identification of all threatened or endangered species listed under ORS 496.172(2), ORS 564.105(2) or 16 USC § 1533 that may be affected by the proposed facility
Sections 3.2 and 3.3.1
(B) For each species identified under (A), a description of the nature, extent, locations and timing of its occurrence in the analysis area and how the facility might adversely affect it
Section 3.3.1
(C) For each species identified under (A), a description of measures proposed by the applicant, if any, to avoid or reduce adverse impact
Section 3.3.2
(D) For each plant species identified under (A), a description of how the proposed facility, including any mitigation measures, complies with the protection and conservation program, if any, that the Oregon Department of Agriculture has adopted under ORS 564.105(3)
Section 3.3.3
(E) For each plant species identified under paragraph (A), if the Oregon Department of Agriculture has not adopted a protection and conservation program under ORS 564.105(3), a description of significant potential impacts of the proposed facility on the continued existence of the species and on the critical habitat of such species and evidence that the proposed facility, including any mitigation measures, is not likely to cause a significant reduction in the likelihood of survival or recovery of the species
Section 3.3.4
(F) For each animal species identified under (A), a description of significant potential impacts of the proposed facility on the continued existence of such species and on the critical habitat of such species and evidence that the proposed facility, including any mitigation measures, is not likely to cause a significant reduction in the likelihood of survival or recovery of the species
Section 3.3.5
(G) The applicant’s proposed monitoring program, if any, for impacts to threatened and endangered species
Section 3.3.6
6
Table Q-6. Approval Standard 7 Requirement Location
OAR 345-022-0070 To issue a site certificate, the Council, after consultation with appropriate state agencies, must find that: (1) For plant species that the Oregon Department of Agriculture has listed as threatened or endangered under ORS 564.105(2), the design, construction and operation of the proposed facility, taking into account mitigation: (a) Are consistent with the protection and conservation program, if any, that the Oregon Department of Agriculture has adopted under ORS 564.105(3), or (b) If the Oregon Department of Agriculture has not adopted a protection and conservation program, are not likely to cause a significant reduction in the likelihood of survival or recovery of the species;
Sections 3.3.3 and 3.3.4
8

Boardman to Hemingway Transmission Line Project Exhibit Q
PRELIMINARY APPLICATION FOR SITE CERTIFICATE Page Q-46
Table Q-6. Approval Standard (continued) 1 Requirement Location
(2) For wildlife species that the Oregon Fish and Wildlife Commission has listed as threatened or endangered under ORS 496.172(2), the design, construction and operation of the proposed facility, taking into account mitigation, are not likely to cause a significant reduction in the likelihood of survival or recovery of the species.
Sections 3.3.5 and 4
2
6.0 RESPONSE TO COMMENTS FROM REVIEWING AGENCIES AND 3 THE PUBLIC 4
Table Q-7 provides cross references between comments cited in the Project Order from 5 reviewing agencies and the public and where discussion can be found in this Exhibit. 6
Table Q-7. Reviewing Agency and Public Comments 7 Reviewing Agency Comments Location
TBD Public Comments
Exhibit Q must address impacts and proposed mitigation measures for threatened and endangered species
Sections 3.3.1, 3.3.2, 3.3.3, 3.3.4, and 3.3.5
7.0 REFERENCES 8
Anderson, P., B. Taylor, and G. Balch. 1996. Quantifying the Effects of Sediment Release on 9 Fish and Their Habitats. Canadian Manuscript Report of Fisheries and Aquatic Sciences 10 No. 2346. Department of Fish and Oceans. Vancouver and Manitoba, Canada. 11
BLM (Bureau of Land Management). 2008. State Director’s Special Status Species List. USDA 12 Bureau of Land Management – Oregon and Washington. January 2008. 13
BLM. 2009. Lupinus Lepidus var. cusickii Population Monitoring in Denny Flat, Baker County, 14 Oregon. Institute for Applied Ecology and USDI Bureau of Land Management, Vale 15 District. 16
BLM. 2012a. GeoBOB database for Oregon and Washington. Database provided to IPC by the 17 Bureau of Land Management. 18
BLM. 2012b. Bureau of Land Management. Dept. of Interior. California State Office Manual 19 Handbook H-6840-1, the Special Status Plant Management Manual Handbook of 20 California BLM. Release 6-27. Washington. 21
Bisson, P.A., and R.E. Bilby. 1982. Avoidance of Suspended Sediment by Juvenile Coho 22 Salmon. North American Journal of Fisheries Management 4:371-374. 23
Boarman, W., and B. Heinrich. 1999. Common Raven (Corvus corax). In The Birds of North 24 America Online (A. Poole, Ed.). Ithaca, NY: Cornell Laboratory of Ornithology. 25
Busby, P.J., T.C. Wainwright, G.J. Bryant, L.J. Lierheimer, R.S. Waples, F.W. Waknitz, and I.V. 26 Lagomarsino. 1996. Status Review of West Coast Steelhead from Washington, Idaho, 27 Oregon, and California. NOAA Technical Memorandum NMFS-NWFSC-27. National 28 Marine Fisheries Service, Northwest Fisheries Science Center, Coastal Zone and 29 Estuarine Studies Division. Seattle, Washington. 30

Boardman to Hemingway Transmission Line Project Exhibit Q
PRELIMINARY APPLICATION FOR SITE CERTIFICATE Page Q-47
Brett, J.R. 1952. Temperature Tolerance in Young Pacific Salmon, Genus Oncorhynchus. 1 Journal of the Fisheries Research Board of Canada 9(6):265–323. 2
Calflora. 2011. The Calflora Database. Available online at: http://www.calflora.org 3
Coates, P., and D. Delehanty. 2010. Nest Predation of Greater Sage-Grouse in Relation to 4 Microhabitat Factors and Predators. Journal of Wildlife Management 74(2):240-248 5
Connelly, J.W., S.T. Knick, M.A. Schroeder, and S.J. Stiver. 2004. Conservation Assessment of 6 Greater Sage-grouse and Sagebrush Habitats. Unpublished report. Western Association 7 of Fish and Wildlife Agencies. Cheyenne, Wyoming. 8
CPC (Center for Plant Conservation). 2010. CPC National Collection Plant Profile. Available 9 online at: http://www.centerforplantconservation.org 10
DeGraaf, R., and M. Yamasaki. 2000. New England Wildlife: Habitat, Natural History, and 11 Distribution. UPNE. 1st edition. 12
DeWalle, D.R. 2010. Modeling Stream Shade: Riparian Buffer Height and Density as Important 13 as Buffer Width. Journal of the American Water Resource Association 46(2):323–333. 14
Ecology (Washington State Department of Ecology). 2002. Evaluating Standards for Protecting 15 Aquatic Life in Washington’s Surface Water Quality Standards – Temperature Criteria. 16 Draft Discussion Paper and Literature Summary. Pub. No. 00-10-070. Water Quality 17 Program, Washington Department of Ecology, Watershed Management Section, 18 Olympia, WA. 19
Eder, T. 2002. Mammals of Washington and Oregon. Lone Pine Publishing, Auburn, 20 Washington. 21
eFloras. 2010. Flora of North America. Gared, St. Louis, Montana and Harvard University 22 Herbaria, Cambridge, Massachusetts. Available online at: http://www.efloras.org 23
Engel, K.A., L.S. Young, K. Steenhof, J.A. Roppe, and M.N. Kochert. 1992. Communal Roosting 24 of Common Ravens in Southwestern Idaho. Wilson Bulletin 104:105–121. 25
EPA (U.S. Environmental Protection Agency). 2003. EPA Region 10 Guidance for Pacific 26 Northwest State and Tribal Temperature Water Quality Standards. EPA 910-B-03-002. 27 Region 10 Office of Water, Seattle, WA. 28
FWS (U.S. Fish and Wildlife Service). 2002. Recovery Plan for Howell’s Spectacular Thelopody 29 (Thelypodium howellii ssp. Spectabilis). Region 1, Portland, OR. June 3. Available online 30 at: http://www.fws.gov/pacific/news/2002/thelypody/RecovPlan.pdf 31
FWS. 2004. Conference Opinion on the Issuance of the Four Enhancement of Survival Permits 32 for the Threemile Canyon Farms Multi-Species Candidate Conservation Agreement with 33 Assurances. Oregon Fish and Wildlife Office, Portland, Oregon. 34
FWS. 2008. Bull Trout (Salvelinus confluentus) Five Year Review: Summary and Evaluation. 35 USFWS, Portland, Oregon. 36
Gilmer, D., and J. Wiehe. 1977. Nestling by Ferruginous Hawk and Other Raptors on High 37 Voltage Powerline Towers. Prairie Naturalist 9:1-10 38
Good, T.P., R.S. Waples, and P. Adams (eds.). 2005. Updated Status of Federally Listed ESUs 39 of West Coast Salmon and Steelhead. U.S. Department of Commerce, NOAA Technical 40 Memorandum. NMFS-NWFSC-66. 598pp. 41

Boardman to Hemingway Transmission Line Project Exhibit Q
PRELIMINARY APPLICATION FOR SITE CERTIFICATE Page Q-48
Hicks, B.J., J.D. Hall, P.A. Bisson, and J.R. Sedell. 1991. Responses of Salmonids to Habitat 1 Changes. Pages 483-518 in Meehan, W.R. (ed.), Influences of Forest and Rangeland 2 Management on Salmonid Fishes and Their Habitats. Special Publ. 19. Bethesda, 3 Maryland: American Fisheries Society. 4
Hicks, M. 2000. Evaluating Standards for Protecting Aquatic Life in Washington’s Surface Water 5 Quality Standards. Draft Discussion Paper and Literature Summary. Washington State 6 Department of Ecology, Olympia, Washington. 7
Hitchcock, L., and A. Cronquist. 1973. Flora of the Pacific Northwest. University of Washington 8 Press, Seattle, WA. 9
Hitchcock, C. L., A. Cronquist, M. Ownbey, and J.W. Thompson. 1961. Vascular Plants of the 10 Pacific Northwest, Part 3: Saxifragaceae to Ericaceae. University of Washington Press, 11 Seattle. 614 pp. 12
IPC (Idaho Power Company). 2008. Transmission Line Clearing Specifications. 12-100-01. 13 September 14
IPC. 2010. Boardman to Hemingway Transmission Line Project Siting Study. August. 15
IPC. 2011. Revised Plan of Development. Boardman to Hemingway Transmission Line Project. 16 Boise, Idaho. November. 17
IPC. 2012. Boardman to Hemingway Transmission Line Project Supplemental Siting Study. 18 June. 19
Knight, R., and J. Kawashima. 1993. Response of ravens and red-tailed hawk populations to 20 linear right0of-ways. Journal of Wildlife Management 57:266–271. 21
Lloyd, D.S., J.P. Koenings, and J.D. LaPerriere. 1987. Effects of Turbidity in Fresh Waters of 22 Alaska. North American Journal of Fisheries Management 7:18–33. 23
Manley, P., B. Van Horne, J. Roth, W. Zielinski, M. McKenzie, T. Weller, F. Weckerly, and C. 24 Vojta. 2006. Multiple Species Inventory and Monitoring Technical Guide. Gen. Tech. 25 Rep. WO-73. Washington, DC: U.S. Department of Agriculture, Forest Service, 26 Washington Office. 204p. 27
Manzer, D.L., and S.J. Hannon. 2005. Relating grouse nest success and corvid density to 28 habitat: a multi-scale approach. Journal of Wildlife Management 69:110–123. 29
Meehan, W.R. (ed.). 1991. Influences of Forest and Rangeland Management on Salmonid 30 Fishes and Their Habitat. Special Publication 19. American Fisheries Society, Bethesda, 31 Maryland. 32
McCullough, D.A. 1999. A Review and Synthesis of Effects of Alterations to the Water 33 Temperature Regime on Freshwater Life Stages of Salmonids, with Special Reference 34 to Chinook Salmon. Environmental Protection Agency, Region 10. Seattle, WA. 35
McCullough, D.A., S. Spalding, D. Sturdevant, and M. Hicks. 2001. Issue Paper 5 – Summary of 36 Technical Literature Examining the Physiological Effects of Temperature on Salmonids. 37 Prepared as part of EPA Region 10 Temperature Water Quality Criteria Guidance 38 Development Project. EPA 910-D-01-005. Region 10 office of Water, Seattle, WA. 39
Morgan, R.L., and M. Nugent. 1999. Status and Habitat Use of the Washington Ground Squirrel 40 (Spermophilus washingtoni) on State of Oregon Lands, South Boeing, Oregon in 1999. 41 Report to the Oregon Department of Fish and Wildlife. 42

Boardman to Hemingway Transmission Line Project Exhibit Q
PRELIMINARY APPLICATION FOR SITE CERTIFICATE Page Q-49
Myers, J.M., R.G. Kope, G.J. Bryant, D. Teel, L.J. Lierheimer, T.C. Wainwright , W. Stewart 1 Grant, F.W. Waknitz, K. Neely, S.T. Lindley, and R.S. Waples. 1998. Status Review of 2 Chinook Salmon from Washington, Idaho, Oregon, and California. NOAA Technical 3 Memorandum NMFS-NWFSC-35. National Marine Fisheries Service, Northwest 4 Fisheries Science Center, Coastal Zone and Estuarine Studies Division. Seattle, 5 Washington. 6
NatureServe. 2011. NatureServe Explorer: An online encyclopedia of life. Available online at: 7 http://www.natureserve.org (accessed January 24, 2011). 8
Newcombe, C.P., and J.O.T. Jensen. 1996. Channel Suspended Sediment and Fisheries: A 9 Synthesis for Quantitative Assessment of Risk and Impact. North American Journal of 10 Fisheries Management 16: 693–727. 11
NMFS (National Marine Fisheries Service). 1996. Factors for Decline – A Supplement to the 12 Notice of Determination for West Coast Steelhead Under the Endangered Species Act. 13 National Marine Fisheries Service. Portland Oregon and Long Beach California. 14
NMFS. 1998. Factors Contributing to the Decline of Chinook Salmon: An Addendum to the 15 1996 West Coast Steelhead Factors for Decline Report. Protected Resource Division, 16 NMFS. Portland, Oregon. 17
NMFS. 2006. Supplement to the Draft Snake River Salmon Recovery Plan for Southwest 18 Washington. NOAA Fisheries, Northwest Region. 19
NMFS. 2009. Middle Columbia River Steelhead Distinct Population Segment ESA Recovery 20 Plan. NMFS, Northwest Region, Seattle, WA. 21
NOAA Fisheries (National Oceanic and Atmospheric Administration Fisheries Division). 2009. 22 Office of Protected Resources. NOAA Fisheries. Available online at: 23 http://www.nmfs.noaa.gov/pr/species/ 24
Nowak, M.C. 2004. Grande Ronde Subbasin Plan. Prepared for the Northwest Power and 25 Conservation Council. Portland, Oregon. 26
ODA (Oregon Department of Agriculture). 2008. Oregon listed plants. Available online at: 27 http://www.oregon.gov/ODA/PLANT/CONSERVATION/statelist.shtml 28
ODA. 2011. ODA Plant Division, Plant Conservation. Available online at: 29 http://www.oregon.gov/ODA/PLANT/CONSERVATION/county_list_a.shtml 30
ODEQ (Oregon Department of Environmental Quality). 1995. 1992-1994 Water Quality 31 Standards Review, Temperature. Portland, Oregon. 32
ODFW (Oregon Department of Fish and Wildlife). 2005. Oregon Native Fish Status Report. 33 http://www.dfw.state.or.us/fish/ONFSR/ 34
ODFW. 2008. Threatened, Endangered, and Candidate Fish and Wildlife Species in Oregon. 35 Available online at: http://www.dfw.state.or.us/wildlife/diversity/species/ 36 threatened_endangered_candidate_list.asp 37
ODFW. 2011a. Wolves in Oregon. Available online at: http://www.dfw.state.or.us/wolves/ 38
ODFW. 2011b. Natural Resources Management Program – Timing Tables. Available online at: 39 http://nrimp.dfw.state.or.us/nrimp/default.aspx?pn=timingtables (accessed April-May 40 2011). 41

Boardman to Hemingway Transmission Line Project Exhibit Q
PRELIMINARY APPLICATION FOR SITE CERTIFICATE Page Q-50
ORBIC (Oregon Biodiversity Information Center). 2008. Portland State University Oregon 1 Biodiversity Information Center data. Available online at: http://orbic.pdx.edu/ 2
ORBIC. 2010. Rare Threatened and Endangered Species of Oregon. 3
ORBIC. 2012. Portland State University Oregon Biodiversity Information Center data. Available 4 online at: http://orbic.pdx.edu/ 5
ORNHIC (Oregon Natural Heritage Information Center). 2010a. Field Guide to Threatened and 6 Endangered Plants of Oregon. Institute for Natural Resources, Portland State University, 7 Portland, Oregon. 8
ORNHIC. 2010b. Rare, Threatened and Endangered Species of Oregon. Institute for Natural 9 Resources, Portland State University, Portland, Oregon. 10
Orsi, J.J. 1971. Thermal Shock and Upper Lethal Temperature Tolerances of Young King 11 Salmon, Oncorhynchus tshawytsha, from the Sacramento-San Joaquin River System. 12 Anadromous Fisheries Branch Administrative Report No. 71-11. California Department 13 of Fish and Game, Sacramento, California. 16 p. 14
OSU (Oregon State University). 2010. Oregon Flora Project. The Rare Plant Guide. February 15 2010. Available online at: http://www.oregonflora.org. 16
Reid, S.M., S. Stoklosar, S. Metikosh, and J. Evans. 2002. Effectiveness of Isolated Pipeline 17 Crossing Techniques to Mitigate Sediment Impacts on Brook Trout Streams. Water 18 Quality Research Journal of Canada 37:473-488. 19
Ritter, P.W. 1984. Water Quality Concerns Associated with Pipeline Stream Crossings. In: A.E. 20 Crabtree (editor). Proceedings of the Third International Symposium on Environmental 21 Concerns in Rights-of-Way Management. Pages 447-456. Mississippi State University, 22 MS. 23
Rosetta, T. 2005. Draft – Technical Basis for Revising Turbidity Criteria. Water Quality Division, 24 Oregon Department of Environmental Quality. 25
Sauter, S.T., J. McMillan, and J. Dunham. 2001. Issue Paper 1 – Salmonid Behavior and Water 26 Temperature. Prepared as part of EPA Region 10 temperature water quality criteria 27 guidance development project. EPA 910-D-01-001. Region 10 office of Water, Seattle, 28 WA. 29
Selong, J. H., T. E. McMahon, A. V. Zale, and F. T. Barrows. 2001. Effect of Temperature on 30 Growth and Survival of Bull Trout, with Application of an Improved Method for 31 Determining Thermal Tolerance for Fishes. Transactions of the American Fisheries 32 Society 130:1026–1037. 33
Servizi, J., and D. Martens. 1992. Sublethal Responses of Coho Salmon (Oncorhynchus 34 kisutch) to Suspended Sediment. Canadian Journal of Fisheries and Aquatic Sciences 35 49: 1389–1395. 36
Sigler, J.W., T.C. Bjornn, and F.H. Everest. 1984. Effects of Chronic Turbidity on Density and 37 Growth of Steelheads and Coho Salmon. Transactions of the American Fisheries 38 Society 113:142–150. 39
Spence, B.C., G.A. Lomnicky, R.M. Hughes, and R.P. Novitzki. 1996. An Ecosystem Approach 40 to Salmonid Conservation. TR-4501-96-6057. ManTech Environmental Research 41 Services Corp., Corvallis, Oregon. 42

Boardman to Hemingway Transmission Line Project Exhibit Q
PRELIMINARY APPLICATION FOR SITE CERTIFICATE Page Q-51
Steenhof, K., M. Kochert, and J. Roppe. 1993. Nesting by Raptors and Common Raven on 1 Electrical Transmission Line Towers. Journal of Wildlife Management 57:271–281 2
StreamNet. 2010. Fish distribution and critical habitat map data for Oregon. Accessed August –3 September 2010. Portland, Oregon. Available online at: 4 http://www.streamnet.org/mapping_apps.cfm 5
USFS (U.S. Department of Agriculture, Forest Service). 2005. Final Report, Lomatium 6 erythrocarpum Survey. Wallowa-Whitman National Forest. October. 7
USFS. 2008. Regional Forester’s special status species lists. 8
Wydoski, R.S., and R.R. Whitney. 2003. Inland Fishes of Washington. 2nd Edition. University of 9 Washington Press, Seattle, Washington. 10