Embed Size (px)
Citation preview

Exhibit A: Notice of Public Hearing Pursuant to M.G.L. c. 6D, § 8, the Health Policy Commission, in collaboration with the Office of the Attorney General and the Center for Health Information and Analysis, will hold a public hearing on health care cost trends. The hearing will examine health care provider, provider organization and private and public health care payer costs, prices and cost trends, with particular attention to factors that contribute to cost growth within the Commonwealth’s health care system.
Scheduled hearing dates and location:
Monday, October 6, 2014, 9:00 AM Tuesday, October 7, 2014, 9:00 AM
Suffolk University Law School First Floor Function Room
120 Tremont Street, Boston, MA 02108 Time-permitting, the HPC will accept oral testimony from members of the public beginning at 4:00 PM on Tuesday, October 7. Any person who wishes to testify may sign up to offer brief comments on a first-come, first-served basis when the hearing commences on October 6. Members of the public may also submit written testimony. Written comments will be accepted until October 16, 2014 and should be submitted electronically to [email protected], or, if comments cannot be submitted electronically, sent by mail, post-marked no later than October 16, 2014, to the Health Policy Commission, Two Boylston Street, 6th floor, Boston, MA 02116, attention Lois H. Johnson. Please note that all written and oral testimony provided by witnesses or the public may be posted on the HPC’s website. The HPC encourages all interested parties to attend the hearing. Visit the Suffolk Law School website for driving and public transportation directions. Suffolk Law School is located diagonally across from the Park Street MBTA station (Red and Green lines). Parking is not available at the law school but information about nearby garages is listed at the link provided. If you require disability-related accommodations for this hearing, please contact Kelly Mercer at (617) 979-1420 or by email [email protected] a minimum of two weeks prior to the hearing so that we can accommodate your request. For more information, including details about the agenda, expert and market participant panelists, testimony and presentations, please check the Annual Cost Trends Hearing section of the HPC’s website. Materials will be posted regularly as the hearing dates approach.
Boston Medical Center 1
Exhibit B: Instructions and HPC Questions for Written Testimony Instructions: On or before the close of business on September 8, 2014, electronically submit, using the provided template, written testimony signed under the pains and penalties of perjury to: [email protected]. You may expect to receive the template for submission of responses as an attachment received from [email protected]. If you have any difficulty with the template or did not receive it, please contact Kelly Mercer at [email protected] or (617) 979-1420. Please begin each response with a brief summary not to exceed 120 words. The provided template has character limits for responses to each question, but if necessary, you may include additional supporting testimony or documentation in an Appendix. Please submit any data tables included in your response in Microsoft Excel or Access format. The testimony must contain a statement that the signatory is legally authorized and empowered to represent the named organization for the purposes of this testimony, and that the testimony is signed under the pains and penalties of perjury. An electronic signature will be sufficient for this submission. If you have any other questions regarding this process or regarding the following questions, please contact: Lois Johnson at [email protected] or (617) 979-1405.
[Remainder of page intentionally left blank]
Boston Medical Center 2
Questions: We encourage you to refer to and build upon your organization’s 2013 Pre-Filed Testimony responses, if applicable. Additionally, if there is a point that is relevant to more than one question (including Exhibit C questions from the Attorney General), please state it only once and make an internal reference.
1. Chapter 224 of the Acts of 2012 (c. 224) sets a health care cost growth benchmark for the Commonwealth based on the long-term growth in the state’s economy. The benchmark for growth between CY2012-CY2013 and CY2013-CY2014 is 3.6%. SUMMARY: BMC is continuously taking steps to control costs and increase efficiency. As confirmed in the response below and detailed in Attachment A, our trends indicate a serious commitment to reducing operating expenses and ensuring that patient care occurs in the right setting. Taking these actions is particularly critical for BMC’s sustainability because the vast majority of BMC’s patients are insured by Medicaid, other state subsidized insurance products or Medicare. In fact, BMC has experienced a cost growth trend well below the state's benchmark over the last several years. We have embarked on precedent-setting campus consolidation while actively moving our delivery system to an accountable care organization (ACO) capable of managing the total cost of patient care within capitated global payments.
a. What trends has your organization experienced in revenue, utilization, and operating expenses from CY 2010-CY2013 and year-to-date 2014? Please comment on the factors driving these trends. Over the past four years, BMC has worked aggressively to decrease controllable costs. As detailed in Attachment A, total expenses decreased each year since Fiscal Year 2010 with a net 0.4% decrease from FY 10 to FY 13. Expenses for FY 14 are expected to increase slightly, mainly due to new outpatient volume growth and 340B pharmacy expansion, but are still projected to be under the state’s 3.6% growth target. Revenue growth is due mainly to increased outpatient volume and 340B pharmacy expansion. Inpatient utilization decreased 14% from FY 10 to FY 13 and has begun to stabilize after a number of years of trending down. Outpatient volume continues to grow as patients transition over from inpatient services, and due to the increased demand for primary care services for the newly insured under health care reform.
b. What actions has your organization undertaken since January 1, 2013 to ensure the Commonwealth will meet the benchmark, and what have been the results of these actions? We have finalized the designs and received approvals for our bold campus consolidation project and the physical work is in process. This will result in a more efficient, patient-centric clinical campus.
Boston Medical Center 3
Additionally, BMC finalized agreements with several of its physician practices and Boston HealthNet CHCs to form the Boston Accountable Care Organization (BACO). BACO has received material change notice approval from the Health Policy Commission. MassHealth held discussions with BMC regarding our interest in participating in a Medicaid ACO with global payments for the full spectrum of care for our patients. In the interim, BMC primary care practices and seven affiliated CHCs are active participants, with the largest “pool” of primary care patients, in the state's Primary Care Payment Reform Initiative (PCPRI).
c. What actions does your organization plan to undertake between now and October 1, 2015 (including but not limited to innovative care delivery approaches, use of technology and error reduction) to ensure the Commonwealth will meet the benchmark? Work on the campus consolidation plan will continue through 2017. It will result in the closure of the East Newton facility with operations consolidated into one campus. The campus footprint will shrink by 329,000 square feet and 60 inpatient beds will be eliminated. The effort will eliminate redundancy and create efficiencies to better align our physical size to our current and projected utilization needs. Also, we plan to continue to work with MassHealth around efforts to implement a Medicaid ACO and, through that work, transition to a global payment system of reimbursement for services provided to our patients across the full continuum of care. As BACO is established, we also plan to begin to seek additional alternative payment agreements for care provided to our patients.
d. What systematic or policy changes would encourage or enable your organization to operate more efficiently without reducing quality? BMC encourages MassHealth to move rapidly toward global payments in an accountable care model. BMC commends MassHealth for proposing in its waiver proposal to the Center for Medicare and Medicaid Services (CMS) to contract directly with ACOs. In advance of a global payment system, shifting toward adequate Medicaid reimbursement for critical services (including behavioral health) is essential. It is also necessary to ensure that safety net health systems receive fair rates for treatment of commercially insured patients so we are not doubly disadvantaged by low public payer rates and low commercial rates.
2. C. 224 requires health plans to reduce the use of fee-for-service payment mechanisms to the maximum extent feasible in order to promote high-quality, efficient care delivery. SUMMARY: BMC supports efforts to move payment mechanisms away from fee-for-service toward alternative payment methodologies that allow providers to manage resources under patient-centered systems of coordinated care. We particularly support the use of actuarially-sound, risk-based, capitated global payments as an alternative
Boston Medical Center 4

payment methodology for those provider systems with the expertise to manage the total dollars associated with care for patients across the full continuum. To this end, we encourage the use of this type of alternative payment not only by health plans and the commercial insurer market, but also by MassHealth for the sizeable Medicaid population.
a. How have alternative payment methods (APMs) (payment methods used by a payer to reimburse health care providers that are not solely based on the fee-for-service basis, e.g., global budget, limited budget, bundled payment, and other non-fee-for-service models, but not including pay-for-performance incentives accompanying fee-for-service payments) affected your organization’s overall quality performance, care delivery practices, referral patterns, and operations? The majority of BMC's patients rely on government programs to support their health care coverage. More than 50% of BMCs patients are low-income individuals who receive MassHealth or other state supported coverage. Less than 25% of our payments are from commercial insurers and only two are under APM agreements. Our largest commercial payer, also an alternative payment contract, represents just 8% of total payer revenue. Risk settlements under both alternative payment agreements are less than 1% of total revenue. While we have expanded the number of APM based agreements with our existing commercial payers, the volume is much too small to have a sizeable impact on our performance, practices, patterns or operations. Larger scale adoption of APMs by public entities such as MassHealth is critical to allow us to maximize the efficiencies and improvements associated with alternative payments.
b. Attach and discuss any analyses your organization has conducted on the implementation of APMs and resulting effects on your non-clinical operations (e.g., administrative expenses, resources and burdens). See the response to question 2.a. above. In the absence of a significant volume of reimbursement from APMs, BMC has actively participated in the state's Primary Care Payment Reform Initiative (PCPRI) as referenced in responses to questions 1.b. and 1.c. above. The program recognizes an "administrative load" component to its primary care payment rate. Because the program has been in effect for only six months, it is too soon to determine its impact.
c. Please include the results of any analyses your organization has conducted on this issue, including both for your patients paid for under APMs and for your overall patient population.
See the response to question 2.b. above.
3. Please comment on the adequacy or insufficiency of health status risk adjustment measures used in establishing risk contracts and other APM contracts with payers. SUMMARY: Adjusting for the health status risk of a patient population under an alternative payment methodology is important. However, there is not yet an ideal risk adjustment measure in common use. Current health status adjustments do not adequately adjust for socioeconomic factors that influence utilization and quality. Current methodologies do not adequately account for the additional health care challenges endured by disadvantaged populations and the clinicians who care for them. These
Boston Medical Center 5
methodologies systematically underfund the care of disadvantaged populations and safety net institutions.
a. In your organization’s experience, do health status risk adjustment measures sufficiently account for changes in patient population acuity, including in particular sub-populations (e.g., pediatric) or those with behavioral health conditions? In our experience, even state of the art risk adjustment measures have limitations and do not fully account for changes in patient population acuity. We believe that risk adjustment measures are least effective at accounting for the effects of patient acuity at both ends of the spectrum, with a tendency to under-account for extremely high acuity patients and a tendency to over-account for extremely low acuity patients. Our experience also indicates that risk adjustment does not adequately take into effect socioeconomic factors relevant to safety net populations and thereby inherently underestimate medical complexity and cost.
b. How do the health status risk adjustment measures used by different payers compare? BMC has APM contracts with two commercial carriers that incorporate health status risk adjustment. In both cases the carrier uses a DxCG product. While there may be some differences between the manner in which the two carriers apply the DxCG product (e.g., model, version, etc.) the overall approach to health status risk adjustment is very comparable. Additionally, the PCPRI program risk adjusts the attributed population with a modified model of the Verisk risk-adjuster. At this time, we do not have enough data on the product or the underlying assumptions to determine the effectiveness of that risk adjustment model.
c. How does the interaction between risk adjustment measures and other risk contract elements (e.g., risk share, availability of quality or performance-based incentives) affect your organization? BMC is not particularly affected by risk adjustment and its interaction with other APM contract elements, given our small volume of APM arragements.
4. A theme heard repeatedly at the 2013 Annual Cost Trends Hearing was the need for more timely, reliable, and actionable data and information to facilitate high-value care and performance under APMs. What types of data are or would be most valuable to your organization in this regard? In your response, please address (i) real time data to manage patient care and (ii) historic data or population-level data that would be helpful for population health management and/or financial modeling. SUMMARY: Claims data with standard definitions and formats across payers would support better analysis by health care systems of overall patterns of care for both cost and quality. Aggregated standardized multi-payer data will better support more detailed and efficient provider profiling than is currently possible. It is important that data are as close to real time as possible with minimal claims lag. Timely hospital admission and emergency room visit data are particularly important to enable groups to proactively follow up with patients seen out of their network. ANSWER: (i) Real time data are critical to ensuring that we have the most current information available on our patients. (ii) BMC strongly believes that claims data
Boston Medical Center 6
across all payers is necessary in order to understand the total cost of care for our patients, understand their utilization patterns and identify opportunities for savings and improved care management. With such data, we would have the capability to review both historical costs and utilization patterns and population-level opportunies that will allow us to target care management efforts where they can be most beneficial.
5. C. 224 requires health plans to attribute all members to a primary care provider, to the maximum extent feasible. SUMMARY: In order to best manage patient care, a methodology that "assigns" patients to a primary care provider is strongly preferable over one that attributes based on other criteria.
a. Which attribution methodologies most accurately account for patients you care for? In our largely MassHealth-covered population, patients are "assigned" to the primary care doctor who they have selected (or was selected for them if they don't choose). Under the Medicaid MCOs, patients are required to receive and coordinate care via the assigned primary care doctor. The MassHealth Primary Care Clinician (PCC) plan does not necessarily require a patient to use their assigned PCP site, resulting in patients who may seek care in numerous settings. Coordinated patient care can best be achieved in an environment where the patient develops and maintains a relationship with a primary care physician in a medical home environment.
b. What suggestions does your organization have for how best to formulate and implement attribution methodologies, especially those used for payment? We suggest less use of PPOs and attribution methodologies and more use of PCP-based assignments.
6. Please discuss the level of effort required to report required quality measures to public and private payers, the extent to which quality measures vary across payers, and the resulting impact(s) on your organization. SUMMARY: Boston Medical Center has several FTEs involved in reporting performance to public and private payers. ANSWER: The current variation in reporting requirements, metric definitions and formats across payers increases the effort and complexity of this reporting with little value to the delivery system. We also sometimes find it challenging to explain the myriad measures, and our performance on them, to our management and clinical leadership.
7. An issue addressed both at the 2013 Annual Cost Trends Hearing and in the Commission’s July 2014 Cost Trends Report Supplement is the Commonwealth’s higher than average utilization of inpatient care and its reliance on academic medical centers. SUMMARY: BMC is both an academic medical center and the community hospital of choice to the low-income patients of Boston. As such, most inpatient care for our patients remains at BMC with referrals only made for certain tertiary services that we do not provide.
Boston Medical Center 7

a. Please attach any analyses you have conducted on inpatient utilization trends and the flow of your patients to AMCs or other higher cost care settings. The primary care physicians at BMC refer most patients requiring inpatient care to BMC. Generally referrals are only made to other AMCs where a particular service is unavailable at BMC. As referenced in the response to qyestuin 1.a. above, BMC observed a 14% decrease in inpatient utilization from FY 2010 through 2013 with a stabilization projected in FY 2014.
b. Please describe your organization’s efforts to address these trends, including, in particular, actions your organization is taking to ensure that patients receive care in lower-cost community settings, to the extent clinically feasible, and the results of these efforts. BMC actively works to ensure the right care is provided at the right setting. We have an extensive network of 15 affiliated community health centers in Boston HealthNet. These CHCs provide not only primary care and behavioral health services but also offer many specialty services on-site from CHC and BMC specialists. Our campus redesign is focused on improving outpatient care while reducing the number of inpatient beds.
8. The Commission found in its July 2014 Cost Trends Report Supplement that the use of post-acute care is higher in Massachusetts than elsewhere in the nation and that the use of post-acute care varies substantially depending upon the discharging hospital. SUMMARY: As part of our care management processes, all patients are assessed for appropriate site of care post discharge.
a. Please describe and attach any analyses your organization has conducted regarding levels of and variation in the utilization and site of post-acute care, as well as your efforts to ensure that patients are discharged to the most clinically appropriate, high-value setting. All patients are assessed for appropriate site of care post discharge. Post acute care sites are recommended based on individual patient needs, and incorporate review of public quality metrics. Because we do not process claims from post acute care facilities, we do not have detailed analysis of utilization.
b. How does your organization ensure optimal use of post-acute care? See response above.
9. C. 224 requires providers to provide patients and prospective patients with requested price for admissions, procedures and services. Please describe your organization’s progress in this area, including available data regarding the number of individuals that seek this information (using the template below) and identify the top ten admissions, procedures and services about which individuals have requested price information. Additionally, please discuss how patients use this information, any analyses you have conducted to assess the accuracy of estimates provided, and/or any qualitative observations of the value of this increased price transparency for patients.
Boston Medical Center 8
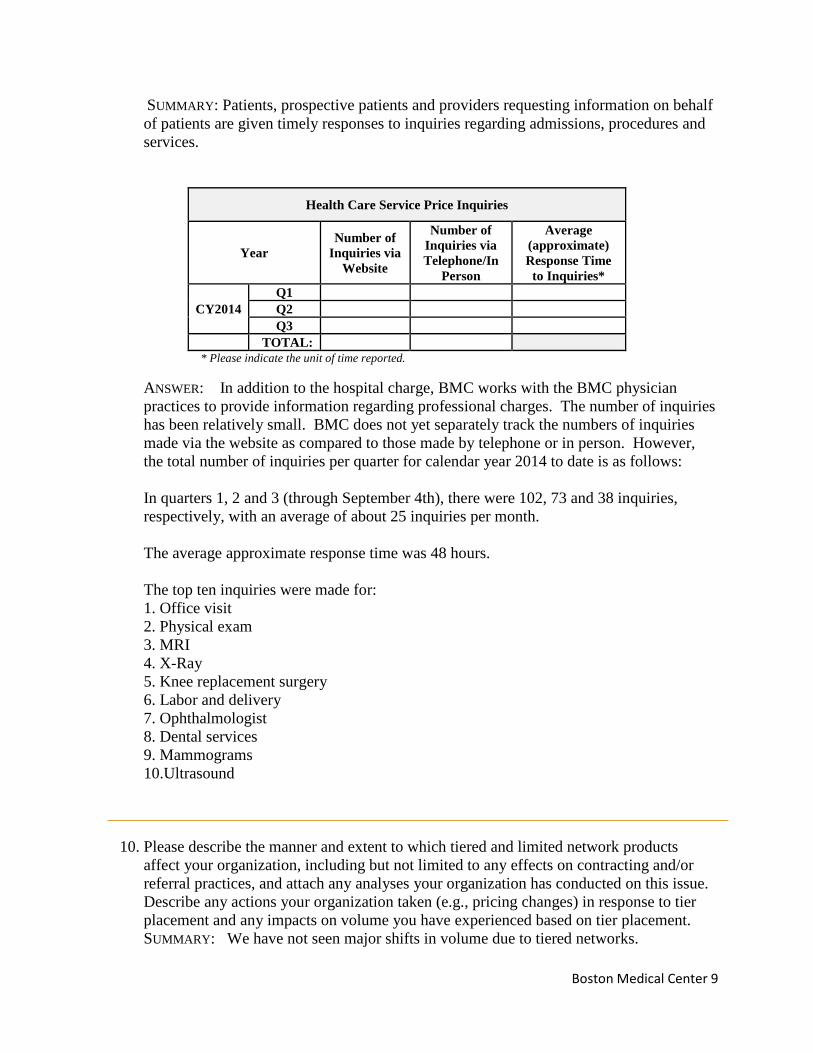
SUMMARY: Patients, prospective patients and providers requesting information on behalf of patients are given timely responses to inquiries regarding admissions, procedures and services.
Health Care Service Price Inquiries
Year Number of
Inquiries via Website
Number of Inquiries via Telephone/In
Person
Average (approximate) Response Time
to Inquiries*
CY2014 Q1 Q2 Q3
TOTAL: * Please indicate the unit of time reported.
ANSWER: In addition to the hospital charge, BMC works with the BMC physician practices to provide information regarding professional charges. The number of inquiries has been relatively small. BMC does not yet separately track the numbers of inquiries made via the website as compared to those made by telephone or in person. However, the total number of inquiries per quarter for calendar year 2014 to date is as follows: In quarters 1, 2 and 3 (through September 4th), there were 102, 73 and 38 inquiries, respectively, with an average of about 25 inquiries per month. The average approximate response time was 48 hours. The top ten inquiries were made for: 1. Office visit 2. Physical exam 3. MRI 4. X-Ray 5. Knee replacement surgery 6. Labor and delivery 7. Ophthalmologist 8. Dental services 9. Mammograms 10.Ultrasound
10. Please describe the manner and extent to which tiered and limited network products affect your organization, including but not limited to any effects on contracting and/or referral practices, and attach any analyses your organization has conducted on this issue. Describe any actions your organization taken (e.g., pricing changes) in response to tier placement and any impacts on volume you have experienced based on tier placement.
SUMMARY: We have not seen major shifts in volume due to tiered networks.
Boston Medical Center 9
ANSWER: We have not seen major shifts in volume due to tiered networks. As a low cost provider we welcome insurance products that are structured to pass along savings from our rates to patients. Limited networks have caused some disruption in referral patterns and continuity of care and they need to be constructed to (1) meet strict network adequacy requirements and (2) clearly disclose network restrictions to patients. As a safety net hospital, the majority of our organization's patients are covered by insurance products under which both tiering and limited networks have had very little applicability. Our organization’s patient base covered under tiered networks is very small and we have therefore not studied the impact of these products nor made any pricing changes in response to tier placement. Generally speaking, our organization has chosen to participate in most limited network products that are available to us. We have been provided data from one of the Managed Medicaid Health Plans that suggests our market share for tertiary services is significantly higher in a limited network product.
11. The Commission has identified that spending for patients with comorbid behavioral health and chronic medical conditions is 2-2.5 times as high as spending for patients with a chronic medical condition but no behavioral health condition. As reported in the July 2014 Cost Trends Report Supplement, higher spending for patients with behavioral health conditions is concentrated in emergency departments and inpatient care. SUMMARY: There is a significant lack of behavioral health services across the Commonwealth. Continued focus across the Commonwealth is necessary to ensure adequate access to appropriate behavioral health care in the most cost effective settings. Reimbursement models should incent co-location and co-management of behavioral health and primary care and reimburse for coordination of care activities in this area. Improved care coordination here will likely decrease emergency room and hospital utilization for this cohort of patients Simultaneously, we should enhance efforts to incorporate and coordinate behavioral health with primary care.
a. Please describe ways that your organization is collaborating with other providers to integrate physical and behavioral health care services and provide care across a continuum to these high-cost, high-risk patients. BMC is the Essential Service Provider (BEST) for the Boston and Cambridge areas under MassHealth. As such, we routinely coordinate with other providers and community entities as follow-up to the provision of that emergency stabilization care. Additionally, as part of PCMH, BMC is working to implement a behavioral health/primary care integration project. A multi-disciplinary approach will be used to create an integrated behavioral health team that includes primary care and behavorial health clinicians.
b. Please discuss ways that your organization is addressing the needs of individuals to avoid unnecessary utilization of emergency room departments and psychiatric inpatient care. We have been increasing access to primary care to help ensure patients receive routine care in the most appropriate setting in continuity with their primary provider. Our practices have achieved primary care medical home certification and are actively integrating mental health practitioners in our primary are settings
Boston Medical Center 10

to ensure optimal treatment for mental disorders in the outpatient setting, rather than the emergency room or as inpatients.
c. Please discuss successes and challenges your organization has experienced in providing care for these patients, including how to overcome any barriers to integration of services. Existing reimbursements for mental health services do not adequately cover the work to better integrate behavioral health and medical care. Care coordination work must be better reimbursed. Financial arrangements that carve out mental health reimbursement work against integrated models.
d. There has been increased statewide interest in data reporting across all services, inclusive of behavioral health. Please describe your organization’s willingness and ability to report discharge data. BMC supports the need for data across all service lines including behavioral health with the proper protections for private patient information.
12. Describe your organization’s efforts and experience with implementation of patient-centered medical home (PCMH) model. SUMMARY: BMC and its affiliated community health centers were initial participants in the state's patient centered medical home (PCMH) program. Since that time, BMC's internal medicine and family medicine practices have become NCQA Level 3 certified PCMHs as have many of the affiliated CHCs. Together, the BMC practices and 7 affiliated CHCs participate in the Commonwealth's PCPRI, an outgrowth of the PCMH program.
a. What percentage of your organization’s primary care providers (PCPs) or other providers are in practices that are recognized or accredited as PCMHs by one or more national organizations? BMC has four primary care practices: General Internal Medicine (GIM), Family Medicine (FM), Pediatrics and Geriatrics. BMCs two largest practices, GIM and Family Medicine, secured the highest level of recognition as an NCQA Level 3 Patient Centered Medical Home in 2014 and represent approximately 75% of providers in our primary care practices.
b. What percentage of your organization’s primary care patients receives care from those PCPs or other providers? Nearly 40,000 patients now receive care under the PCMH model, representing approximately 76% of BMCs total primary care patients
c. Please discuss the results of any analyses your organization has conducted on the impact of PCMH recognition or accreditation, including on outcomes, quality, and costs of care. Since the achievement of PCMH recognition is relatively new, we have not had time to conduct an analysis of its impact. Anecdotally, though, clinicians are excited about it and believe it will lead to better coordinated care and improved quality. We do not anticipate that PCMH achievement alone will have any significant impact on cost of care. It must be accompanied by alternative payment structures and strategies that align incentives across the continuum.
Boston Medical Center 11

13. After reviewing the Commission’s 2013 Cost Trends Report and the July 2014 Supplement to that report, please provide any commentary on the findings presented in light of your organization’s experiences.
SUMMARY: n/a ANSWER:
Boston Medical Center 12

Exhibit C: Instructions and AGO Questions for Written Testimony
Please note that these pre-filed testimony questions are for hospitals. To the extent that a hospital submitting pre-filed testimony responses is affiliated with a provider system also submitting pre-filed testimony responses, each entity may reference the other’s response as appropriate.
1. Please submit a summary table showing for each year 2010 to 2013 your total revenue under pay for performance arrangements, risk contracts, and other fee for service arrangements according to the format and parameters provided and attached as AGO Hospital Exhibit 1 with all applicable fields completed. Please attempt to provide complete answers. To the extent you are unable to provide complete answers for any category of revenue, please explain the reasons why.
Completed in Attachment AGO Hospital Exhibit 1
Please see attached AGO BMC Exhibit 1. As we noted on the chart, BMC does not
have any material risk-based plans. Risk settlements total less than $500,000 per year. Therefore, we modified the chart to provide you with a complete picture of all revenue by payor.
2. For each year 2010 to present, please submit a summary table showing for each line of business (commercial, government, other, total) your inpatient and outpatient revenue and margin for each major service category according to the format and parameters provided and attached as AGO Hospital Exhibit 2 with all applicable fields completed. Please submit separate sheets for pediatric and adult populations, if necessary. If you are unable to provide complete answers, please provide the greatest level of detail possible and explain why your answers are not complete.
Completed in Attachment AGO Hospital Exhibit 2
Please see attached AGO BMC Exhibit 2. Please note that BMC has implemented a new system that enables us to summarize this information, but the data are only available for FY11 and forward.
3. Please explain and submit supporting documents that show how you quantify, analyze and project your ability to manage risk under your risk contracts, including the per member per month costs associated with bearing risk (e.g., costs for human resources, reserves, stop-loss coverage), solvency standards, and projections and plans for deficit scenarios. Include in your response any analysis of whether you consider the risk you bear to be significant.
BMC has extensive experience in risk management through its managed care plan, the BMC HealthNet Plan. We use external actuaries to assess the significance of the risk and our ability to meet solvency and other requirements. Historical claims data are required to adequately complete this analysis. Using historical data, we project potential outcome scenarios based on the contract
Boston Medical Center 13
model, historic trend, historic variablity, a range of utilization and quality assumptions, and available stop loss programs. We also project necessary management resources and costs. Potential resources and costs needed to manage both surplus and deficit risk are evaluated against our financial position and reserves to determine if the degree of risk is prudent and supportive of organizational goals and priorities.
4. Please explain and submit supporting documents that show how you analyze and track the volume of inpatient and outpatient referrals to your hospital and the associated revenue from those referrals by particular physicians or provider groups. Please include a description and examples of how your organization uses this information.
Like all providers, BMC attempts to capture patient referral source during patient intake interviews. This information is frequently dependent on patient understanding and the quality of the response can be variable. That said, the data are used to help identify where reports and notifications, such as those associated with ED utilization, are to be directed. Additionally, BMC uses ED and other utilization reports to frame conversations with our affiliated CHCs regarding how to best manage care in the most appropriate setting as well as to address any access issues that may impact this objective.
Boston Medical Center 14
BMC Attachment A
Over the past four years, BMC has worked aggressively to decrease controllable costs. As shown in the chart below, total expenses decreased each year since Fiscal Year 2010 with a net 0.4% decrease from FY 10 to FY 13. Expenses for FY 14 are expected to increase slightly, mainly due to new outpatient volume growth and 340B pharmacy expansion, but are still projected to be under the state’s 3.6% growth target.
Revenue growth is mainly due to increased outpatient volume and 340B pharmacy expansion.
Inpatient utilization decreased 14% from FY 10 to FY 13 and has begun to stabilize after a number of years of trending down. Outpatient volume continues to grow as patients transition over from inpatient services, and due to the increased demand for primary care services for the newly insured under health care reform.
Projected Change % Change % Change
Summary ('000) FY10 FY11 FY12 FY13 FY 14 FY10 - FY 13 FY 12 - FY 13 FY10 - FY13
Operating Expenses $1,004,577 $1,004,075 $1,002,153 $1,000,308 $1,029,954 -$4,269 -0.2% -0.4%
Operating Revenue $967,454 $971,939 $1,002,970 $1,005,138 $1,034,578 $37,684 0.2% 3.9%
Inpatient Discharges 30,215 29,070 26,132 25,996 25,986 (4,219) -0.5% -14.0%
Outpatient visits 926,289 943,198 967,402 985,761 1,014,761 59,472 1.9% 6.4%

Boston Medical CenterInsurance Payments By InsuranceService Dates by Fiscal Year
Fee For Service Revenue FY 2010 FY 2011Blue Cross Blue Shield $57,966,325 $52,262,959Tufts Health Plan $12,643,888 $10,687,445Harvard Pilgrim Health Care $27,000,050 $24,850,020Fallon Community Health Plan $0 $0CIGNA $4,510,139 $3,712,114United Healthcare $5,939,315 $6,508,445Aetna $6,207,697 $6,152,229Other Commercial $50,509,091 $50,373,942Total Commercial $164,776,504 $154,547,153
Network Health $2,315,059 $2,780,210Neighborhood Health Plan $23,119,847 $24,619,750BMC HealthNet, Inc. $59,768,088 $65,065,435Health New England $0 $0Fallon Community Health Plan $0 $540Other Managed Medicaid $0 $0Total Managed Medicaid $85,202,994 $92,465,935
MassHealth $117,165,051 $109,386,204
Tufts Medicare Preferred $7,448,125 $7,363,146Blue Cross Senior Options $2,149,320 $2,189,423Other Comm Medicare $16,066,391 $14,919,528Commercial Medicare Subtotal $25,663,837 $24,472,098
Medicare $170,565,892 $169,173,074
Other $33,954,774 $30,588,429
GRAND TOTAL $597,329,051 $580,632,893
Note: BMC does not have any material risk based plans. Risk settlement are less than $500K per yea
Detail by Primary Insurance
Insurance Insurance Group FY 2010AETNA NO PCP Aetna $3,160,438AETNA PCP Aetna $643,723AETNA STUDENT HEALTH Aetna $2,403,536ANTHEM BLUE CROSS Blue Cross Blue Shield $7,949BCBS BENEFIT ADMIN Blue Cross Blue Shield $0BCBS HMO Blue Cross Blue Shield $21,070,917BCBS INDEMNITY Blue Cross Blue Shield $9,869,647BCBS MEDEX Blue Cross Blue Shield $2,924BCBS NOT MA HMO Blue Cross Blue Shield $501,096BCBS NOT MA POS Blue Cross Blue Shield $0BCBS NOT MA PPO Blue Cross Blue Shield $135BCBS NOTMA INDEMNITY Blue Cross Blue Shield $9,196,797BCBS POS Blue Cross Blue Shield $3,767,973BCBS PPO Blue Cross Blue Shield $13,548,886

BCBS MCARE HMO Blue Cross Senior Options $1,650,491BCBS MCARE PPO Blue Cross Senior Options $498,830BMC HLTHNET MEDICAID BMC HealthNet, Inc. $59,768,088CIGNA CIGNA $3,467,077CIGNA CARELINK CIGNA $1,043,061FALLON MEDICAID Fallon Community Health Pla $0BMC PREFERRED Harvard Pilgrim Health Care $4,026,744BMC PREFERRED OTHER Harvard Pilgrim Health Care $687,956HPHC HMO Harvard Pilgrim Health Care $6,254,412HPHC INDEMNITY Harvard Pilgrim Health Care $0HPHC POS Harvard Pilgrim Health Care $16,030,939HPHC PPO Harvard Pilgrim Health Care $0MEDICAID MassHealth $50,542,424MEDICAID LIMITED MassHealth $9,016MEDICAID MNGCARE MassHealth $25,813,146MEDICAID MNGCARE OTH MassHealth $40,800,465CMSP Medicare $264,396MEDICARE A AND B Medicare $165,763,689MEDICARE PART A ONLY Medicare $3,469,546MEDICARE REPLACEMENT Medicare $1,068,261NHP CMA Neighborhood Health Plan $911,584NHP MEDICAID Neighborhood Health Plan $4,651,774NHP OTHER MEDICAID Neighborhood Health Plan $17,556,489NETWK HLTH MEDICAID Network Health $2,315,059BMC HLTHNET COMMCARE Other $30,618,911CELTICARE Other $1,369,303CHAMPVA Other $0FALLON COMMCARE Other $208,015HSN Other $99,308HSN PARTIAL Other $275,832HSN PENDING Other $0MEDICAID NOT MA Other $303,192NETWK HLTH COMMCARE Other $844,632ZFC BAD DEBT Other $187,937ZFC REPLACEMENT Other $35,445ZFC VOID Other $12,198AARP 2ND MCARE Other Comm Medicare $935AARP MCARE COMPLETE Other Comm Medicare $18,850CIGNA MCARE ACCESS Other Comm Medicare $636,916E BOSTON ESP Other Comm Medicare $2,056,540ESPMH ELDER SERV PL Other Comm Medicare $22,136EVERCARE Other Comm Medicare $3,998,897FALLON MEDICARE Other Comm Medicare $428,560FIRST SENIOR FREEDOM Other Comm Medicare $2,631,480SENIOR WHOLE HEALTH Other Comm Medicare $4,955,128UNITED MCARE Other Comm Medicare $0
HEALTH NET PEARL Other Comm Medicare $44,264.14UPHAMS CORNER ESP Other Comm Medicare $1,272,685
ZFC VOID Other Commercial $0AD HOC RATES Other Commercial $267,032AVMED HEALTH PLANS Other Commercial $0BCCI-BMC Other Commercial $3,533BLUE CROSS 2ND TO MC Other Commercial $189BMC HLTHNET CHOICE Other Commercial $0BU ROHP XRAY Other Commercial $0

BUMC TB Other Commercial $0CARENET Other Commercial $0COMMCARE ALLIANCE Other Commercial $5,875,544COMMERCIAL INSURANCE Other Commercial $3,787,975CONNECTICARE INC Other Commercial $9,973CONSOLIDATED GROUP Other Commercial $53,177CORRECTIONS Other Commercial $1,090,779DAVITA INC Other Commercial $0DELTA DENTAL Other Commercial $120DORAL COMM CARE Other Commercial $575DORAL DENTAL Other Commercial $1,538FALLON COMMERCIAL Other Commercial $204FIRST HEALTH Other Commercial $153,627FLAT FEE Other Commercial $398,435GCRC Other Commercial $1,517GHI-NEW YORK Other Commercial $25,866GREAT WEST HLTHCARE Other Commercial $153,290GUARDIAN LIFE INS C Other Commercial $15,322HCVM Other Commercial $5,614HEALTH NET Other Commercial $43,008HEALTH PLANS INC Other Commercial $1,886,974HEALTHY START Other Commercial $554,003HIP HEALTH INS PLAN Other Commercial $1,322HMO GENERAL Other Commercial $247,552HUMANA INSURANCE Other Commercial $154,624JOHN HANCOCK INS CO Other Commercial $2,321KAISER PERMANENTE Other Commercial $147,066KIDNEY TRANSPLANT Other Commercial $33,411LONG TERM CARE Other Commercial $109,536MAILHANDLERS Other Commercial $66,008MCI Other Commercial $0MEDICAID 2ND TO MCR Other Commercial $2,205MEDICARE MSP 2ND PY Other Commercial $0METROPOLITAN INS CO Other Commercial $0MIDDLESEX JAIL Other Commercial $0MULTIPLAN Other Commercial $23,255MVA Other Commercial $10,871,138NETWK HLTH EXTEND Other Commercial $0NEWBORN PENDING Other Commercial $0NHP CHOICE Other Commercial $0NHP COMMCARE Other Commercial $4,261,492NHP COMMERCIAL Other Commercial $2,701,380NHP OF RHODE ISLAND Other Commercial $0NHP OTHER COMMERCIAL Other Commercial $4,444,587OEM BOSTON FIRE Other Commercial $0OEM OTHER Other Commercial $0OXFORD HEALTH PLAN Other Commercial $193,779PHCS Other Commercial $65,290

PPO GENERAL Other Commercial $0PRINCIPAL FINANCIAL Other Commercial $6,942QTC MEDICAL Other Commercial $4,557RESEARCH GRANT #1 Other Commercial $0RESEARCH GRANT #2 Other Commercial $360,938RESEARCH GRANT #3 Other Commercial $0SCHOOL HEALTH PROGRA Other Commercial $11SELF PAY Other Commercial $3,494,867SHADOW MEDICARE Other Commercial $1,256,944STD CLINIC Other Commercial $23,083SUFFOLK BRADSTON ST Other Commercial $0SUFFOLK NASHUA ST. Other Commercial $0TB CLINIC Other Commercial $953TRANSPLANT Other Commercial $0TRAVELERS INS CO Other Commercial $46,836TRICARE Other Commercial $587,845TUFTS COMMCHOICE Other Commercial $193UNICARE Other Commercial $2,490,387US DEPT OF LABOR Other Commercial $0VETERANS ADMIN Other Commercial $387,682WAUSAU INS COMPANIE Other Commercial $0WORK COMP BMC EMPLOY Other Commercial $1,020WORK COMP BOS FIRE Other Commercial $27,937WORK COMP BOS POLICE Other Commercial $83,679WORK COMP BU EMPLOY Other Commercial $94,363WORK COMP CITY BOS Other Commercial $526,165WORK COMP OTHER Other Commercial $3,312,800ZFC CONF APPLCTN Other Commercial $0ZP BEACON HEALTH Other Commercial $237ZP BHS BMC HEALTHNET Other Commercial $1,615ZP BHS BMC HLTNET CC Other Commercial $346ZP BHS FALLON Other Commercial $0ZP BHS GIC Other Commercial $0ZP BHS NHP Other Commercial $120ZP BHS NHP CC Other Commercial $0ZP BHS SWH Other Commercial $0ZP CENPATICO CELTICR Other Commercial $0ZP MBHP Other Commercial $1,864
DPH REFUGEE HEALTH Other Commercial $2,050MEDICAL CLAIMS SERV Other Commercial $351CNA INSURANCE CO Other Commercial $343AMALGAMATED LIFE IN Other Commercial $123ZP RAILROAD Other Commercial $0ZP UBH HPHC Other Commercial $0ZP UNITED BEHAV HLTH Other Commercial $3,380ZP VALUE OPTIONS Other Commercial $0ZZ HARVARD CHP OTHER Other Commercial $0ZZ HDRL Other Commercial $127,057ZZINFERTILITY SVC Other Commercial $11,138TUFTS CARELINK Tufts Health Plan $400,533TUFTS HMO Tufts Health Plan $3,334,103TUFTS OTHER Tufts Health Plan $8,903,662TUFTS POS Tufts Health Plan $4,883TUFTS PPO Tufts Health Plan $707TUFTS MCARE HMO Tufts Medicare Preferred $1,255,310

TUFTS MCARE POS Tufts Medicare Preferred $5,967,912TUFTS MCARE PPO Tufts Medicare Preferred $224,904TUFTS MCARE SUPP Tufts Medicare Preferred $0UNITED HEALTHCARE United Healthcare $5,939,315UNITED HP PASSPORT United Healthcare $0UNITED HP STUDENT United Healthcare $0Grand Total $597,329,051
* BMC has very little risk based insurance with settlement of less than $500K per year.

FY 2012 FY 2013$52,590,699 $48,588,291$10,422,230 $10,988,166$25,460,240 $23,657,435
$0 $0$4,186,481 $4,033,251$8,217,249 $7,710,012$5,920,068 $6,785,810
$50,239,728 $49,660,319$157,036,695 $151,423,285
$2,232,803 $9,652,801$23,514,452 $24,170,678$65,444,790 $72,515,965
$0 $0$7,755 $68,218
$0 $0$91,199,800 $106,407,662
$107,120,425 $95,614,899
$6,903,243 $6,581,550$1,854,175 $2,405,957
$17,856,934 $22,035,522$26,614,352 $31,023,030
$173,108,616 $174,910,054
$26,805,789 $51,997,238
$581,885,677 $611,376,168
ar.
FY 2011 FY 2012 FY 2013$3,351,265 $2,590,023 $2,827,533
$490,121 $1,143,131 $1,362,055$2,310,843 $2,186,914 $2,596,222
$16,563 $71,494 $121,289$155 $170,140 $39,735
$18,604,000 $20,566,774 $18,895,307$3,713,233 $447,894 $136,224
$2,144 $598 $138$223,845 $742,986 $1,107,124
$0 $195,711 $203,307$36,030 $5,978,072 $7,321,483
$8,456,173 $2,497,207 $372,044$4,465,690 $3,793,543 $2,262,633
$16,745,126 $18,126,281 $18,129,007

$1,508,513 $905,192 $994,348$680,910 $948,983 $1,411,609
$65,065,435 $65,444,790 $72,515,965$2,328,730 $2,789,875 $1,929,027$1,383,384 $1,396,606 $2,104,224
$540 $7,755 $68,218$5,104,694 $5,131,324 $5,825,579
$726,629 $28,284 $2,640$5,283,607 $13,475,063 $12,769,601
$0 $36,945 $16,799$12,672,721 $3,670,072 $1,545,980
$1,062,369 $3,118,553 $3,496,836$44,892,988 $28,573,105 $26,898,610
$808,833 $13,798,651 $12,596,056$24,205,494 $62,893,574 $55,932,785$39,478,889 $1,855,094 $187,448
$290,181 $242,758 $287,069$164,863,325 $169,414,338 $171,774,349
$3,194,383 $2,736,877 $2,292,140$825,186 $714,643 $556,496
$1,394,067 $714,611 $788,587$5,437,849 $22,339,545 $23,294,025
$17,787,834 $460,296 $88,066$2,780,210 $2,232,803 $9,652,801
$28,449,365 $24,014,599 $45,972,078$718,956 $723,774 $363,643
$262 $21,825 $30,159$32,332 $53,717 $14,826
$165,807 $337,227 $462,348$344,673 $301,373 $215,981
$60 $0 $0$265,496 $259,042 $453,662$448,267 $1,062,587 $4,422,345$131,970 $31,645 $62,198
$10,747 $0 $0$20,493 $0 $0
$0 $273 $0$2,693,112 $4,059,951 $4,259,260
$188,126 $2,383 $12,999$1,872,083 $2,073,648 $2,127,230
$14,830 $3,871 $0$2,698,411 $3,470,014 $2,684,701
$320,426 $19,595 $64,820$478,601 $130 $0
$5,680,103 $6,898,859 $9,012,234$0 $69,106 $2,037,061$0 $0 $0
$973,836 $1,259,106 $1,837,218$0 $1,983 $0
$192,199 $850,174 $472,037$213 $0 $0$973 $777 $301$295 $0 $0
$0 $64,668 $367,132$0 $0 $0

$0 $0 $0$0 $0 $0
$7,498,947 $7,318,904 $8,814,521$3,384,624 $2,691,347 $2,672,894
$3,574 $2,174 $0$42,368 $3,874 $1,478
$1,557,987 $1,200,631 $2,257,017$0 $0 $0
$9,250 $460 $580$0 $60 $0$0 $1,496 $906
$795 $462,176 $294,473$6,112 $0 $0
$464,538 $600,426 $728,494$84 $0 $0
$30,623 $9,632 $41,464$49,545 $21,825 $134,561
$736 $193 $0$1,468 $0 $0
$40,407 $1,077 $0$1,893,927 $2,062,405 $2,925,249
$567,345 $463,113 $738,428$15,625 $6,461 $91$56,596 $23,302 $8,261$42,316 $93,448 $259,925
$1,133 $369 $0$315,703 $225,998 $45,986
$59,106 $108,126 $69,593$143,407 $134,854 $70,684
$61,104 $210,502 $13,625$0 $0 $0
$3,218 $0 $0$20,838 $0 $0
$0 $0 $368$0 $0 $0
$34,083 $25,584 $12,718$11,288,685 $11,312,830 $8,804,503
$0 $100,735 $363,197$0 $0 $4,790$0 $179,802 $592,222
$5,132,812 $5,444,560 $3,625,238$2,928,945 $6,654,787 $6,230,757
$0 $16,091 $3,577$4,826,632 $101,281 $14,181
$0 $0 $0$0 $0 $0
$112,345 $127,387 $204,259$113,194 $72,407 $28,987

$0 $87 $717$20,246 $0 $0
$3,159 $0 $0$162 $1,076 $83
$344,892 $233,885 $100,318$226 $76,224 $136,401$570 $0 $0
$1,366,633 $1,840,878 $1,090,392$292,046 $291,573 $64,208
$6,780 $0 $0$0 $0 $0$0 $0 $0
$679 $281 $567$0 $0 $4,922
$69,288 $145,691 $39,582$558,899 $377,523 $528,161
$568 $0 $0$2,529,086 $2,550,907 $2,204,529
$18,501 $0 $0$171,242 $94,640 $62,532
$15,592 $6,658 $5,404$3,259 $6,207 $3,344
$31,559 $79,053 $27,727$49,598 $53,334 $35,447
$153,430 $84,882 $53,042$260,831 $146,688 $144,077
$3,285,003 $3,351,566 $3,942,487$158 $817 $63
$0 $0 $0$58,646 $36,387 $2,861$14,076 $8,129 $5,669
$0 $0 $156$0 $0 $32
$10,898 $10,743 $2,180$426 $480 $0
$0 $1,129 $1,362$0 $0 $0
$38,048 $32,451 $1,115,020$0 $0 $0$0 $0 $0$0 $0 $0$0 $0 $0$0 $18,887 $109,680$0 $0 $0
$3,062 $3,131 $10,391$0 $0 $0$0 $0 $0
$145,510 $168,071 $149,125$19,119 $22,432 $17,348
$199,241 $218,154 $227,045$2,830,097 $4,847,629 $4,762,590$6,321,664 $90,664 $19,975
$71,700 $1,487,311 $1,445,153$1,264,743 $3,778,472 $4,533,403$1,595,748 $6,118,630 $6,181,933

$5,746,173 $778,039 $368,820$21,226 $2,556 $814
$0 $4,019 $29,982$6,508,445 $7,487,795 $6,267,471
$0 $684,389 $1,312,312$0 $45,066 $130,229
$580,632,893 $581,885,677 $611,376,168

AGO Hospital Exhibit 2
Inpatient Revenue ($)
Inpatient Margin ($)
Outpatient Revenue ($)
Outpatient Margin ($)
Inpatient Revenue ($)
Inpatient Margin ($)
Outpatient Revenue ($)
Outpatient Margin ($)
Inpatient Revenue ($)
Inpatient Margin ($)
Outpatient Revenue ($)
Outpatient Margin ($)
Inpatient Revenue ($)
Inpatient Margin ($)
Outpatient Revenue ($)
Outpatient Margin ($)
BurnsCardiology Total
InvasiveMedical
Cardiac SurgeryDentalDermatologyEndocinologyGastroenterologyGeneral MedicineGeneral SurgeryGynecologyHematologyInfectious DiseaseNeonatologyNephrologyNeurologyNeurosurgeryNormal NewbornsObstetricsOncologyOphthalmologyOrthopedicsOtolaryngologyPsychiatryPulmonaryRehabRheumatologyTransplant SurgeryTraumaUrologyVascular SurgeryOther InpatientImagingOther TreatmentsLaboratoryAmbulatory SurgeryTherapiesOffice VisitsObservationOther OutpatientGRAND TOTAL
2010
Service Category
Government TotalCommercial All Other
Not Available

Inpatient Revenue ($)
Inpatient Margin ($)
Outpatient Revenue ($)
Outpatient Margin ($)
Burns - - - - Cardiology Total 6,394,602 492,013 3,048,047 238,582
Invasive (Cardiology - Cath & EP - - 1,903,546 (402,424)Medical (Cardio Echo) - - 1,144,502 641,006
Cardiac Surgery 3,346,685 (930,033) - - Dental (Oral Surg) 1,221,761 (758,221) - - Dermatology - - - - Endocinology - - - - Gastroenterology - - 2,601,967 58,156 General Medicine 11,290,642 (233,242) - - General Surgery 15,261,077 (1,684,694) - - Gynecology 1,206,062 (726,860) - - Hematology - - - - Infectious Disease - - - - Neonatology (NICU) 1,306,244 (122,184) - - Nephrology (Renal) 684,839 68,752 - - Neurology 1,952,308 187,882 - - Neurosurgery 1,977,409 (526,831) - - Normal Newborns 626,500 (265,327) - - Obstetrics 2,744,019 (1,707,489) - - Oncology1 2,435,481 69,846 2,825,811 1,082,625 Ophthalmology - - - - Orthopedics 5,680,776 (2,969,761) - - Otolaryngology 1,097,753 (515,945) - - Psychiatry - - - - Pulmonary - - - - Rehab 862,336 (983,413) - - Rheumatology - - - - Transplant Surgery 314,625 8,097 - - Trauma - - - - Urology 990,227 (421,065) - - Vascular Surgery 785,329 (239,102) - - Other Inpatient 236,887 (77,218)Imaging 9,722,627 4,107,336 Other Treatments (IR) 553,974 (13,673)Laboratory 1,553,056 377,294 Ambulatory Surgery 8,684,200 (6,004,972)Therapies (PT/OT/ST) 689,754 (410,083)Office Visits 29,066,380 (25,162,003)Observation 2,818,915 (1,665,147)Other Outpatient2 12,051,559 1,101,000
2011
Service Category
Commercial

GRAND TOTAL 60,415,563 (11,334,796) 73,616,289 (26,290,886)
PEDI NEUROLOGY 297,084 137,539 PEDI ORTHOPEDICS 25,717 3,506 PEDI SURGERY 250,656 37,548 PEDIATRICS 1,802,903 (183,697)PEDI FAMILY MEDICINE 25,651 (3,928)PEDI ENT 5,911 (8,948)Pediatrics Total 2,407,921 (17,980)
Note:1. for outpatient, it is Rad therapy2. Other Outpatient: Neurophys, ER and Other3. Revenue does not include DSTI & Other Supplemental Payments

Inpatient Revenue ($)
Inpatient Margin ($)
Outpatient Revenue ($)
Outpatient Margin ($)
Inpatient Revenue ($)
Inpatient Margin ($)
Outpatient Revenue ($)
- - - - - - - 28,688,991 4,150,740 5,842,333 1,202,284 247,950 (180,250) 61,187
- - 3,323,897 47,609 - - 34,664 - - 2,518,436 1,154,675 - - 26,523 14,077,760 (1,542,381) - - 37,423 (80,276) - 1,853,088 (310,358) - - 89,276 (90,528) - - - - - - - - - - - - - - - - - 4,815,550 (2,232,870) - - 19,793 114,806,193 10,039,607 - - 486,557 (540,537) - 35,497,635 (1,831,242) - - 908,251 (443,355) - 5,242,397 (1,220,298) - - 20,222 (20,742) - - - - - - - - - - - - - - - 6,198,031 (1,498,852) - - - - - 11,184,269 2,656,679 - - 29,970 (25,493) - 9,705,685 979,199 - - 34,269 (17,903) - 8,446,814 (1,137,247) - - 308,122 (462,346) - 5,832,192 1,585,724 - - 9,470 (12,477) - 11,438,115 (11,007,071) - - 76,553 (123,319) - 9,778,699 388,266 7,184,333 170,265 192,245 (64,482) 55,007 12,306 (14,743) - - - - - 16,588,289 (3,633,333) - - 800,739 (714,856) - 3,177,581 (713,372) - - 26,757 (33,648) - - - - - - - - - - - - - - - 3,707,236 (2,339,189) - - 129,928 (21,207) - - - - - - - - 2,273,350 (727,190) - - 45,249 (72,266) - - - - - - - - 4,308,787 81,627 - - 24,660 (16,397) - 6,121,441 353,583 - - 12,242 (31,932) 0 1,536,645 (157,543) 13,770 (36,601)
23,859,880 9,925,455 381,683 1,519,395 (149,643) 7,418 3,484,533 856,717 68,509 19,987,423 (14,082,975) 964,812 2,482,098 (784,628) 159,741 93,387,313 (47,039,512) 1,312,524 11,636,873 (13,084,423) 178,131 38,305,708 127,627 1,199,952
Government All Other

300,475,503 (5,897,394) 212,505,437 (65,091,703) 3,493,652 (2,988,615) 4,408,757
216,788 62,086 42,475 (6,442)
481,112 (38,126) 9,930,698 (2,063,642) 37,616 (23,071) 32,249 (26,673) 43,338 (2,119) 10,746,660 (2,074,916) 37,616 (23,071)

Outpatient Margin ($)
Inpatient Revenue ($)
Inpatient Margin ($)
Outpatient Revenue ($)
Outpatient Margin ($)
- - - - - (85,474) 35,331,544 4,462,503 8,951,567 1,355,392
(90,892) - - 5,262,107 (445,707) 5,418 - - 3,689,461 1,801,099 - 17,461,869 (2,552,690) - - - 3,164,124 (1,159,107) - - - - - - - - - - - - (32,444) - - 7,437,309 (2,207,158) - 126,583,392 9,265,828 - - - 51,666,964 (3,959,290) - - - 6,468,681 (1,967,900) - - - - - - - - - - - - - 7,504,275 (1,621,036) - - - 11,899,078 2,699,938 - - - 11,692,262 1,149,178 - - - 10,732,345 (2,126,424) - - - 6,468,162 1,307,920 - - - 14,258,688 (12,837,879) - - (38,582) 12,406,425 393,630 10,065,151 1,214,308 - 12,306 (14,743) - - - 23,069,804 (7,317,950) - - - 4,302,091 (1,262,966) - - - - - - - - - - - - - 4,699,499 (3,343,809) - - - - - - - - 2,633,223 (791,359) - - - - - - - - 5,323,674 (355,835) - -
0 6,919,012 82,548 - - 1,787,302 (271,362)
(66,638) 11,623,705 13,966,152 (3,831) #REF! (167,146) (35,759) 5,106,097 1,198,252 (2,508,761) 29,636,435 (22,596,708) (103,585) 3,331,592 (1,298,296) (1,950,589) 123,766,217 (74,152,104) (202,177) 14,633,919 (14,951,747) (255,508) 51,557,218 973,119
Total

(5,283,348) 364,384,718 (20,220,805) 290,530,483 (96,665,936)
513,871 199,625 68,192 (2,936) 731,768 (578) 11,771,217 (2,270,410) 57,900 (30,601) 49,248 (11,067) 13,192,197 (2,115,966)

Inpatient Revenue ($)
Inpatient Margin ($)
Outpatient Revenue ($)
Outpatient Margin ($)
Burns - - - - Cardiology Total 4,920,691 565,454 3,486,500 147,541
Invasive (Cardiology - Cath & EP - - 2,248,207 (438,104)Medical (Cardio Echo) - - 1,238,293 585,645
Cardiac Surgery 4,319,029 (854,834) - - Dental (Oral Surg) 1,304,630 (774,392) - - Dermatology - - - - Endocinology - - - - Gastroenterology - - 2,814,221 150,084 General Medicine 12,359,995 2,129,429 - - General Surgery 14,101,097 (1,097,813) - - Gynecology 1,237,583 (807,969) - - Hematology - - - - Infectious Disease - - - - Neonatology (NICU) 1,282,980 (510,012) - - Nephrology (Renal) 900,209 95,617 - - Neurology 2,133,447 138,948 - - Neurosurgery 3,568,677 (1,124,101) - - Normal Newborns 500,713 (214,760) - - Obstetrics 3,018,406 (1,983,019) - - Oncology1 2,281,343 480,875 2,516,756 1,231,455 Ophthalmology - - - - Orthopedics 4,713,523 (2,225,001) - - Otolaryngology 1,413,190 (396,259) - - Psychiatry - - - - Pulmonary - - - - Rehab 781,455 (982,662) - - Rheumatology - - - - Transplant Surgery 373,923 (53,831) - - Trauma - - - - Urology 939,906 (228,210) - - Vascular Surgery 951,801 (159,937) - - Other Inpatient 381,890 (163,916)Imaging 9,527,657 4,154,011 Other Treatments (IR) 742,179 (84,672)Laboratory 1,371,627 195,551 Ambulatory Surgery 8,259,076 (5,734,229)Therapies (PT/OT/ST) 918,157 (329,366)Office Visits 29,072,156 (26,597,478)Observation 3,118,689 (2,067,505)Other Outpatient2 12,126,138 1,001,034
2012
Service Category
Commercial
GRAND TOTAL 61,484,488 (8,166,393) 73,953,156 (27,933,575)
PEDI ENT 52,301 29,691 PEDI NEUROLOGY 196,537 112,084 PEDI SURGERY 127,941 (8,435)PEDIATRICS 1,835,507 (23,808)PEDI FAMILY MEDICINE 14,344 (1,478)PEDI ORTHOPEDICS 45,129 (62,437)Pediatrics Total 2,271,760 45,617
Note:1. for outpatient, it is Rad therapy2. Other Outpatient: Neurophys, ER and Other
3. Revenue does not include DSTI & Other Supplemental Payments
Inpatient Revenue ($)
Inpatient Margin ($)
Outpatient Revenue ($)
Outpatient Margin ($)
Inpatient Revenue ($)
Inpatient Margin ($)
Outpatient Revenue ($)
- - - - - - - 31,318,078 6,298,412 7,332,358 966,886 221,854 (164,117) 60,820
- - 4,137,471 (106,782) - - 38,096 - - 3,194,886 1,073,668 - - 22,724 14,395,819 (619,377) - - 86,316 (251,238) - 1,807,863 (631,961) - - 75,460 (131,425) - - - - - - - - - - - - - - - - - 5,386,338 (1,991,288) - - 22,139 102,275,746 12,029,146 - - 717,173 (411,803) - 33,919,909 (1,337,043) - - 1,337,514 (647,994) - 4,836,297 (933,114) - - 28,302 658 - - - - - - - - - - - - - - - 7,169,163 (1,571,720) - - 1,376 (4,471) - 14,192,244 2,526,752 - - 16,686 (8,270) - 11,414,409 1,221,719 - - 48,175 (30,987) - 7,656,026 (1,527,967) - - 203,869 (363,331) - 4,524,515 348,334 - - 45,308 (9,057) - 11,297,373 (12,714,651) - - 99,204 (128,705) - 11,085,994 1,531,697 8,988,211 2,751,851 8,343 (19,054) 19,113 5,844 (7,530) - - - 12,762,139 (952,044) - - 1,062,588 (887,933) - 4,963,759 (620,649) - - 16,509 (27,004) - - - - - - - - - - - - - - - 2,159,575 (2,359,932) - - 13,848 (65,473) - - - - - - - - 1,457,065 (414,403) - - 67,453 (27,681) - - - - - - - - 4,421,461 247,786 - - 22,913 1,142 - 6,024,733 299,282 - - 8,343 179 0 1,091,861 (138,591) 0 6,001
25,298,145 11,350,150 300,832 2,490,610 (105,505) 35,251 3,346,460 572,605 81,111 22,500,250 (15,194,208) 1,012,337 2,629,081 (1,155,862) 100,671 97,687,515 (55,143,862) 1,144,911 14,072,877 (15,099,379) 244,715 41,427,544 750,583 1,282,904
Government All Other

288,779,874 674,147 231,159,390 (72,298,028) 4,081,233 (3,170,563) 4,304,804
19,271 (8,216) - - 133,894 36,473 4,026 2,441
418,542 (78,857) - (25,467) 7,963,085 (3,935,208) 67,920 (58,248) 44,061 (10,486) 35,359 (14,489) 8,614,212 (4,010,784) 71,946 (81,274)

Outpatient Margin ($)
Inpatient Revenue ($)
Inpatient Margin ($)
Outpatient Revenue ($)
Outpatient Margin ($)
- - - - - (161,637) 36,460,623 6,699,749 10,879,678 952,790
(144,879) - - 6,423,775 (689,766) (16,758) - - 4,455,903 1,642,556 - 18,801,163 (1,725,448) - - - 3,187,952 (1,537,778) - - - - - - - - - - - - (34,888) - - 8,222,698 (1,876,092) - 115,352,914 13,746,772 - - - 49,358,519 (3,082,850) - - - 6,102,182 (1,740,426) - - - - - - - - - - - - - 8,453,519 (2,086,203) - - - 15,109,140 2,614,099 - - - 13,596,031 1,329,679 - - - 11,428,572 (3,015,398) - - - 5,070,536 124,517 - - - 14,414,983 (14,826,375) - - (22,336) 13,375,681 1,993,519 11,524,080 3,960,969 - 5,844 (7,530) - - - 18,538,251 (4,064,979) - - - 6,393,458 (1,043,912) - - - - - - - - - - - - - 2,954,879 (3,408,066) - - - - - - - - 1,898,442 (495,915) - - - - - - - - 5,384,280 20,718 - -
0 6,984,877 139,524 - - 1,473,751 (296,506)
(123,381) 35,126,634 15,380,780 (15,705) 3,268,040 (205,882) (54,215) 4,799,198 713,941 (2,441,433) 31,771,662 (23,369,870) (124,264) 3,647,910 (1,609,491) (2,141,989) 127,904,583 (83,883,328) (557,957) 17,436,281 (17,724,842) (929,698) 54,836,586 821,919
Total

(6,607,502) 354,345,595 (10,662,808) 309,417,349 (106,839,105)
71,572 21,475 334,457 150,998 546,484 (112,760) 9,866,512 (4,017,264) 58,405 (11,963) 80,488 (76,926) 10,957,918 (4,046,440)
Inpatient Revenue ($)
Inpatient Margin ($)
Outpatient Revenue ($)
Outpatient Margin ($)
Inpatient Revenue ($)
Inpatient Margin ($)
Outpatient Revenue ($)
Outpatient Margin ($)
Inpatient Revenue ($)
Inpatient Margin ($)
Outpatient Revenue ($)
Outpatient Margin ($)
Inpatient Revenue ($)
Inpatient Margin ($)
Outpatient Revenue ($)
Outpatient Margin ($)
Burns - - - - - - - - - - - - - - - - Cardiology Total 6,419,235 1,354,660 3,915,443 861,461 31,001,360 5,288,016 8,370,352 1,863,710 270,035 (276,904) 42,499 (180,129) 37,690,630 6,365,772 12,328,294 2,545,042
Invasive (Cardiology - Cath & EP - - 2,761,908 376,474 - - 4,614,725 684,724 - - 22,433 (160,170) - - 7,399,067 901,027 Medical (Cardio Echo) - - 1,153,535 484,987 - - 3,755,627 1,178,986 - - 20,065 (19,959) - - 4,929,228 1,644,015
Cardiac Surgery 4,122,925 (464,735) - - 15,144,556 (2,484,697) - - 98,346 (481,282) - - 19,365,826 (3,430,714) - - Dental (Oral Surg) 2,405,143 (790,415) - - 1,890,350 (448,484) - - 45,699 (74,289) - - 4,341,192 (1,313,188) - - Dermatology - - - - - - - - - - - - - - - - Endocinology - - - - - - - - - - - - - - - - Gastroenterology - - 3,179,950 189,875 - - 6,656,708 (1,736,241) - - 34,197 (65,410) - - 9,870,856 (1,611,777)General Medicine 9,108,791 544,331 - - 98,312,975 7,071,771 - - 719,509 (1,208,642) - - 108,141,275 6,407,460 - - General Surgery 12,293,516 (2,840,749) - - 34,642,210 (3,548,221) - - 1,019,377 (857,736) - - 47,955,104 (7,246,706) - - Gynecology 1,172,434 (649,767) - - 4,679,550 (1,088,725) - - 15,403 (42,364) - - 5,867,387 (1,780,856) - - Hematology - - - - - - - - - - - - - - - - Infectious Disease - - - - - - - - - - - - - - - - Neonatology (NICU) 1,523,582 (471,791) - - 7,521,721 (4,976,064) - - - (37,101) - - 9,045,303 (5,484,956) - - Nephrology (Renal) 996,654 254,483 - - 13,655,109 1,432,310 - - 58,393 (203,142) - - 14,710,156 1,483,651 - - Neurology 2,415,307 363,258 - - 8,944,227 (159,711) - - 83,498 (90,413) - - 11,443,032 113,134 - - Neurosurgery 3,434,250 (1,064,797) - - 10,095,131 (2,652,330) - - 383,861 (835,857) - - 13,913,242 (4,552,984) - - Normal Newborns 557,918 (351,843) - - 5,787,529 (51,720) - - 57,051 (51,344) - - 6,402,498 (454,907) - - Obstetrics 3,248,852 (1,108,234) - - 11,974,323 (9,344,642) - - 96,135 (54,734) - - 15,319,310 (10,507,610) - - Oncology1 1,745,311 298,408 2,164,886 976,675 11,357,013 1,635,389 10,123,166 3,962,770 53,257 (40,568) 91,584 (94,716) 13,155,581 1,893,228 12,379,635 4,844,729 Ophthalmology - - - - - - - - - - - - - - - - Orthopedics 4,244,690 (1,760,292) - - 19,736,984 (472,117) - - 1,698,822 (718,126) - - 25,680,496 (2,950,534) - - Otolaryngology 2,173,789 (203,023) - - 4,063,898 (670,582) - - 17,529 (15,739) - - 6,255,216 (889,344) - - Psychiatry - - - - - - - - - - - - - - - - Pulmonary - - - - - - - - - - - - - - - - Rehab - - - - - - - - - - - - - - - - Rheumatology - - - - - - - - - - - - - - - - Transplant Surgery 575,695 (23,281) - - 3,343,226 (527,421) - - 4,658 (28,196) - - 3,923,580 (578,898) - - Trauma - - - - - - - - - - - - - - - - Urology 1,149,930 (221,003) - - 4,542,089 283,984 - - 13,480 (17,287) - - 5,705,499 45,694 - - Vascular Surgery 630,956 (6,014) - - 6,912,193 26,147 - - 7,832 (17,940) 7,550,981 2,193 - - Other Inpatient 353,559 (83,621) 1,267,214 (105,244) 1 0 1,620,774 (188,864)Imaging 9,163,527 4,062,678 30,185,397 14,814,140 404,339 (125,837) 39,753,264 18,750,981 Other Treatments (IR) 792,122 (97,453) 2,739,818 (568,971) 8,401 (27,850) 3,540,340 (694,274)Laboratory 1,395,520 238,969 3,699,601 654,215 52,771 (37,601) 5,147,892 855,583 Ambulatory Surgery 7,617,368 (4,269,995) 23,833,462 (13,859,930) 1,098,136 (2,490,219) 32,548,966 (20,620,144)Therapies (PT/OT/ST) 839,376 (151,982) 3,140,285 (93,270) 124,505 (124,786) 4,104,165 (370,039)Office Visits 27,751,560 (27,607,859) 102,296,292 (57,166,891) 1,102,992 (2,064,552) 131,150,844 (86,839,302)Observation 3,169,841 (1,965,218) 14,856,111 (14,107,993) 156,465 (690,587) 18,182,417 (16,763,798)Other Outpatient2 11,755,600 53,056 44,579,783 (1,283,665) 1,048,432 (1,776,924) 57,383,815 (3,007,533)GRAND TOTAL 58,572,536 (7,224,426) 71,745,194 (27,709,793) 294,871,658 (10,792,340) 250,480,976 (67,522,127) 4,642,887 (5,051,663) 4,164,320 (7,678,611) 358,087,082 (23,068,429) 326,390,490 (102,910,531)
PEDI ORTHOPEDICS - - 30,157 9,308 - - PEDI NEUROLOGY 216,190 57,631 128,975 16,076 21,289 7,546 366,454 81,253 PEDI FAMILY MEDICINE 20,997 (3,086) 56,995 571 - - 77,992 (2,515)PEDIATRICS 1,757,777 (366,281) 8,999,893 (3,942,541) 27,521 (75,931) 10,785,191 (4,384,753)PEDI SURGERY 165,805 (88,346) 516,300 (196,192) - - 682,105 (284,538)PEDI ENT 7,608 (8,723) 63,498 11,498 - - 71,106 2,775 Pediatrics Total 2,168,376 (408,805) 9,795,818 (4,101,280) 48,810 (68,385) 12,013,004 (4,578,470)
Note:
1. for outpatient, it is Rad therapy2. Other Outpatient: Neurophys, ER and Other3. Revenue does not include DSTI & Other Supplemental Payments
2013
Service Category
Commercial Government All Other Total