Embed Size (px)
DESCRIPTION
Exhibit 1. “ Medicare Extra” Benefits vs. Current Medicare Benefits. * See http://www.cms.hhs.gov/apps/media/press/factsheet.asp?Counter=2488 . - PowerPoint PPT Presentation
Citation preview
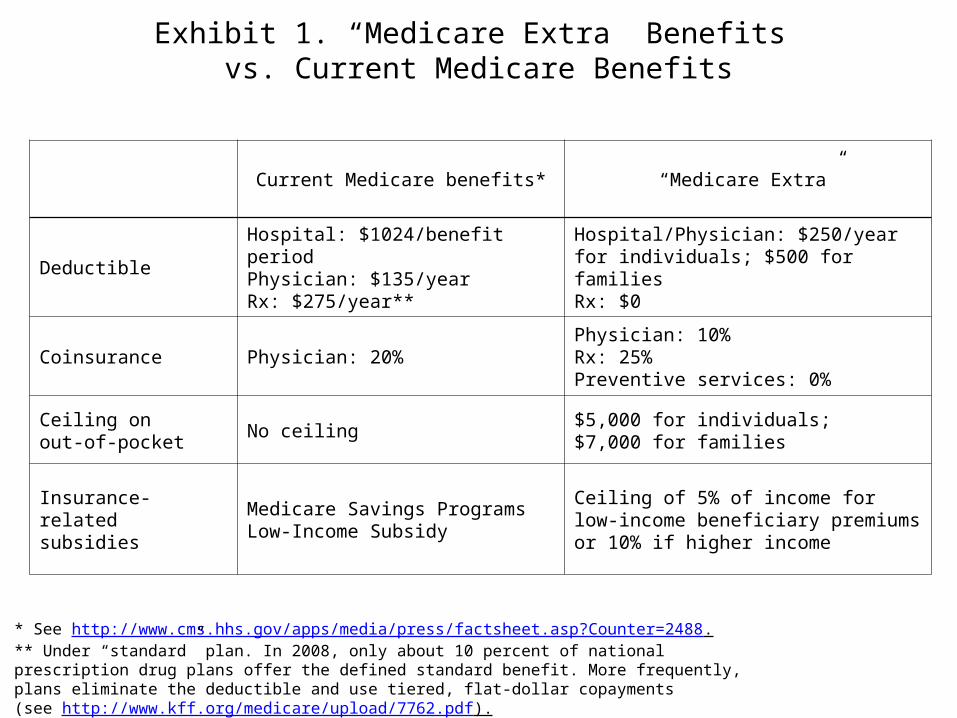
Exhibit 1. “Medicare Extra” Benefits vs. Current Medicare Benefits
Current Medicare benefits* “Medicare Extra”
DeductibleHospital: $1024/benefit periodPhysician: $135/yearRx: $275/year**
Hospital/Physician: $250/year for individuals; $500 for familiesRx: $0
Coinsurance Physician: 20%Physician: 10%Rx: 25%Preventive services: 0%
Ceiling onout-of-pocket
No ceiling$5,000 for individuals;$7,000 for families
Insurance-related subsidies
Medicare Savings ProgramsLow-Income Subsidy
Ceiling of 5% of income forlow-income beneficiary premiums or 10% if higher income
* See http://www.cms.hhs.gov/apps/media/press/factsheet.asp?Counter=2488.** Under “standard” plan. In 2008, only about 10 percent of national prescription drug plans offer the defined standard benefit. More frequently, plans eliminate the deductible and use tiered, flat-dollar copayments(see http://www.kff.org/medicare/upload/7762.pdf).
New Coverage for 44 Million Uninsured in 2008
National Insurance Connector TOTAL =
60m
MedicareTOTAL =
43m
11m 22m
Medicaid/SCHIP
TOTAL = 42m
10m 1m
Improved or More Affordable Coverage for 49 Million Insured
2m 2m7m 38m
Exhibit 2. Building Blocks for Automaticand Affordable Health Insurance for All
Employer Group Coverage
TOTAL = 142m
Source: Based on analysis in C. Schoen, K. Davis, and S. R. Collins, “Building Blocks for Reform: Achieving Universal Coverage with Private and Public Group Health Insurance,” Health Affairs, May 13, 2008 27(3):646–57, from Lewin Group modeling estimates.
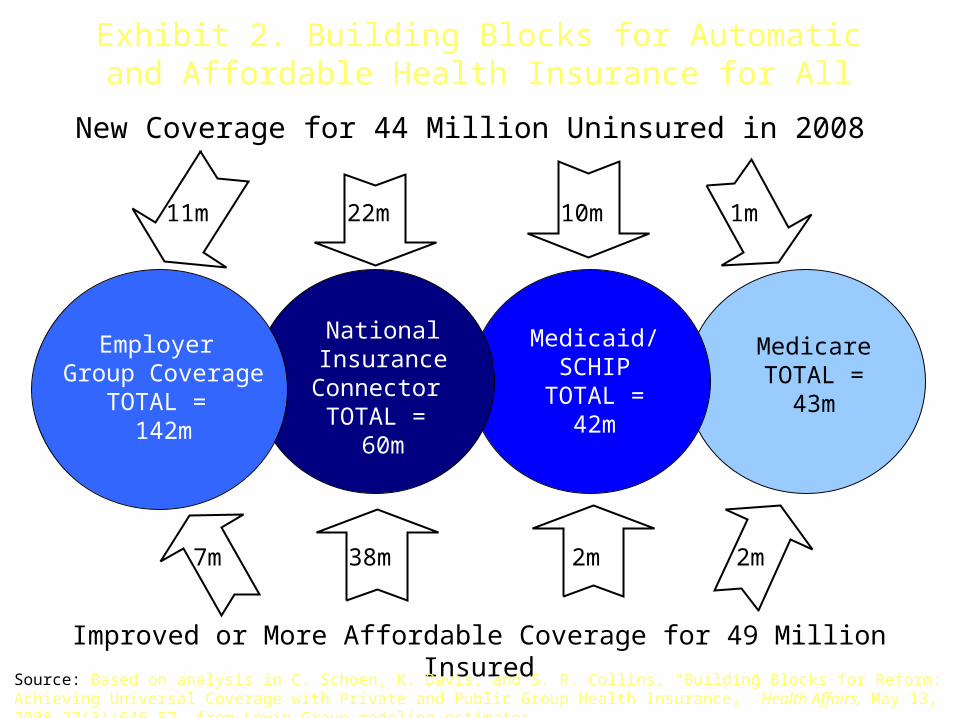
Exhibit 3. Distribution of People by Primary Source of CoverageUnder Current Law and Building Blocks Framework, 2008
Uninsured48.3
(16%)Employer
157.9(53%)
Uninsured3.7
(1%)
Employer141.5(48%)
Current Law (millions) Building Blocks (millions)
Medicaid/SCHIP37.8
(13%)
Medicare40.3
(14%)
Other13.5(4%)
Medicaid/SCHIP42.1
(14%)
Medicare43.0
(16%)
Other7.3
(2%)
Total population = 297.8 million
New National Connector
60.3(20%)
Source: Based on analysis in C. Schoen, K. Davis, and S. R. Collins, “Building Blocks for Reform: Achieving Universal Coverage with Private and Public Group Health Insurance,” Health Affairs, May 13, 2008 27(3):646–57, from Lewin Group modeling estimates.
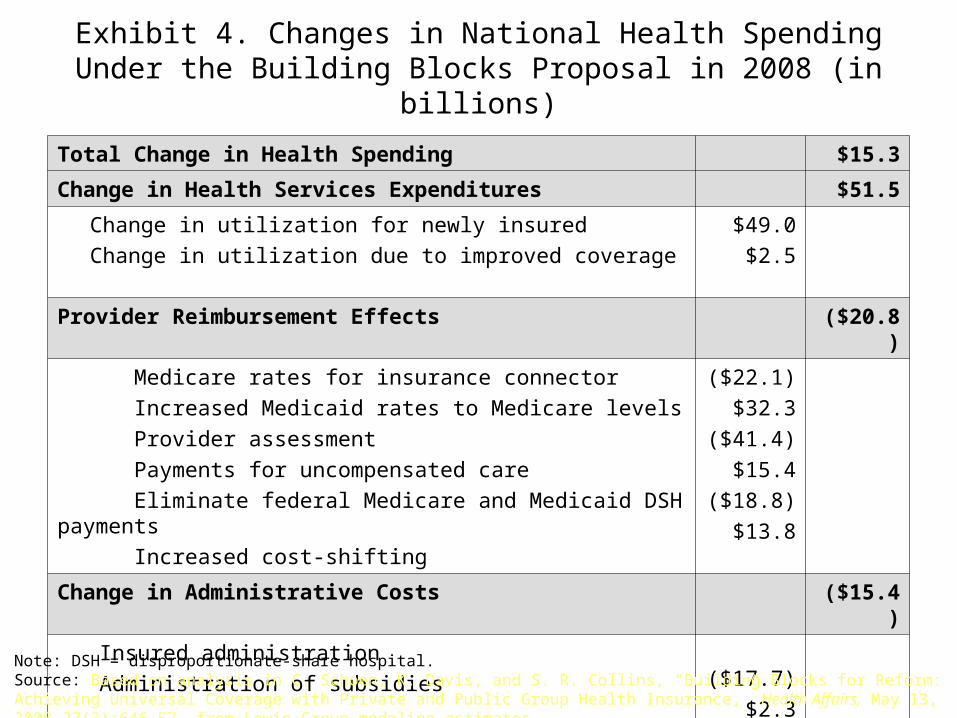
Exhibit 4. Changes in National Health SpendingUnder the Building Blocks Proposal in 2008 (in billions)
Total Change in Health Spending $15.3
Change in Health Services Expenditures $51.5
Change in utilization for newly insured
Change in utilization due to improved coverage
$49.0
$2.5
Provider Reimbursement Effects ($20.8)
Medicare rates for insurance connector
Increased Medicaid rates to Medicare levels
Provider assessment
Payments for uncompensated care
Eliminate federal Medicare and Medicaid DSH payments
Increased cost-shifting
($22.1)
$32.3
($41.4)
$15.4
($18.8)
$13.8
Change in Administrative Costs ($15.4)
Insured administration
Administration of subsidies
($17.7)
$2.3
Note: DSH = disproportionate-share hospital.Source: Based on analysis in C. Schoen, K. Davis, and S. R. Collins, “Building Blocks for Reform: Achieving Universal Coverage with Private and Public Group Health Insurance,” Health Affairs, May 13, 2008 27(3):646–57, from Lewin Group modeling estimates.
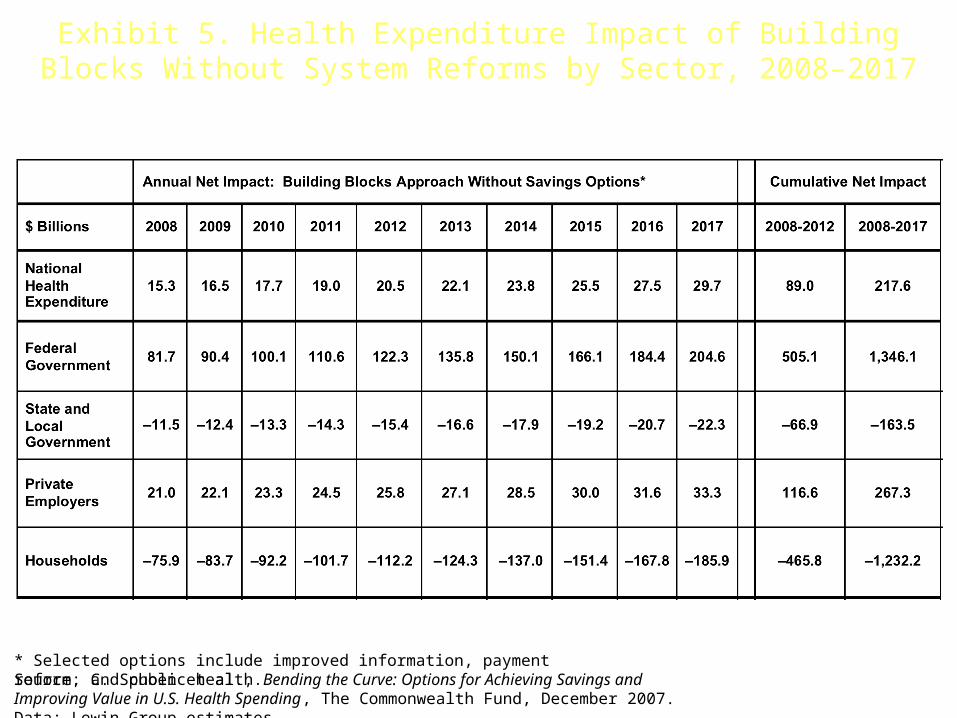
Exhibit 5. Health Expenditure Impact of Building Blocks Without System Reforms by Sector, 2008–2017
Source: C. Schoen et al., Bending the Curve: Options for Achieving Savings and Improving Value in U.S. Health Spending, The Commonwealth Fund, December 2007. Data: Lewin Group estimates.
* Selected options include improved information, payment reform, and public health.
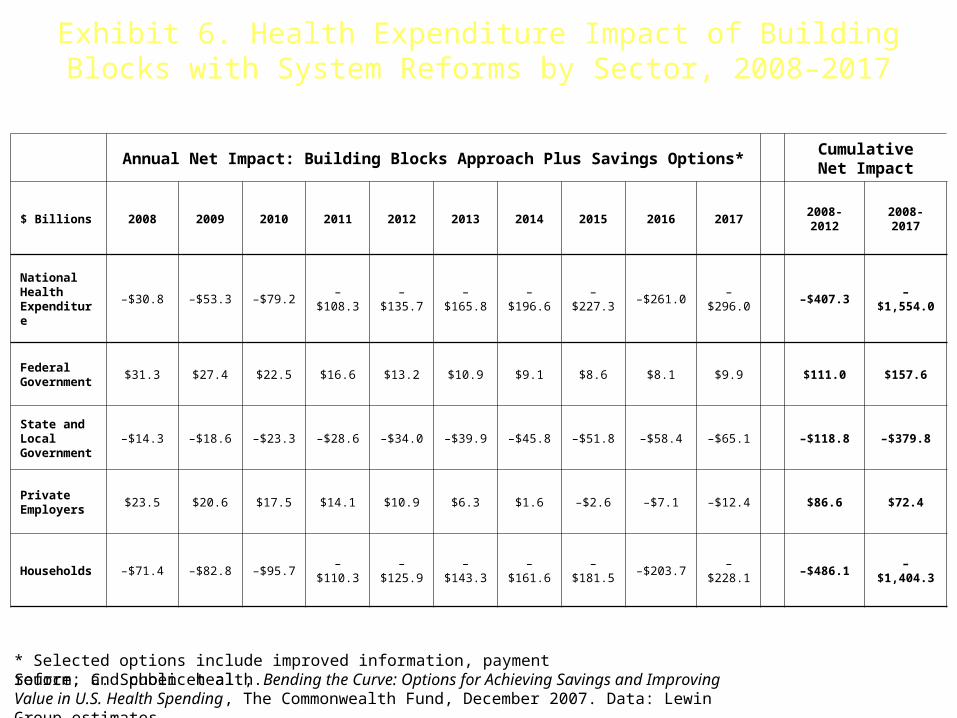
Exhibit 6. Health Expenditure Impact of Building Blocks with System Reforms by Sector, 2008–2017
Annual Net Impact: Building Blocks Approach Plus Savings Options*CumulativeNet Impact
$ Billions 2008 2009 2010 2011 2012 2013 2014 2015 2016 20172008-2012
2008-2017
National Health Expenditure
–$30.8 –$53.3 –$79.2 –$108.3 –$135.7 –$165.8 –$196.6 –$227.3 –$261.0 –$296.0 –$407.3 –$1,554.0
Federal Government
$31.3 $27.4 $22.5 $16.6 $13.2 $10.9 $9.1 $8.6 $8.1 $9.9 $111.0 $157.6
State and Local Government
–$14.3 –$18.6 –$23.3 –$28.6 –$34.0 –$39.9 –$45.8 –$51.8 –$58.4 –$65.1 –$118.8 –$379.8
Private Employers
$23.5 $20.6 $17.5 $14.1 $10.9 $6.3 $1.6 –$2.6 –$7.1 –$12.4 $86.6 $72.4
Households –$71.4 –$82.8 –$95.7 –$110.3 –$125.9 –$143.3 –$161.6 –$181.5 –$203.7 –$228.1 –$486.1 –$1,404.3
Source: C. Schoen et al., Bending the Curve: Options for Achieving Savings and Improving Value in U.S. Health Spending, The Commonwealth Fund, December 2007. Data: Lewin Group estimates.
* Selected options include improved information, payment reform, and public health.
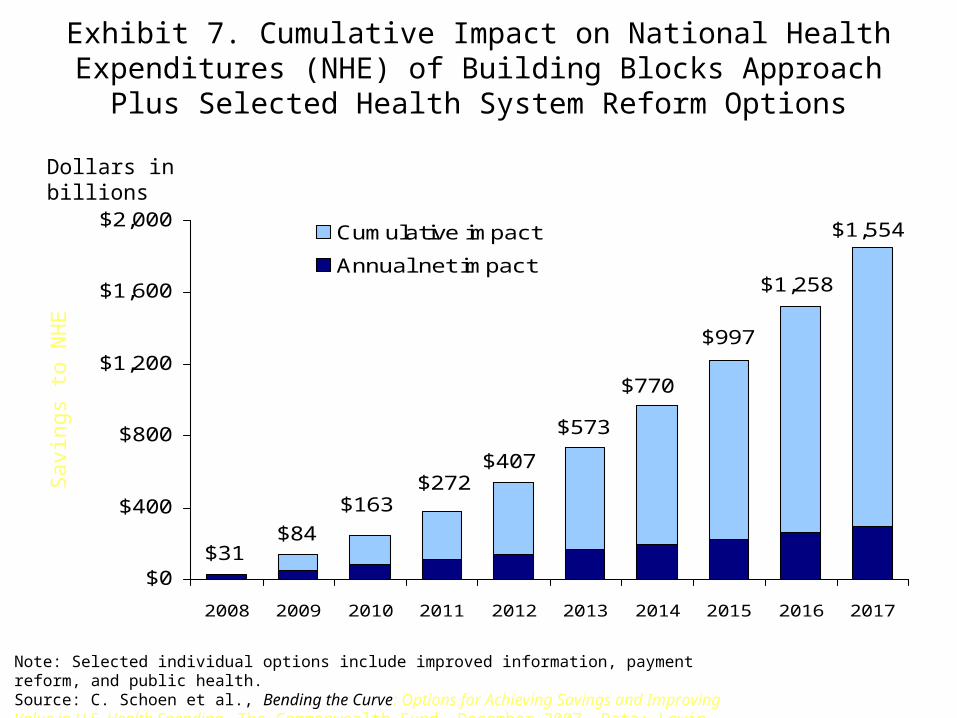
Exhibit 7. Cumulative Impact on National HealthExpenditures (NHE) of Building Blocks Approach
Plus Selected Health System Reform Options
$31
$1,554
$1,258
$997
$770
$573
$407
$84
$163$272
$0
$400
$800
$1,200
$1,600
$2,000
2008 2009 2010 2011 2012 2013 2014 2015 2016 2017
Cumulative impact
Annual net impact
Dollars in billions
Note: Selected individual options include improved information, payment reform, and public health.Source: C. Schoen et al., Bending the Curve: Options for Achieving Savings and Improving Value in U.S. Health Spending, The Commonwealth Fund, December 2007. Data: Lewin Group estimates.
Savin
gs
to N
HE
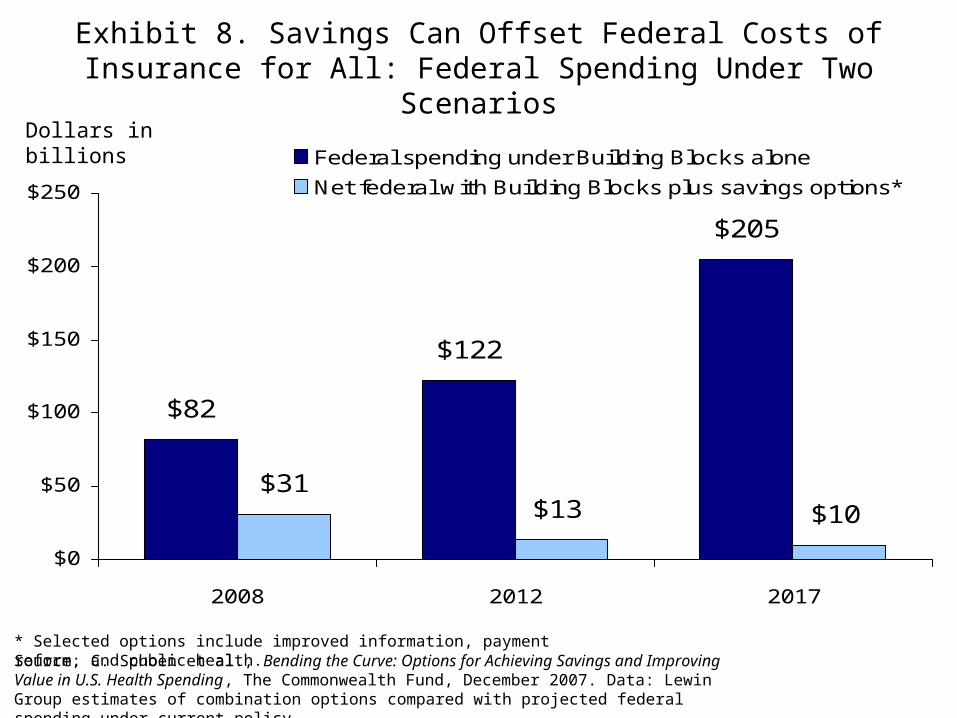
Exhibit 8. Savings Can Offset Federal Costs of Insurance for All: Federal Spending Under Two Scenarios
$82
$122
$205
$10$13$31
$0
$50
$100
$150
$200
$250
2008 2012 2017
Federal spending under Building Blocks alone
Net federal with Building Blocks plus savings options*
Dollars in billions
* Selected options include improved information, payment reform, and public health.Source: C. Schoen et al., Bending the Curve: Options for Achieving Savings and Improving Value in U.S. Health Spending, The Commonwealth Fund, December 2007. Data: Lewin Group estimates of combination options compared with projected federal spending under current policy.
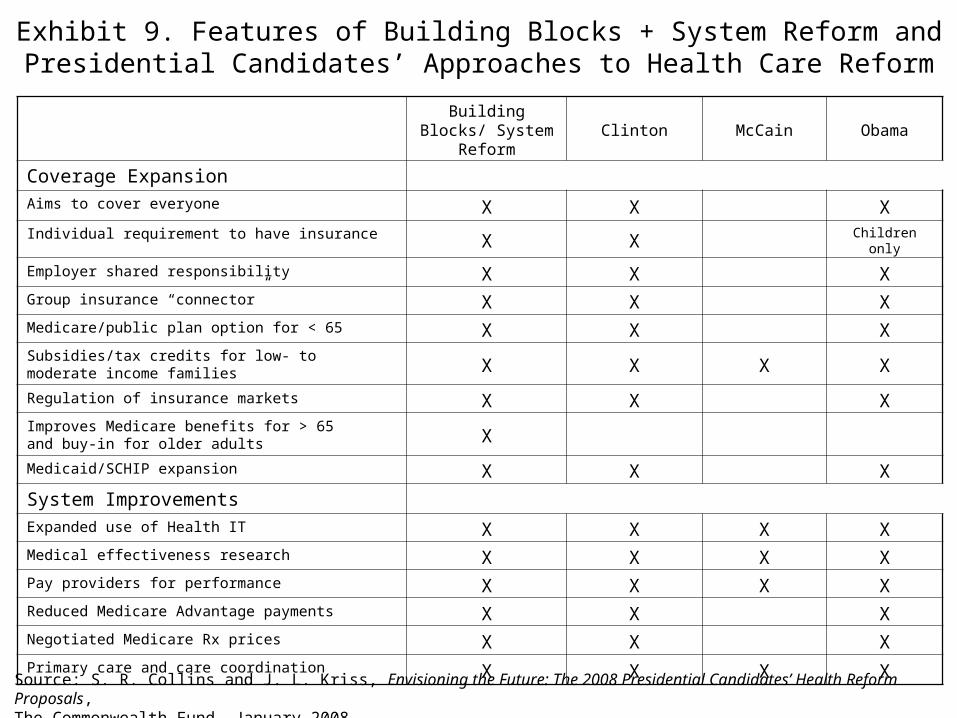
Exhibit 9. Features of Building Blocks + System Reform and Presidential Candidates’ Approaches to Health Care Reform
Building Blocks/ System Reform
Clinton McCain Obama
Coverage ExpansionAims to cover everyone X X XIndividual requirement to have insurance X X Children only
Employer shared responsibility X X XGroup insurance “connector” X X XMedicare/public plan option for < 65 X X XSubsidies/tax credits for low- tomoderate income families X X X X
Regulation of insurance markets X X XImproves Medicare benefits for > 65and buy-in for older adults X
Medicaid/SCHIP expansion X X X
System ImprovementsExpanded use of Health IT X X X XMedical effectiveness research X X X XPay providers for performance X X X XReduced Medicare Advantage payments X X XNegotiated Medicare Rx prices X X XPrimary care and care coordination X X X X
Source: S. R. Collins and J. L. Kriss, Envisioning the Future: The 2008 Presidential Candidates’ Health Reform Proposals,The Commonwealth Fund, January 2008.
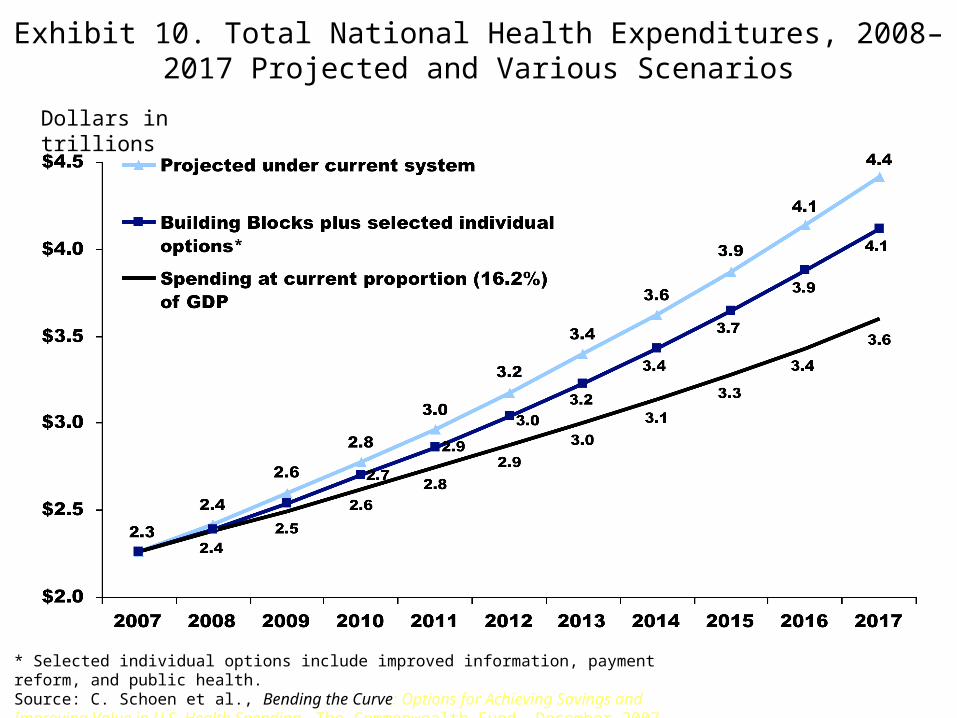
Exhibit 10. Total National Health Expenditures, 2008–2017 Projected and Various Scenarios
* Selected individual options include improved information, payment reform, and public health.Source: C. Schoen et al., Bending the Curve: Options for Achieving Savings and Improving Value in U.S. Health Spending, The Commonwealth Fund, December 2007. Data: Lewin Group estimates.
Dollars in trillions