Embed Size (px)
Citation preview

www.teachingresources.grantadesign.com
M.F. Ashby 2014
1 www.teachingresources.grantadesign.com
© M. F. Ashby, 2017 For reproduction guidance, see back page
Professor Mike Ashby
Department of Engineering
University of Cambridge
This case study document is part of a set based on Mike Ashby’s books to help introduce students to materials, processes and rational selection. The Teaching Resources website aims to support teaching of materials-related courses in Design, Engineering and Science. Resources come in various formats and are aimed primarily at undergraduate education.
www.teachingresources.grantadesign.com
Exercises with worked solutions
The Eco Audit Tool
- To accompany Lecture Unit 12
Exercises with Worked Solutions – The Eco Audit Tool
www.teachingresources.grantadesign.com M.F. Ashby 2017
2
Exercises with Worked Solutions This collection of exercises and solutions has been put together to help you as an instructor choose or develop your own exercises for your students. You may simply want to browse through them for inspiration, or you may use them with your class. We are providing these in Word format so that you may pick and choose the questions you find suitable for your course this year. We have also included variations on a theme so that you can set different questions for different classes. Most of the questions come from or are inspired by the exercises in the following books by Professor Mike Ashby of the University of Cambridge Engineering Department, co-founder of Granta Design.
• Materials and Sustainable Development by Michael F. Ashby (ISBN-13: 978-0081001769)
• Materials and the Environment by Michael F. Ashby (ISBN-13: 978-0-12-385971-6)
• Materials Selection for Mechanical Design by Michael F. Ashby (ISBN-13: 978-1-85617-663-7)
• Materials: Engineering, Science, Processing and Design by Michael F. Ashby, Hugh Shercliff, and David Cebon (ISBN-13: 978-0-08-097773-7)
(Reproduction and copyright information can be found on the last page. Please make sure to credit Professor Mike Ashby and Granta Design if you use these questions.) Most of the questions require the use of CES EduPack. CES EduPack is a materials teaching resource used at 1000+ Universities and Colleges worldwide. You can find out all about it at: www.grantadesign.com/education. The topic areas of the available Exercises are1:
Title Associated Lecture Unit
Materials: Classification and Properties Lecture Units 1-2
The Elements Lecture Unit 3
Material Selection: Translation, Screening, Ranking Lecture Units 6-7
Manufacturing Processes: Classification and Cost Lecture Units 10-11
Eco Properties and Eco Design Lecture Unit: “Eco-informed material selection”
The Eco Audit Tool Lecture Unit 12
Energy: Power Systems and Storage Lecture Unit: “Materials for low carbon power”
Materials and Sustainable Development Lecture Unit: “What is a Sustainable development”
Bioengineering Lecture Unit: “Materials for bioengineering”
The Products, Materials and Processes database
Lecture Unit: the PMP database
You can find the other units here: www.teachingresources.grantadesign.com If there are suggestions, or if you have questions please contact Teaching Resources Team at [email protected].
1 Exercise units follow the same numbering of the PowerPoint lectures for the same topic
Exercises with Worked Solutions – The Eco Audit Tool
www.teachingresources.grantadesign.com M.F. Ashby 2017
3
Contents
Eco Data in the CES EduPack ............................................................................................ 3
Data Sources and Accuracy ............................................................................................. 4 Life-Cycle Thinking – Energy and CO2 .............................................................................. 5 End-of-Life Treatment ....................................................................................................... 11 Eco Audits - Product Case Studies ................................................................................. 12
Please note: Most of the questions in this unit are based on questions in the books mentioned on the previous page, but whereas the books generally do not require the use of the CES EduPack these have been adapted to fully take advantage of the features the software provides and so that you do not need the books. If you would like to see questions on this topic that don’t need the CES EduPack, but may need the books, please download the solution manuals to the books that are also available in Granta’s Teaching Resource Website.
Eco Data in the CES EduPack
Remember:
• Use CES EduPack Level 2 unless otherwise directed.
• The Science Notes contain the definitions of properties and they can be found by clicking on material property headings or by searching for the term in the CES Help Menu.
• You can display mean values for the properties on the charts and in the records by clicking the tick box in the numbers tab of the Settings dialog box.
• Many concepts can be elucidated by using the index and search functions provided by CES Help, found in the help menu.
• Video tutorials can be accessed by clicking Help > Video Tutorials.
1. What is meant by embodied energy per kilogram of a metal? Why does it differ from the
free energy of formation of the oxide, carbonate or sulfide from which it was extracted?
Answer.
The embodied energy of a metal is the energy required to make 1 kg of the material from
its ores or feedstocks. Energy is consumed in mining or extracting the ores and feedstock,
concentrating the ore and reducing it to metal, all with energy losses. To convert an oxide,
sulfide, or carbonate ore to metal, the free energy of formation of those compounds must,
of course, be provided. The embodied energy includes this, but it also includes the energy
to mine, transport and concentrate the ore, and the energy “loss” that results from the
inefficiencies of the processes.
2. What is meant by the process energy per kilogram for casting a metal? Why does it
differ from the latent heat of melting of the metal?

Exercises with Worked Solutions – The Eco Audit Tool
www.teachingresources.grantadesign.com M.F. Ashby 2017
4
Answer.
In order to cast a metal, energy must be provided to heat
the metal to its melting point, to melt it (requiring the latent
heat of melting) and to raise the temperature of the liquid
a little higher to ensure that, when cast, it does not solidify
before it has filled the mold. The kiln itself has to be heated
to the same temperature, requiring additional energy. The
heat itself is provided by the combustion of fossil fuel
(efficiency about 70%) or by electric heating (oil-equivalent efficiency about 40%). The
thermal energy of both kiln and metal is lost as low-grade heat when the casting cools to
room temperature. The casting energy is the sum of all the energies involved.
Data Sources and Accuracy
3. Where does the data on the embodied energy of a material come from?
In the Help menu of CES EduPack, click Help. In the search function on the left-hand side
type “Eco Audit Tool”, and from the results click on “Source of environmental data”. List the
top three references under the heading “Material production: embodied energy and CO2,
engineering materials”.
Answer.
• Alcorn A., Victoria University of Wellington, Centre for Building Performance Research,
New Zealand (2003) Embodied Energy and CO2 Coefficients for New Zealand Building
Materials [http://www.victoria.ac.nz/cbpr/]
• Axion Polymers (2009) Material Information Data Book
[http://www.axionrecycling.com/userfiles/file/Material Info Data Book High Res.pdf]
• AggRegain, (2007), The Waste and Resources Action Program (WRAP),
[http://www.wrap.org.uk] ISBN 1-84405-268-0 (Data and an Excel-based tool to
calculate energy and carbon footprint of recycled road-bed materials)
• (The next two are invalid links to be updated)
4. How precise is the embodied energy data…
Find the notes on this topic in the CES Help Menu, by the path Home > Tools > Eco Audit
tool > Eco audit tool reference section > Precision of environmental data. Review the graph
of reported values of embodied energy for Aluminum.
Exercises with Worked Solutions – The Eco Audit Tool
www.teachingresources.grantadesign.com M.F. Ashby 2017
5
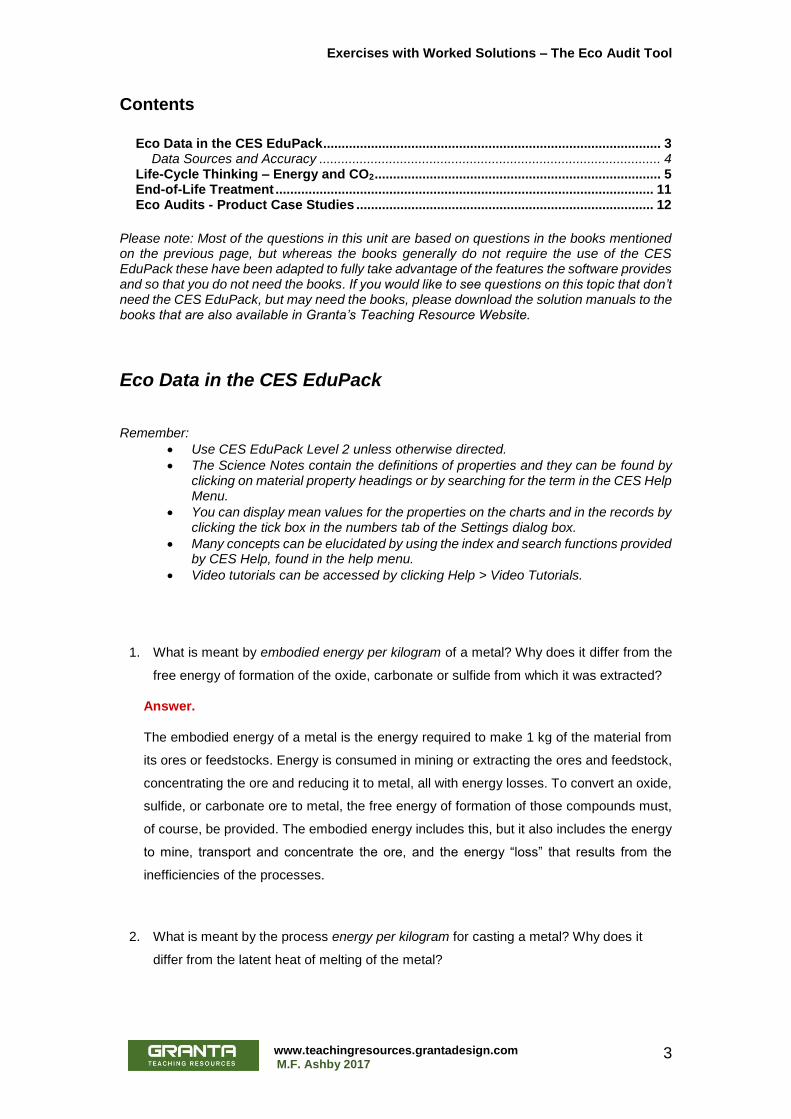
By approximately how many MJ/kg did the extreme values of reported embodied energy
differ by in 2000?
Answer.
Approximately 150 MJ/kg difference in 2000.
Life-Cycle Thinking – Energy and CO2
5.
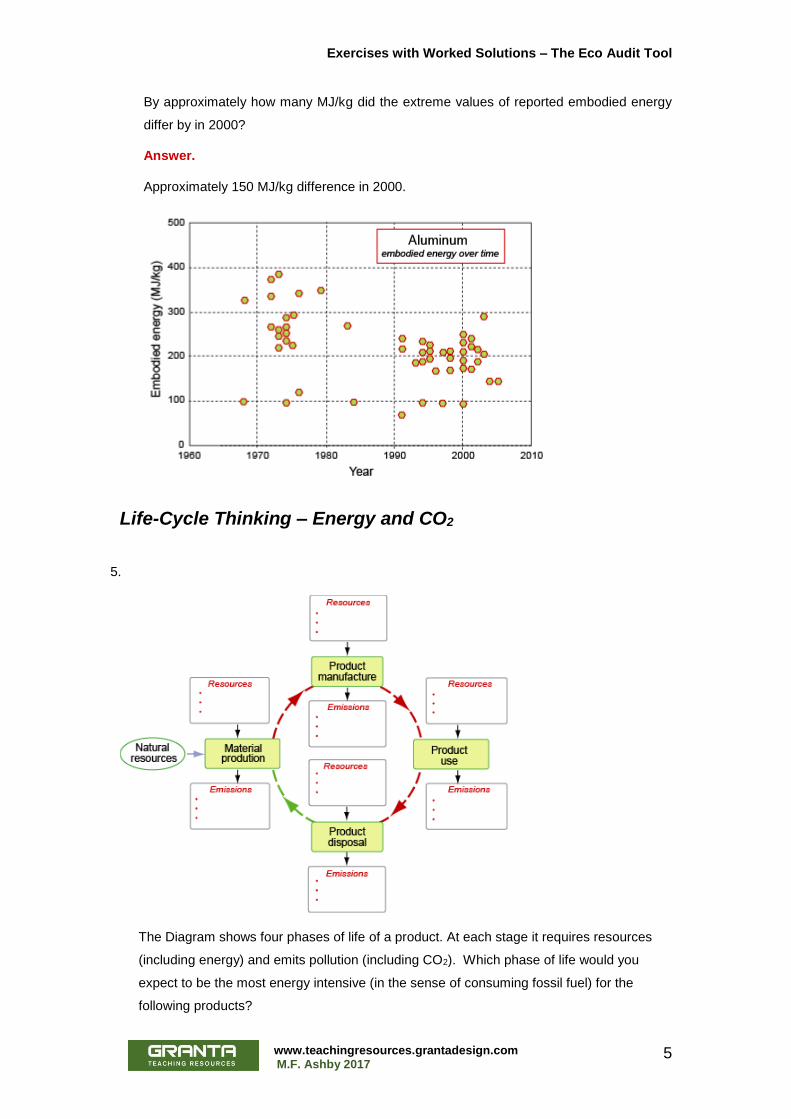
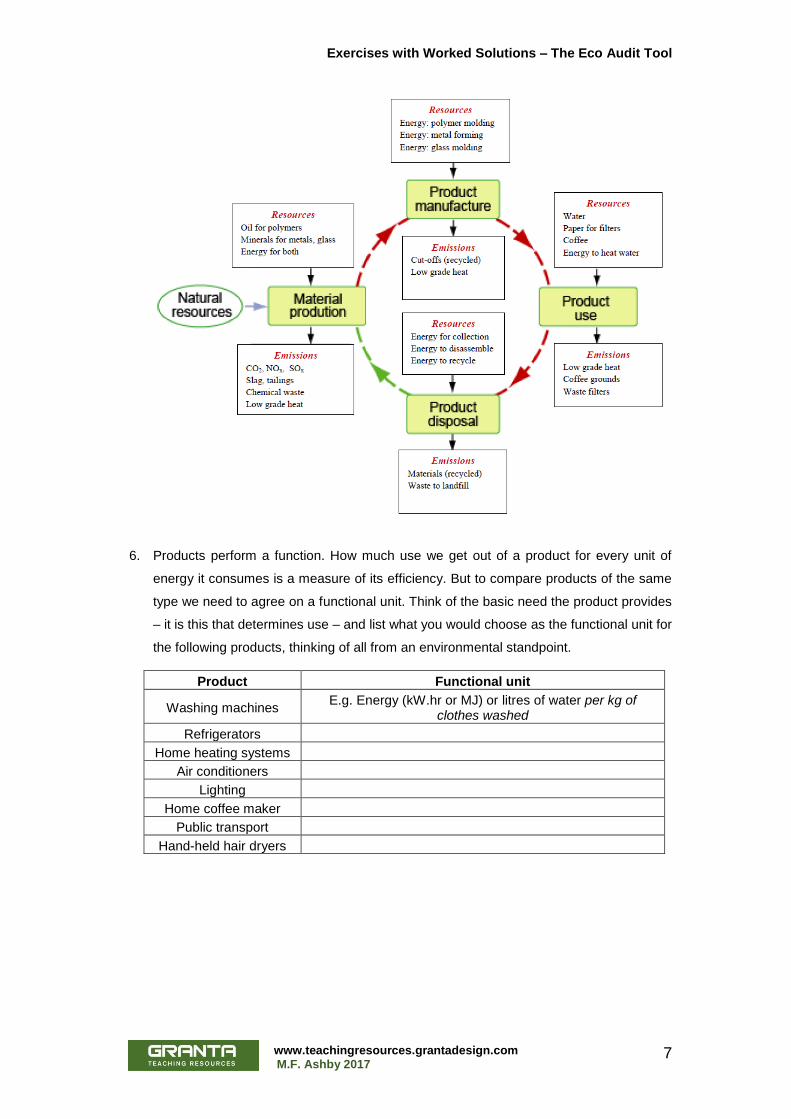
The Diagram shows four phases of life of a product. At each stage it requires resources
(including energy) and emits pollution (including CO2). Which phase of life would you
expect to be the most energy intensive (in the sense of consuming fossil fuel) for the
following products?
Exercises with Worked Solutions – The Eco Audit Tool
www.teachingresources.grantadesign.com M.F. Ashby 2017
6
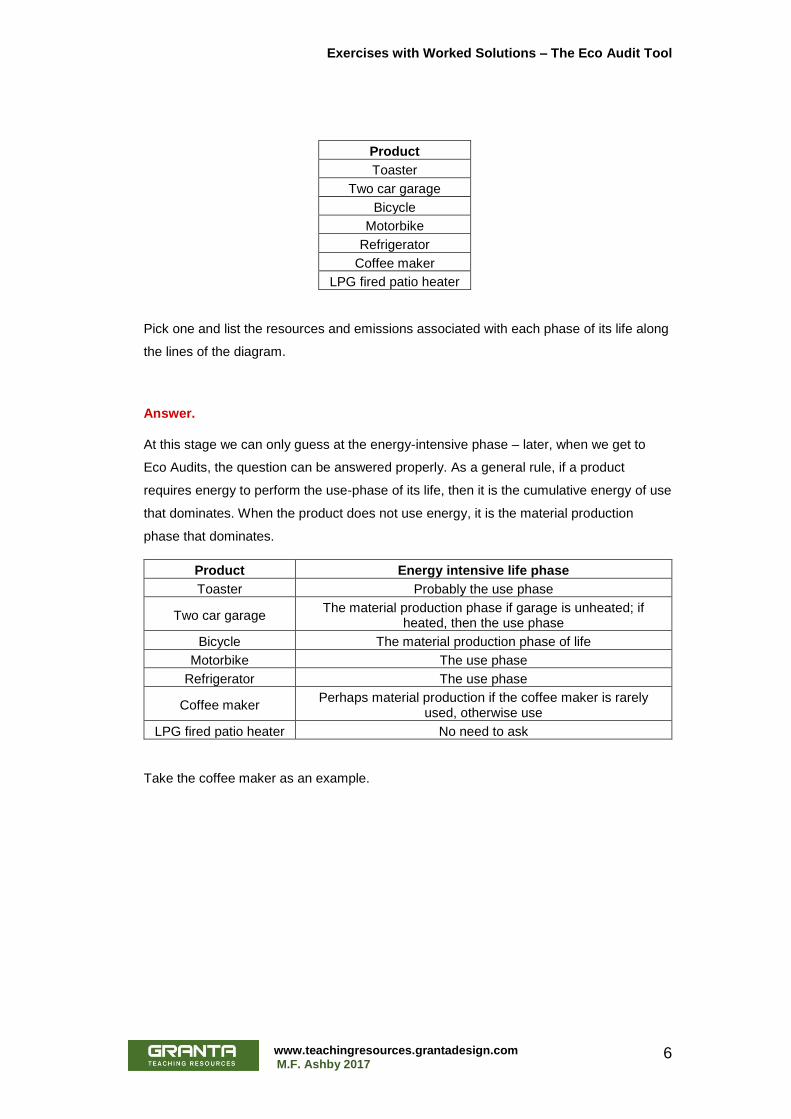
Product
Toaster
Two car garage
Bicycle
Motorbike
Refrigerator
Coffee maker
LPG fired patio heater
Pick one and list the resources and emissions associated with each phase of its life along
the lines of the diagram.
Answer.
At this stage we can only guess at the energy-intensive phase – later, when we get to
Eco Audits, the question can be answered properly. As a general rule, if a product
requires energy to perform the use-phase of its life, then it is the cumulative energy of use
that dominates. When the product does not use energy, it is the material production
phase that dominates.
Product Energy intensive life phase
Toaster Probably the use phase
Two car garage The material production phase if garage is unheated; if
heated, then the use phase
Bicycle The material production phase of life
Motorbike The use phase
Refrigerator The use phase
Coffee maker Perhaps material production if the coffee maker is rarely
used, otherwise use
LPG fired patio heater No need to ask
Take the coffee maker as an example.
Exercises with Worked Solutions – The Eco Audit Tool
www.teachingresources.grantadesign.com M.F. Ashby 2017
7
6. Products perform a function. How much use we get out of a product for every unit of
energy it consumes is a measure of its efficiency. But to compare products of the same
type we need to agree on a functional unit. Think of the basic need the product provides
– it is this that determines use – and list what you would choose as the functional unit for
the following products, thinking of all from an environmental standpoint.
Product Functional unit
Washing machines E.g. Energy (kW.hr or MJ) or litres of water per kg of
clothes washed
Refrigerators
Home heating systems
Air conditioners
Lighting
Home coffee maker
Public transport
Hand-held hair dryers
Exercises with Worked Solutions – The Eco Audit Tool
www.teachingresources.grantadesign.com M.F. Ashby 2017
8
Answer.
The table lists the suggested functional units.
Product Functional unit
Washing machines Energy (kW.hr or MJ) or litres of water per kg of clothes washed
Refrigerators Energy (kW.hr or MJ) per m3 of cooled space per year
Home heating systems Energy (kW.hr or MJ) per unit volume of heated space per unit time (per m3 per year)
Air conditioners Energy (kW.hr or MJ) per unit volume of cooled space per unit time (per m3 per year)
Lighting Power (Watts) per lumen (the measure of light intensity)
Home coffee maker Energy (kW.hr or MJ) per cup of coffee
Public transport Energy (kW.hr or MJ) per passenger mile
Hand-held hair dryers Energy (kW.hr or MJ) per drying episode (difficult: long hair takes longer than short)
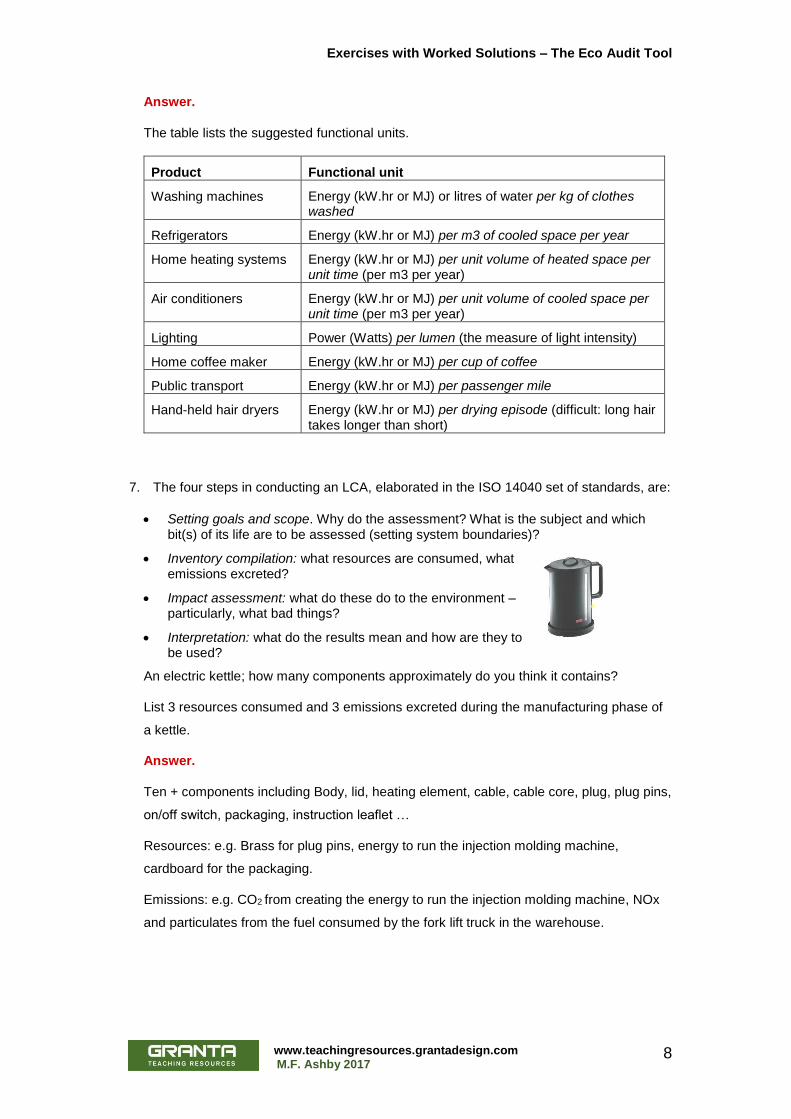
7. The four steps in conducting an LCA, elaborated in the ISO 14040 set of standards, are:
• Setting goals and scope. Why do the assessment? What is the subject and which bit(s) of its life are to be assessed (setting system boundaries)?
• Inventory compilation: what resources are consumed, what emissions excreted?
• Impact assessment: what do these do to the environment – particularly, what bad things?
• Interpretation: what do the results mean and how are they to be used?
An electric kettle; how many components approximately do you think it contains?
List 3 resources consumed and 3 emissions excreted during the manufacturing phase of
a kettle.
Answer.
Ten + components including Body, lid, heating element, cable, cable core, plug, plug pins,
on/off switch, packaging, instruction leaflet …
Resources: e.g. Brass for plug pins, energy to run the injection molding machine,
cardboard for the packaging.
Emissions: e.g. CO2 from creating the energy to run the injection molding machine, NOx
and particulates from the fuel consumed by the fork lift truck in the warehouse.
Exercises with Worked Solutions – The Eco Audit Tool
www.teachingresources.grantadesign.com M.F. Ashby 2017
9
8. What are the difficulties with a full LCA? Why would a simpler, if approximate, technique
be helpful?
Answer.
• A full LCA is a time-consuming task requiring days or weeks of experts’ time, and thus is expensive.
• Despite the formalism that attaches to LCA methods, the results are subject to considerable uncertainty.
• The output of an LCA that meets the ISO 14040 Standard is complex and detailed – it is of little help for design
A simpler, approximate approach would, by reducing the cost and speeding the process,
allow much wider application
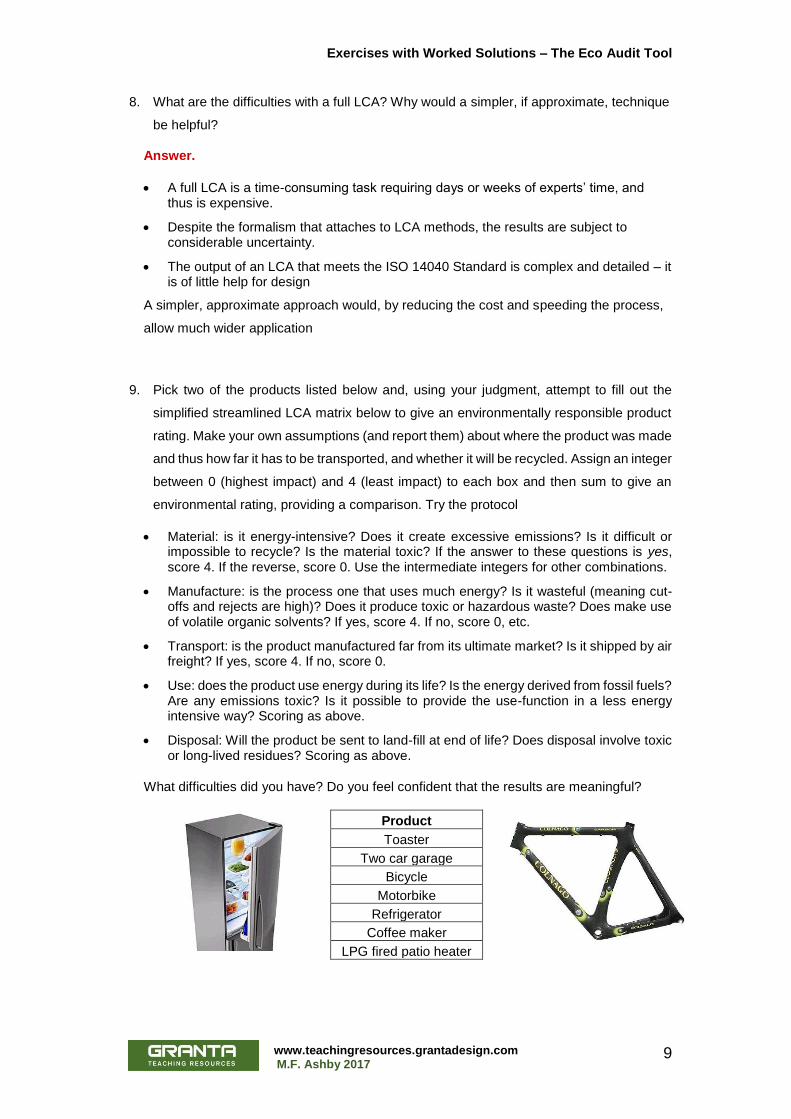
9. Pick two of the products listed below and, using your judgment, attempt to fill out the
simplified streamlined LCA matrix below to give an environmentally responsible product
rating. Make your own assumptions (and report them) about where the product was made
and thus how far it has to be transported, and whether it will be recycled. Assign an integer
between 0 (highest impact) and 4 (least impact) to each box and then sum to give an
environmental rating, providing a comparison. Try the protocol
• Material: is it energy-intensive? Does it create excessive emissions? Is it difficult or impossible to recycle? Is the material toxic? If the answer to these questions is yes, score 4. If the reverse, score 0. Use the intermediate integers for other combinations.
• Manufacture: is the process one that uses much energy? Is it wasteful (meaning cut-offs and rejects are high)? Does it produce toxic or hazardous waste? Does make use of volatile organic solvents? If yes, score 4. If no, score 0, etc.
• Transport: is the product manufactured far from its ultimate market? Is it shipped by air freight? If yes, score 4. If no, score 0.
• Use: does the product use energy during its life? Is the energy derived from fossil fuels? Are any emissions toxic? Is it possible to provide the use-function in a less energy intensive way? Scoring as above.
• Disposal: Will the product be sent to land-fill at end of life? Does disposal involve toxic or long-lived residues? Scoring as above.
What difficulties did you have? Do you feel confident that the results are meaningful?
Product
Toaster
Two car garage
Bicycle
Motorbike
Refrigerator
Coffee maker
LPG fired patio heater
Exercises with Worked Solutions – The Eco Audit Tool
www.teachingresources.grantadesign.com M.F. Ashby 2017
10
Total across columns=
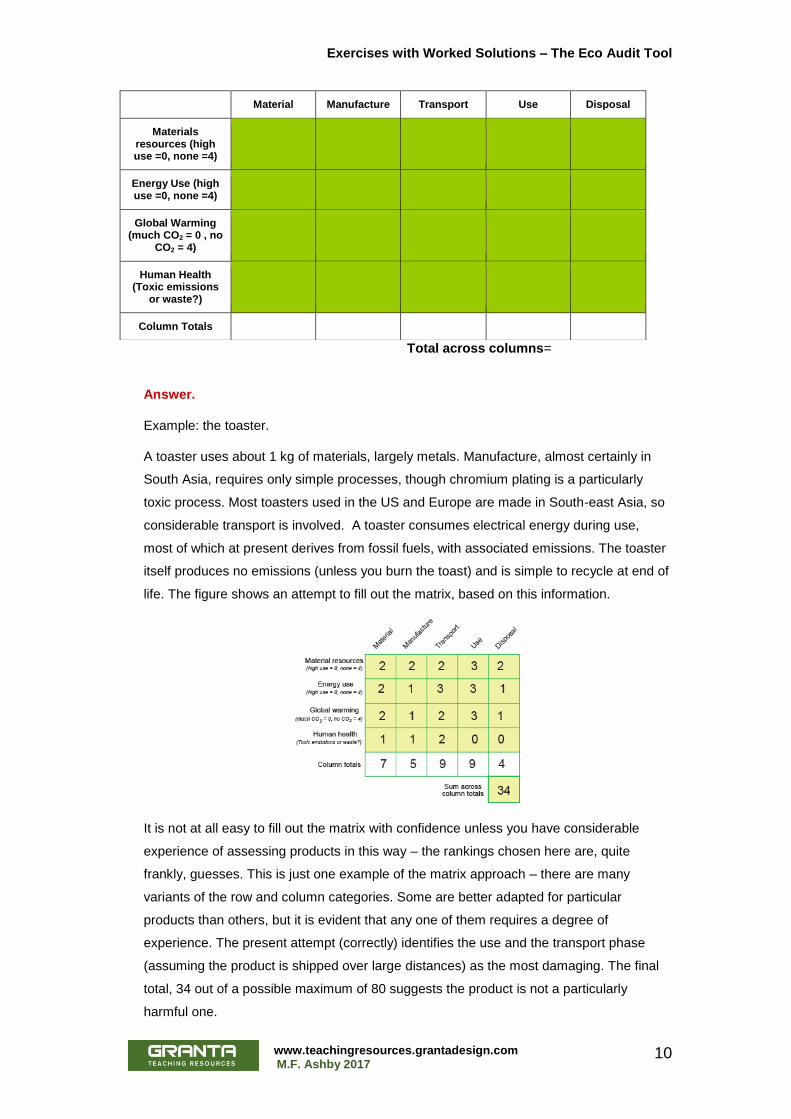
Answer.
Example: the toaster.
A toaster uses about 1 kg of materials, largely metals. Manufacture, almost certainly in
South Asia, requires only simple processes, though chromium plating is a particularly
toxic process. Most toasters used in the US and Europe are made in South-east Asia, so
considerable transport is involved. A toaster consumes electrical energy during use,
most of which at present derives from fossil fuels, with associated emissions. The toaster
itself produces no emissions (unless you burn the toast) and is simple to recycle at end of
life. The figure shows an attempt to fill out the matrix, based on this information.
It is not at all easy to fill out the matrix with confidence unless you have considerable
experience of assessing products in this way – the rankings chosen here are, quite
frankly, guesses. This is just one example of the matrix approach – there are many
variants of the row and column categories. Some are better adapted for particular
products than others, but it is evident that any one of them requires a degree of
experience. The present attempt (correctly) identifies the use and the transport phase
(assuming the product is shipped over large distances) as the most damaging. The final
total, 34 out of a possible maximum of 80 suggests the product is not a particularly
harmful one.
Material Manufacture Transport Use Disposal
Materials resources (high use =0, none =4)
Energy Use (high use =0, none =4)
Global Warming (much CO2 = 0 , no
CO2 = 4)
Human Health (Toxic emissions
or waste?)
Column Totals
Exercises with Worked Solutions – The Eco Audit Tool
www.teachingresources.grantadesign.com M.F. Ashby 2017
11
End-of-Life Treatment
10. Many products are thrown away and enter the waste stream even though they still work.
What are the reasons for this?
Answer.
A product reaches the end of its life when it’s no longer valued, even though it may still
work well. The life expectancy is the least of
• The physical life, meaning the time in which the product breaks down beyond
economic repair;
• The functional life, meaning the time when the need for it ceases to exist;
• The technical life, meaning the time at which advances in technology have made the
product unacceptably obsolete;
• The economical life, meaning the time at which advances in design and technology
offer the same functionality at significantly lower operating cost;
• The legal life – the time at which new standards, directives, legislation or restrictions
make the use of the product illegal
• And finally the loss of desirability – the time at which changes in taste, fashion, or
aesthetic preference render the product unattractive.
11. Do you think manufacture without waste is possible? “Waste”, here, includes waste (i.e.
low-grade) heat, emissions and solid and liquid residues that cannot be put to a useful
purpose. If not, why not?
Answer.
All manufacture involves conversion: conversion of ores and feedstock into raw materials,
conversion of raw materials into products, the use of the products and their ultimate
disposal. All of these steps involve energy, sometimes in its primary form as oil or gas, but
more usually in a converted form as electricity or mechanical power.
All conversions involve conversion efficiencies. Some conversion efficiencies are high –
conversion of electric to mechanical power, for instance, can be achieved with an efficiency
of 90%. Others, for fundamental thermodynamic reasons, are not – the conversion of fossil
fuels to electric power is, at best, only 45% efficient. The losses, small or large, constitute
one sort of waste – waste heat – and, if fossil fuels are involved, another: waste emissions.
Just as there are conversion efficiencies for energy, there are conversion efficiencies for
the transformation of materials during manufacture, and for the recovery of materials at end
of life. Some are economic in origin – salvaging and sorting 100% of the scrap produced

Exercises with Worked Solutions – The Eco Audit Tool
www.teachingresources.grantadesign.com M.F. Ashby 2017
12
during manufacture is not economic, though salvaging 90% might be. Recovering materials
at end of life has lower efficiencies because the dispersion of materials in products makes
full recovery uneconomic, and because contamination of one material by another cannot,
in some products, be prevented. All these factors combine to make some waste
unavoidable.
Eco Audits - Product Case Studies
The following questions use the Eco Audit Tool which can be found in the main toolbar or in the tools menu. Video tutorials on the Eco Audit Tool can be accessed by clicking Help > Video Tutorials.
12. Open the CES EduPack at Level 2 and click on the “Eco Audit” button. Click on “Open”
on the right-hand side of the area that just opened up. You should be able to see a list of
Eco Audit Project files. If not, then your installation is not standard and we have to go and
find them. They should be in the Program Files on your computer, together with the CES
EduPack software. Program files are usually on your C drive, for example: C:\Program
Files (x86)\CES EduPack 2017\Samples\eco_audit\en. Once you have found the list of
files, open the one called “2017 Level 2 – Bottle PET”.
The first tab “Product Definition” is a model for a product – in this case 100 bottles of mineral
water. The top section is a bill of materials and covers the components the product consists
of, what they are made of, how they are processed, their weight and what happens to them
at the end of their lives. Sections below cover how the product is transported and used.
Each section heading in blue can be clicked on to get a thorough explanation of the data
and equations behind the Eco Audit Tool. Review the Eco Audit File you just opened.
a) What is the mass of each bottle including cap and the water contained in it?
b) What are the caps made of?
c) How will the bottles be processed?
d) What will happen to the caps at the end of their lives? What other options are there for PP? (Use the drop down menu to list them.)
e) By what method of transportation will the bottle get to their point of use?
f) Click on the help icon next to transport. How will the Transport Energy be calculated?
g) The use phase is trying to represent the refrigeration of the 100 bottles after they have been delivered but before the water is drunk. How long are the bottles in the refrigerator?
h) What is the power rating of the refrigerator? Look in the notes section, what is this power rating for?
i) We need to have a measure of how efficient the refrigerator is at converting electricity to function. What is in the “Energy Input and Output” field?
Exercises with Worked Solutions – The Eco Audit Tool
www.teachingresources.grantadesign.com M.F. Ashby 2017
13
j) Lastly, we need to know where the electricity is coming from as electricity can be produced in different ways that create more or less CO2.Click on the Use phase help icon. How many Mega Joules of Fossil fuel energy is needed to make 1 Mega Joule of electricity in the UK?
k) OK so now let’s look at the report. Click on the button marked “Detailed Report” or click on the second tab “Report”. What two environmental measures are charted?
l) Note that they are broken up by phase of life. Which phase of life of the bottles creates the most CO
2?
m) Why does one phase of life have a negative number? What does this mean? (Remember the help menu has explanations.)
n) What are the total Energy and total Carbon Footprint for the 100 bottles in this scenario?
o) Click on the blue arrows towards the top to go to page 2 and 3 of the report. Here you will find all the numbers used in the calculations broken down. How many MJ does the Eco Audit Tool think it takes to transport 100 bottles 550 km by 14 tonne truck?
Export the Report and save it somewhere so that you can refer back to it later. (You can
use the disk symbol towards the top.)
Answer.
a) 1.041 kg
b) Polypropylene
c) Polymer Molding
d) Landfill. Other options: Recycle, Combust, Reuse, Downcycle, Re-manufacture.
e) 14 tonne truck.
f) Transport Energy = Transport Energy per unit mass and distance x distance x product mass.
g) 2 days.
h) Energy required to refrigerate 100 bottles at 4°C = 0.12kW
i) Electrical to Mechanical (Electric Motors). Essentially refrigerators work by using electric motors to compress gas.
j) 2MJ
k) Energy and CO2
l) Material Phase.
m) Negative numbers in the Disposal or End of Life phase represent energies or amounts of CO2 that can be saved, in the case of energy, or prevented from being emitted in the case of CO2.
n) 525MJ Energy and 28.5 kg CO2.The end of life potential is 185MJ in Energy and 3.62kg CO2.
o) 49 MJ.

Exercises with Worked Solutions – The Eco Audit Tool
www.teachingresources.grantadesign.com M.F. Ashby 2017
14
13. Open the Eco Audit Project File (see previous question): “2017 Level 2 – Bottle glass” in
the Eco Audit Tool. This file is for 100 glass bottles. Note the total CO2 and Energy used
for this product, and export the report for reference.
Which phase is the most important? Where would you prioritise change to get the biggest
benefit to the environment?
If the embodied energies and CO2 used in the bottled water eco audit file are uncertain by
a factor of ± 25%, do the conclusions change? Export the report to Excel and use the data
table to create a chart of the relative energy and CO2 contributions of each phase, with
25% error bars on every bar. Describe your conclusions.
Answer.
The material phase is the most important in terms of both energy and CO2, and a material
of lower embodied energy or reducing the amount of material used in the bottle could have
a significant impact.
When we take the uncertain nature of the data into account, the picture is less clear. The
error bars for the Manufacturing Phase and the Material Phase overlap, especially for CO2.
So if you are concerned with reducing your carbon footprint (perhaps so your marketing
department can label the bottle differently), the manufacturing process would need to be
investigated too.

Exercises with Worked Solutions – The Eco Audit Tool
www.teachingresources.grantadesign.com M.F. Ashby 2017
15
14. Open the Eco Audit Project File: “2017 Level 2 – Bottle PET” in the Eco Audit Tool. As
mentioned above, this file is for 100 PET bottles.
a) Instead of using 0% virgin PET change the scenario so we are using 100%
recycled PET. Describe how this changes the environmental impact.
You can buy material that is made 100% recycled PET. However, is it likely that 100% of
your bottles will get recycled?
b) Find the PET material record and look at the Eco properties section. From
this data, is it possible to know what % of PET is commonly recycled?
Answer.
a) To visualize the differences between the original and the “100% recycled PET”
scenario, we will use the “Compare with…” button and choose “copy of current
product”. Note that a new tab appeared, named “Bottled mineral water (100 units) (1)”
and a pop-up window (Eco-summary) also appeared with two sets of bars: one for the
original scenario and one for the copied scenario. Any changes done to any of the
scenarios will be immediately reflected on this pop-up window. Rename this new tab
to “PET 100% recycled”. Changing the recycled content of the PET to 100% will
substantially decrease the Materials phase of energy consumption, eliminating the
benefit in the EOL potential. Overall, it is expected that 35% of the energy consumed
will be saved with this scenario. Clicking on the CO2 button in the pop-up window will
show what happens in terms of CO2: 13% less of CO2 will be emitted in this scenario.
(MAKE SURE YOU SAVE THIS FILE, AS IT WILL BE USEFUL FOR ANOTHER
EXERCISE FURTHER DOWNSTREAM. Do this by clicking “Save” in the top right corner
and choosing an appropriate location for the file)
b) Only 22% of the material in the supply chain is from recycled stock. This doesn’t mean
that only 22% of bottles will be recycled. There is also a growth in the number of bottles
etc. that are produced as the population grows and societies get richer and consume
more. However 22% (and this is high for a polymer) does indicate that it might not be
easy to get 100% recycled PET and/or that not 100% of the bottles will be recycled.
15. Our Bottled Mineral Water has proved to be popular. The importers now wish
to move up-market. To do so they plan to market their water in 1 litre glass
bottles of appealing design instead of the rather-ordinary PET bottles. A single
1-litre glass bottle weighs 450 grams, much more than the 40 grams of those
made of PET. Critics argue that this marketing-strategy is irresponsible
because of the increased weight. The importers respond that glass has lower
Exercises with Worked Solutions – The Eco Audit Tool
www.teachingresources.grantadesign.com M.F. Ashby 2017
16
embodied energy than PET. Use the Eco Audit Tool to come up with your own
conclusions on this topic.
Open the Eco Audit Project File: “Level 2 – Bottle PET” in the Eco Audit Tool. This file is
for 100 PET bottles. Use the “Compare with…” button and choose “copy of current
product”. Give this new tab the name “Glass bottle”. In this tab:
• Change the material used for the bottle to Soda-Lime Glass and the material used for
the cap to Non age-hardening wrought Al-alloys.
• Change the masses to 0.45 kg for the bottles and 0.002 kg for the caps.
• Change the processes to Glass molding for the bottle and rough rolling for the cap.
• Change the end of life of the caps to recycle.
View the Eco Summary comparing these two scenarios. What do you think of the
marketing strategy. Does it have “Eco Credentials”?
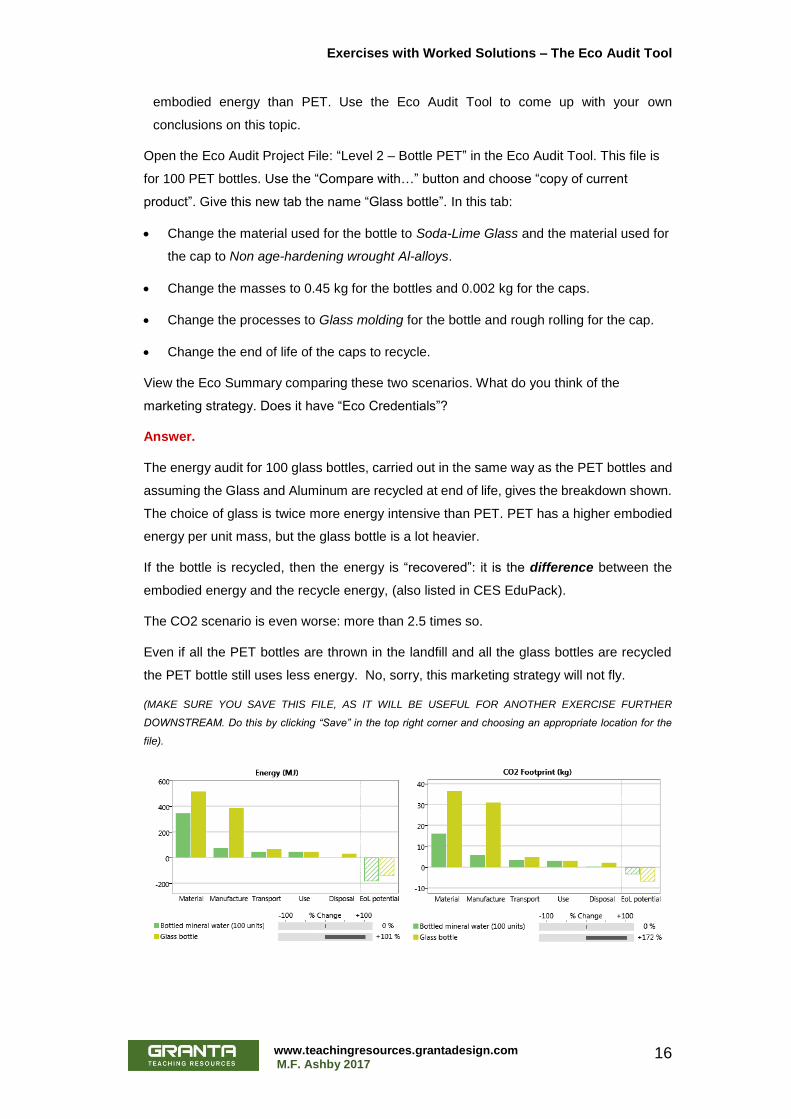
Answer.
The energy audit for 100 glass bottles, carried out in the same way as the PET bottles and
assuming the Glass and Aluminum are recycled at end of life, gives the breakdown shown.
The choice of glass is twice more energy intensive than PET. PET has a higher embodied
energy per unit mass, but the glass bottle is a lot heavier.
If the bottle is recycled, then the energy is “recovered”: it is the difference between the
embodied energy and the recycle energy, (also listed in CES EduPack).
The CO2 scenario is even worse: more than 2.5 times so.
Even if all the PET bottles are thrown in the landfill and all the glass bottles are recycled
the PET bottle still uses less energy. No, sorry, this marketing strategy will not fly.
(MAKE SURE YOU SAVE THIS FILE, AS IT WILL BE USEFUL FOR ANOTHER EXERCISE FURTHER
DOWNSTREAM. Do this by clicking “Save” in the top right corner and choosing an appropriate location for the
file).
Exercises with Worked Solutions – The Eco Audit Tool
www.teachingresources.grantadesign.com M.F. Ashby 2017
17
16. Open the Eco Audit Project File: “2017 Level 2 – Bottle PET” in the Eco Audit Tool. This
file is for 100 PET bottles. Use the “Compare with…” button and choose “Copy of
current product”. Give this new tab the name “PET Combustion in EoL”. In this tab:
• Change the end of life of the PET bottle to Combust.
View the Eco Summary comparing these two scenarios and describe what has happened
to both the Energy and the Carbon footprint and why.
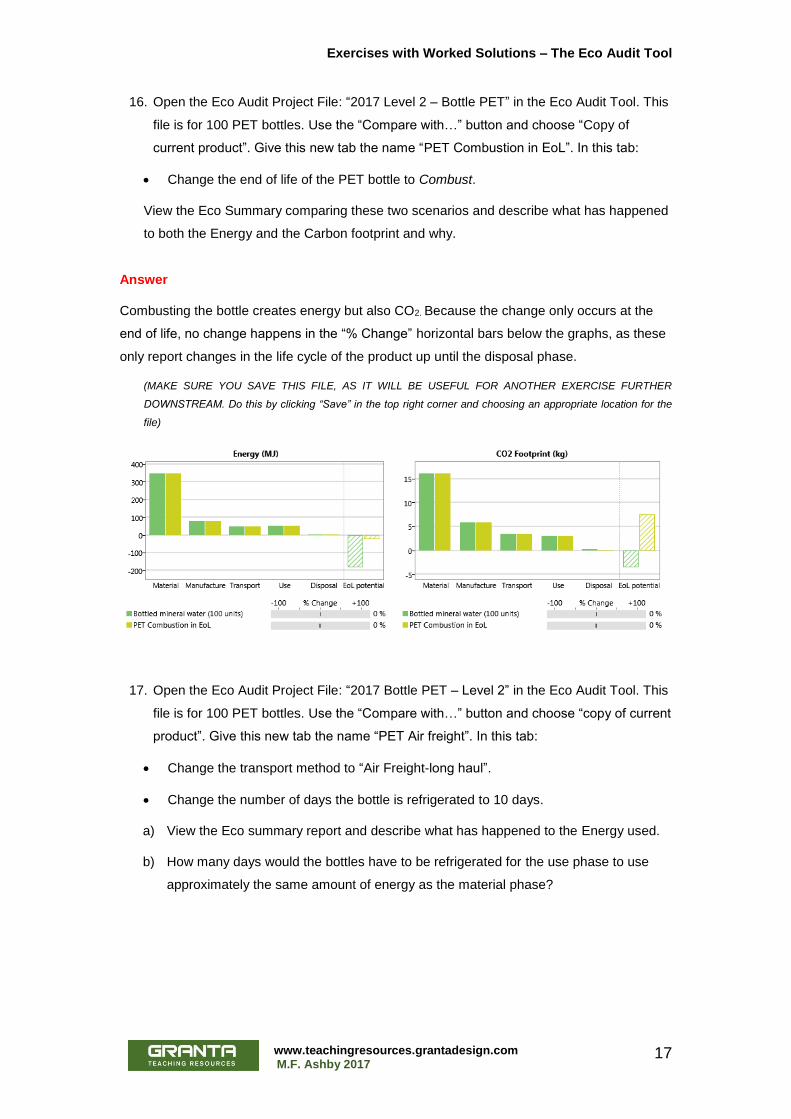
Answer
Combusting the bottle creates energy but also CO2. Because the change only occurs at the
end of life, no change happens in the “% Change” horizontal bars below the graphs, as these
only report changes in the life cycle of the product up until the disposal phase.
(MAKE SURE YOU SAVE THIS FILE, AS IT WILL BE USEFUL FOR ANOTHER EXERCISE FURTHER
DOWNSTREAM. Do this by clicking “Save” in the top right corner and choosing an appropriate location for the
file)
17. Open the Eco Audit Project File: “2017 Bottle PET – Level 2” in the Eco Audit Tool. This
file is for 100 PET bottles. Use the “Compare with…” button and choose “copy of current
product”. Give this new tab the name “PET Air freight”. In this tab:
• Change the transport method to “Air Freight-long haul”.
• Change the number of days the bottle is refrigerated to 10 days.
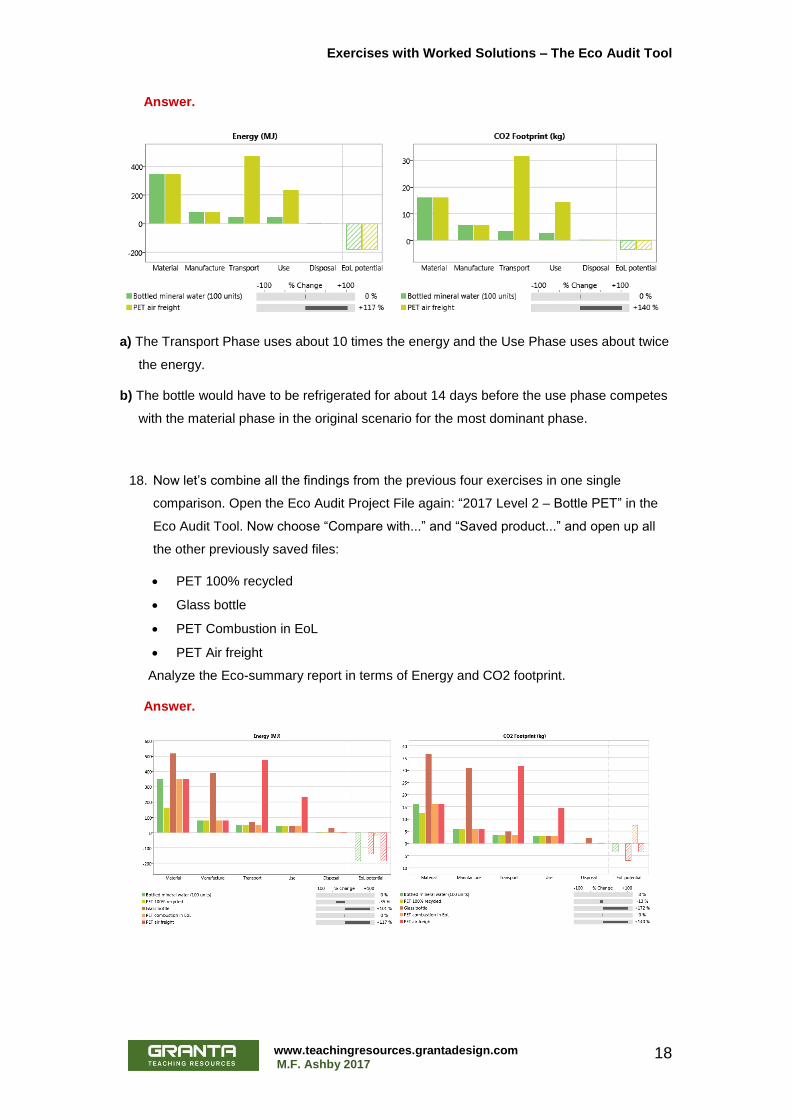
a) View the Eco summary report and describe what has happened to the Energy used.
b) How many days would the bottles have to be refrigerated for the use phase to use
approximately the same amount of energy as the material phase?
Exercises with Worked Solutions – The Eco Audit Tool
www.teachingresources.grantadesign.com M.F. Ashby 2017
18
Answer.
a) The Transport Phase uses about 10 times the energy and the Use Phase uses about twice
the energy.
b) The bottle would have to be refrigerated for about 14 days before the use phase competes
with the material phase in the original scenario for the most dominant phase.
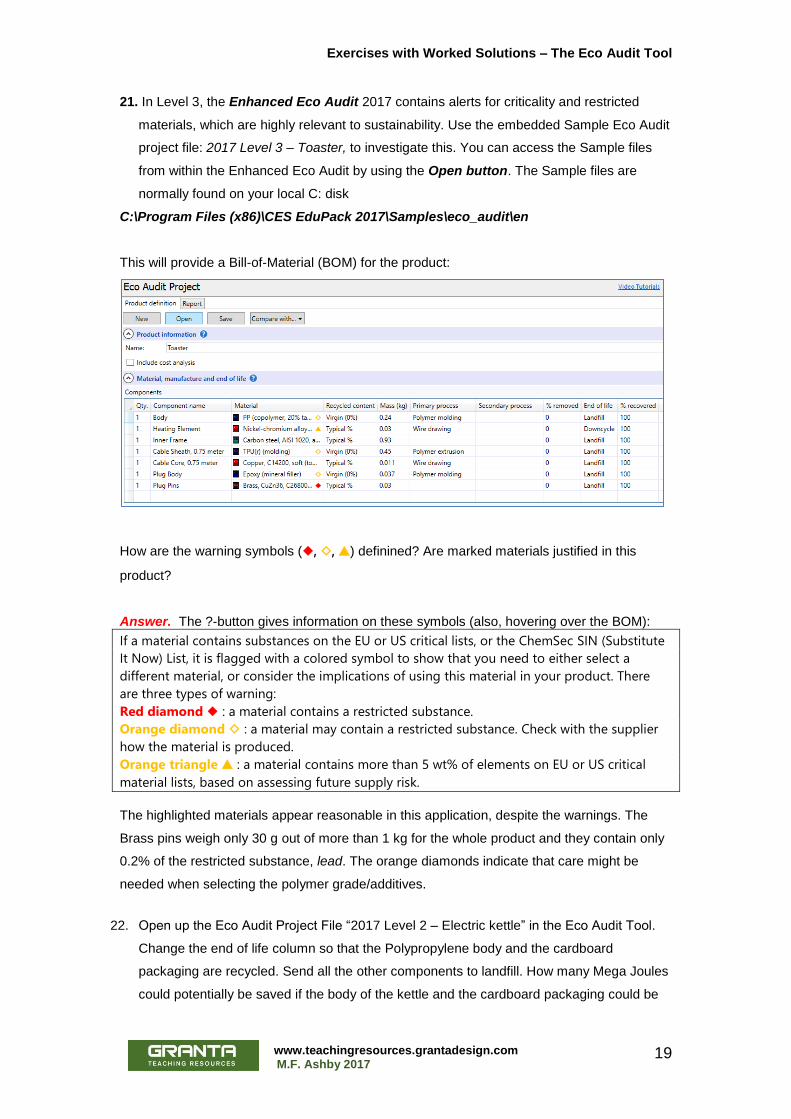
18. Now let’s combine all the findings from the previous four exercises in one single
comparison. Open the Eco Audit Project File again: “2017 Level 2 – Bottle PET” in the
Eco Audit Tool. Now choose “Compare with...” and “Saved product...” and open up all
the other previously saved files:
• PET 100% recycled
• Glass bottle
• PET Combustion in EoL
• PET Air freight
Analyze the Eco-summary report in terms of Energy and CO2 footprint.
Answer.
Exercises with Worked Solutions – The Eco Audit Tool
www.teachingresources.grantadesign.com M.F. Ashby 2017
19
21. In Level 3, the Enhanced Eco Audit 2017 contains alerts for criticality and restricted
materials, which are highly relevant to sustainability. Use the embedded Sample Eco Audit
project file: 2017 Level 3 – Toaster, to investigate this. You can access the Sample files
from within the Enhanced Eco Audit by using the Open button. The Sample files are
normally found on your local C: disk
C:\Program Files (x86)\CES EduPack 2017\Samples\eco_audit\en
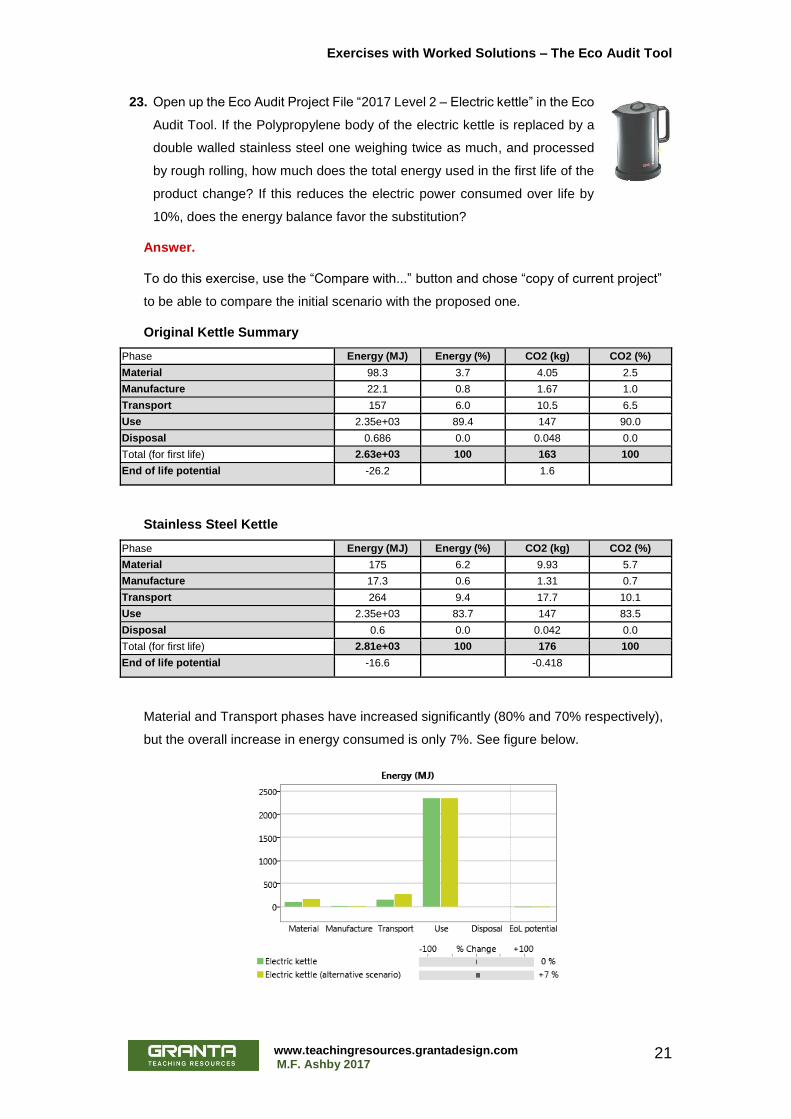
This will provide a Bill-of-Material (BOM) for the product:
How are the warning symbols (◆, ◇, ▲) definined? Are marked materials justified in this
product?
Answer. The ?-button gives information on these symbols (also, hovering over the BOM):
If a material contains substances on the EU or US critical lists, or the ChemSec SIN (Substitute
It Now) List, it is flagged with a colored symbol to show that you need to either select a
different material, or consider the implications of using this material in your product. There
are three types of warning:
Red diamond ◆ : a material contains a restricted substance.
Orange diamond ◇ : a material may contain a restricted substance. Check with the supplier
how the material is produced.
Orange triangle ▲ : a material contains more than 5 wt% of elements on EU or US critical
material lists, based on assessing future supply risk.
The highlighted materials appear reasonable in this application, despite the warnings. The
Brass pins weigh only 30 g out of more than 1 kg for the whole product and they contain only
0.2% of the restricted substance, lead. The orange diamonds indicate that care might be
needed when selecting the polymer grade/additives.
22. Open up the Eco Audit Project File “2017 Level 2 – Electric kettle” in the Eco Audit Tool.
Change the end of life column so that the Polypropylene body and the cardboard
packaging are recycled. Send all the other components to landfill. How many Mega Joules
could potentially be saved if the body of the kettle and the cardboard packaging could be

Exercises with Worked Solutions – The Eco Audit Tool
www.teachingresources.grantadesign.com M.F. Ashby 2017
20
recycled for every kettle? What is that as a percentage of the total energy used in the first
life of the kettle?
Answer.
When changing the components’ end of life to “Landfill”, you will notice that for the heating
element “Landfill” is not an option – because of the materials of which it is made, potentially
very hazardous to the environment. For this part, set the end of life to “None”.
The table below can be found on the first page of the “report” tab.
Phase Energy (MJ) Energy (%) CO2 (kg) CO2 (%) Material 98.3 3.7 4.05 2.5 Manufacture 22.1 0.8 1.67 1.0 Transport 157 6.0 10.5 6.5 Use 2.35e+03 89.4 147 90.0 Disposal 0.739 0.0 0.0517 0.0 Total (for first life) 2.63e+03 100 163 100 End of life potential -29.6 0.672
29.2 MJ potential saving = ~1.3% of the total first life energy.
Exercises with Worked Solutions – The Eco Audit Tool
www.teachingresources.grantadesign.com M.F. Ashby 2017
21
23. Open up the Eco Audit Project File “2017 Level 2 – Electric kettle” in the Eco
Audit Tool. If the Polypropylene body of the electric kettle is replaced by a
double walled stainless steel one weighing twice as much, and processed
by rough rolling, how much does the total energy used in the first life of the
product change? If this reduces the electric power consumed over life by
10%, does the energy balance favor the substitution?
Answer.
To do this exercise, use the “Compare with...” button and chose “copy of current project”
to be able to compare the initial scenario with the proposed one.
Original Kettle Summary
Phase Energy (MJ) Energy (%) CO2 (kg) CO2 (%) Material 98.3 3.7 4.05 2.5 Manufacture 22.1 0.8 1.67 1.0 Transport 157 6.0 10.5 6.5 Use 2.35e+03 89.4 147 90.0 Disposal 0.686 0.0 0.048 0.0 Total (for first life) 2.63e+03 100 163 100 End of life potential -26.2 1.6
Stainless Steel Kettle
Phase Energy (MJ) Energy (%) CO2 (kg) CO2 (%) Material 175 6.2 9.93 5.7 Manufacture 17.3 0.6 1.31 0.7 Transport 264 9.4 17.7 10.1 Use 2.35e+03 83.7 147 83.5 Disposal 0.6 0.0 0.042 0.0 Total (for first life) 2.81e+03 100 176 100 End of life potential -16.6 -0.418
Material and Transport phases have increased significantly (80% and 70% respectively),
but the overall increase in energy consumed is only 7%. See figure below.
Exercises with Worked Solutions – The Eco Audit Tool
www.teachingresources.grantadesign.com M.F. Ashby 2017
22
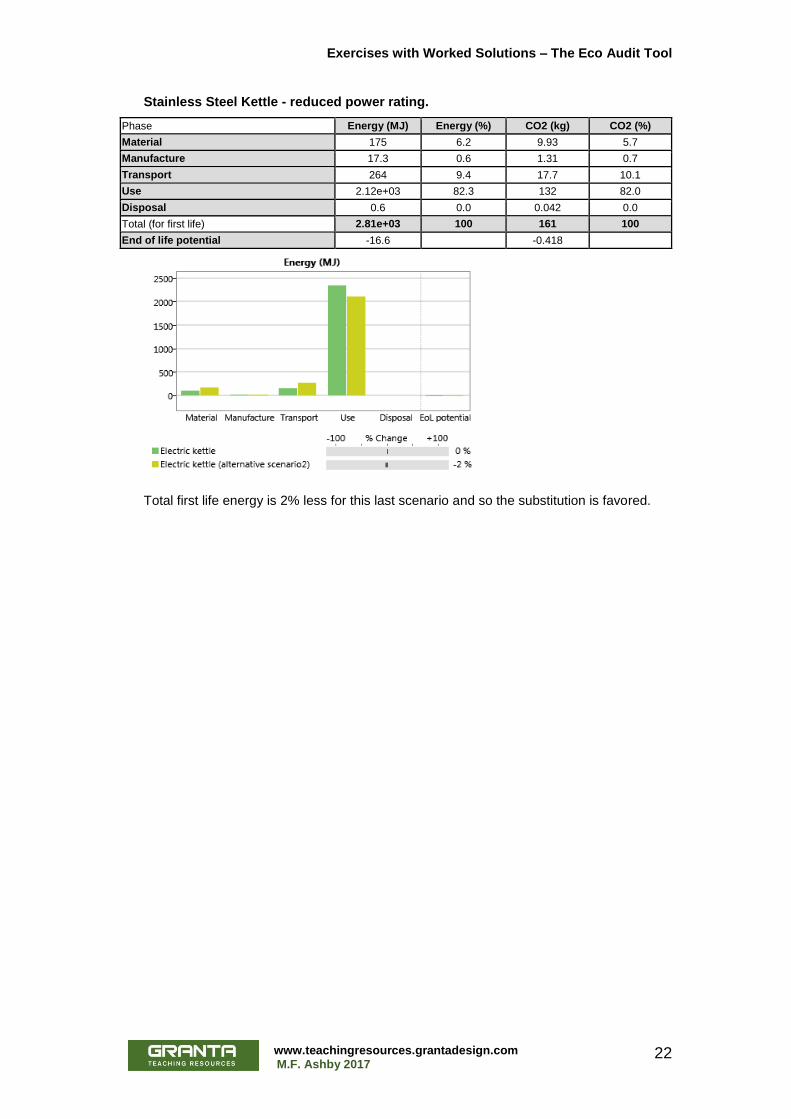
Stainless Steel Kettle - reduced power rating.
Phase Energy (MJ) Energy (%) CO2 (kg) CO2 (%)
Material 175 6.2 9.93 5.7
Manufacture 17.3 0.6 1.31 0.7
Transport 264 9.4 17.7 10.1
Use 2.12e+03 82.3 132 82.0
Disposal 0.6 0.0 0.042 0.0
Total (for first life) 2.81e+03 100 161 100
End of life potential -16.6 -0.418
Total first life energy is 2% less for this last scenario and so the substitution is favored.
Exercises with Worked Solutions – The Eco Audit Tool
www.teachingresources.grantadesign.com M.F. Ashby 2017
23
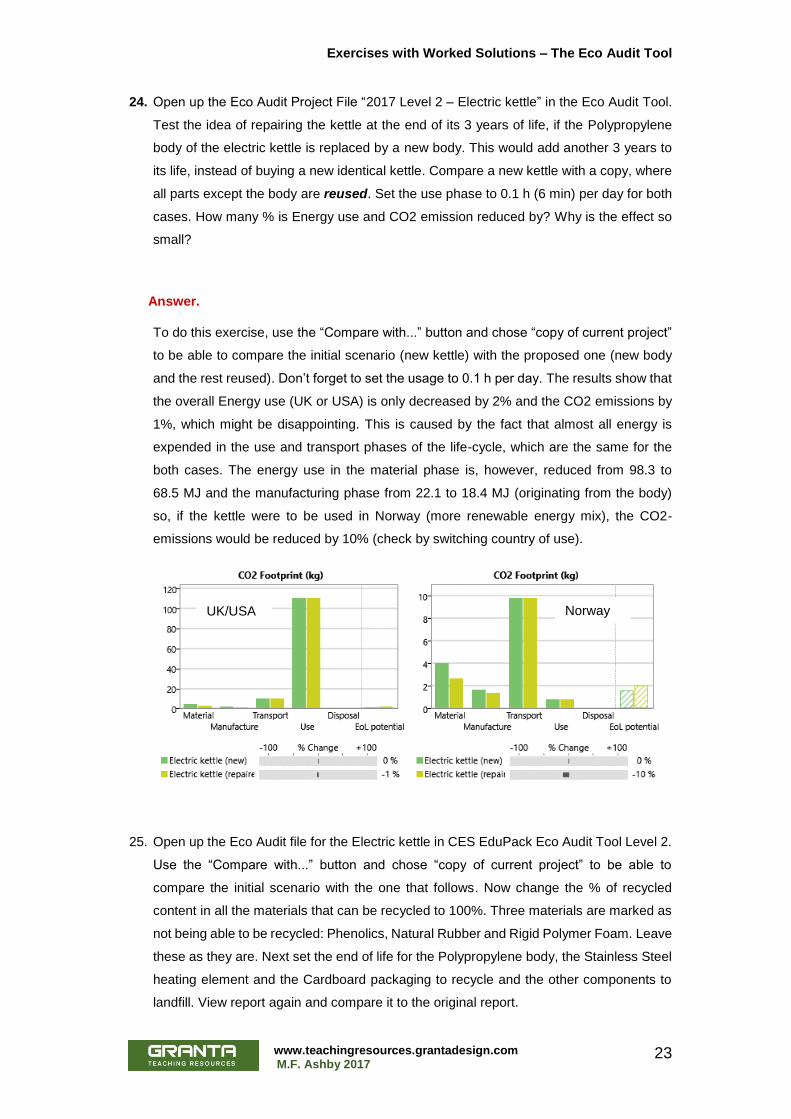
24. Open up the Eco Audit Project File “2017 Level 2 – Electric kettle” in the Eco Audit Tool.
Test the idea of repairing the kettle at the end of its 3 years of life, if the Polypropylene
body of the electric kettle is replaced by a new body. This would add another 3 years to
its life, instead of buying a new identical kettle. Compare a new kettle with a copy, where
all parts except the body are reused. Set the use phase to 0.1 h (6 min) per day for both
cases. How many % is Energy use and CO2 emission reduced by? Why is the effect so
small?
Answer.
To do this exercise, use the “Compare with...” button and chose “copy of current project”
to be able to compare the initial scenario (new kettle) with the proposed one (new body
and the rest reused). Don’t forget to set the usage to 0.1 h per day. The results show that
the overall Energy use (UK or USA) is only decreased by 2% and the CO2 emissions by
1%, which might be disappointing. This is caused by the fact that almost all energy is
expended in the use and transport phases of the life-cycle, which are the same for the
both cases. The energy use in the material phase is, however, reduced from 98.3 to
68.5 MJ and the manufacturing phase from 22.1 to 18.4 MJ (originating from the body)
so, if the kettle were to be used in Norway (more renewable energy mix), the CO2-
emissions would be reduced by 10% (check by switching country of use).
25. Open up the Eco Audit file for the Electric kettle in CES EduPack Eco Audit Tool Level 2.
Use the “Compare with...” button and chose “copy of current project” to be able to
compare the initial scenario with the one that follows. Now change the % of recycled
content in all the materials that can be recycled to 100%. Three materials are marked as
not being able to be recycled: Phenolics, Natural Rubber and Rigid Polymer Foam. Leave
these as they are. Next set the end of life for the Polypropylene body, the Stainless Steel
heating element and the Cardboard packaging to recycle and the other components to
landfill. View report again and compare it to the original report.
UK/USA Norway
Exercises with Worked Solutions – The Eco Audit Tool
www.teachingresources.grantadesign.com M.F. Ashby 2017
24
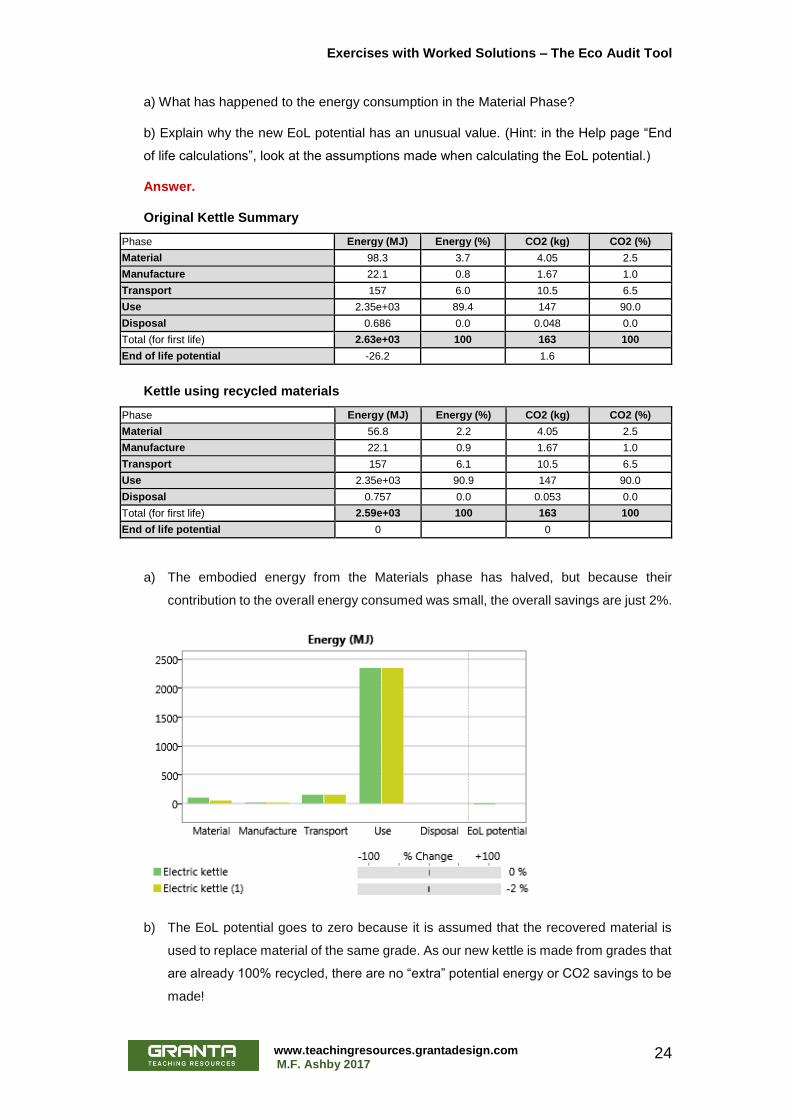
a) What has happened to the energy consumption in the Material Phase?
b) Explain why the new EoL potential has an unusual value. (Hint: in the Help page “End
of life calculations”, look at the assumptions made when calculating the EoL potential.)
Answer.
Original Kettle Summary
Phase Energy (MJ) Energy (%) CO2 (kg) CO2 (%)
Material 98.3 3.7 4.05 2.5
Manufacture 22.1 0.8 1.67 1.0
Transport 157 6.0 10.5 6.5
Use 2.35e+03 89.4 147 90.0
Disposal 0.686 0.0 0.048 0.0
Total (for first life) 2.63e+03 100 163 100
End of life potential -26.2 1.6
Kettle using recycled materials
Phase Energy (MJ) Energy (%) CO2 (kg) CO2 (%)
Material 56.8 2.2 4.05 2.5
Manufacture 22.1 0.9 1.67 1.0
Transport 157 6.1 10.5 6.5
Use 2.35e+03 90.9 147 90.0
Disposal 0.757 0.0 0.053 0.0
Total (for first life) 2.59e+03 100 163 100
End of life potential 0 0
a) The embodied energy from the Materials phase has halved, but because their
contribution to the overall energy consumed was small, the overall savings are just 2%.
b) The EoL potential goes to zero because it is assumed that the recovered material is
used to replace material of the same grade. As our new kettle is made from grades that
are already 100% recycled, there are no “extra” potential energy or CO2 savings to be
made!
Exercises with Worked Solutions – The Eco Audit Tool
www.teachingresources.grantadesign.com M.F. Ashby 2017
25
26. A 1700 Watt steam iron weighs 1.3 kg, 98% of which is accounted for by the 7
components listed in the table. The iron heats up on full power in 4 minutes, is then used,
typically, for 20 minutes, once a week. At end of life the iron is dumped as landfill. Virgin
materials are used for all components. The iron is made in China and used in the USA. It
is transported by 14 tonne truck from the factory to the port, 100 km, by sea freight for 14
000 km and by 14 tonne truck for 3 000 km. Create an Eco Audit for the iron assuming
that it is used over a life of 5 years,.
What conclusions can you draw? How might the energy be reduced?

Exercises with Worked Solutions – The Eco Audit Tool
www.teachingresources.grantadesign.com M.F. Ashby 2017
26
Steam iron: bill of materials
Component Material Mass (kg) Shaping Process
Body Polypropylene 0.15 Molded
Heating element Nickel Chromium Alloys
0.03 Drawn
Base Stainless steel 0.80 Cast
Cable sheath, 3 meter Polyurethane 0.18 Molded
Cable core, 3 meter Copper 0.05 Drawn
Plug body Phenolic 0.037 Molded
Plug pins Brass 0.03 Rough Rolling
Answer.
Phase Energy (MJ)
Energy (%)
CO2 footprint (kg)
CO2 footprint (%)
Material 108 6.9 5.88 6.1 Manufacture 18.2 1.2 1.37 1.4 Transport 6.23 0.4 0.442 0.5 Use 1.44e+03 91.5 89.1 92.0 Disposal 0.887 0.1 0.0621 0.1 Total (for first life) 1.57e+03 100 96.9 100 End of life potential -75.1 -3.27
The bar chart shows the distribution of energy commitment over the phases of life. The Use
phase dominates, accounting for 92% of the total energy; so much that the other phases
are hardly visible on this scale of graph. 1/6 of the used energy is to heat up the base of
the Iron to working temperature. Requiring energy
Q = m Cp ΔT

Exercises with Worked Solutions – The Eco Audit Tool
www.teachingresources.grantadesign.com M.F. Ashby 2017
27
Where m is the mass of the base of the iron (0.8 kg), Cp is its specific heat and ΔT is the
temperature interval through which it is heated. Thus energy could be saved by reducing
the mass of the base of the iron or by selecting a material for it with a lower specific heat,
or both.
27. A 970 Watt toaster weighs 1.2 kg including 0.75 m of cable and plug. It takes 2 minutes
15 seconds to toast a pair of slices. It is used to toast, on
average, 8 slices per day, so it draws its full electrical
power for 9 minutes (540 seconds) per day over its design
life of 3 years. The toasters are made locally, in the USA,
– transport energy and CO2 are negligible. At end of life it
is dumped. Create an Eco Audit for the toaster using CES
EduPack.
Which phase dominates? How could the energy efficiency be increased in this phase?
Now change the % of Recycled content of the materials used to 100% where available in
the drop down menu. How much effect does this have?
Toaster: bill of materials
Component Mass (kg)
Material Shaping Process
Body 0.24 Polypropylene Molded
Heating element 0.03 Nickel-chromium Drawn
Inner Frame 0.93 Low carbon steel Rough Rolling
Cable sheath, 0.75 meter 0.045 Polyurethane Molded
Cable core, 0.75 meter 0.011 Copper Drawn
Plug body 0.037 Phenolic Molded
Plug pins 0.03 Brass Rough Rolling
Exercises with Worked Solutions – The Eco Audit Tool
www.teachingresources.grantadesign.com M.F. Ashby 2017
28
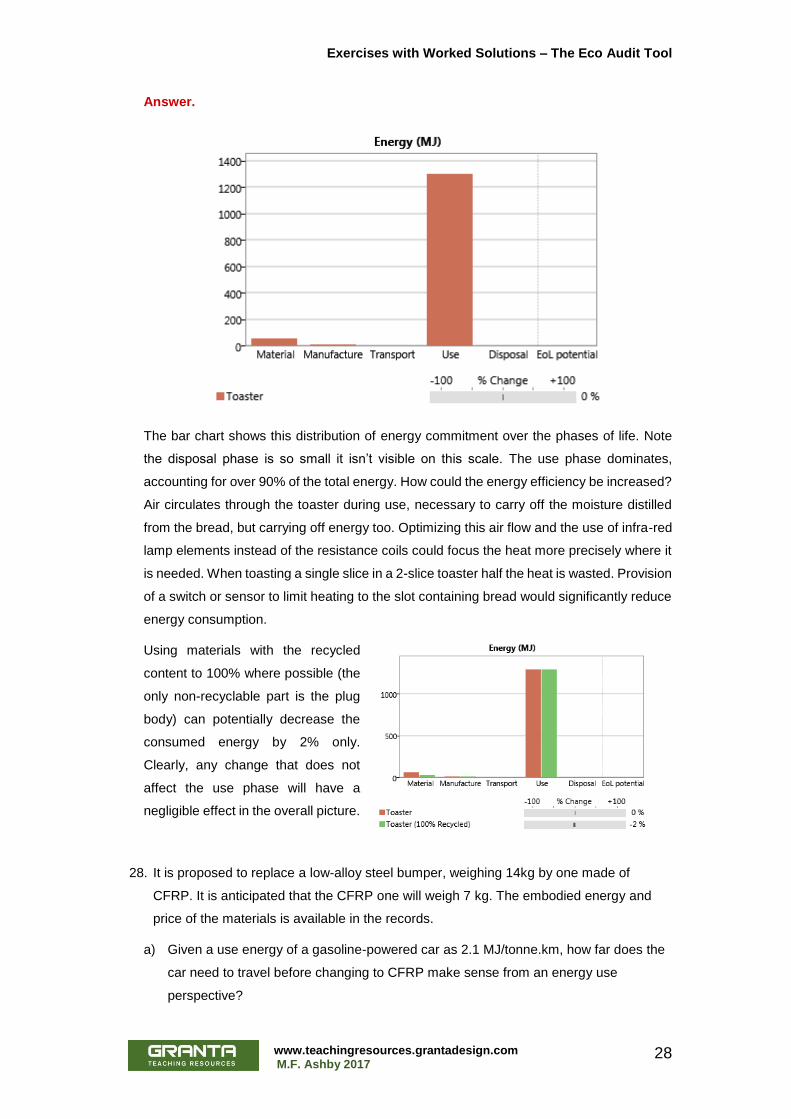
Answer.
The bar chart shows this distribution of energy commitment over the phases of life. Note
the disposal phase is so small it isn’t visible on this scale. The use phase dominates,
accounting for over 90% of the total energy. How could the energy efficiency be increased?
Air circulates through the toaster during use, necessary to carry off the moisture distilled
from the bread, but carrying off energy too. Optimizing this air flow and the use of infra-red
lamp elements instead of the resistance coils could focus the heat more precisely where it
is needed. When toasting a single slice in a 2-slice toaster half the heat is wasted. Provision
of a switch or sensor to limit heating to the slot containing bread would significantly reduce
energy consumption.
Using materials with the recycled
content to 100% where possible (the
only non-recyclable part is the plug
body) can potentially decrease the
consumed energy by 2% only.
Clearly, any change that does not
affect the use phase will have a
negligible effect in the overall picture.
28. It is proposed to replace a low-alloy steel bumper, weighing 14kg by one made of
CFRP. It is anticipated that the CFRP one will weigh 7 kg. The embodied energy and
price of the materials is available in the records.
a) Given a use energy of a gasoline-powered car as 2.1 MJ/tonne.km, how far does the
car need to travel before changing to CFRP make sense from an energy use
perspective?
Exercises with Worked Solutions – The Eco Audit Tool
www.teachingresources.grantadesign.com M.F. Ashby 2017
29
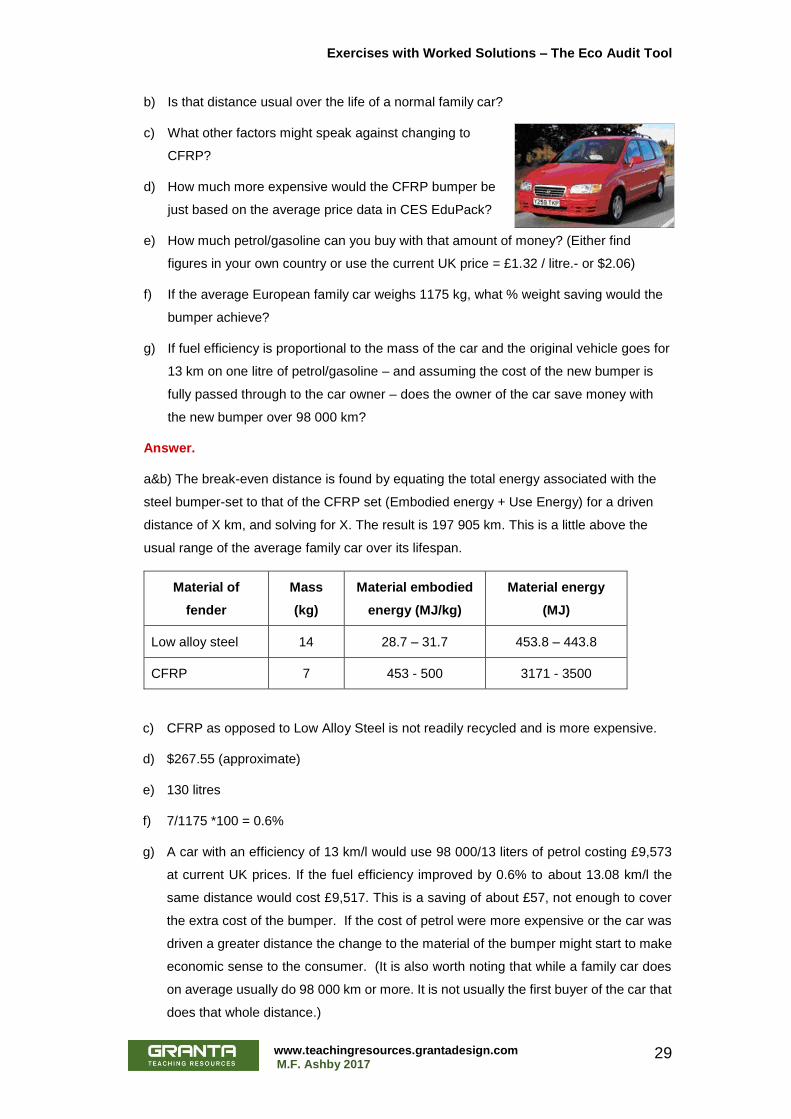
b) Is that distance usual over the life of a normal family car?
c) What other factors might speak against changing to
CFRP?
d) How much more expensive would the CFRP bumper be
just based on the average price data in CES EduPack?
e) How much petrol/gasoline can you buy with that amount of money? (Either find
figures in your own country or use the current UK price = £1.32 / litre.- or $2.06)
f) If the average European family car weighs 1175 kg, what % weight saving would the
bumper achieve?
g) If fuel efficiency is proportional to the mass of the car and the original vehicle goes for
13 km on one litre of petrol/gasoline – and assuming the cost of the new bumper is
fully passed through to the car owner – does the owner of the car save money with
the new bumper over 98 000 km?
Answer.
a&b) The break-even distance is found by equating the total energy associated with the
steel bumper-set to that of the CFRP set (Embodied energy + Use Energy) for a driven
distance of X km, and solving for X. The result is 197 905 km. This is a little above the
usual range of the average family car over its lifespan.
Material of
fender
Mass
(kg)
Material embodied
energy (MJ/kg)
Material energy
(MJ)
Low alloy steel 14 28.7 – 31.7 453.8 – 443.8
CFRP 7 453 - 500 3171 - 3500
c) CFRP as opposed to Low Alloy Steel is not readily recycled and is more expensive.
d) $267.55 (approximate)
e) 130 litres
f) 7/1175 *100 = 0.6%
g) A car with an efficiency of 13 km/l would use 98 000/13 liters of petrol costing £9,573
at current UK prices. If the fuel efficiency improved by 0.6% to about 13.08 km/l the
same distance would cost £9,517. This is a saving of about £57, not enough to cover
the extra cost of the bumper. If the cost of petrol were more expensive or the car was
driven a greater distance the change to the material of the bumper might start to make
economic sense to the consumer. (It is also worth noting that while a family car does
on average usually do 98 000 km or more. It is not usually the first buyer of the car that
does that whole distance.)

Exercises with Worked Solutions – The Eco Audit Tool
www.teachingresources.grantadesign.com M.F. Ashby 2017
30
29. Open up the Eco Audit File for a family car in the Eco Audit Tool at level 2. The car is
manufactured in Germany and delivered to
the US show room by sea freight (distance
10 000 km) followed by delivery by heavy
truck over a further 250 km. Add in these
transport stages. The car has a useful life
of 10 years, and will be driven on average
24 820 km per year.
Review the Eco Audit report. Which phase of life consumes most energy? The inherent
uncertainty of current data for embodied and processing energies are considerable – if
both of these were in error by a factor of 2 either way can you still draw firm conclusions
from the data? If so, what steps would do most to reduce life-energy requirements?
Answer.
The figure shows the bar chart based on the data. Even with a colossal allowance for the
imprecision of the base-line data the conclusion is inescapable: the use-phase of the
vehicle remains the dominant contribution to life-energy consumption. Material choice
should focus first on reducing vehicle mass since it is this that most directly correlates with
fuel consumption. It is essential to then check that the consequent change in embodied
energy of the material choice has not negated the gain resulting from the lower mass, using
the method of the previous exercise.
30. Use the Eco Audit Tool to conduct a CO2 Eco Audit for the patio heater shown here. It is
manufactured in SE Asia and transported using sea freight 8 000 km to the US where it
is sold and used.
It weighs 24 kg, of which 17 kg is rolled stainless steel, 6 kg is rolled medium carbon
steel, 0.6 kg is cast brass and 0.4 kg is injection-molded polypropylene.
In use it delivers 14 kW of heat (“enough to keep 8 people warm”) while consuming 0.9 kg
of propane gas (LPG) per hour. The heater is used in an open patio for 3 hours per day for
Exercises with Worked Solutions – The Eco Audit Tool
www.teachingresources.grantadesign.com M.F. Ashby 2017
31
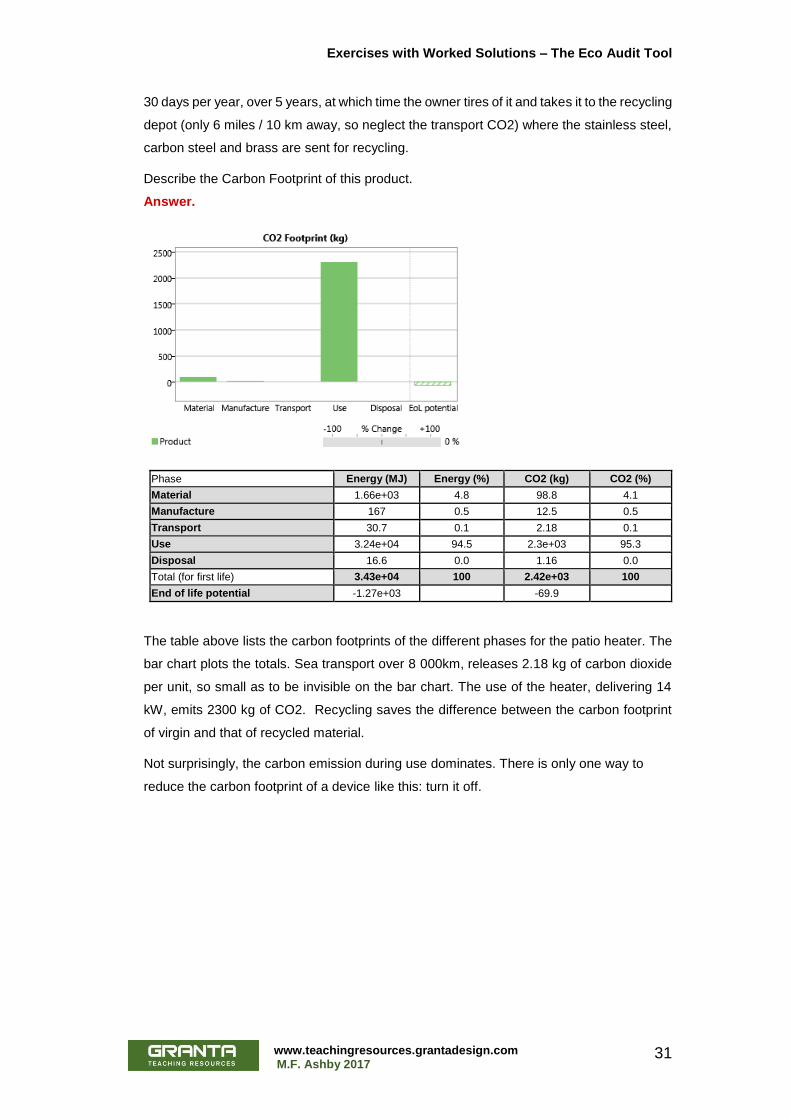
30 days per year, over 5 years, at which time the owner tires of it and takes it to the recycling
depot (only 6 miles / 10 km away, so neglect the transport CO2) where the stainless steel,
carbon steel and brass are sent for recycling.
Describe the Carbon Footprint of this product.
Answer.
Phase Energy (MJ) Energy (%) CO2 (kg) CO2 (%)
Material 1.66e+03 4.8 98.8 4.1
Manufacture 167 0.5 12.5 0.5
Transport 30.7 0.1 2.18 0.1
Use 3.24e+04 94.5 2.3e+03 95.3
Disposal 16.6 0.0 1.16 0.0
Total (for first life) 3.43e+04 100 2.42e+03 100
End of life potential -1.27e+03 -69.9
The table above lists the carbon footprints of the different phases for the patio heater. The
bar chart plots the totals. Sea transport over 8 000km, releases 2.18 kg of carbon dioxide
per unit, so small as to be invisible on the bar chart. The use of the heater, delivering 14
kW, emits 2300 kg of CO2. Recycling saves the difference between the carbon footprint
of virgin and that of recycled material.
Not surprisingly, the carbon emission during use dominates. There is only one way to
reduce the carbon footprint of a device like this: turn it off.
© M. F. Ashby, 2017
Open Educational Resources include:
▪ Interactive Case Studies
▪ Getting Started Guides
▪ Materials Property Charts
▪ Engineering Data Booklets
You can register for a user name and password for these resources here:
http://teachingresources.grantadesign.com
Other Resources Available:
▪ 25 PowerPoint lecture units
▪ Exercises with worked solutions
▪ Recorded webinars
▪ Posters
▪ White Papers
▪ Solution Manuals
Reproduction
These case studies are Open Educational resources. You can reproduce these
resources in order to use them with students. However they remain copyright
Professor Mike Ashby and Granta Design. Please make sure that Mike Ashby
and Granta Design are credited on any reproductions. You cannot use these
resources for any commercial purpose.
We try hard to make sure these resources are of a high quality. If you have any
suggestions for improvements, please contact us by email at
Author
Professor Mike Ashby
University of Cambridge, Granta Design Ltd.
www.grantadesign.com
www.eng.cam.ac.uk
Accuracy
www.teachingresources.grantadesign.com
Granta’s Teaching Resources website aims to support teaching of materials-related courses in Engineering, Science and Design.
The resources come in various formats and are aimed at different levels of student. This resource is part of a set of resources created by Professor Mike Ashby and Granta Design to help introduce materials and materials selection to students.
The Teaching Resources website also contains other resources donated by faculty at the ̴1000 universities and colleges worldwide using Granta’s CES EduPack, and includes both resources that require the use of CES EduPack and those that don’t.