Embed Size (px)
Citation preview

12003 gtz OE [email protected]
Pretoria / South Africa 11- 13 June 2003
Exercises forFUEL and VEHICLE Taxation
in African Countries
Workshop Excercises
by
Dr. Gerhard P. MetschiesIm Brühl 26
65835 LiederbachTel.: ++49-6196-79-1354
Germany
Harmonisation of Excise Taxes

22003 gtz OE [email protected]
10 Libya5 Zimbabwe
19* Angola19* Egypt, Arab Rep.20* Nigeria22 Algeria
28 Ghana29 Tunisia
35 Somalia30* Sudan
36* Eritrea
43 South Africa41 Botswana
46 Mozambique45 Namibia
46* Gambia, The51* Sierra Leone52* Ethiopia54 Benin56 Togo58* Burundi
63 Mauritania66* Malawi66* Guinea67 Tanzania68* Cameroon69 Mali69 Gabon69 Congo, Rep.70 Congo, Dem. Rep.70 Kenya72 Zambia
75 Senegal77 Niger79 Chad
83 Uganda83 Burkina Faso84* Rwanda85 Cote d'Ivoire87 Morocco
98* Djibouti100 C.A.R.
108 Madag.
Libya 8Zimbabwe 5
Angola 13Egypt, Arab Rep. 8
Nigeria 19Algeria 10
Ghana 23Tunisia 19
Sudan 24Somalia 29
Eritrea 25Botswana 38
South Africa 40
Mozambique 43Gambia, The 40
Sierra Leone 50Ethiopia 32
Benin 41Togo 46
Burundi 54Mauritania 39
Malawi 62Guinea 56
Tanzania 61Cameroon 57
Mali 55Gabon 53
Congo, Rep. 48Congo, Dem.R. 69
Kenya 56Zambia 60
Senegal 53Niger 55
Chad 79Uganda 70
Burkina Faso 62Rwanda 84
Cote d'Ivoire 60Morocco 55
Djibouti 54C.A.R. 87
Madagascar 65
Namibia 43
90 80 70 60 50 40 30 20 10 0 10 20 30 40 50 60 70 80 90 100 110
[Source: Metschies, gtz survey Dec. 2002]
Red base lines:
Crude OilSpot Price
„Brent“(26 US$ per
barrel= 16 US Cents
per Liter)
Green base lines:
Normal Sales Price(excluding Fuel Taxation)
(31-32 US Cents per Liter)
* Normal grade gasoline, as super gasoline is not commonly available in the country
Comparison of Fuel Prices in Africaas of 10 December 2002
Diesel[US Cents per Litre]
Super Gasoline[US Cents per Litre]
Note: The “Red Base Line” represents the world market price for crude oil (North Sea Brent) at Rotterdam port on 10th December 2002. This price is by chance roughly the average crude oil price during the year 2002.The “Green Base Line” represents the hypothetical sales price of the refined and distributed MINERAL FUEL, if it would be sold as a normal commercial good e.g. MINERAL WATER. Therefore the green line marks the border between fuel subsidy & taxation. In the case of self-producing oil-countries this green line is supposed to be valid as well: Assuming that the oil production could have been sold abroad, fuel prices are subsidised at the expense of the country’s energy sector.
International Fuel Prices
32003 gtz OE [email protected]
Algeria53 (-) Libya
246 (-)
Tunisia77 (1)
Egypt30 (7)
Morocco51 (1)
Mauritania12 (-) Mali
4 (-)Niger5 (-) Chad
4 (1) Sudan7 (-)
Ethiopia2 (-)
Kenya11+ (2)
Uganda5 (3)
CongoDem. Rep.
19 (-) Tanzania5 (-)
Zimbabwe29 (-) Madagascar
7 (-)
South Africa155 (4)
Botswana70 (1)
Namibia81 (2)
Angola19 (-)
Mozambique5 (-)
Malawi6 (-)
Congo Rep.17 (-)
Cameroon12 (-)
Nigeria13 (3)
Burkina Faso6 (10)
Sengal14 (1)
Guinea5 (-)
GuineaBissau12 (-)
Togo15 (12)
Benin9 (42)
Equat.Guinea
7 (-) Gabon35 (-)
Lesotho20 (-)
Swaziland79 (3)
Central African Rep.5 (-)
Somalia1 (-)
Djibouti21 (-)
Eritrea2 (-)
Rwanda4 (-)
Burundi6 (-)
Gambia15 (-)
Ghana8 (-)
Liberia15 (-)
Zambia13 (-)
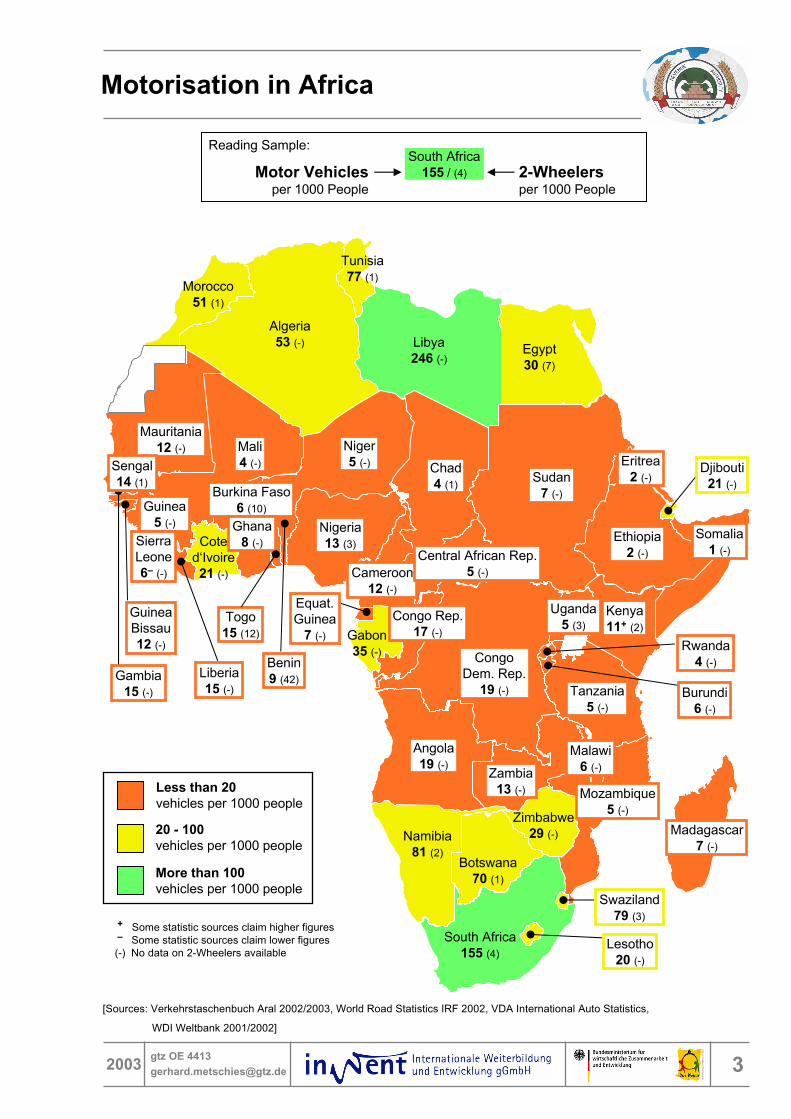
20 - 100vehicles per 1000 people
More than 100vehicles per 1000 people
Less than 20vehicles per 1000 people
SierraLeone6– (-)
Coted‘Ivoire21 (-)
+ Some statistic sources claim higher figures– Some statistic sources claim lower figures(-) No data on 2-Wheelers available
Motorisation in Africa
[Sources: Verkehrstaschenbuch Aral 2002/2003, World Road Statistics IRF 2002, VDA International Auto Statistics,
WDI Weltbank 2001/2002]
Motor Vehiclesper 1000 People
South Africa155 / (4) 2-Wheelers
per 1000 People
Reading Sample:

42003 gtz OE [email protected]
Taxation is generally deemed an act of national sovereignty. Often, however, a comparison with the price situation in neighboring countries is left out of the internal political decisionmaking process.
The continent-by-continent fuel price tables included in chapter 6 summarize the cross-border situation. For instance, the comparison of fuel prices in Nigeria and Cameroon yields a fuel price ratio of 1 : 2. And since most developing countries' borders cannot be controlled effectively, there is a enormous potential for fuel smuggling – and that potential is being exploited.
It has been estimated that some 20 % to 50 % of all fuel consumed in Benin, Togo, Ghana, Burkina Faso, Mali, Niger, Cameroon and Chad is of non-taxed origin.6This equates to millions of US $ in lost national revenues, while the state budget frequently does not even suffice to pay the salaries of state employees on time (with such payments often lagging a quarter of a year behind schedule).7The price data and other figures stated in this report provide a basis for a more detailed calculation of the effects of fuel smuggling. However, the only real remedy for the problem may lie in international agreements on harmonization of taxation levels on the basis of regional customs unions (e.g., ECOWAS and UDEAC in West and Central Africa), provided they are supported by the individual governments.
Legal Fuel Taxation Exemptions:Farmers, Fisheries, Military & Presidency
Privileges are sought by many groups of the society. As the general trend persists to rise fuel prices, world-wide tax exemptions are granted in different fields:
• Use of diesel in the subsidized agriculture is often exempted from fuel tax. In European countries the distinction of agricultural use is made by colouring this special use of diesel. Nevertheless a high degree of misuse (for private diesel cars etc.) is known.
• Social reasons are brought forward, first to protect the poor. Thus for instance the small fisheries using gazoline in their motor-driven canoes had to be protected in the SENEGAL. Misuse had been stated, when some years later8 nearly half the gazoline consumption of the country was due to fishermen needs.
• The military in many countries play a special role. Therefore privileges of untaxed fuel are often used and control even for private military use is missing. It may happen(MADAGASCAR 1998) that even a rural roads study cannot be executed as planned as any information on fuel sector revenues are explicitly hindered by Ministries.
• The presidency may execute special powers by authorizing local businessmen to direct import of fuel (as by truck from NIGERIA to BURKINA FASO) thus alleviating local shortages, or other members of the governing family (as reported from former Zaire or Mali) do so.
• Fuel tax exemptions for railways and public transport even in cases, where no fuel tax is used for the road sector, are common in many countries.
The conclusion drawn from the examples cited above is, that ememptions even from high fuel taxes should generally not be granted and that subsidies, if intended, should be managed by other ways, preferably by transparent direct transfers to the individual recipients.
6 Ian Heggie, Managing and Financing of Roads, p. 687 Metschies, G., Note on fuel taxation in Togo, dated Dec. 6, 19958 Findings of an International Bank on road Sector Financing in 1982
Loss of Fuel Revenues

52003 gtz OE [email protected]
Poland - Fuel Import undermines Transport Policy of Government9
In 2002 the Polish Fuel Distributors Association informed the Polish Government on the size of the fuel smuggle between Belarus and Poland. It estimated a yearly loss of Taxes of 570 Million Euro, as truckers enlarged their nomal 200 litre tank up to 1 500 liters and sold the cheap Belarus fuel (Dieselprice of 36 US cents against 68 US cents per litre in Poland) all over Eastern Poland. The Polish government was urged to officially introduce a decree of limiting the tank size to the European limit of 200 litres10 starting 1 January 2003.This amount of lost tax revenues would have been sufficient for constructing 160 km of new motorways every year. But Budget Expenditures for all roads of the country were 582 million US$ only (1997), out of which 40% had to be paid by foreign sources8.
8 NEI Study on Road Transport Charges in SOE Countries, Annex 12, Dec 20009 Vereinigung Deutscher Kraftwagenspediteure VKS, 3/200310 The same problem was found in 1985 at the Malawi/Zambia border, when trucks with special 1000 litres tanks were put into service11 Ivory Coast 199512 Details of illicit traffic in motor fuels in Westafric are given in: METSCHIES/Rausch; „Financing road maintenance in Westafrica“,
GTZ – Eschborn 2000, p. 163-168.
West Africa - Missing Transparancy in Transit Transport and Fuel Administration
Fuel supply by over-land transport to landlocked countries is a special problem.It may be solved as in the Cote d’Ivoire, where transit tankers to Mali and Burkina Faso were given tax exemption (“duty-free”) clearances. But if the number and amount of clearance certificates is not sufficiently controlled11, tanker trucks may “vanish” or be half-unloaded on the transit way12.Another reglementation is to allow the transport of taxed fuel only. Preferably this tax should be that one of the destination country. But trucks passing to transit countries with higher local taxes may still find it profitable to sell part of their cargo underway.
In many countries fuel administration of imports is executed by parastatal bodies. Their control should be a primary concern of the Auditor General
Negligence and lack of government control on half-legal practices in the fuel sector may load to substantial losses of tax revenues.
Thus the missing government order to limit the size of truck tanks to max. 200 litres may cause a revenues loss, bigger than all state expenditures for roads (see Box Poland).Or the missing counting of control for transit fuel tankers leads to the same effect (see Box West Africa).Or the taxation point of fuel is not centralised at the refinery, but decentralised to the fuel companies which fail to declare their full distribution of fuel (see Box Kazakhstan).
Tax Evasion by Lack of Government Control

62003 gtz OE [email protected]
13 NEI Study on Road Sector Finance 2000
Theoretically tax collection from fuel is easy. Contrary to the Value Added Tax (VAT) not all the thousends of output sources have to be identified (like all the shops, craftsmen, factories etc. all over the country) but only the very few input places like the (often only) refinery or the import harbour. A few dozen of state officials may be sufficient.
Nevertheless experience shows that collection ratios are often low, as for instance 57% only in Kazakhstan13. That means that even the control of the few local fuel companies is inadaquate. Similar situations prevail in other former CIS countries, if seats in Parliament are taken preferably by local profiteers enjoying parliamentary imunity.To increase tax collection rates from refineries and fuel companies to 90 and 100% at short notice are in deed rewarding conditionalities by foreign donors and international banks.
But practical control is difficult and has to operate at different levels:• at the state fuel import organisations, which lack audited annual reports and• at the state-owned refineries, which may – as on the West-African coast – form a cooperation
chain of supply reaching from Gabun, Cameroon, Nigeria up to Ghana, Ivory Coast and Sierra Leone (See Box Cote d’Ivoire)
Cote d’Ivoire – Foreign Inspection Leakage
The lobby of profiteers is powerful and has cash at hand, even to pay the lawyers:
When conditionalities imposed on the Abidjan refinery (1997) asked for an inspection of incoming fuel ships a neutral foreign customs control company was called in. But in the conditionalities it was mentioned that the Swiss company should control only some of the incoming ships, not all of them.
Tax Evasion by Lack of Government Control

72003 gtz OE [email protected]
1 Details can be found in the previous 2nd edition of Fuel Prices and VehicleTaxation, page 59
Fuel Contrabant in GHANA – over 25 years of tradition
In the late 1970s in GHANA fuel prices were 3-4 times as high as in neighbouring French-speaking CFA countries. After Ghana’s economic break down of 1984 this ratio improved. But Ghana’s new situation as of 1991 run into difficulties as shown in the following table:
The above table compares the situation before and after the 50 % devaluation of the CFA Franc in 1994, which lead – calculated in US $ terms – to the above fuel price reductions in all the countries neighbouring Ghana1.
But remarkably, Ghana followed suite in dropping the local fuel prices. It dropped it even more than all the neighbouring countries cutting the sales prices from 1991 to 2002 nearly to the half. By this way the approximate brut profit margin of the contrabant trade of approximately 40 US cents per litre diesel and 50 US cents per litre gasoline could be maintenained throughout the years. Cross-border transport routes are well established, thus in the 1984 crisis the World’s biggest cacao crop could be sold to neighbouring countries.Comparing the 1991 situation with that one of 2002 reveals also that formerly the brut margin of contraband between Burkina and Ghana was approximately equivalent to the fuel sales price in Ghana, but in 2002 this margin equals nearly double the Ghana price. It seems that interests of the state itself dispose of no lobby and during the presidential campaign of 2001 even the Value Added Tax on fuel was abolished.Although low fuel prices are officially defended (“special contracts with Nigeria”), the present problem is, that fuel prices are below borderline to subsidisation! This means that the former contraband tolerance of the state, which formerly draw some tax profits from the low taxed smuggled fuel, has vanished.This situation has serious consequences to the state finances, including the financing of the formerly established Road Fund.
Gasoline Price
Diesel Price
GazolinePrice
Diesel Price
20021991
28235343Ghana
836210384Burkina Faso
8560124115Cote d’Ivoire
56468166Togo
US Cents per LitreCountry
Nigeria
BurkinaFaso
Coted‘Ivoire Togo
Ghana
Traditions are difficult to change. This holds true for fuel smugglers also, especially in West and Central Africa, where the English-speaking countries of Nigeria, Ghana and Sierra Leone traditionally followed a low-price policy for fuel, while the neighbouring French speaking countries continued the former French high taxation policy.
Fuel Contraband

82003 gtz OE [email protected]
The 7 most urgent cases for harmonisation and fuel price adjustments
As shown on the African fuel price map there are two oil producing countries in SubsaharanAfrica, whose low prices and incentives for contrabant distort the neighbouring regions.
1. NIGERIAs illicit fuel export affects direct neighbours as Cemeroon, Niger, Benin and also its indirect neighbours as Central African Republic, Chad, Burkina Faso, Mali and Togo. Official fuel prices in all these countries are 3 - 4 times as high as in Nigeria. Although and because fuel prices are rising in Nigeria, an international harmonisation should be reached before the Finance Ministry may profit from the contraband as well.
2. ANGOLA – after the end of civil war – experiences increased fuel smuggling into the neighbouring countries of Congo-Brazza, Congo-Kinshasa, Zambia and Namibia, where fuel prices on average are 4 times higher than in Angola. An increase of fuel prices in Angola would help also to balance the budget and lower the inflation.
In both cases all regional economies cooperation (as intended by ECOWAS, UDEAC, SADEC etc.) is stalled as long as the overdue harmonisation of the fuel prices is not in place.
As shown on the Asian fuel price map the most urgent candidates for fuel price adjustment are:
3. INDONESIA, whose subsidised fuel prices are the lowest in South and East Asia with diesel prices of half of those in India or China, and
4. RUSSIA (together with the Central Asian Republics), whose fuel prices are the lowest not only of all of European countries, but also lower than China and India.
Russia’s fuel prices are one third only of those of a comparable country as Turkey.
On the American Fuel Price Map the main issues are
5. VENEZUELA with fuel prices 5 to 10 times lower than in neighbouring Colombia or Brazil, and
6. ARGENTINA with the lowest fuel prices of all its neighbours as well as 7. PERU in similar position.
As all these countries experience severe budget problems, the adjustment of fuel prices would alleviate the state deficit and contribute to non-inflationary currencies also.
Experience from all over the world indicates that cross-border contraband can only be successfully opposed in the long-term by political agreements on international price harmonisation.
Theoretically an harmonisation may drive up or downwards, but practically in most cases an increase of prices may be the only solution. As political debates are driven by the self interest of the participants, detailed financially and economic studies on the profits and consequences of price harmonisation should by executed by independent consultants. In most cases all the governments involved will profit from a price harmonisation – at the expenses of private profiteers. On the basis of the data presented in the continent maps 7 countries were identified, where price harmonisations with neighbouring countries are most urgently needed.
Fuel Contraband

92003 gtz OE [email protected]
Estimates of potential state revenues from fuel taxation are meaningful not only for the Ministry of Finance, but also for the Ministry of Transport/Public Works. Indeed, present and potential revenues from fuel taxation are practically indispensable for the sector approach generally taken by international donors and banks.All such revenue estimates should be based on fuel consumption volumes and expressed in litres per year.For cases in which statistical data on annual fuel consumption are restricted, unreliable or even nonexistent (holds true in many developing countries), estimates can instead be based on the number of vehicles, mileage/distance traveled per year by each type of vehicle, and average fuel consumption (e.g., per 100 km).
Number of Vehicles
Detailed motorization figures (passenger cars and commercial vehicles) for individual countries are shown in the Annex.
Average Annual Travel Distance per Vehicle
In Western Europe the average km travelled per year per passenger car is about 15,000 km per year. In Eastern Europe the travel distance is only at about 10,000 km per year. Especially for developing countries no reliable data is available. The average distance for passenger cars in countries with no reliable data was estimated at 10,000 km per year.
12 100 kmGermany (2000)
15 200 kmGreece (2000)
15 000 kmAverage (roughly)
19 100 kmUnited States (1999)
16 700 kmUnited Kingdom (1999)
13 300 kmSwitzerland (2000)
14 100 kmSweden (2000)
14 800 kmPortugal (1998)
15 400 kmNetherlands (1999)
9 800 kmJapan (1999)
14 300 kmFrance (2000)
18 900 kmFinland (1999)
20 000 kmDenmark (2000)
15 000 kmBelgium (1998)
Average Distance travelled by a
Passenger Carper year
Western EuropeUSA, Japan
10 000 kmAverage (roughly)
9 600 kmSlovenia (2000)
7 900 kmSlovak Rep. (1999)
8 800 kmRomania (2000)
9 500 kmPoland (2000)
11 000 kmEstonia (2000)
9 900 kmCroatia (2000)
Average Distance
travelled by a Passenger Car
per year
Eastern Europe
Source: IRF, World Road Statistics 2002
Example for Estimation of Fuel Taxation Revenues: Germany

102003 gtz OE [email protected]
Average travel distance of commercial vehicles in Germany is 21 400 km per year in 2002. Buses (43 700 km p.a.), small trucks (24 300 km p.a.) and big trucks (81 600 km p.a.) travel much longer annual distances. But 33.9 % of all commercial vehicles in Germany belong to the group of diverse commercial vehicles (police vehicles, ambulance, trash lorries, …), which only travel an average of 8 000 km p.a..Therefore the average travel distance of commercial vehicles has been assumed as 25 000 km per year.
Fuel Consumption
Average fuel consumption for passenger cars has been estimated at a world wide average of 10 liters / 100 km and for commercial vehicles 25 liters / 100 km.Based on these figures, the annual fuel consumption levels have been estimated.
Calculation of Fuel Consumption: Example Germany
Total Fuel Consumption
[1000 million litres per year]
Average Fuel Consumption[litre / 100 km]
Average Travel
Distance[km per year]
Number of
Vehicles1
[‘000]
22.52521 4004 202Commercial Vehicles
75.4
53
D = A x B x C/100
12 100
B
1043 772Passenger Cars
CA
Germany
1 Aral Verkehrstaschenbuch 2002/2003
Workshop on Fuel Excise Taxes

112003 gtz OE [email protected]
The difference between the “Normal Sales Price (excluding fuel tax)” and the sales price at the service station is fuel taxation (or subsidies) – apart from minor differences in transportation costs, distribution costs and Value-Added-Tax on the untaxed sales price.
Calculation of Fuel Tax per Litre: Example Germany
Diesel / Gasoline Taxation
[US Cents per litre]
“Normal Sales Price(excluding fuel tax)”
[US Cents per litre]
Sales Price(including Fuel Tax)[US Cents per litre]
513182Diesel
71
G = E – F
103
E
32Super
F
Germany
The consumption levels of Diesel and Gasoline are similar in many countries. In Germany it was exactly 50% Diesel consumption and 50% Gasoline consumption in 20001. Lacking exact data especially in developing countries, it has bees assumed that consumption of Diesel equals consumption of Gasoline.
Calculation of Average Fuel Tax: Example Germany
Average Fuel Taxation[US Cents per litre]
Diesel/Gasoline Tax[US Cents per litre]
6151Diesel
71
G
Super
HGermany
The average fuel tax per litre multiplied with the total fuel consumption yields the fuel tax revenues.
Calculation of Fuel Tax Revenues: Example Germany
Fuel Taxation Revenues[Billion US$]
Average Fuel Tax[US $ per litre]
Total Fuel Consumption[1000 million litres per year]
460.6175.4
I = D x HHD
1 Aral Verkehrstaschenbuch 2002/2003
Workshop on Fuel Excise Taxes
122003 gtz OE [email protected]
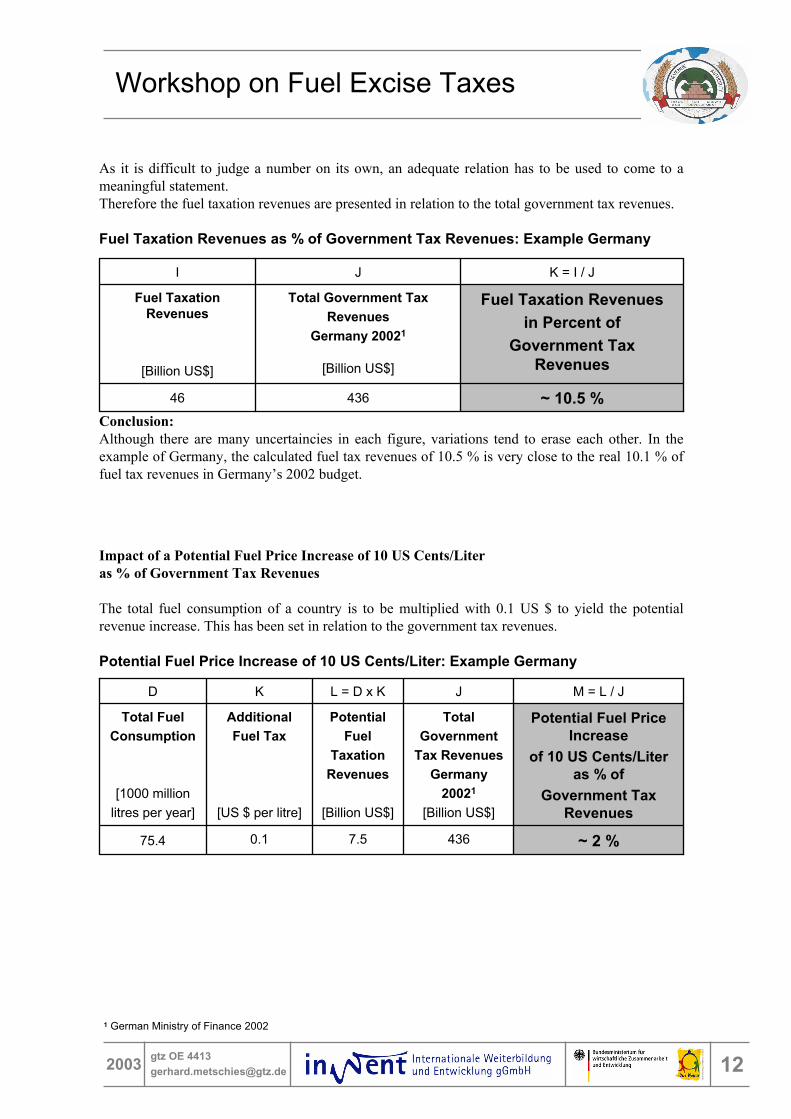
As it is difficult to judge a number on its own, an adequate relation has to be used to come to a meaningful statement.Therefore the fuel taxation revenues are presented in relation to the total government tax revenues.
Fuel Taxation Revenues as % of Government Tax Revenues: Example Germany
Fuel Taxation Revenuesin Percent of
Government Tax Revenues
Total Government Tax Revenues
Germany 20021
[Billion US$]
Fuel Taxation Revenues
[Billion US$]
~ 10.5 %43646
K = I / JJI
Impact of a Potential Fuel Price Increase of 10 US Cents/Literas % of Government Tax Revenues
The total fuel consumption of a country is to be multiplied with 0.1 US $ to yield the potential revenue increase. This has been set in relation to the government tax revenues.
Potential Fuel Price Increase of 10 US Cents/Liter: Example Germany
Potential Fuel Price Increase
of 10 US Cents/Literas % of
Government Tax Revenues
Total Government
Tax RevenuesGermany
20021
[Billion US$]
PotentialFuel
Taxation Revenues
[Billion US$]
AdditionalFuel Tax
[US $ per litre]
Total Fuel Consumption
[1000 million litres per year]
~ 2 %
M = L / J
436
J
7.50.175.4
L = D x KKD
Conclusion:Although there are many uncertaincies in each figure, variations tend to erase each other. In the example of Germany, the calculated fuel tax revenues of 10.5 % is very close to the real 10.1 % of fuel tax revenues in Germany’s 2002 budget.
1 German Ministry of Finance 2002
Workshop on Fuel Excise Taxes

132003 gtz OE [email protected]
A B C D E =AxBx0.1+CxDx0.25 F G = E x F H = E x 0.1
Country Name
Number ['000] 2000
Average Annual Travel
Distance [km]
Number ['000] 2000
Average Annual Travel
Distance [km]
Algeria 1186* 10000 395* 25000 3655 -16 -566 365Angola 216 10000 26 25000 379 -16 -59 38Benin 42 10000 13 25000 123 16 20 12Botswana 84* 10000 28* 25000 259 8 21 26Burkina Faso 51 10000 15 25000 145 41 59 15Burundi 31* 10000 10* 25000 94 25 23 9Cameroon 134* 10000 45* 25000 415 31 129 42Cape Verde 4 10000 1 25000 10 18 2 1Central African Republic 13* 10000 5* 25000 44 62 27 4Chad 24* 10000 8* 25000 74 47 34 7Congo, Dem. Rep. 720* 10000 240* 25000 2220 38 844 222Congo, Rep. 41 10000 14 25000 129 27 35 13Cote d'Ivoire 246* 10000 82* 25000 759 41 311 76Djibouti 10 10000 3 25000 29 45 13 3Egypt, Arab Rep. 1482 10000 442 25000 4245 -18 -764 424Eritrea 6 10000 0 25000 6 -1 0 1Ethiopia 77* 10000 26* 25000 240 11 25 24Gabon 34* 10000 11* 25000 103 30 30 10Gambia, The 14* 10000 5* 25000 45 12 5 5Ghana 113 10000 38 25000 351 -6 -21 35Guinea 29* 10000 10* 25000 92 30 27 9Kenya 245 10000 97 25000 851 32 268 85Lesotho 31* 10000 10* 25000 94 17 16 9Libya 922 10000 307 25000 2841 -23 -639 284Madagascar 86* 10000 29* 25000 267 55 147 27Malawi 47* 10000 16* 25000 147 33 48 15Mali 37* 10000 12* 25000 112 31 34 11Mauritania 25 10000 8 25000 75 20 15 8Morocco 1162 10000 317 25000 3143 40 1242 314Mozambique 61* 10000 20* 25000 186 13 24 19Namibia 109* 10000 36* 25000 334 13 42 33Niger 40 10000 16 25000 140 35 48 14Nigeria 1196* 10000 399* 25000 3690 -12 -443 369Rwanda 25* 10000 9* 25000 81 53 43 8Senegal 101 10000 34 25000 314 33 102 31Sierra Leone 22 10000 7 25000 66 19 12 7Somalia 5* 10000 2* 25000 18 0 0 2South Africa 4991* 10000 1664* 25000 15391 10 1539 1.539Sudan 172* 10000 57* 25000 528 -5 -24 53Swaziland 53* 10000 18* 25000 166 14 23 17Tanzania 122* 10000 41* 25000 378 33 123 38Togo 58* 10000 19* 25000 177 20 34 18Tunisia 577 10000 192 25000 1777 -8 -133 178Uganda 89* 10000 30* 25000 277 45 124 28Zambia 97* 10000 32* 25000 297 35 102 30Zimbabwe 326 10000 50 25000 639 -27 -169 64
Passenger Cars Commercial Vehicles
Potential Revenues from
additional Taxation of 10
US Cents / litre [million US $
per year]
Estimated Fuel
Taxation Revenues [million US $ per year]
Total Fuel** Consumption [million litres
per year]
Average*** Fuel
Taxation [US cents per litre]
Estimation of Fuel Taxation RevenuesAfrican Countries
* Number of Commercial Vehicles has been limited to 25% of all vehicles to minimize the influence of passenger cars classified as commercial vehicles. Exceeding numbers have been added to passenger cars.
** Specific average fuel consumption: passenger cars 10 litres / 100km; commercial vehicles 25 litres / 100 km*** Taxation is taken from the graphs in chapter 3.5 and 3.6 as difference between present sales price and Normal Sales Price
(borderline between taxation and subsidy). The average of gasoline and diesel taxation has been applied.[Sources: IRF World Road Statistics 2002; Worldbank 2000, Africa Transport Technical Note no. 30;
Aral Verkehrstaschenbuch 2002/2003]

142003 gtz OE [email protected]
* Average Exchange Rate of Nov/Dec of the concerned fiscal year has been used** International Monetary Fund, Government Finance Statistics Yearbook 2002*** The concerned fiscal year ends at the specified date in the year mentioned in the neighbouring column
[Sources: IMF Government Finance Statistics Yearbook 2002; Oanda.com Exchange Rate Services]
Total Government Tax RevenuesAfrican Countries
Country NameCurrency of Tax
Revenues
Consolidated Government Tax
Revenues in [million lokal
currency]
most recent Fiscal Year available at
IMF**
Fiscal Year
Ending ***
Average Fiscal Year Exchange
Rate 1 US $ =
Consolidated Central
Government Tax Revenues [million US $]
Algeria Algerian Dinar 1.354.627 2001 Dec 31 78,96 17.156Botswana Pula 2.407 1997 Mar 31 3,50 688Burkina Faso CFA Fr 68.857 1992 Dec 31 283,16 243Cameroon CFA Fr 690.990 1999 Jun 30 588,52 1.174Congo, Dem. Rep. Congo Fr 61.420 2001 Dec 31 312,0* 197Congo, Rep. CFA Fr 215.400 2001 Dec 31 741,47 291Cote d'Ivoire CFA Fr 1.287.000 2001 Dec 31 730,34 1.762Egypt, Arab Rep. Egyptian Pound 42.450 1997 Jun 30 3,40 12.478Ethiopia Ethiopian Birr 6.296 1999 Jul 7 7,42 849Gambia, The Dalasi 744 1993 Jun 30Ghana Cedi 509.152 1993 Dec 31 649,06 784Guinea Guinea Fr 537.951 1999 Dec 31 1.341,66 401Kenya Kenya Shilling 146.509 1998 Jun 30 62,07 2.360Lesotho Maloti 1.693 1999 Mar 31 5,79 293Madagascar Madagaskar Fr 2.972.000 2000 Dec 31 6.616,27 449Morocco Dirham 86.440 1999 Dec 31 9,81 8.811Namibia Dollar 7.115 2001 Mar 31 7,35 968Rwanda Rwanda Fr 25.274 1992 Dec 31 133,35 190Senegal CFA Fr 576.200 2001 Dec 31 730,34 789Sierra Leone Leone 82.337 1999 Dec 31 897,47 92South Africa Rand 258.561 2002 Mar 31 9,54 27.111Swaziland Emalangeni 2.572 2001 Mar 31 7,13 361Tunisia Tunisian Dinar 6.946 2000 Dec 31 1,37 5.061Uganda Uganda New Shilling 1.072.900 2001 Jun 30 1.784,35 601Zambia Zambian Kwacha 1.378.300 1999 Dec 31 2.513,19 548Zimbabwe Zimbabwe $ 26.914 1997 Jun 30 10,79 2.495