Embed Size (px)
Citation preview
Exercise physiology
Exercise physiology
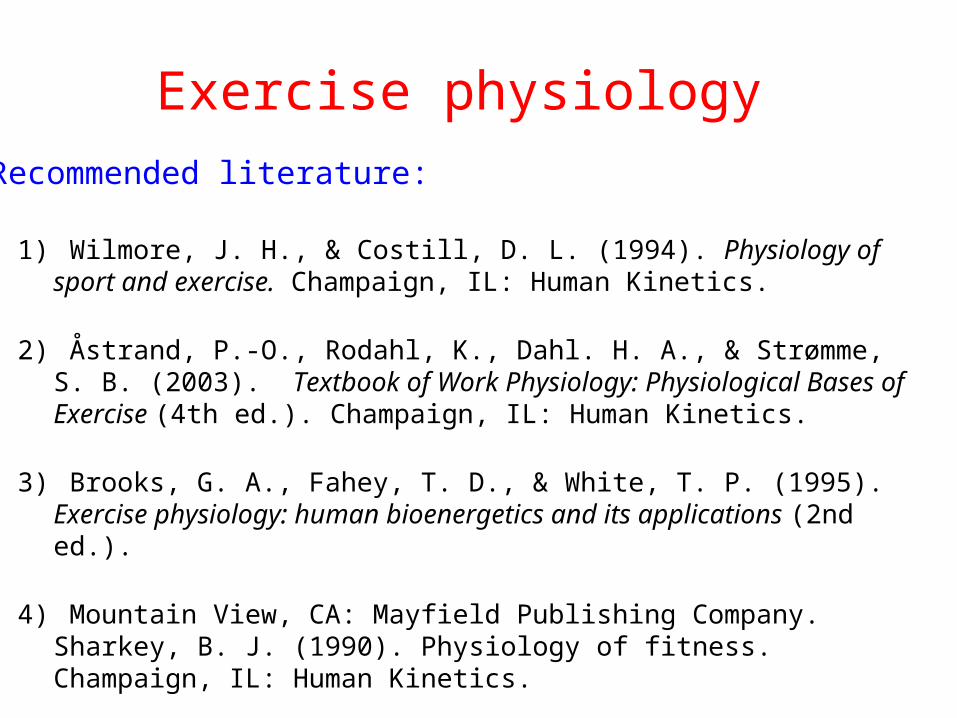
1) Wilmore, J. H., & Costill, D. L. (1994). Physiology of sport and exercise. Champaign, IL: Human Kinetics.
2) Åstrand, P.-O., Rodahl, K., Dahl. H. A., & Strømme, S. B. (2003). Textbook of Work Physiology: Physiological Bases of Exercise (4th ed.). Champaign, IL: Human Kinetics.
3) Brooks, G. A., Fahey, T. D., & White, T. P. (1995). Exercise physiology: human bioenergetics and its applications (2nd ed.).
4) Mountain View, CA: Mayfield Publishing Company. Sharkey, B. J. (1990). Physiology of fitness. Champaign, IL: Human Kinetics.
Recommended literature:
Exercise => causes the changes in human body
A) Acute response to one bout of exercise – e.g. ↑ heart rate (HR), ↑ body temperature (HR)B) Chronic adaptation to repeated bouts of exercise
- e.g. ↓ HR at rest and ↓ HR at exercise (same intensity)
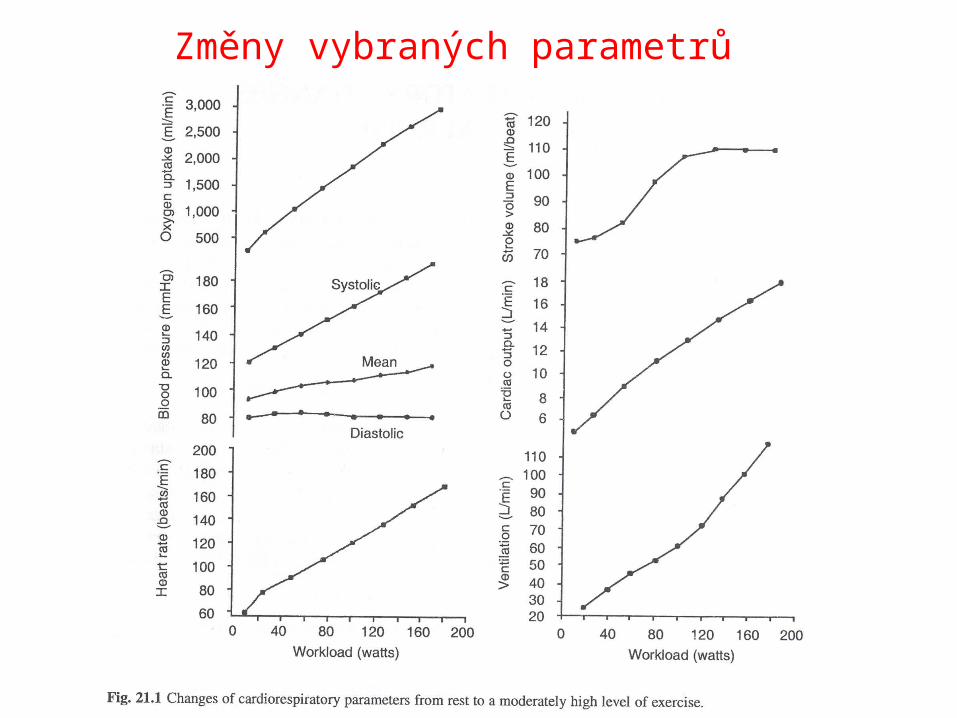
Změny vybraných parametrů
Exercise
Muscle activity requires energy. During exercise are energy demands enhanced.
- decrease of ATP, increase of ADP
=> causes the changes in human body
A) Acute response to one bout of exercise – e.g. ↑ heart rate (HR), ↑ body temperature (HR)B) Chronic adaptation to repeated bouts of exercise
- e.g. ↓ HR at rest and ↓ HR at exercise (same intensity)
Muscle contractile work = transforming chemical energy into kinetic (mechanical) energy
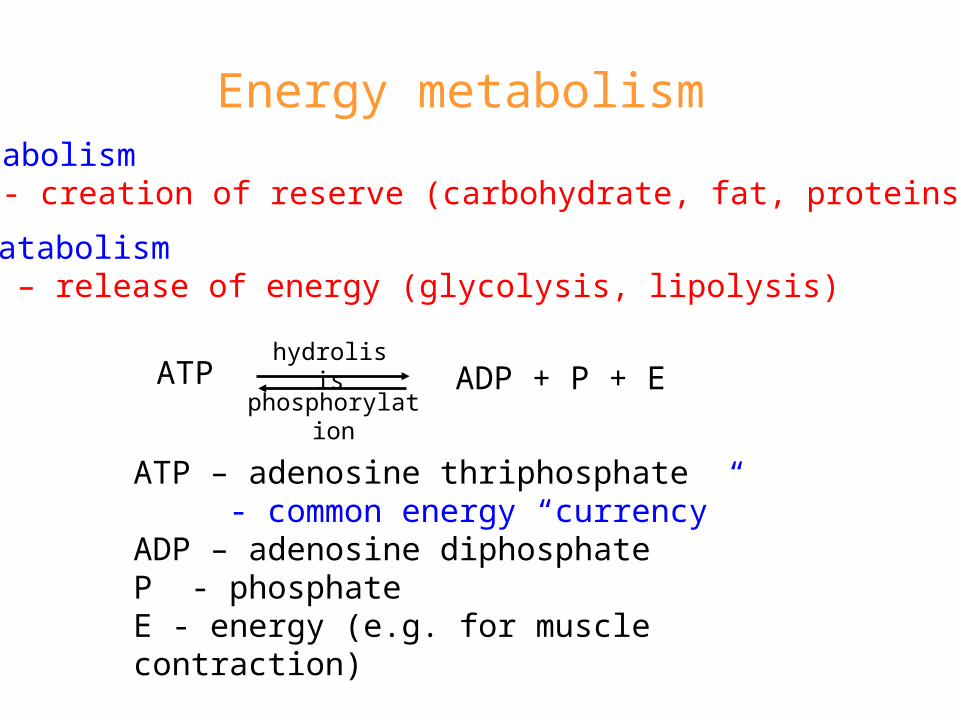
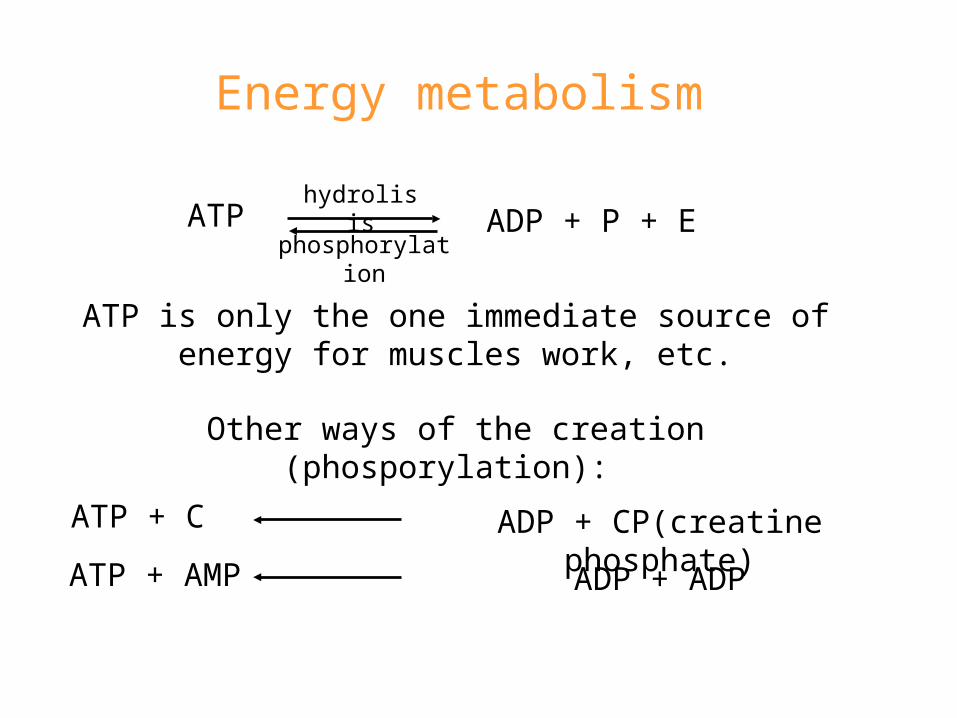
Energy metabolism
ATP
B) Catabolism – release of energy (glycolysis, lipolysis)
A) Anabolism- creation of reserve (carbohydrate, fat, proteins)
hydrolisisADP + P + E
ATP – adenosine thriphosphate- common energy “currency”
ADP – adenosine diphosphateP - phosphateE - energy (e.g. for muscle contraction)
phosphorylation
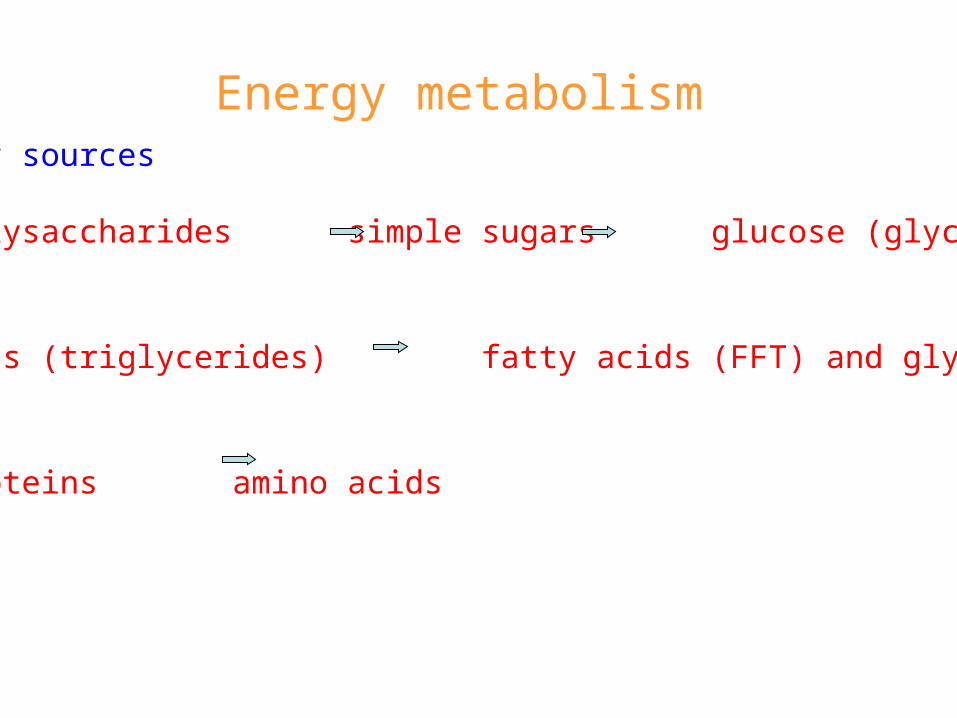
Energy metabolism Energy sources
1] Polysaccharides simple sugars glucose (glycogen)
2] Fats (triglycerides) fatty acids (FFT) and glycerol
3] Proteins amino acids
Energy metabolism
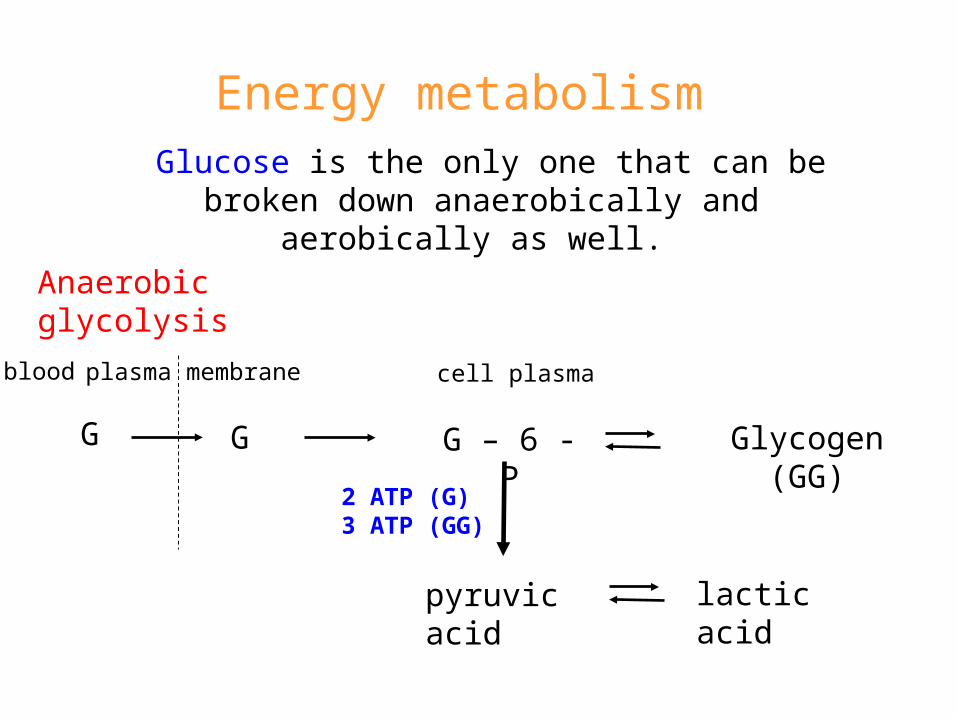
G
cell plasmaplasma membrane blood
G Glycogen (GG)G – 6 - P
Glucose is the only one that can be broken down anaerobically and aerobically as well.
Anaerobic glycolysis
pyruvic acid
2 ATP (G)3 ATP (GG)
lactic acid
Energy metabolism
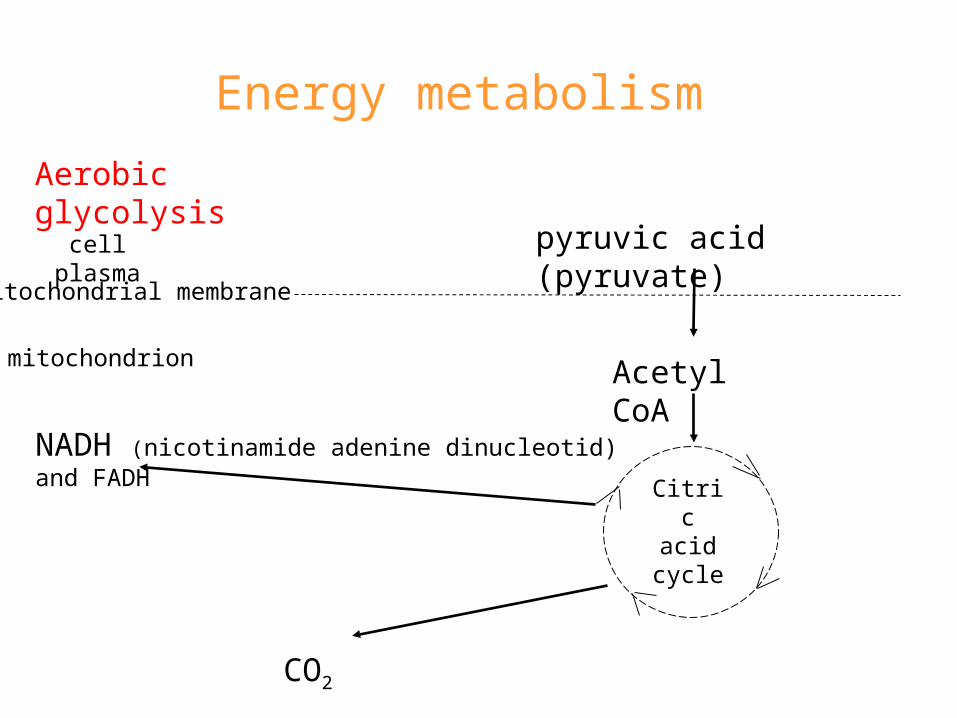
pyruvic acid (pyruvate)
Aerobic glycolysis
cell plasma
mitochondrial membrane
Acetyl CoAmitochondrion
Citric acid cycle
NADH (nicotinamide adenine dinucleotid) and FADH
CO2
Energy metabolism
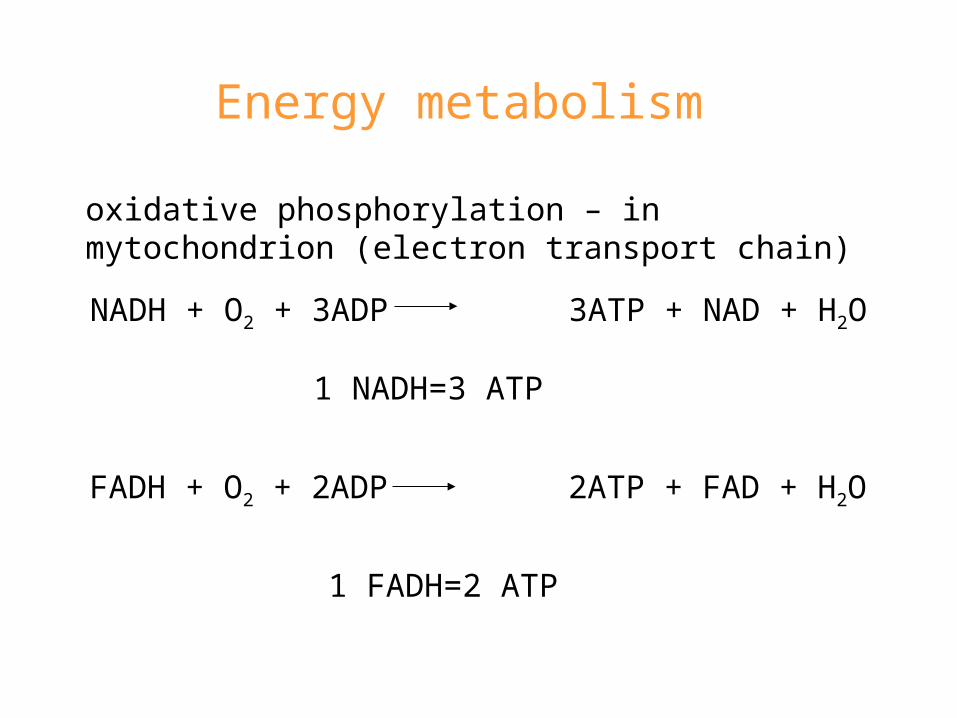
NADH + O2 + 3ADP 3ATP + NAD + H2O
oxidative phosphorylation – in mytochondrion (electron transport chain)
1 NADH=3 ATP
FADH + O2 + 2ADP 2ATP + FAD + H2O
1 FADH=2 ATP
Energy metabolism
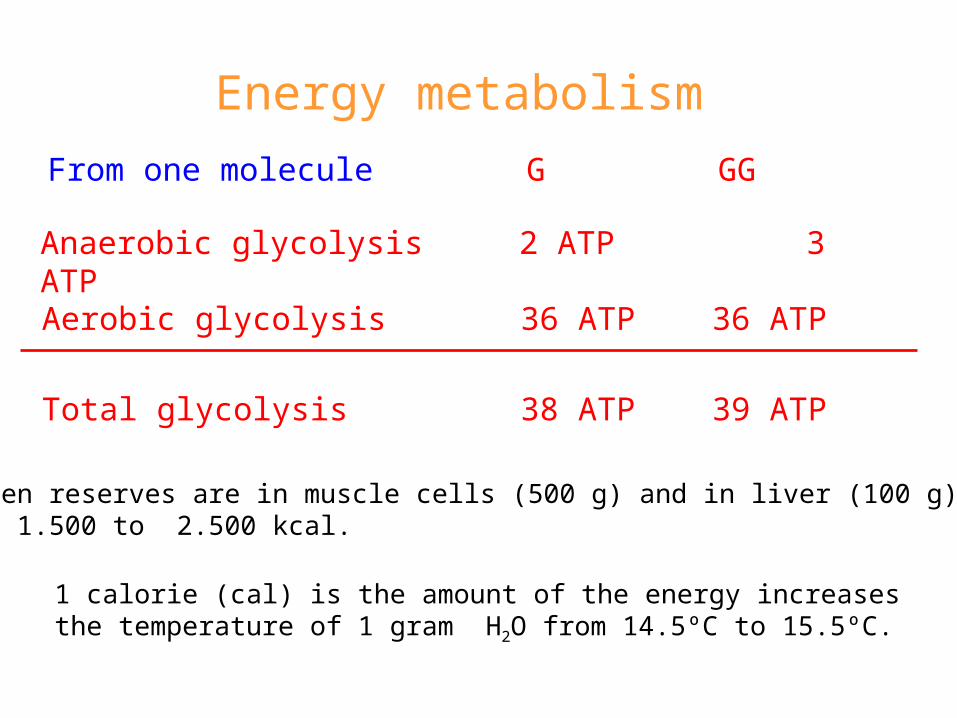
Aerobic glycolysis 36 ATP 36 ATP
Anaerobic glycolysis 2 ATP 3 ATP
From one molecule G GG
Total glycolysis 38 ATP 39 ATP
Glycogen reserves are in muscle cells (500 g) and in liver (100 g).- From 1.500 to 2.500 kcal.
1 calorie (cal) is the amount of the energy increases the temperature of 1 gram H2O from 14.5ºC to 15.5ºC.
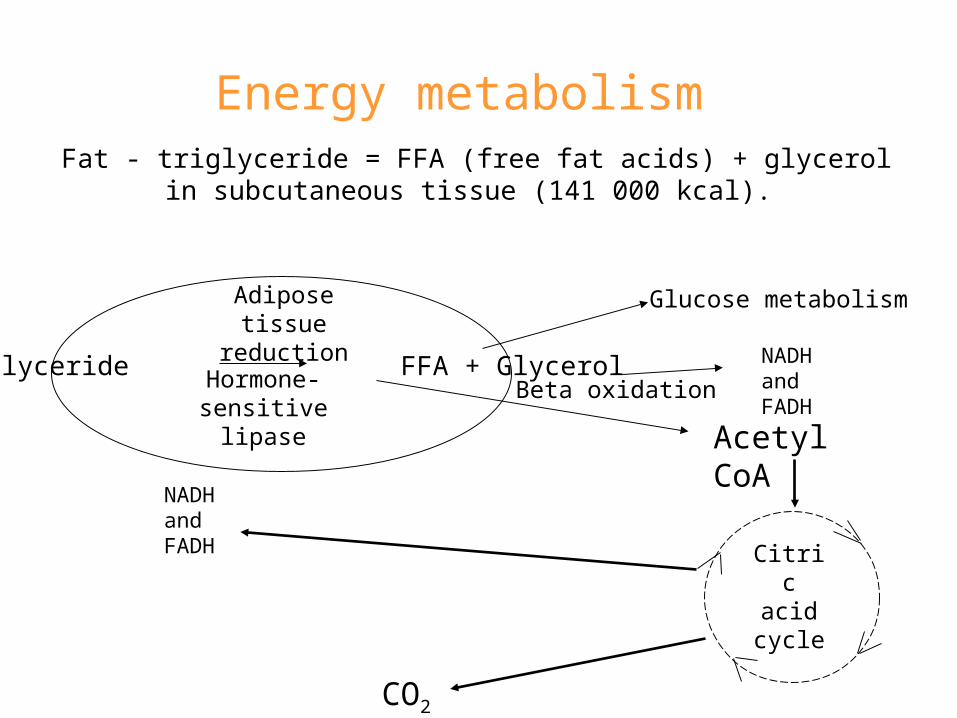
Energy metabolism Fat - triglyceride = FFA (free fat acids) + glycerol in subcutaneous tissue
(141 000 kcal).
Adipose tissuereduction
triglyceride FFA + Glycerol Hormone-sensitive lipase
Glucose metabolism
Beta oxidation
Acetyl CoA
Citric acid cycle
NADH and FADH
CO2
NADHand FADH
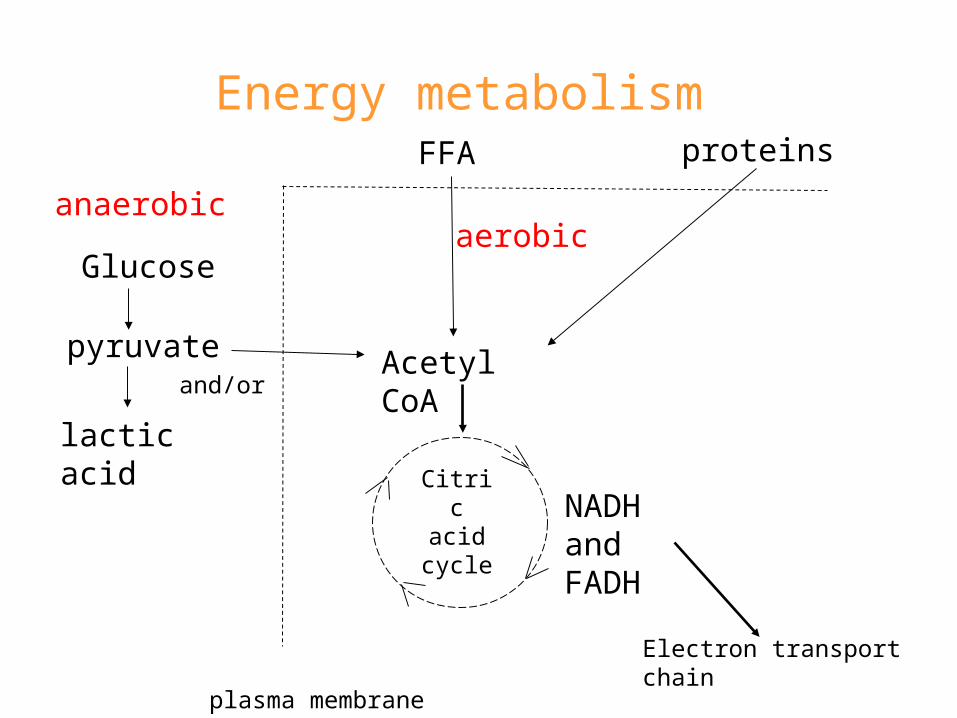
Energy metabolism
Acetyl CoA
Citric acid cycle
Glucose
FFA proteins
and/or
anaerobicaerobic
lactic acid
plasma membrane
NADH and FADH
Electron transport chain
pyruvate
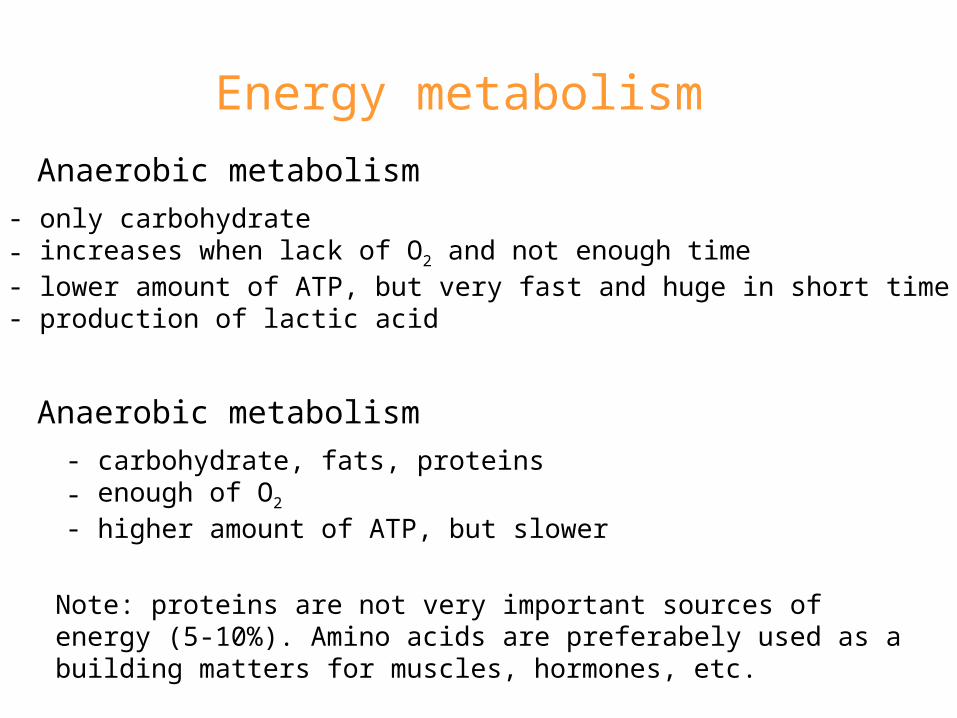
Energy metabolism Anaerobic metabolism
- only carbohydrate- increases when lack of O2 and not enough time- lower amount of ATP, but very fast and huge in short time- production of lactic acid
Anaerobic metabolism
- carbohydrate, fats, proteins- enough of O2
- higher amount of ATP, but slower
Note: proteins are not very important sources of energy (5-10%). Amino acids are preferabely used as a building matters for muscles, hormones, etc.
Energy metabolism
ATPhydrolisis
ADP + P + Ephosphorylation
ATP is only the one immediate source of energy for muscles work, etc.
Other ways of the creation (phosporylation):
ATP + C ADP + CP(creatine phosphate)
ATP + AMP ADP + ADP
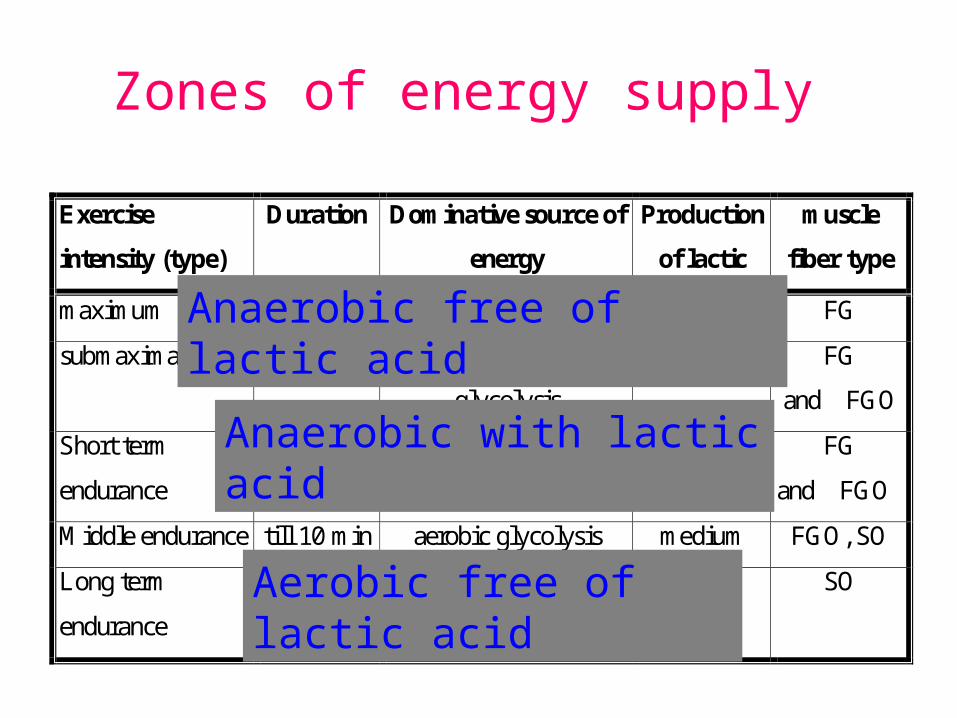
Exercise
intensity (type)
Duration Dominative source of
energy
Production
of lactic
muscle
fiber type
maximum till 15 s ATP, CP Small FG
submaximal 15 – 50 s ATP, CP, anaerobic
glycolysis
Maximum FG
and FGO
Short term
endurance
till 120 s Anaerobic and aerobic
glycolysis
Submax. FG
and FGO
Middle endurance till 10 min aerobic glycolysis medium FGO, SO
Long term
endurance
More than
10 min
aerobic glycolysis,
latter lipolysis
small SO
Zones of energy supply
Anaerobic free of lactic acid
Anaerobic with lactic acid
Aerobic free of lactic acid
- s trváním pokles
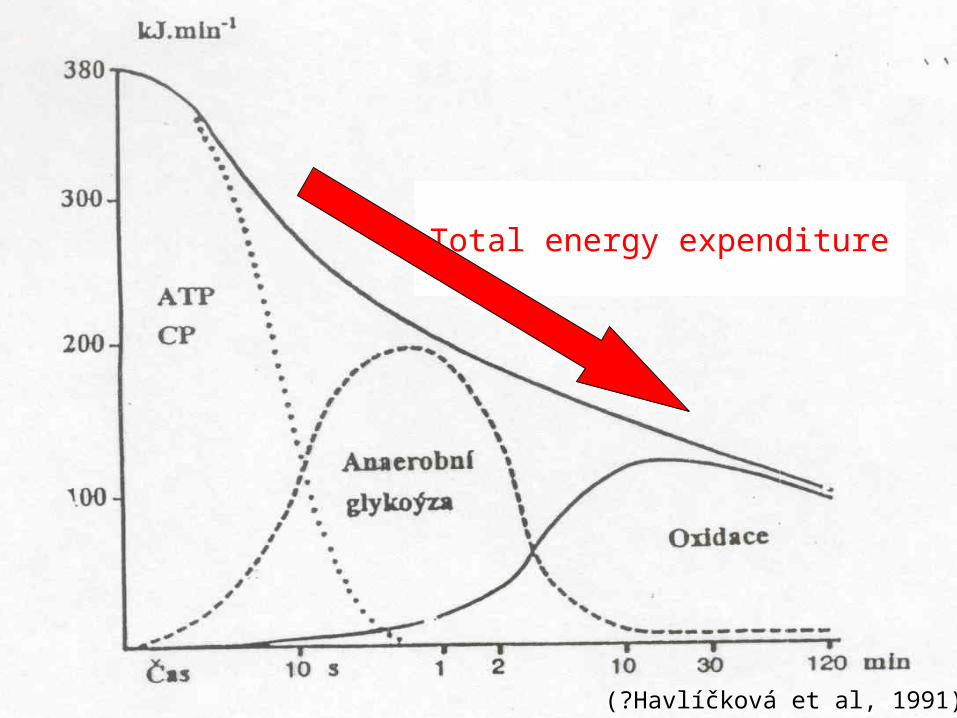
(?Havlíčková et al, 1991)
Total energy expenditure
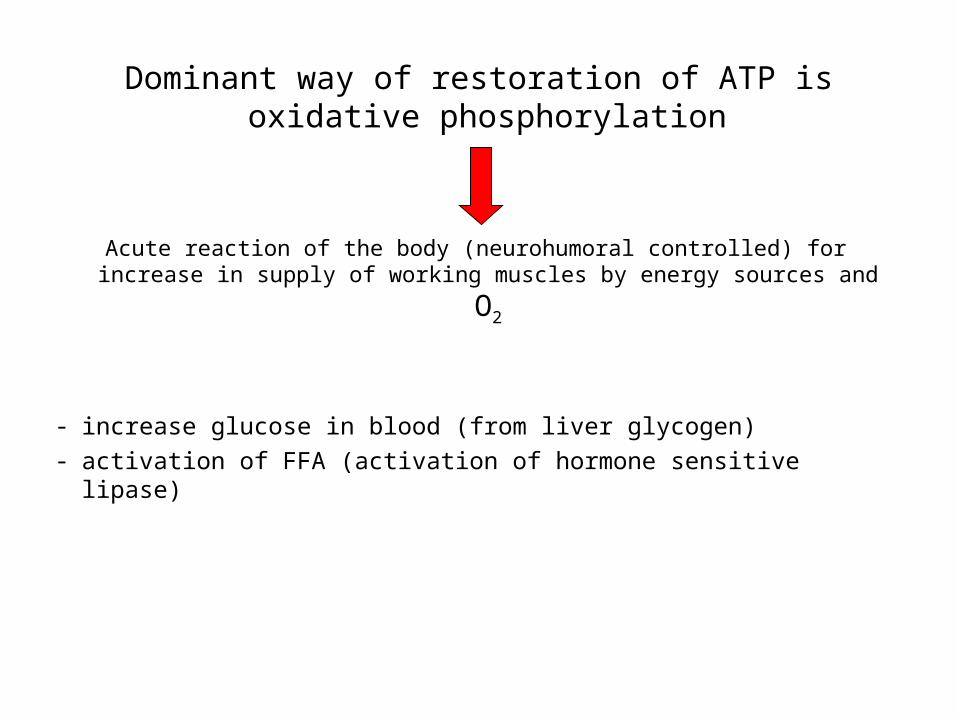
Dominant way of restoration of ATP is oxidative phosphorylation
Acute reaction of the body (neurohumoral controlled) for increase
in supply of working muscles by energy sources and O2
- increase glucose in blood (from liver glycogen)- activation of FFA (activation of hormone sensitive lipase)
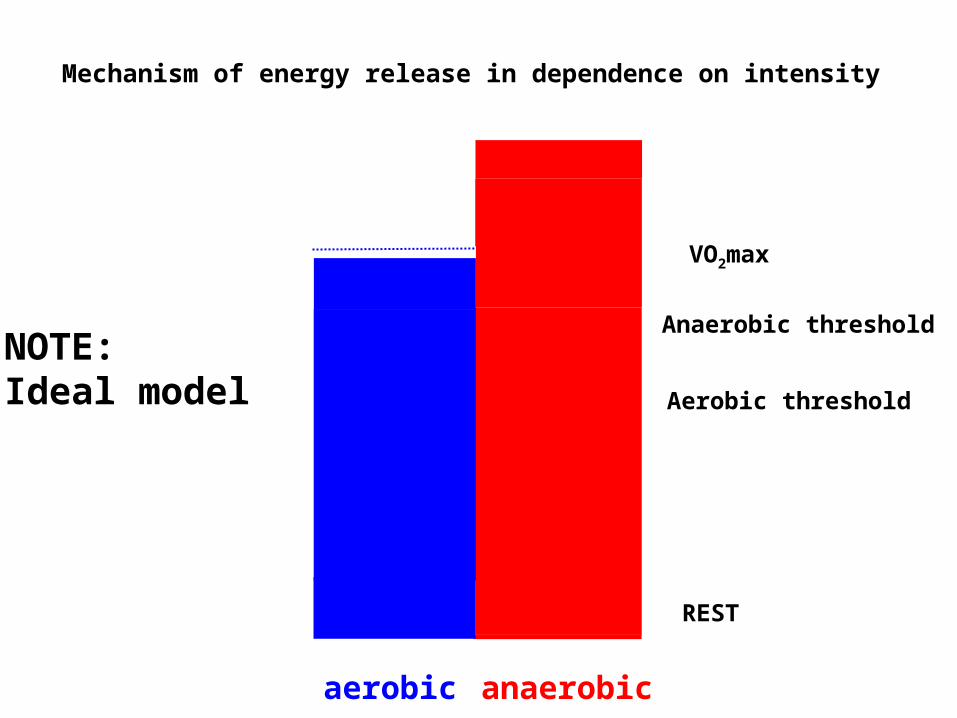
Mechanism of energy release in dependence on intensity
aerobic anaerobic
NOTE:Ideal model
REST
Anaerobic threshold
VO2max
Aerobic threshold

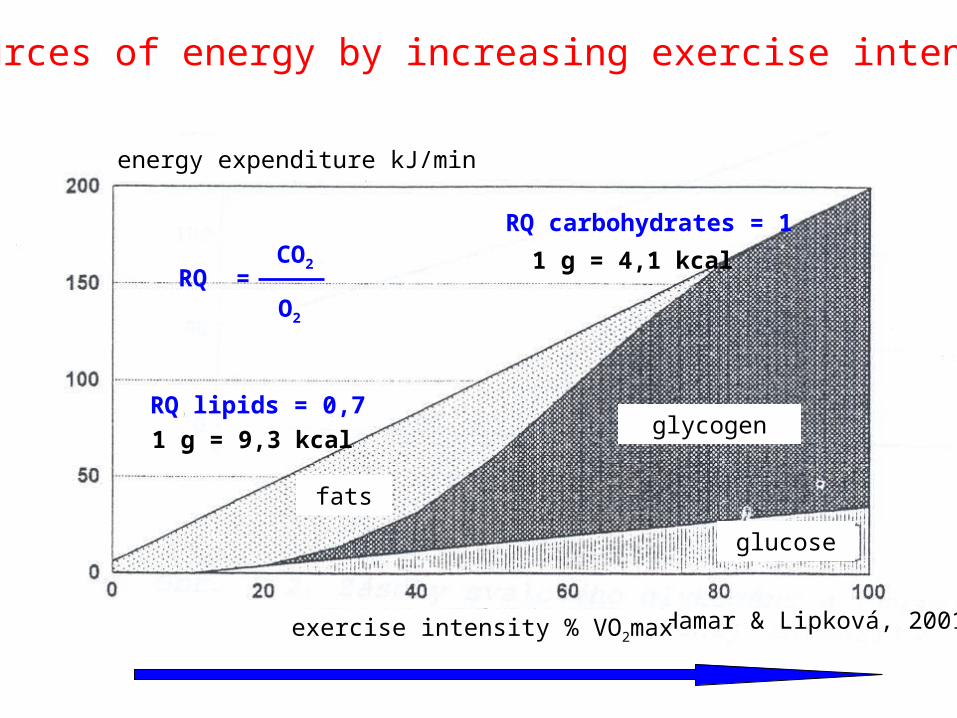
Sources of energy by increasing exercise intensity
RQ fats = 0,7
RQ carbohydrates = 1
1 g = 9,3 kcal
1 g = 4,1 kcalRQ =
CO2
O2
(Hamar & Lipková, 2001)
fats
glucose
glycogen
exercise intensity % VO2max
energy expenditure kJ/min
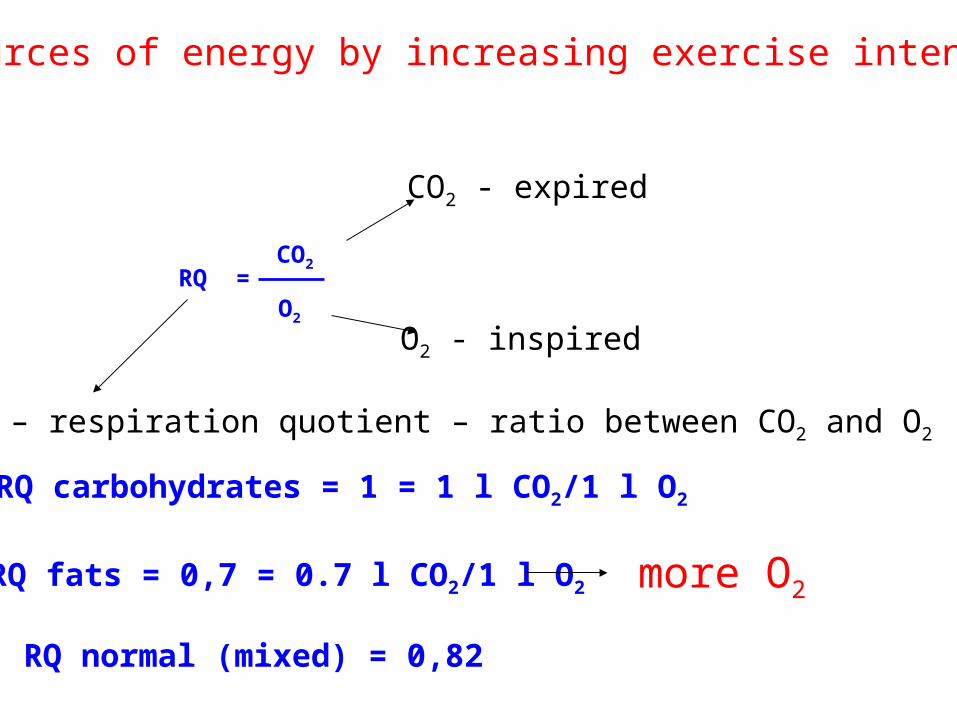
Sources of energy by increasing exercise intensity
RQ =CO2
O2
CO2 - expired
O2 - inspired
RQ – respiration quotient – ratio between CO2 and O2
RQ carbohydrates = 1 = 1 l CO2/1 l O2
RQ fats = 0,7 = 0.7 l CO2/1 l O2
RQ normal (mixed) = 0,82
more O2
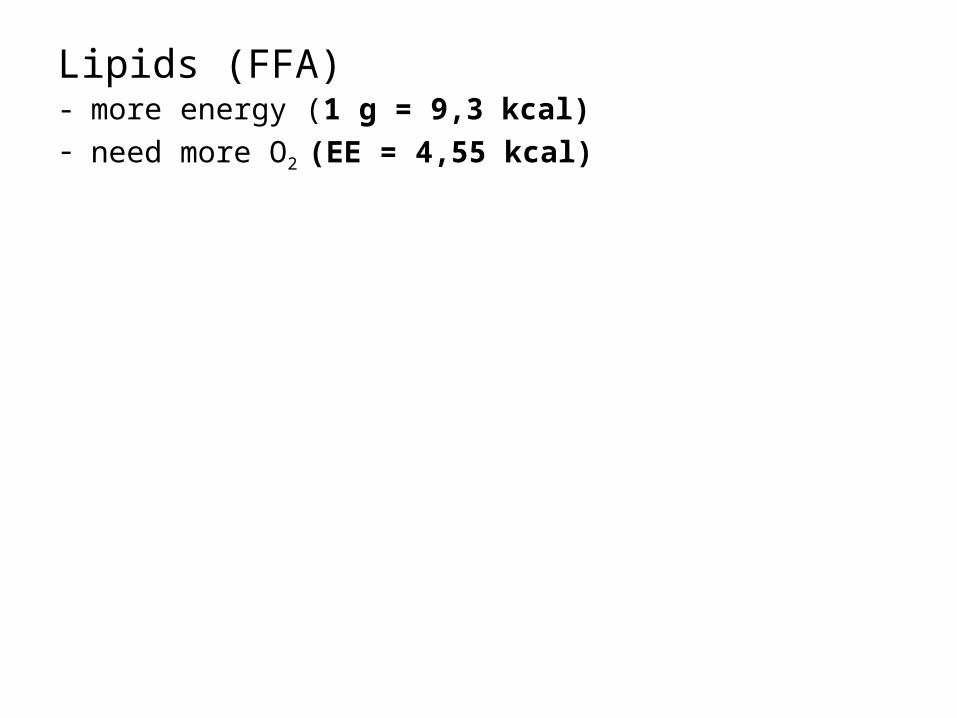
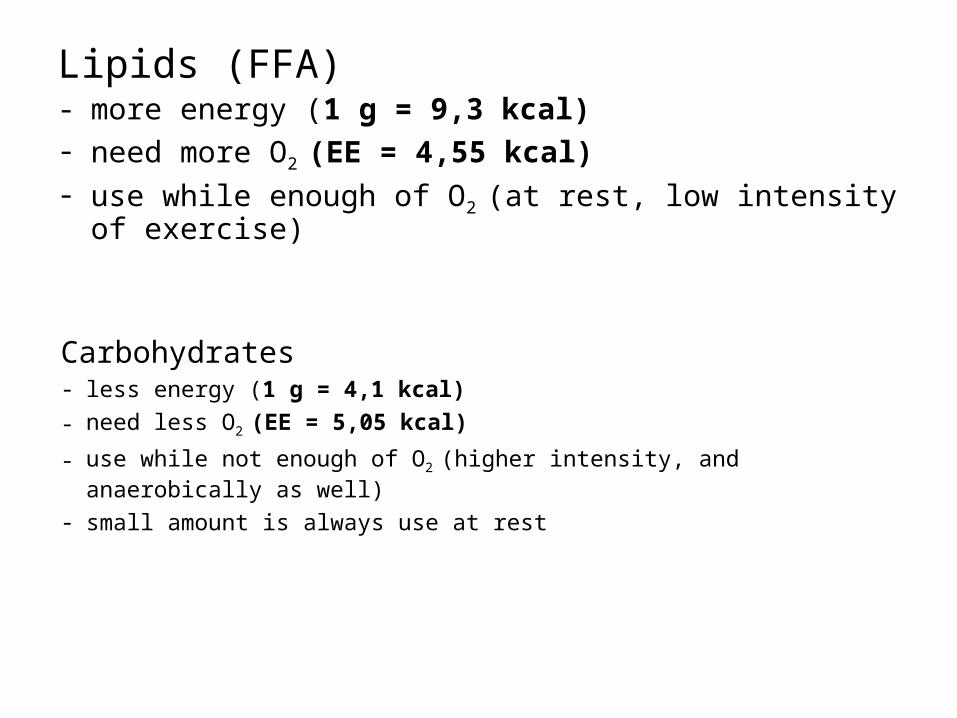
Lipids (FFA)- more energy (1 g = 9,3 kcal)- need more O2 (EE = 4,55 kcal)- use while enough of O2 (at rest, low intensity of exercise)
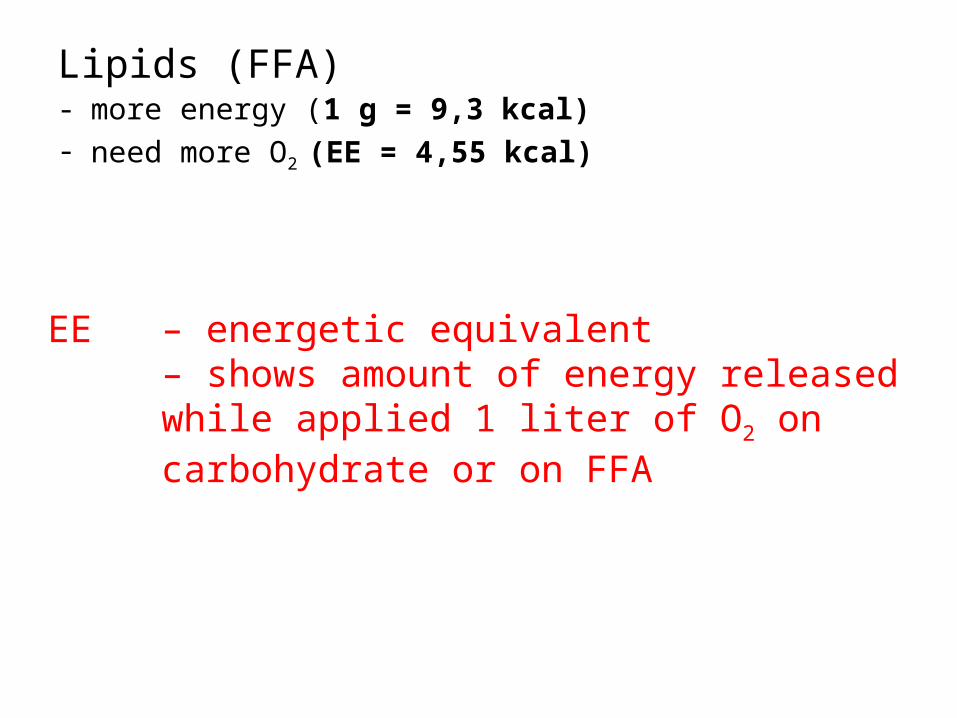
Lipids (FFA)- more energy (1 g = 9,3 kcal)- need more O2 (EE = 4,55 kcal)- use while enough of O2 (at rest, low intensity of exercise)
– energetic equivalent– shows amount of energy released while applied 1 liter of O2 on carbohydrate or on FFA
EE
Lipids (FFA)- more energy (1 g = 9,3 kcal)- need more O2 (EE = 4,55 kcal)- use while enough of O2 (at rest, low intensity of exercise)
Carbohydrates- less energy (1 g = 4,1 kcal)
- need less O2 (EE = 5,05 kcal)
- use while not enough of O2 (higher intensity, and anaerobically as well)
- small amount is always use at rest

Sources of energy by increasing exercise intensity
RQ lipids = 0,7
RQ carbohydrates = 1
1 g = 9,3 kcal
1 g = 4,1 kcalRQ =
CO2
O2
(Hamar & Lipková, 2001)
fats
glucose
glycogen
exercise intensity % VO2max
energy expenditure kJ/min

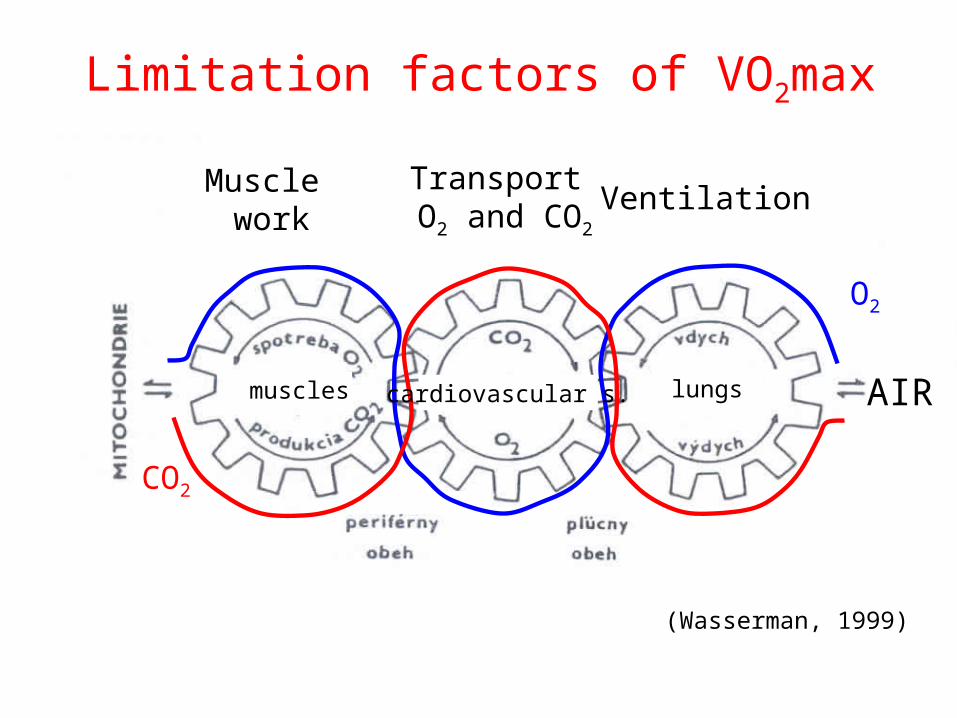
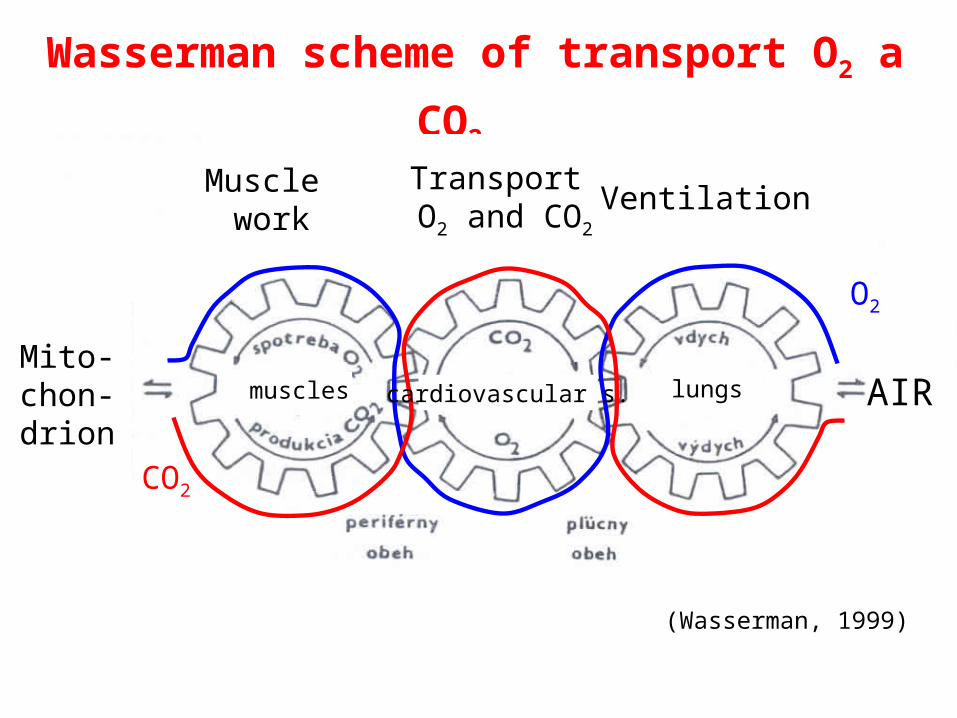
Wasserman scheme of transport O2 a CO2
O2
CO2
(Wasserman, 1999)
Muscle work
Transport O2 and CO2
Ventilation
AIRMito-chon-drion
cardiovascular s. lungsmuscles
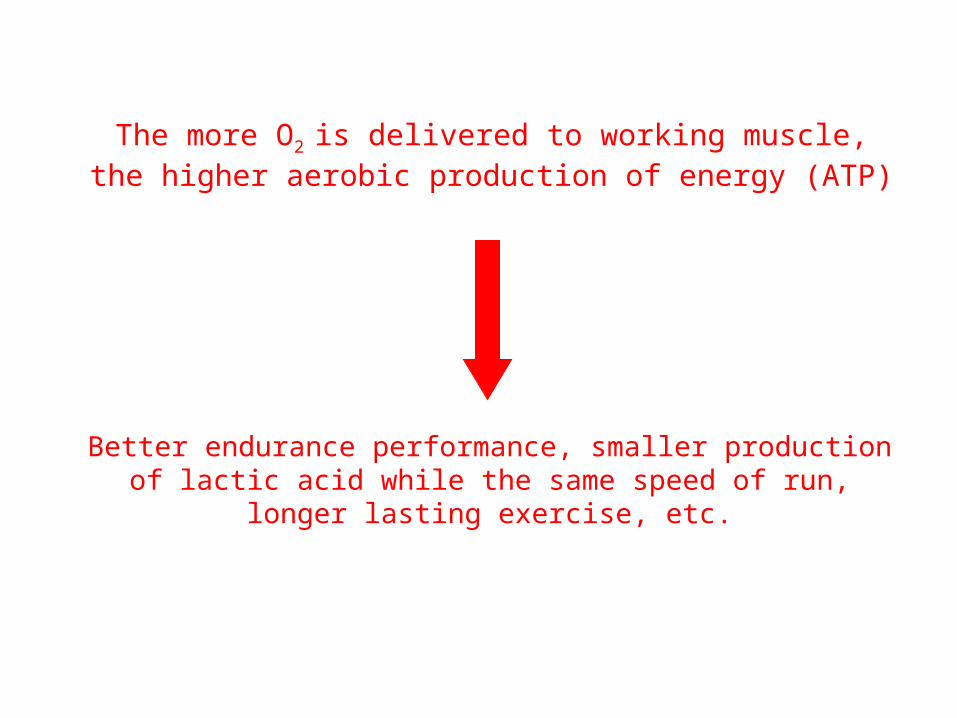
The more O2 is delivered to working muscle, the higher aerobic production of energy (ATP)
Better endurance performance, smaller production of lactic acid while the same speed of run, longer lasting exercise, etc.

Wasserman scheme of transport O2 a CO2
O2
CO2
(Wasserman, 1999)
Muscle work
Transport O2 and CO2
Ventilation
AIRMito-chon-drion
cardiovascular s. lungsmuscles
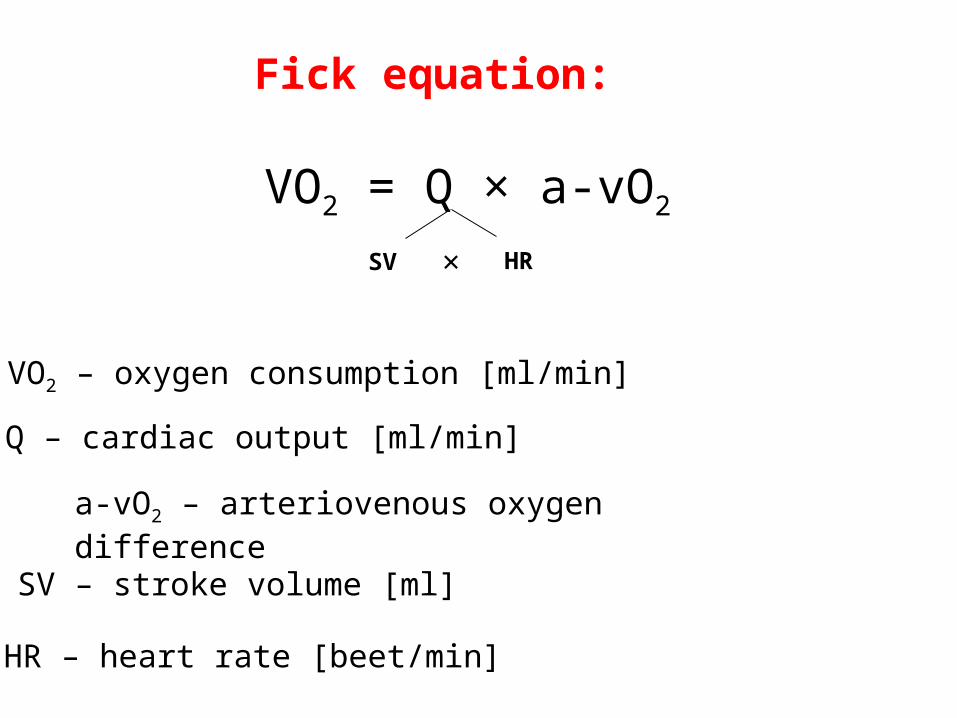
Fick equation:
VO2 = Q × a-vO2
VO2 – oxygen consumption [ml/min]
Q – cardiac output [ml/min]
a-vO2 – arteriovenous oxygen difference
SV HR
SV – stroke volume [ml]
HR – heart rate [beet/min]
×
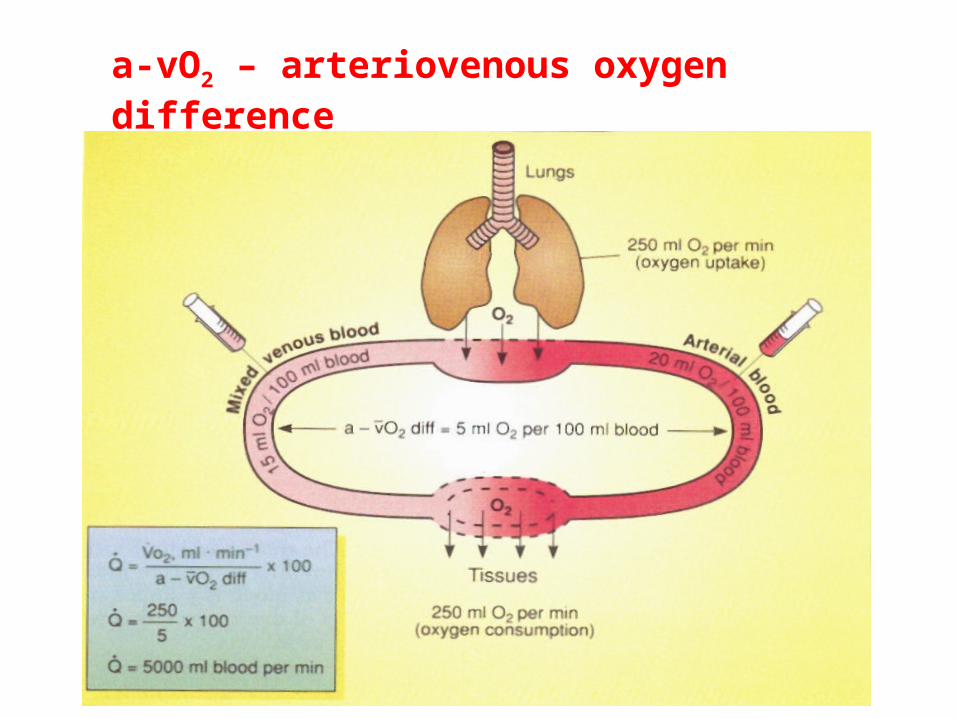
a-vO2 – arteriovenous oxygen difference
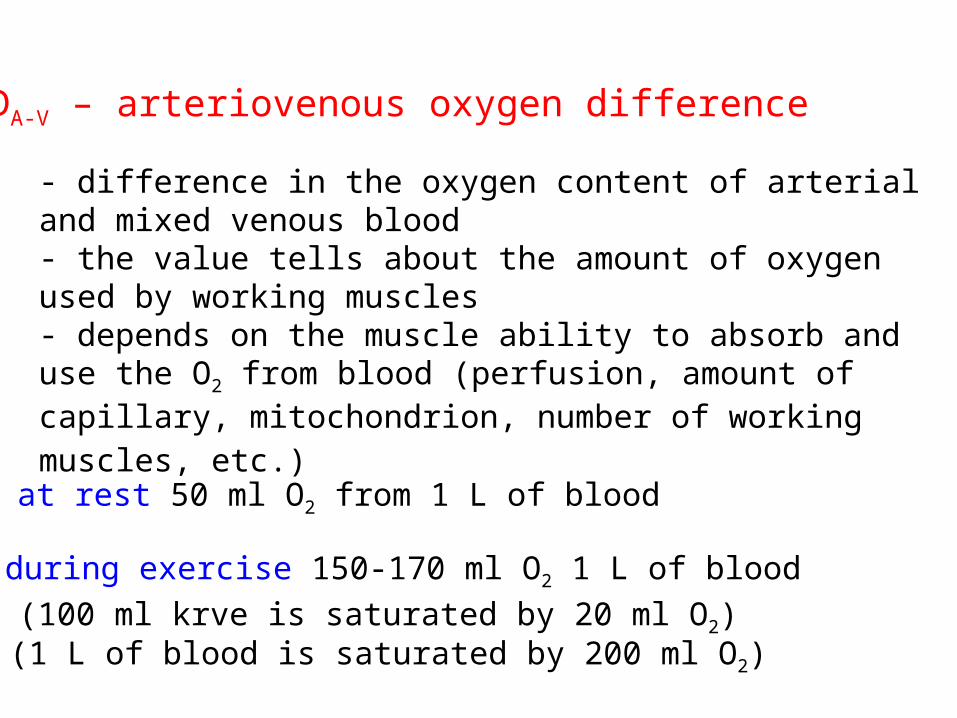
DA-V – arteriovenous oxygen difference
- difference in the oxygen content of arterial and mixed venous blood- the value tells about the amount of oxygen used by working muscles- depends on the muscle ability to absorb and use the O2 from blood (perfusion, amount of capillary, mitochondrion, number of working muscles, etc.)
(100 ml krve is saturated by 20 ml O2)
- at rest 50 ml O2 from 1 L of blood
- during exercise 150-170 ml O2 1 L of blood
(1 L of blood is saturated by 200 ml O2)
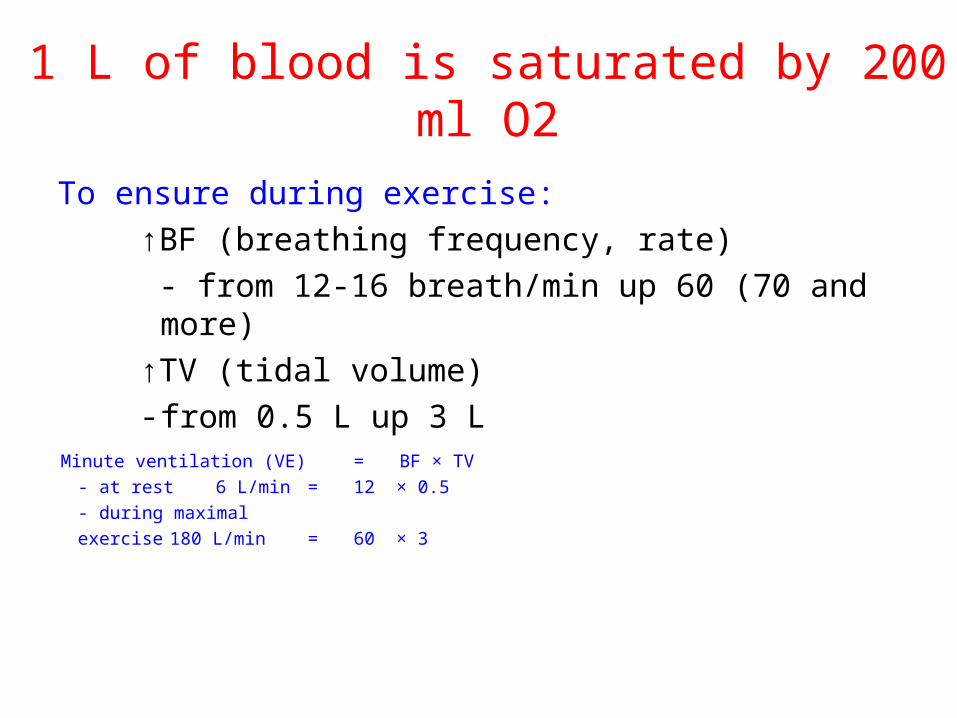
1 L of blood is saturated by 200 ml O2
To ensure during exercise:
↑BF (breathing frequency, rate)
- from 12-16 breath/min up 60 (70 and more)
↑TV (tidal volume)- from 0.5 L up 3 L
Minute ventilation (VE) = BF × TV
- at rest 6 L/min = 12 × 0.5
- during maximal
exercise 180 L/min = 60 × 3
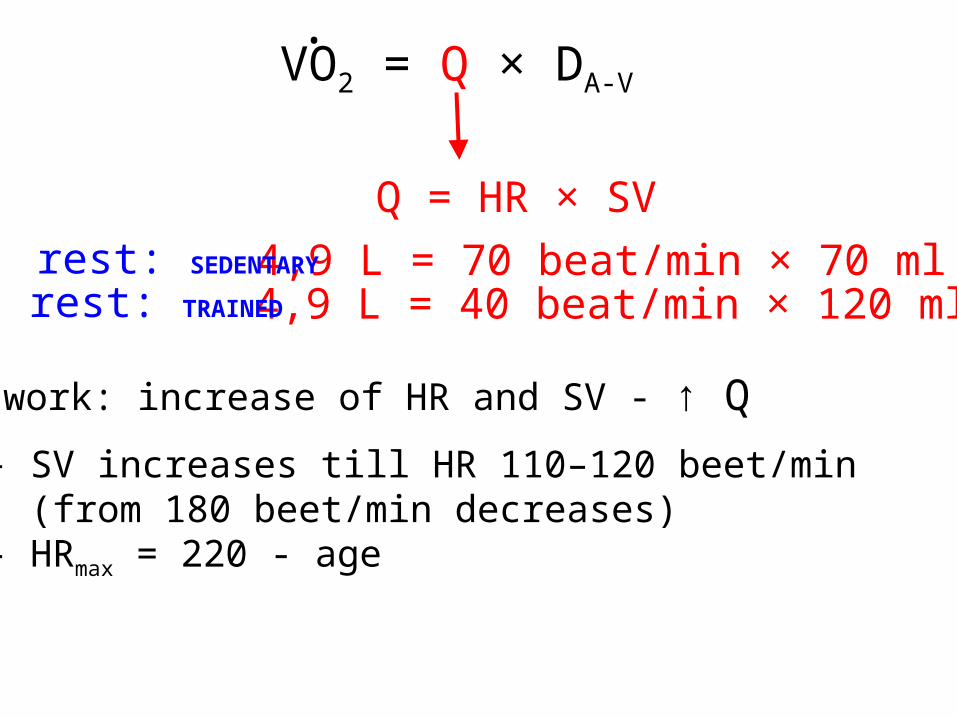
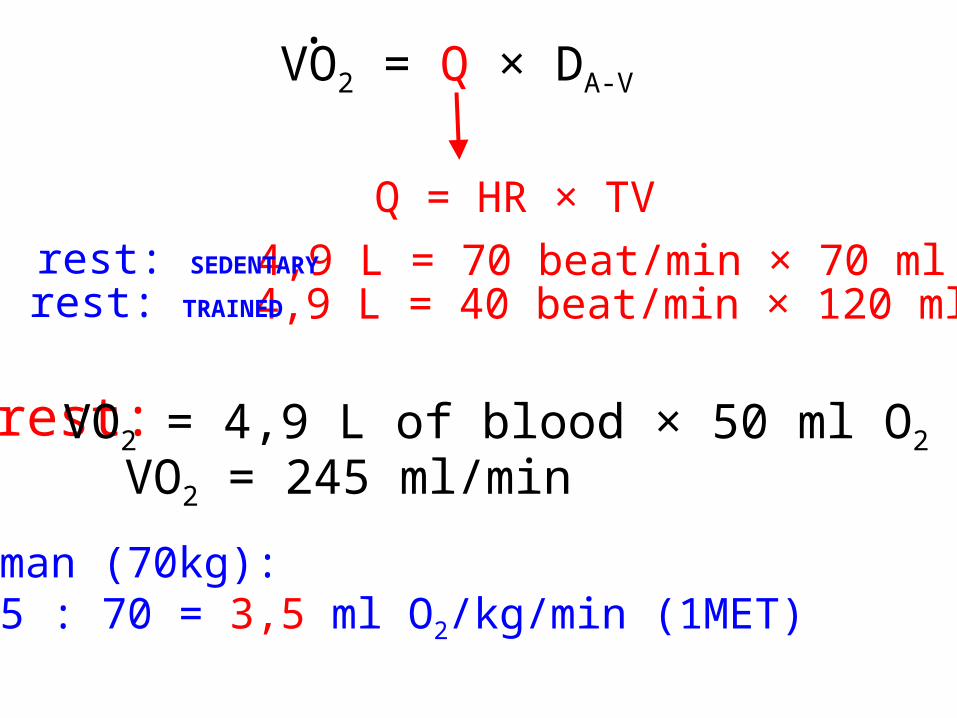
VO2 = Q × DA-V
.
Q = HR × SV
4,9 L = 70 beat/min × 70 mlrest: SEDENTARY
4,9 L = 40 beat/min × 120 mlrest: TRAINED
In work: increase of HR and SV - ↑ Q
- SV increases till HR 110–120 beet/min (from 180 beet/min decreases)- HRmax = 220 - age
VO2 = Q × DA-V
.
human (70kg): 245 : 70 = 3,5 ml O2/kg/min (1MET)
rest: VO2 = 4,9 L of blood × 50 ml O2
VO2 = 245 ml/min
Q = HR × TV
4,9 L = 70 beat/min × 70 mlrest: SEDENTARY
4,9 L = 40 beat/min × 120 mlrest: TRAINED
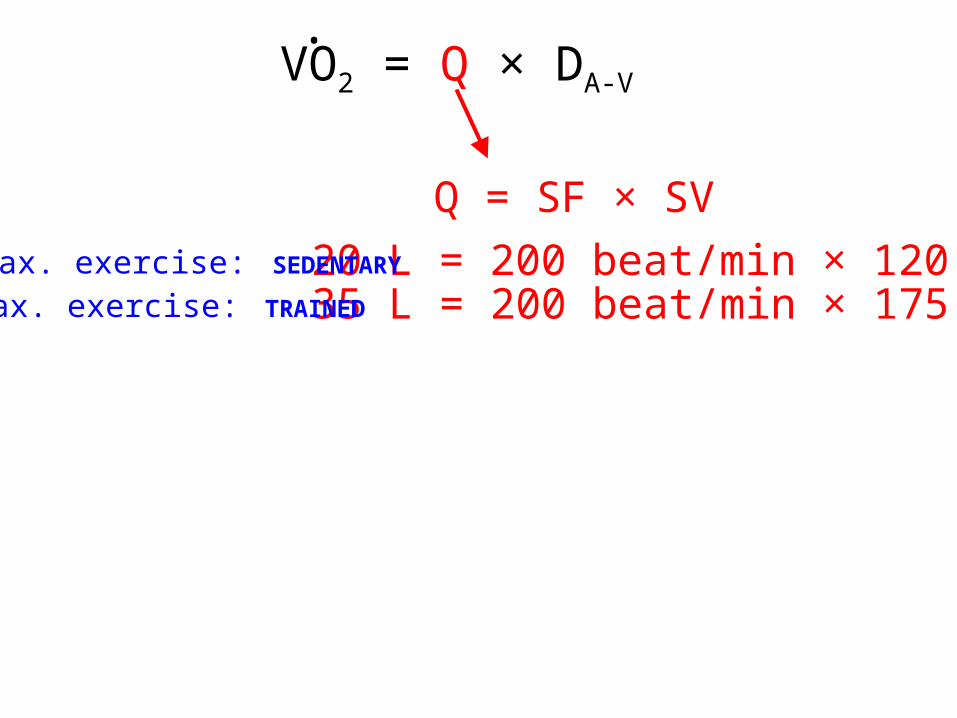
VO2 = Q × DA-V
.
Q = SF × SV
20 L = 200 beat/min × 120 mlMax. exercise: SEDENTARY
35 L = 200 beat/min × 175 mlMax. exercise: TRAINED
VO2 = Q × DA-V
.
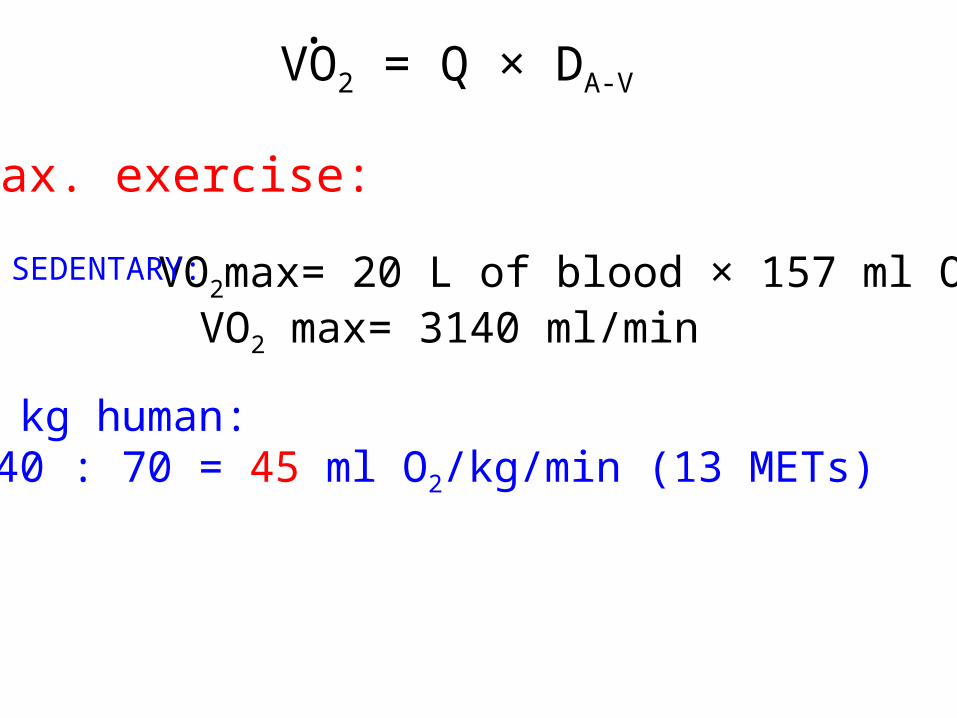
70 kg human:3140 : 70 = 45 ml O2/kg/min (13 METs)
Max. exercise:
VO2max= 20 L of blood × 157 ml O2
VO2 max= 3140 ml/min
SEDENTARY:
VO2 = Q × DA-V
.
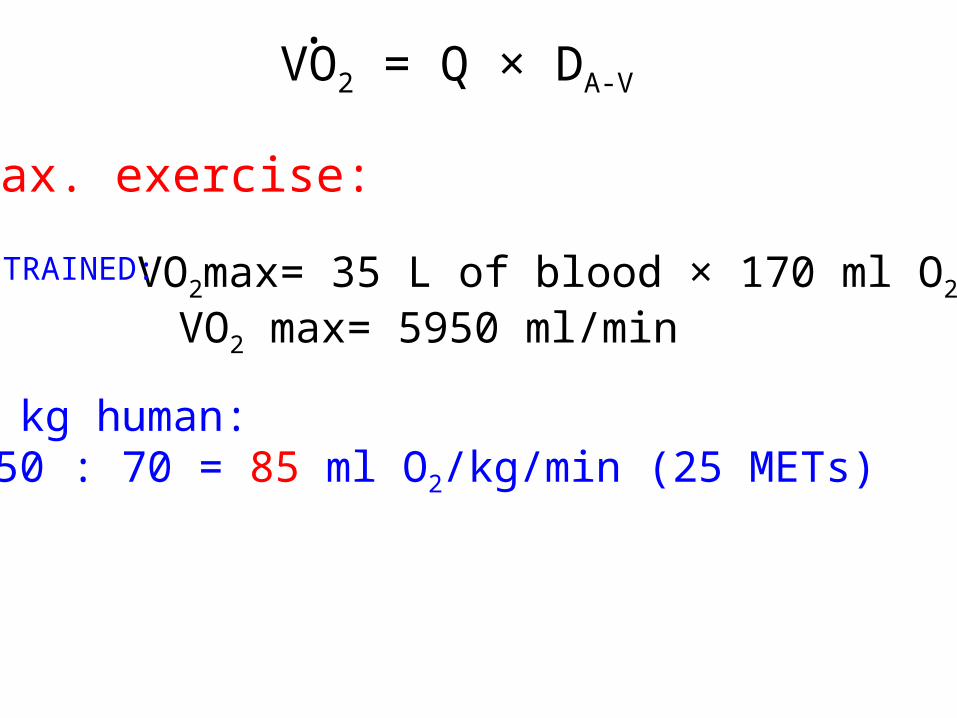
70 kg human:5950 : 70 = 85 ml O2/kg/min (25 METs)
VO2max= 35 L of blood × 170 ml O2
VO2 max= 5950 ml/min
TRAINED:
Max. exercise:
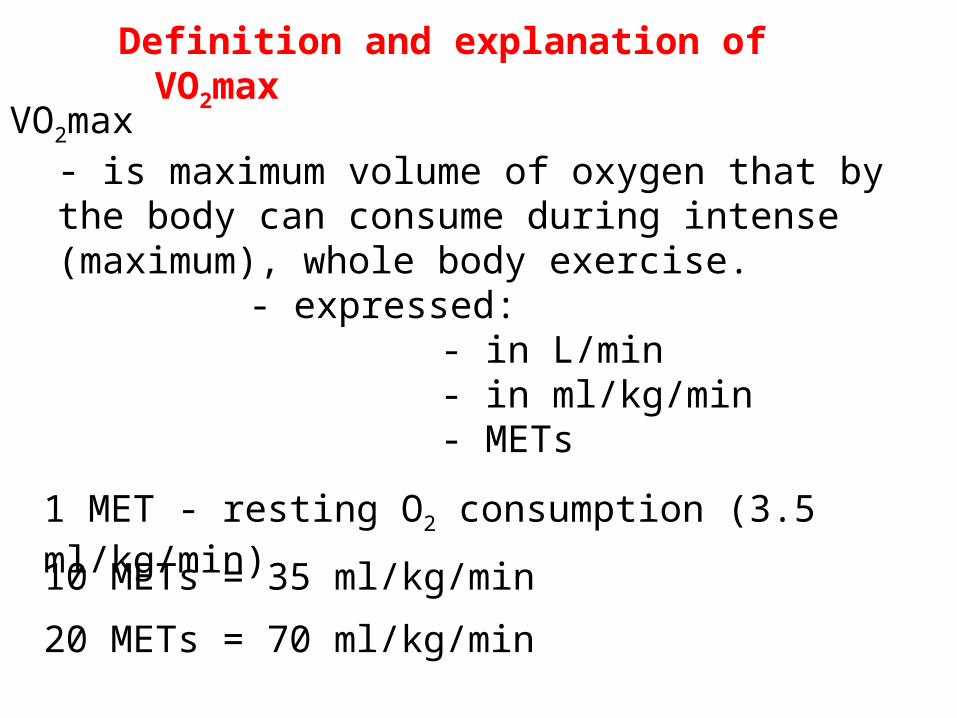
VO2max - is maximum volume of oxygen that by the body can consume during intense (maximum), whole body exercise.
- expressed:- in L/min- in ml/kg/min- METs
1 MET - resting O2 consumption (3.5 ml/kg/min)
10 METs = 35 ml/kg/min
Definition and explanation of VO2max
20 METs = 70 ml/kg/min
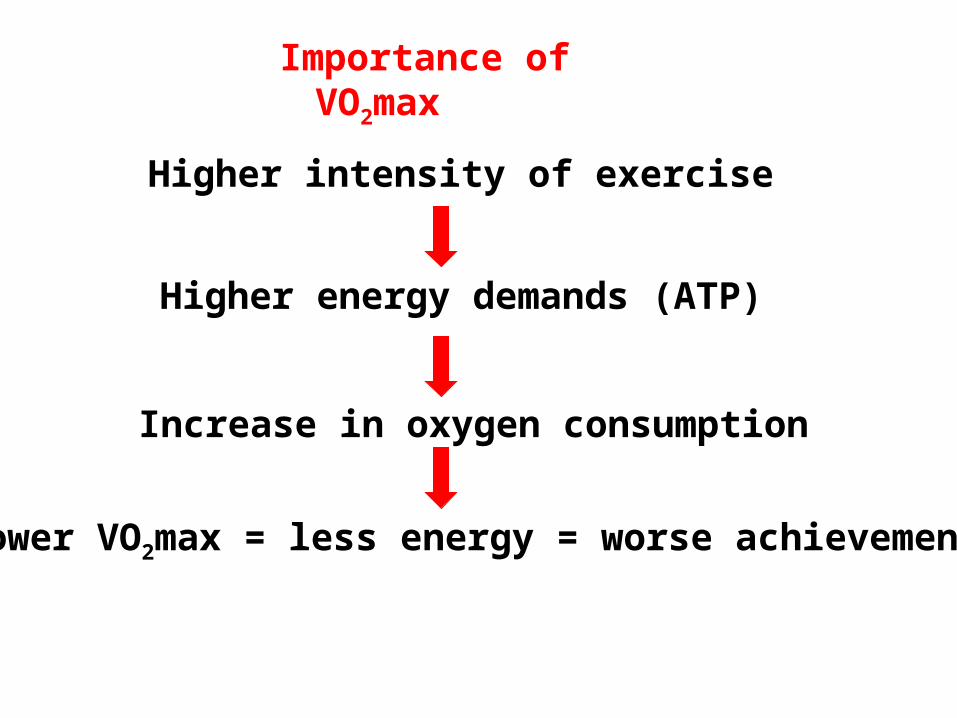
Higher intensity of exercise
Higher energy demands (ATP)
Increase in oxygen consumption
Lower VO2max = less energy = worse achievement
Importance of VO2max
Importance of VO2max
The more is O2 supplied to working muscles, the more higher is an amount of aerobically
produced energy.It means higher speed of running, latest
manifestation of fatigue, etc.
During endurance activity is being ATP resynthesized mainly aerobically from lipids
and carbohydrates.
It shows the capacity for aerobic energy transfer.
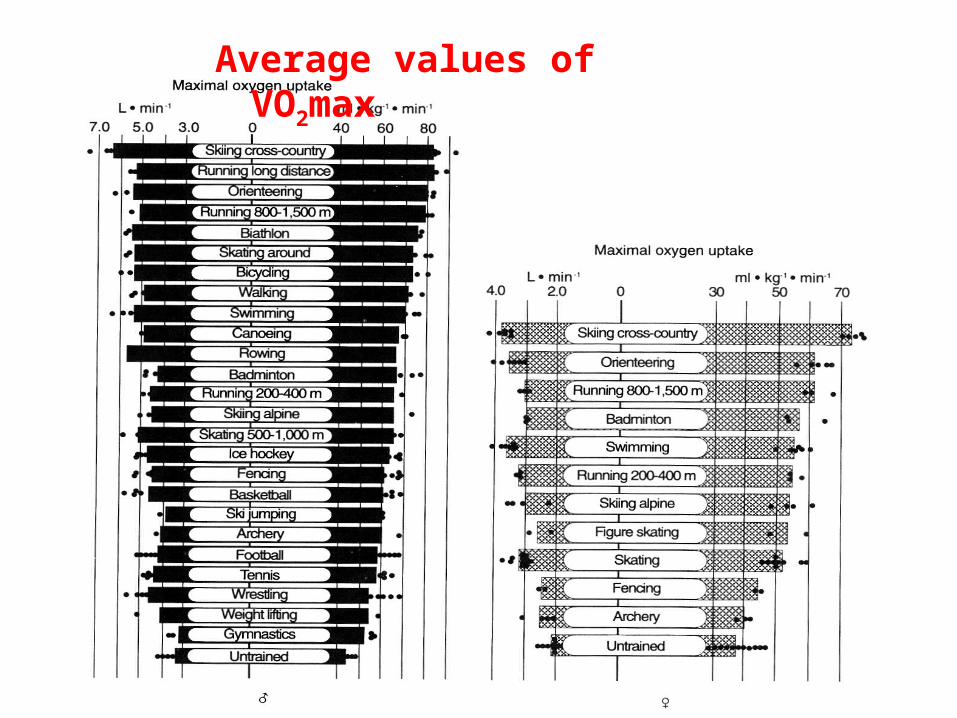
Average values of VO2max
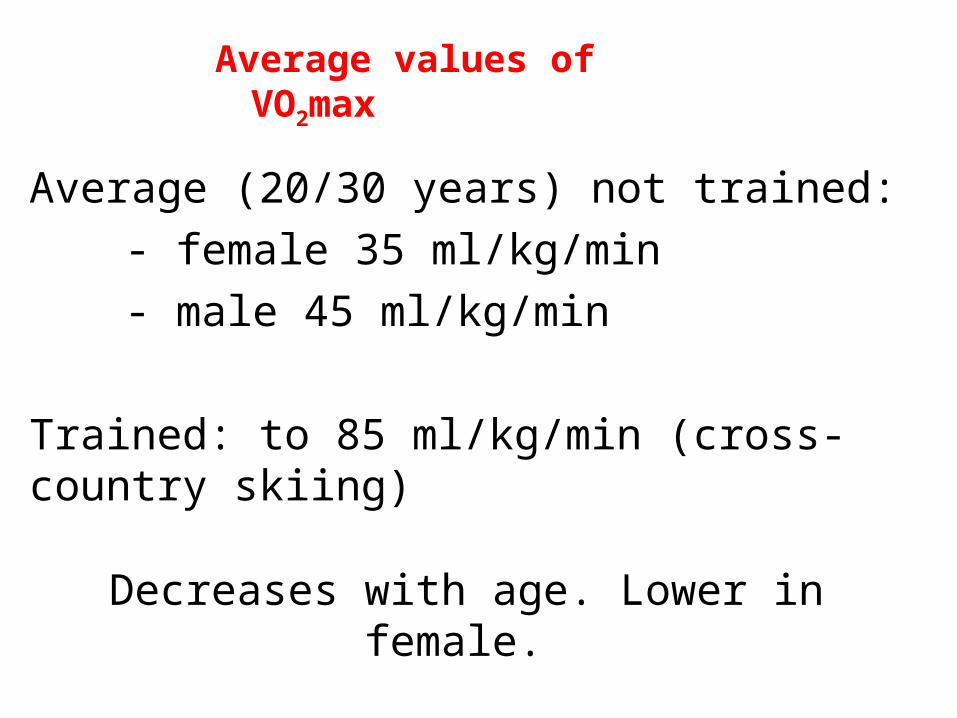
Average (20/30 years) not trained:
- female 35 ml/kg/min
- male 45 ml/kg/min
Trained: to 85 ml/kg/min (cross-country skiing)
Decreases with age. Lower in female.
Average values of VO2max
Limitation factors of VO2max
O2
CO2
(Wasserman, 1999)
Muscle work
Transport O2 and CO2
Ventilation
AIRcardiovascular s. lungsmuscles
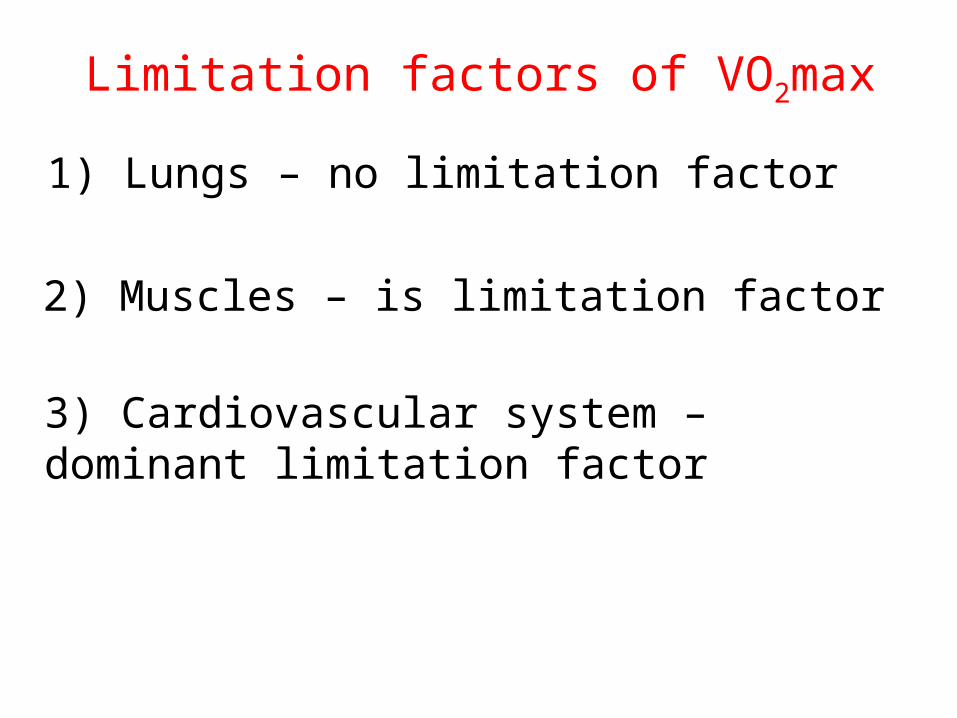
Limitation factors of VO2max
1) Lungs – no limitation factor
2) Muscles – is limitation factor
3) Cardiovascular system – dominant limitation factor
Wasserman scheme of transport O2 a CO2
O2
CO2
(Wasserman, 1999)
Muscle work
Transport O2 and CO2
Ventilation
AIRMito-chon-drion
cardiovascular s. lungsmuscles
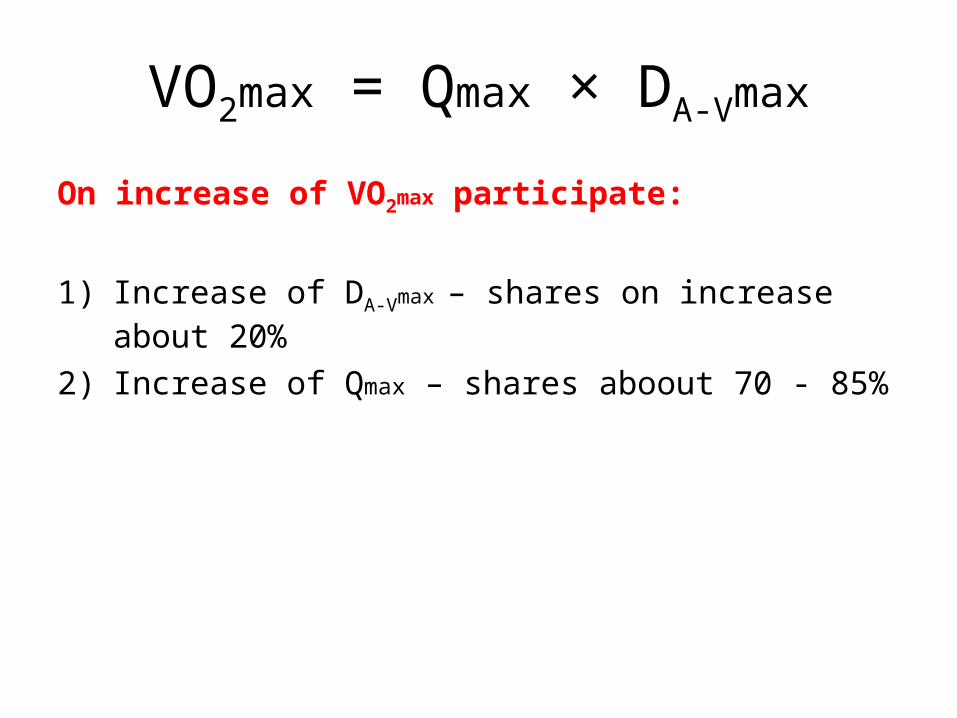
On increase of VO2max participate:
1) Increase of DA-Vmax – shares on increase about 20%
2) Increase of Qmax – shares aboout 70 - 85%
VO2max = Qmax × DA-Vmax
Influence of the gender, health condition, age
Heredity – the increase of VO2max by training only to max. 25%
Gender – in female lower muscle mass, lover hemoglobin
Age – decrease of active body mass, activity of enzymes…
Sources of energy by increasing exercise intensity
RQ lipids = 0,7
RQ carbohydrates = 1
1 g = 9,3 kcal
1 g = 4,1 kcalRQ =
CO2
O2
(Hamar & Lipková, 2001)
fats
glucose
glycogen
exercise intensity % VO2max
energy expenditure kJ/min
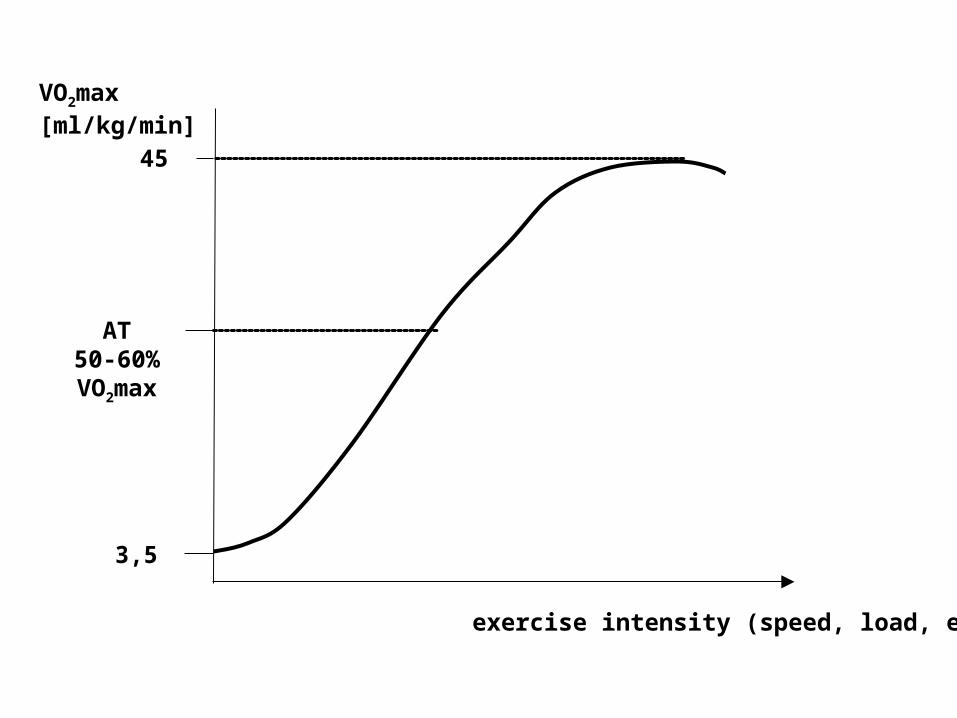
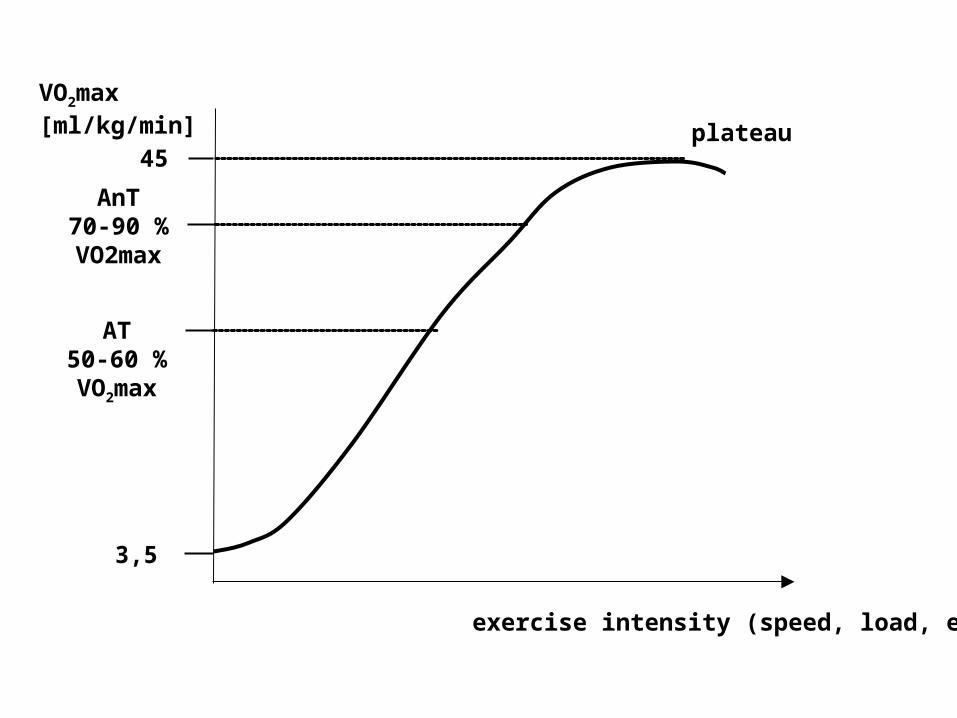
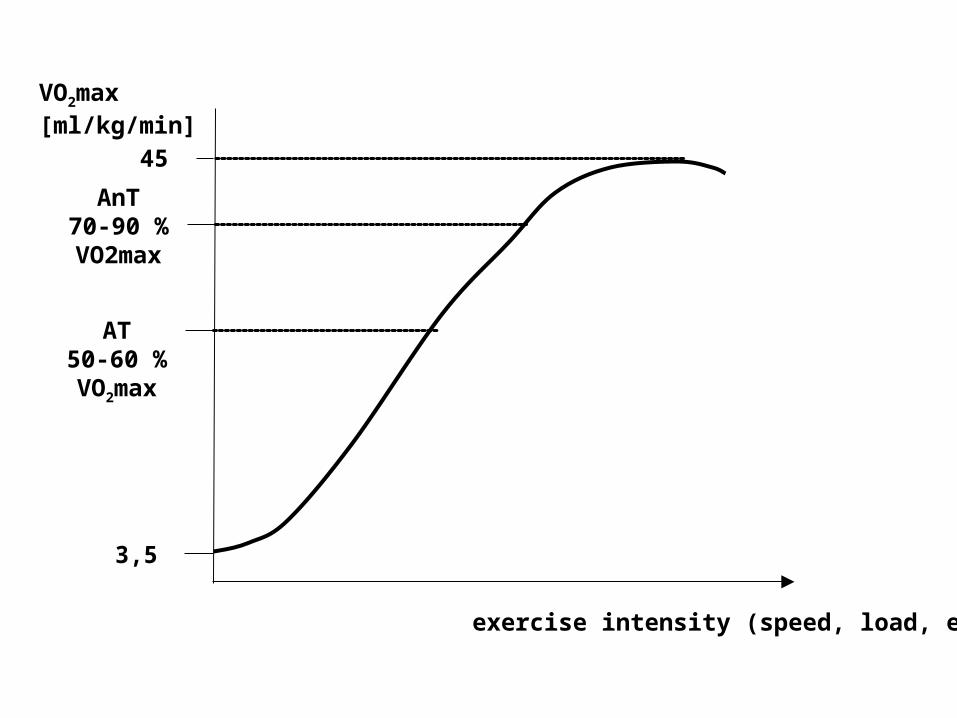
3,5
VO2max[ml/kg/min]
45
exercise intensity (speed, load, etc.)
AT50-60% VO2max
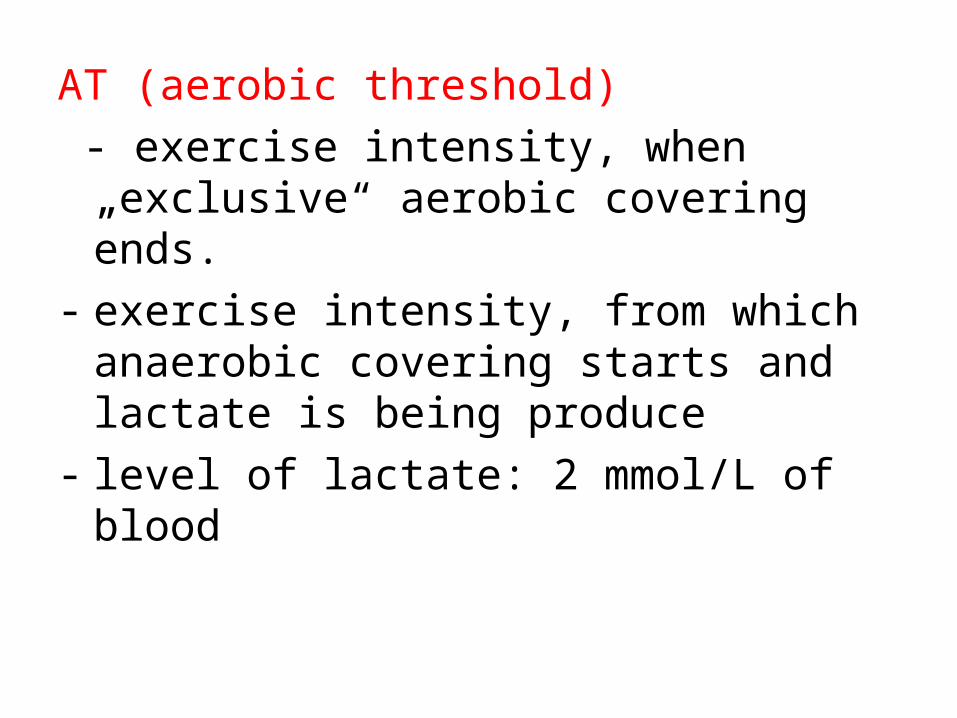
AT (aerobic threshold)
- exercise intensity, when „exclusive“ aerobic covering ends.
- exercise intensity, from which anaerobic covering starts and lactate is being produce
- level of lactate: 2 mmol/L of blood
3,5
VO2max[ml/kg/min]
45
AT50-60 % VO2max
AnT70-90 % VO2max
plateau
exercise intensity (speed, load, etc.)
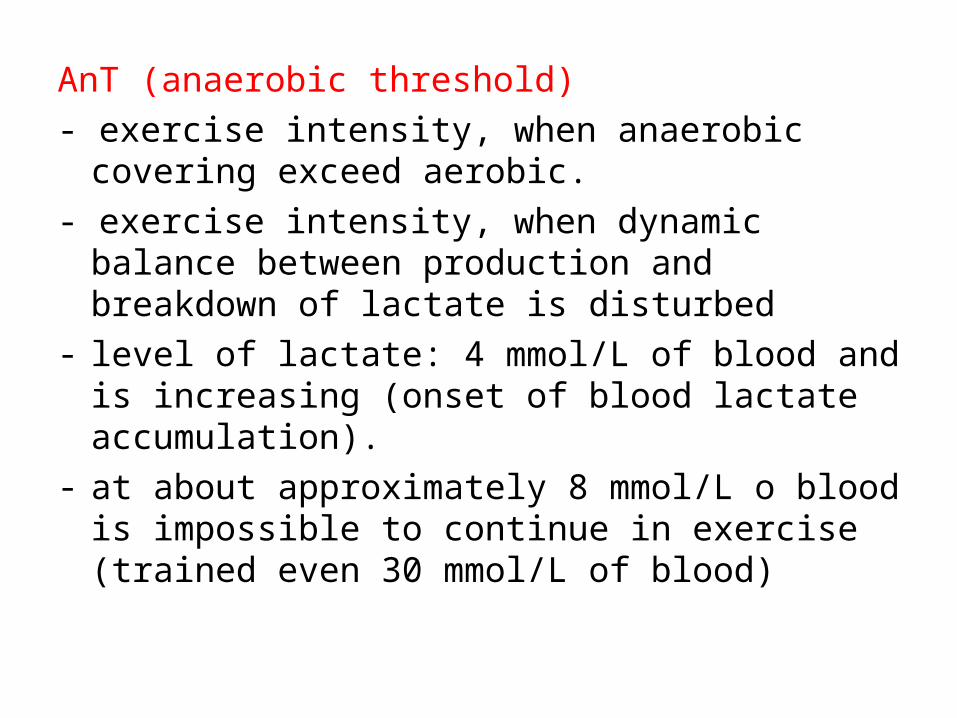
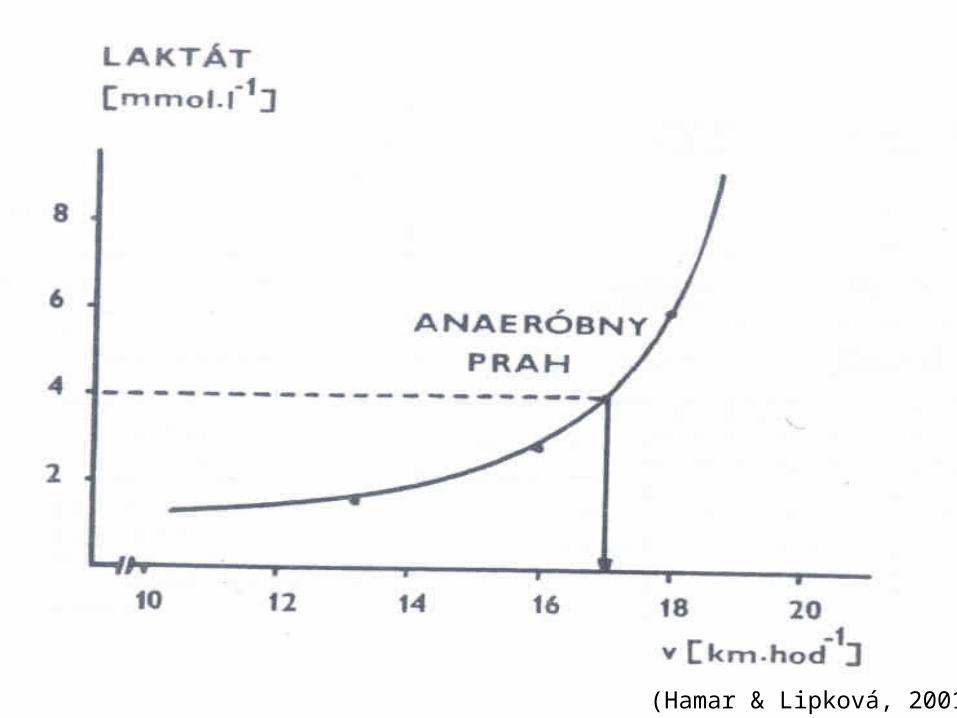
AnT (anaerobic threshold)
- exercise intensity, when anaerobic covering exceed aerobic.
- exercise intensity, when dynamic balance between production and breakdown of lactate is disturbed
- level of lactate: 4 mmol/L of blood and is increasing (onset of blood lactate accumulation).
- at about approximately 8 mmol/L o blood is impossible to continue in exercise (trained even 30 mmol/L of blood)
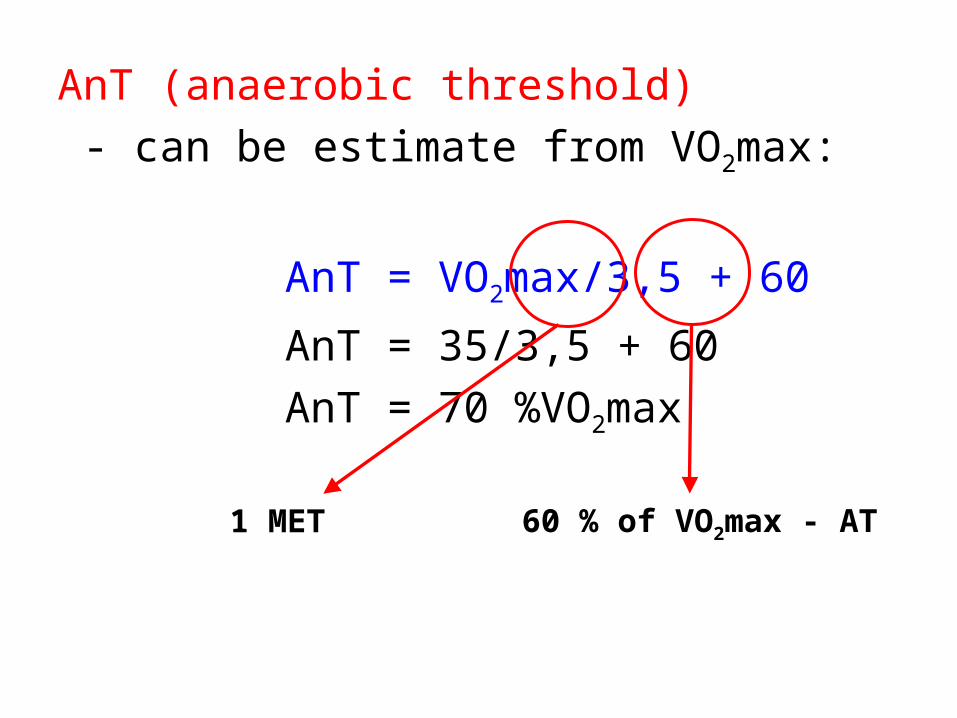
AnT (anaerobic threshold)
- can be estimate from VO2max:
AnT = VO2max/3,5 + 60
AnT = 35/3,5 + 60
AnT = 70 %VO2max
60 % of VO2max - AT1 MET
3,5
VO2max[ml/kg/min]
45
AT50-60 % VO2max
AnT70-90 % VO2max
exercise intensity (speed, load, etc.)
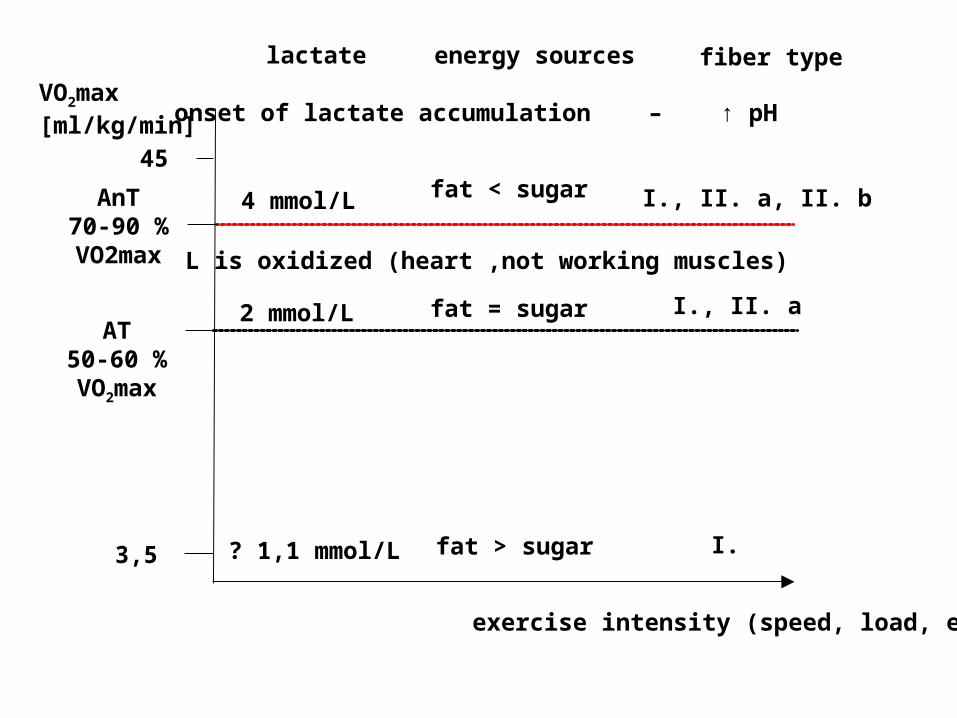
3,5
VO2max[ml/kg/min]
45
AT50-60 % VO2max
AnT70-90 % VO2max
lactate energy sources
? 1,1 mmol/L
fiber type
2 mmol/L
4 mmol/L
fat > sugar
fat = sugar
fat < sugar
I.
I., II. a
I., II. a, II. b
L is oxidized (heart ,not working muscles)
onset of lactate accumulation – ↑ pH
exercise intensity (speed, load, etc.)
(Hamar & Lipková, 2001)
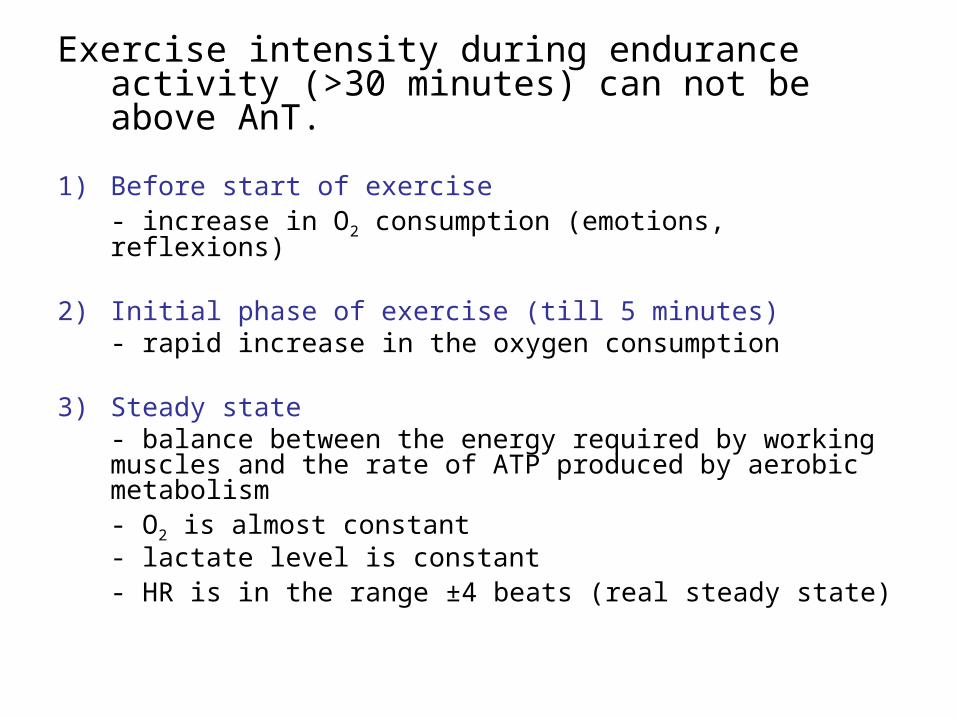
Exercise intensity during endurance activity (>30 minutes) can not be above AnT.
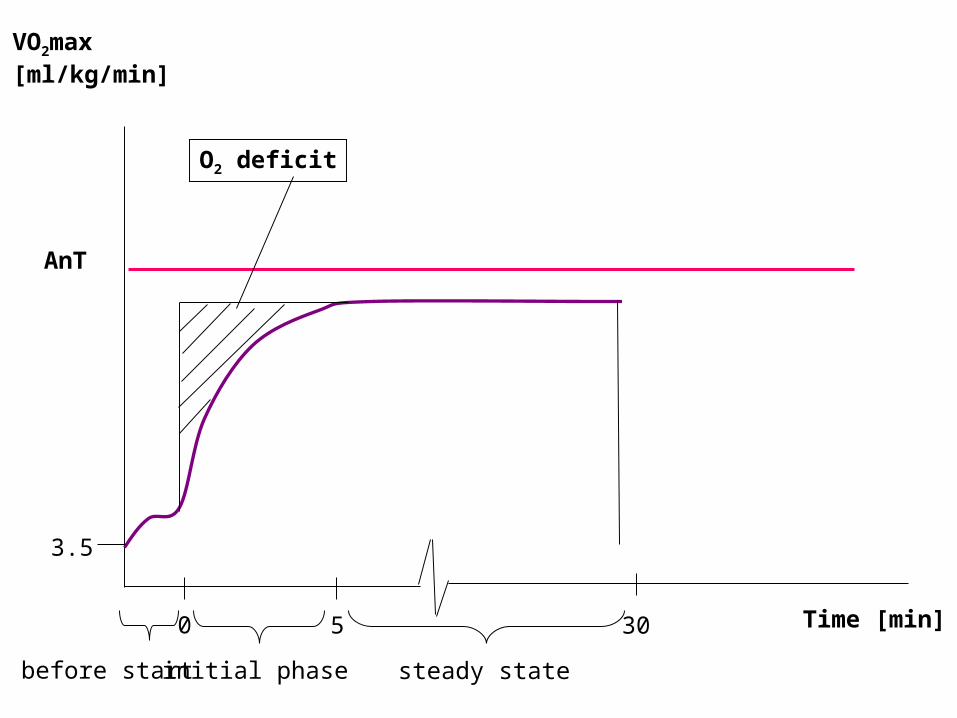
1) Before start of exercise- increase in O2 consumption (emotions, reflexions)
2) Initial phase of exercise (till 5 minutes)
- rapid increase in the oxygen consumption
3) Steady state- balance between the energy required by working muscles and the rate of ATP produced by aerobic metabolism- O2 is almost constant- lactate level is constant - HR is in the range ±4 beats (real steady state)
Time [min]
VO2max[ml/kg/min]
AnT
0 5 30
3.5
before start initial phase steady state
O2 deficit
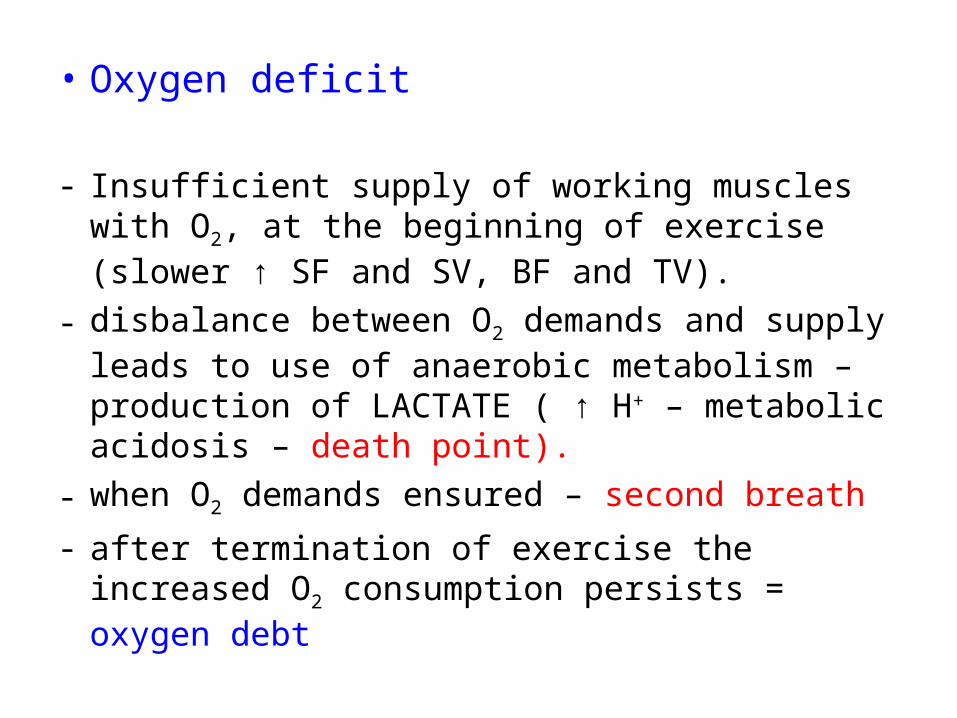
• Oxygen deficit
- Insufficient supply of working muscles with O2, at the beginning of exercise (slower ↑ SF and SV, BF and TV).
- disbalance between O2 demands and supply leads to use of anaerobic metabolism – production of LACTATE ( ↑ H+ – metabolic acidosis – death point).
- when O2 demands ensured – second breath
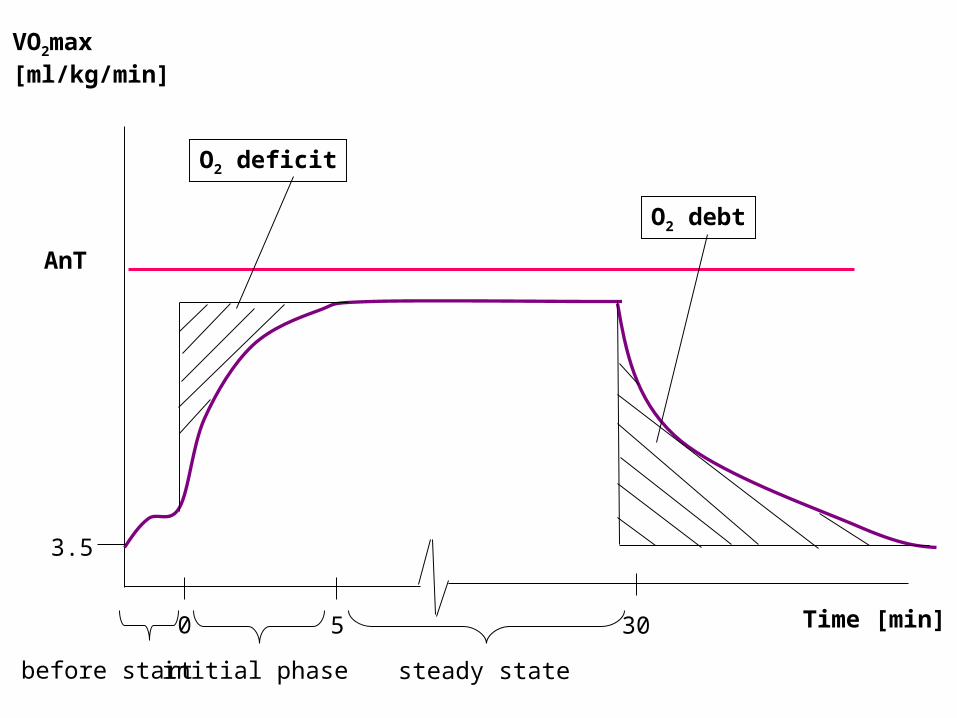
- after termination of exercise the increased O2 consumption persists = oxygen debt
Time [min]
VO2max[ml/kg/min]
AnT
0 5 30
3.5
before start initial phase steady state
O2 deficit
O2 debt
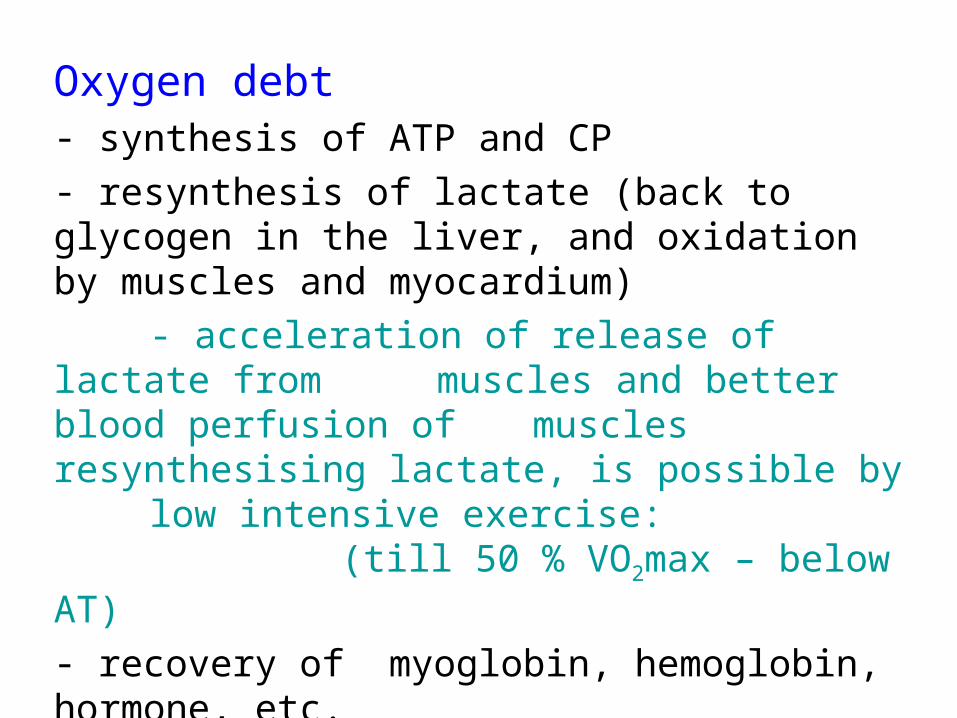
Oxygen debt- synthesis of ATP and CP- resynthesis of lactate (back to glycogen in the liver, and oxidation by muscles and myocardium)
- acceleration of release of lactate from muscles and better blood perfusion of muscles resynthesising lactate, is possible by low intensive exercise: (till 50 % VO2max – below AT)
- recovery of myoglobin, hemoglobin, hormone, etc.- the major part (till 30 min), mild oxygen debt can persist 12-24 hours.
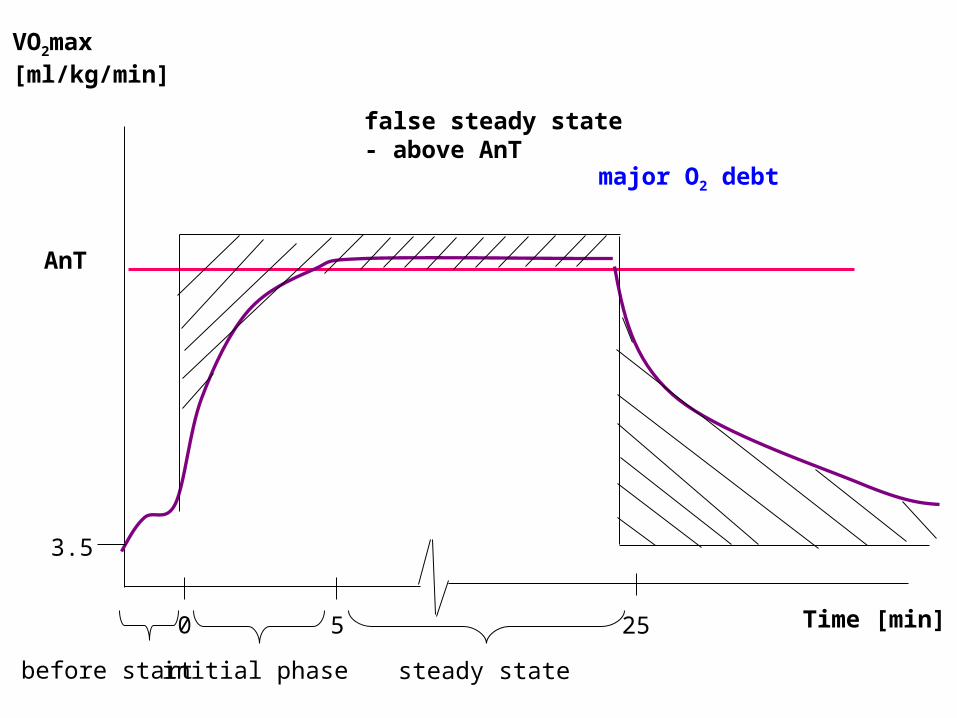
Time [min]
VO2max[ml/kg/min]
AnT
0 5 25
3.5
false steady state- above AnT
major O2 debt
before start initial phase steady state
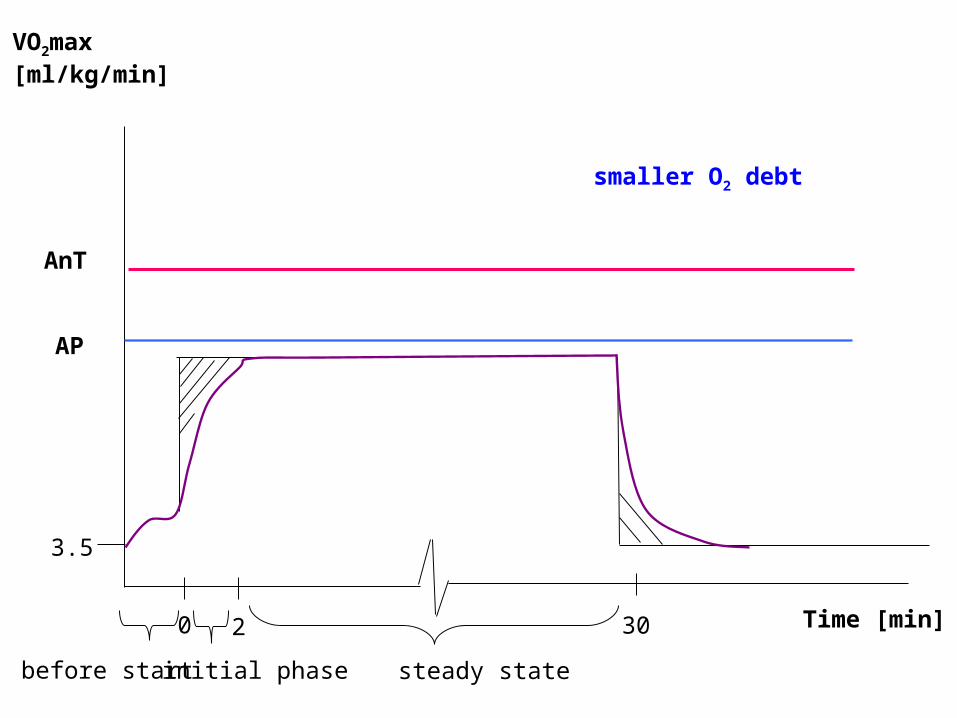
Time [min]
VO2max[ml/kg/min]
AnT
0 2 30
3.5
AP
smaller O2 debt
before start initial phase steady state
(Hamar & Lipková, 2001)
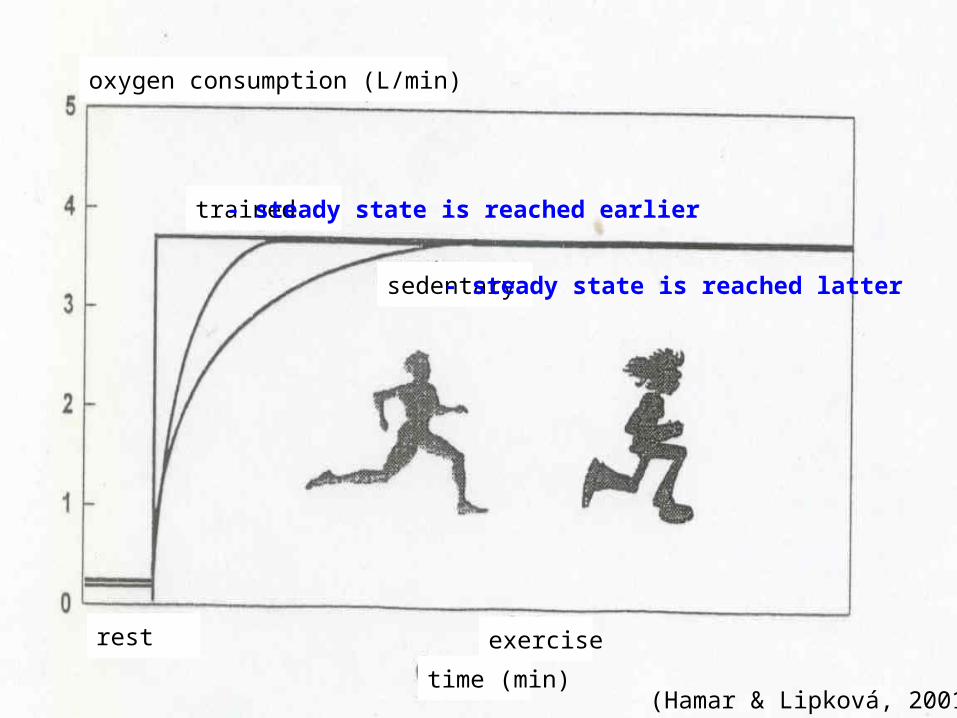
oxygen consumption (L/min)
rest exercise
time (min)
sedentary - steady state is reached latter
trained - steady state is reached earlier
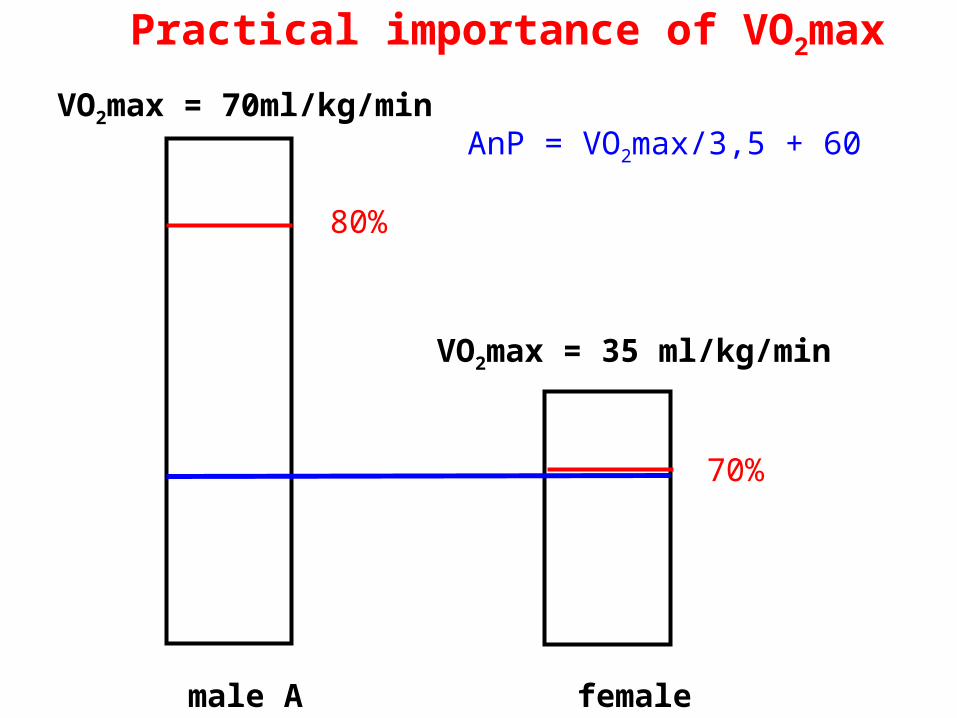
Practical importance of VO2max
male A female
VO2max = 70ml/kg/min
VO2max = 35 ml/kg/min
AnP = VO2max/3,5 + 60
80%
70%
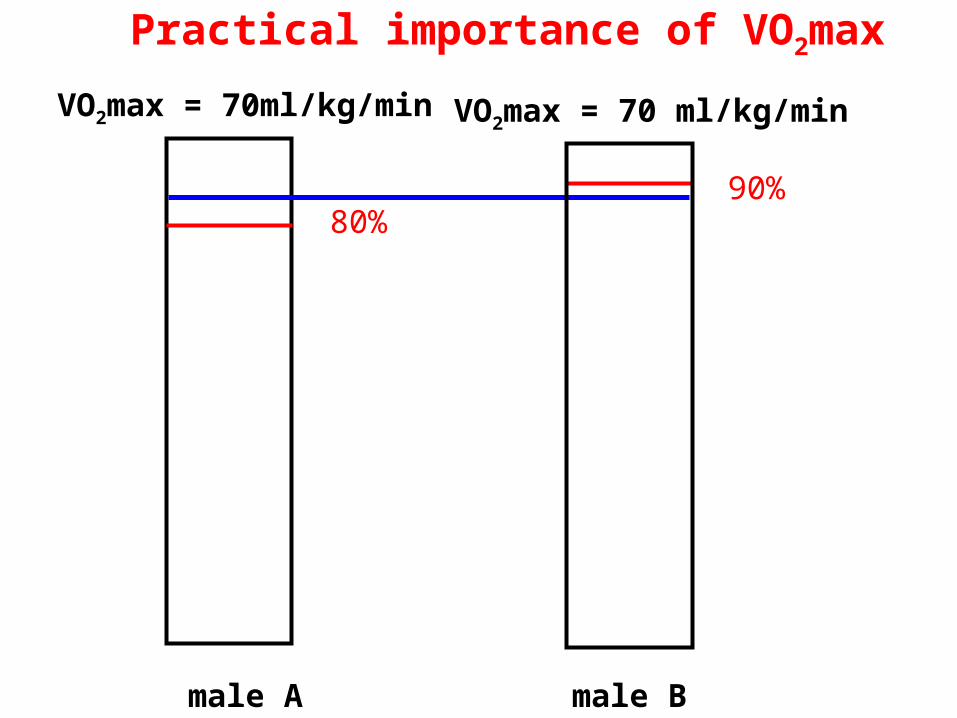
male A male B
VO2max = 70ml/kg/min VO2max = 70 ml/kg/min
80%90%
Practical importance of VO2max
Critical parameter of endurance abilities is not VO2max,
but AnT.
However VO2max is conditional parameter of AnT.