Embed Size (px)
Citation preview
EXECUTIVE SUMMARY
workingmother.com/best-companies | 2Source: 2016 Working Mother 100 Best Companies
For 31 years, the Working Mother 100 Best Companies has set the standard for work life practices in the United States.
The Working Mother Research Institute collects data on the workforce policies of the winning companies in order to:
• Reveal how the Best Companies lead in the areas of representation, benefits, advancement, child care, flexible work arrangements, parental leave and company culture.
• Create a benchmark of progressive policies and programs that make organizations succeed.
• Raise awareness of the issues working mothers and all employees face in the workplace and encourage the development of programs to address those issues.
• Promote the interests of working mothers in corporate America by honoring companies that successfully help employees integrate home and work.
BACKGROUND
workingmother.com/best-companies | 3Source: 2016 Working Mother 100 Best Companies
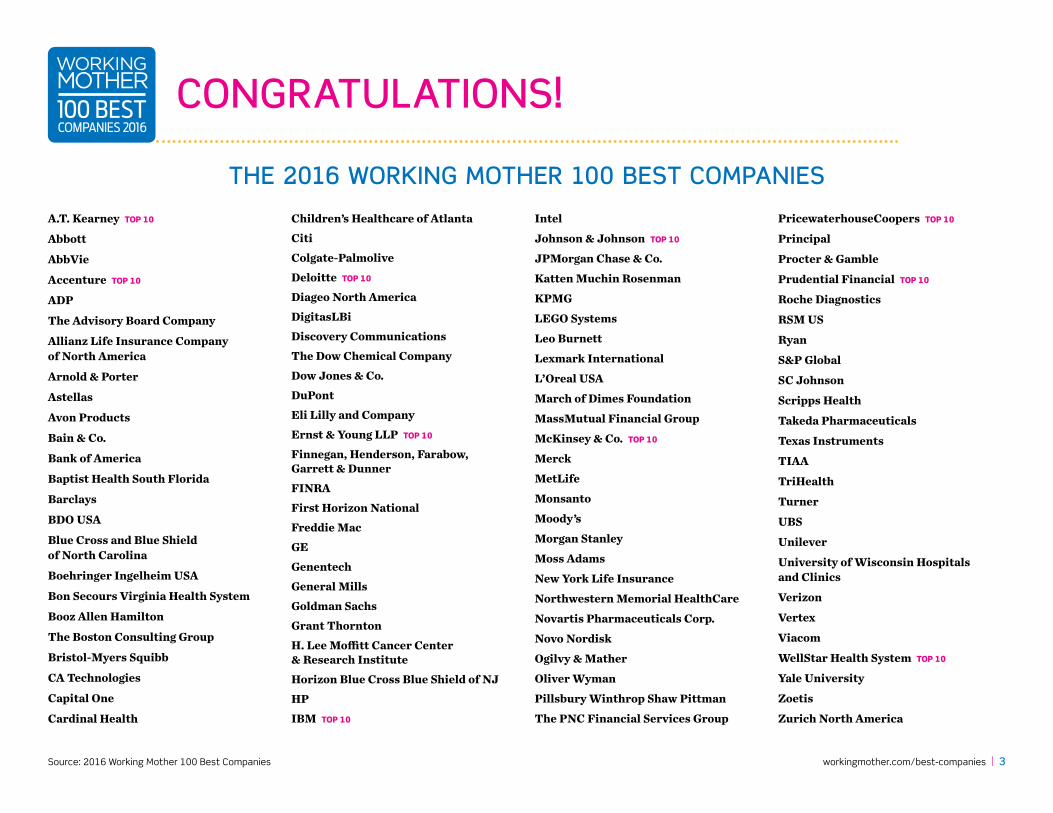
CONGRATULATIONS!
THE 2016 WORKING MOTHER 100 BEST COMPANIES
A.T. Kearney TOP 10
Abbott
AbbVie
Accenture TOP 10
ADP
The Advisory Board Company
Allianz Life Insurance Company of North America
Arnold & Porter
Astellas
Avon Products
Bain & Co.
Bank of America
Baptist Health South Florida
Barclays
BDO USA
Blue Cross and Blue Shield of North Carolina
Boehringer Ingelheim USA
Bon Secours Virginia Health System
Booz Allen Hamilton
The Boston Consulting Group
Bristol-Myers Squibb
CA Technologies
Capital One
Cardinal Health
Children’s Healthcare of AtlantaCitiColgate-PalmoliveDeloitte TOP 10
Diageo North AmericaDigitasLBiDiscovery CommunicationsThe Dow Chemical CompanyDow Jones & Co.DuPontEli Lilly and CompanyErnst & Young LLP TOP 10
Finnegan, Henderson, Farabow, Garrett & DunnerFINRAFirst Horizon National Freddie MacGEGenentechGeneral MillsGoldman SachsGrant Thornton H. Lee Moffitt Cancer Center & Research InstituteHorizon Blue Cross Blue Shield of NJHP IBM TOP 10
Intel
Johnson & Johnson TOP 10
JPMorgan Chase & Co.
Katten Muchin Rosenman
KPMG
LEGO Systems
Leo Burnett
Lexmark International
L’Oreal USA
March of Dimes Foundation
MassMutual Financial Group
McKinsey & Co. TOP 10
Merck
MetLife
Monsanto
Moody’s
Morgan Stanley
Moss Adams
New York Life Insurance
Northwestern Memorial HealthCare
Novartis Pharmaceuticals Corp.
Novo Nordisk
Ogilvy & Mather
Oliver Wyman
Pillsbury Winthrop Shaw Pittman
The PNC Financial Services Group
PricewaterhouseCoopers TOP 10
Principal
Procter & Gamble
Prudential Financial TOP 10
Roche Diagnostics
RSM US
Ryan
S&P Global
SC Johnson
Scripps Health
Takeda Pharmaceuticals
Texas Instruments
TIAA
TriHealth
Turner
UBS
Unilever
University of Wisconsin Hospitals and Clinics
Verizon
Vertex
Viacom
WellStar Health System TOP 10
Yale University
Zoetis
Zurich North America
workingmother.com/best-companies | 4Source: 2016 and 2012 Working Mother 100 Best Companies; 2016 SHRM Employee Benefits Full Report
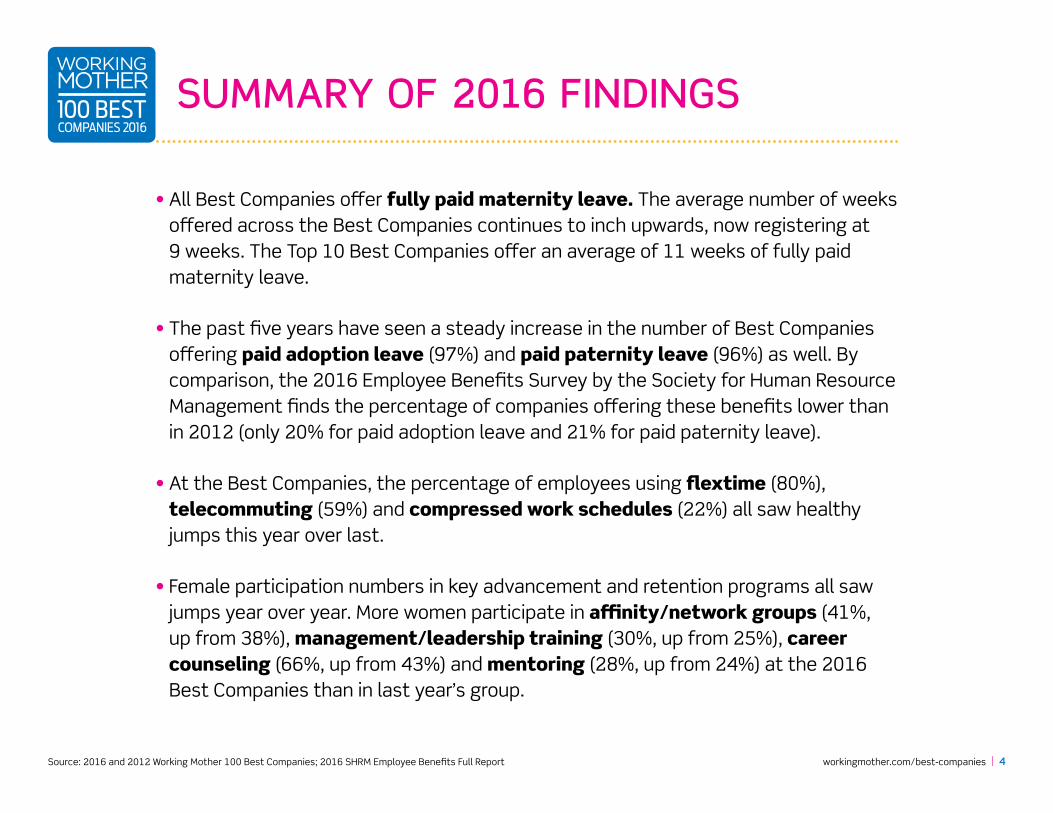
• All Best Companies offer fully paid maternity leave. The average number of weeks offered across the Best Companies continues to inch upwards, now registering at 9 weeks. The Top 10 Best Companies offer an average of 11 weeks of fully paid maternity leave.
• The past five years have seen a steady increase in the number of Best Companies offering paid adoption leave (97%) and paid paternity leave (96%) as well. By comparison, the 2016 Employee Benefits Survey by the Society for Human Resource Management finds the percentage of companies offering these benefits lower than in 2012 (only 20% for paid adoption leave and 21% for paid paternity leave).
• At the Best Companies, the percentage of employees using flextime (80%), telecommuting (59%) and compressed work schedules (22%) all saw healthy jumps this year over last.
• Female participation numbers in key advancement and retention programs all saw jumps year over year. More women participate in affinity/network groups (41%, up from 38%), management/leadership training (30%, up from 25%), career counseling (66%, up from 43%) and mentoring (28%, up from 24%) at the 2016 Best Companies than in last year’s group.
SUMMARY OF 2016 FINDINGS
workingmother.com/best-companies | 5Source: 2016 Working Mother 100 Best Companies
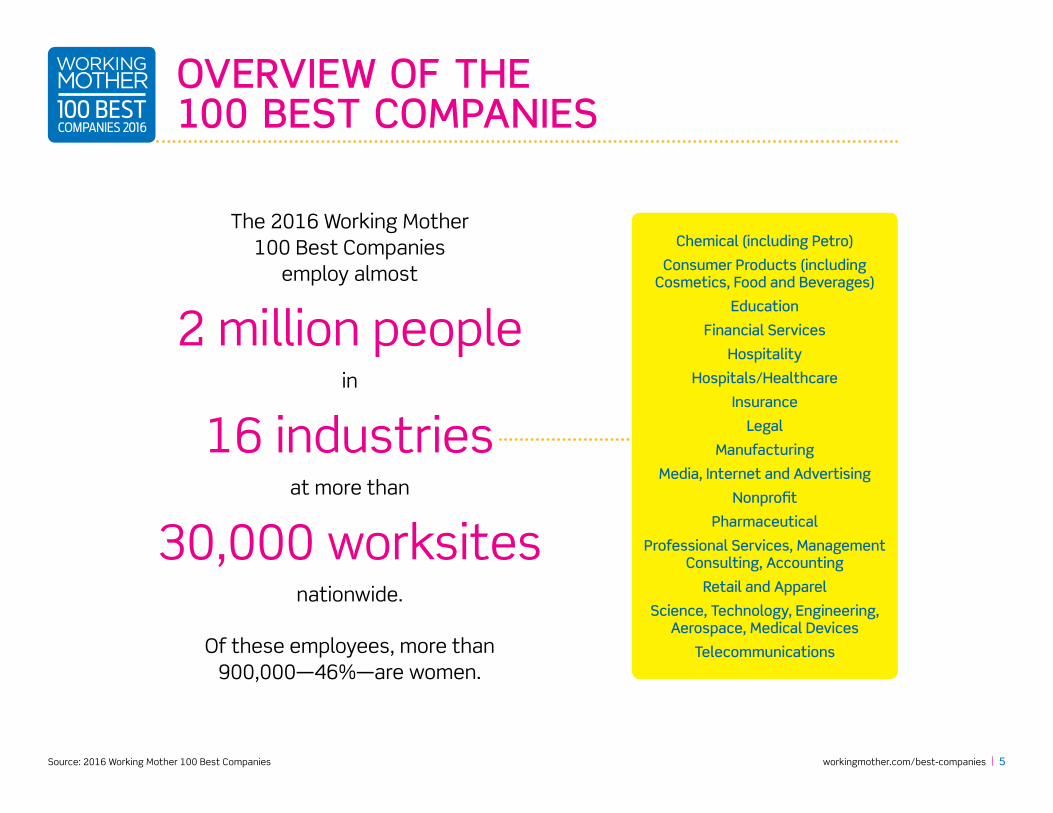
OVERVIEW OF THE 100 BEST COMPANIES
The 2016 Working Mother 100 Best Companies
employ almost
2 million people in
16 industries at more than
30,000 worksites nationwide.
Of these employees, more than 900,000—46%—are women.
Chemical (including Petro)
Consumer Products (including Cosmetics, Food and Beverages)
Education
Financial Services
Hospitality
Hospitals/Healthcare
Insurance
Legal
Manufacturing
Media, Internet and Advertising
Nonprofit
Pharmaceutical
Professional Services, Management Consulting, Accounting
Retail and Apparel
Science, Technology, Engineering, Aerospace, Medical Devices
Telecommunications
workingmother.com/best-companies | 6Source: 2016 and 2012 Working Mother 100 Best Companies
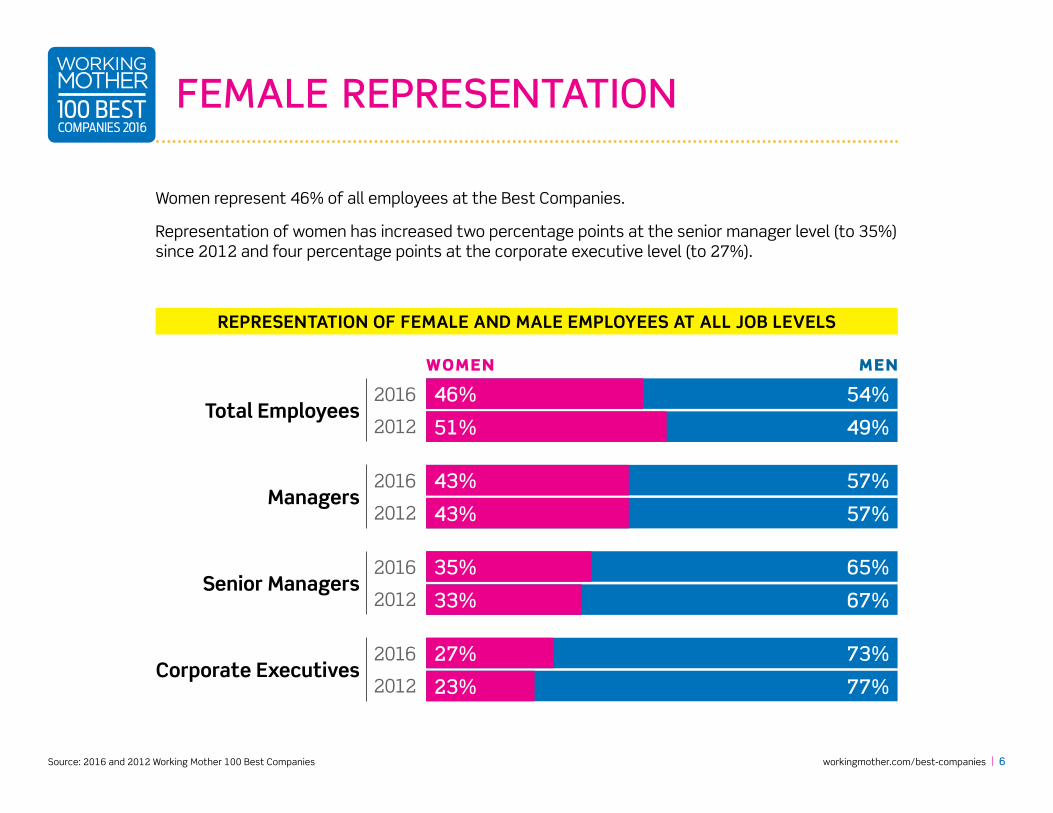
Women represent 46% of all employees at the Best Companies.
Representation of women has increased two percentage points at the senior manager level (to 35%) since 2012 and four percentage points at the corporate executive level (to 27%).
FEMALE REPRESENTATION
WOMEN MEN
Total Employees2016
2012
54%
49%
46%
51%
Managers2016
2012 57%
57%43%
43%
Senior Managers2016
2012 67%33%
65%35%
Corporate Executives2016
2012
73%
77%
27%
23%
REPRESENTATION OF FEMALE AND MALE EMPLOYEES AT ALL JOB LEVELS
workingmother.com/best-companies | 7Source: 2016 Working Mother 100 Best Companies
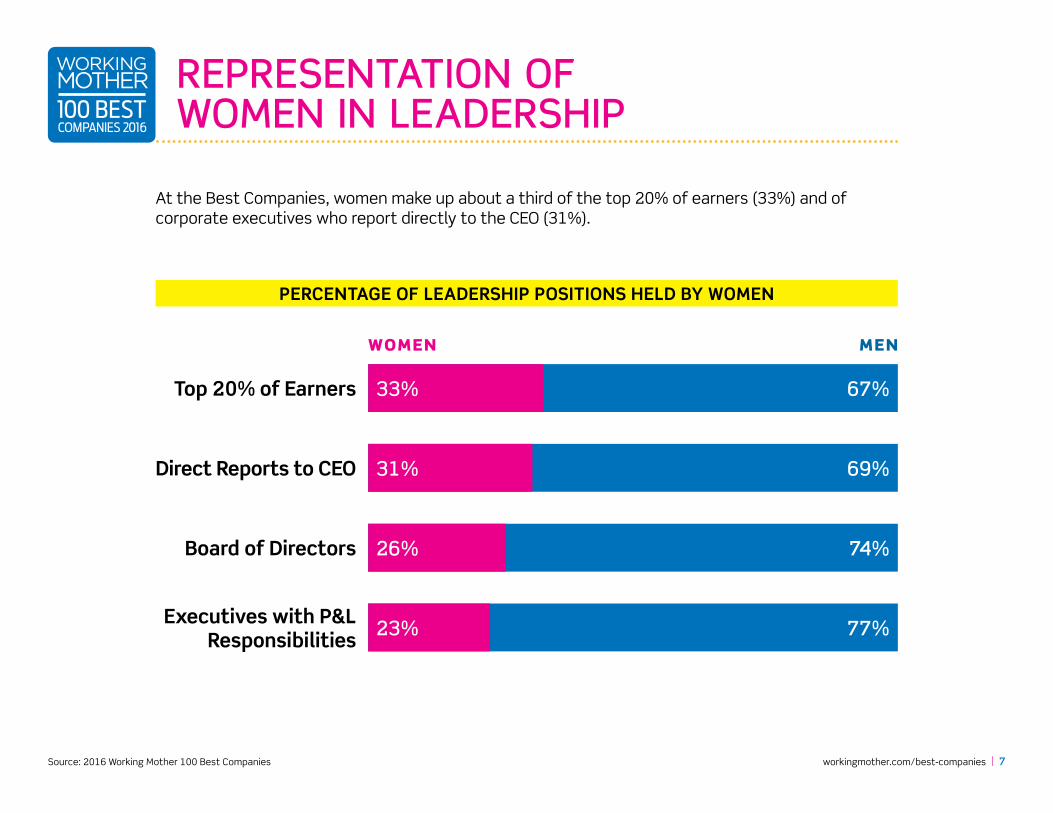
At the Best Companies, women make up about a third of the top 20% of earners (33%) and of corporate executives who report directly to the CEO (31%).
REPRESENTATION OF WOMEN IN LEADERSHIP
WOMEN MEN
Top 20% of Earners
Direct Reports to CEO
Board of Directors
67%33%
Executives with P&L Responsibilities 77%23%
74%26%
69%31%
PERCENTAGE OF LEADERSHIP POSITIONS HELD BY WOMEN
workingmother.com/best-companies | 8Source: 2016 and 2015 Working Mother 100 Best Companies
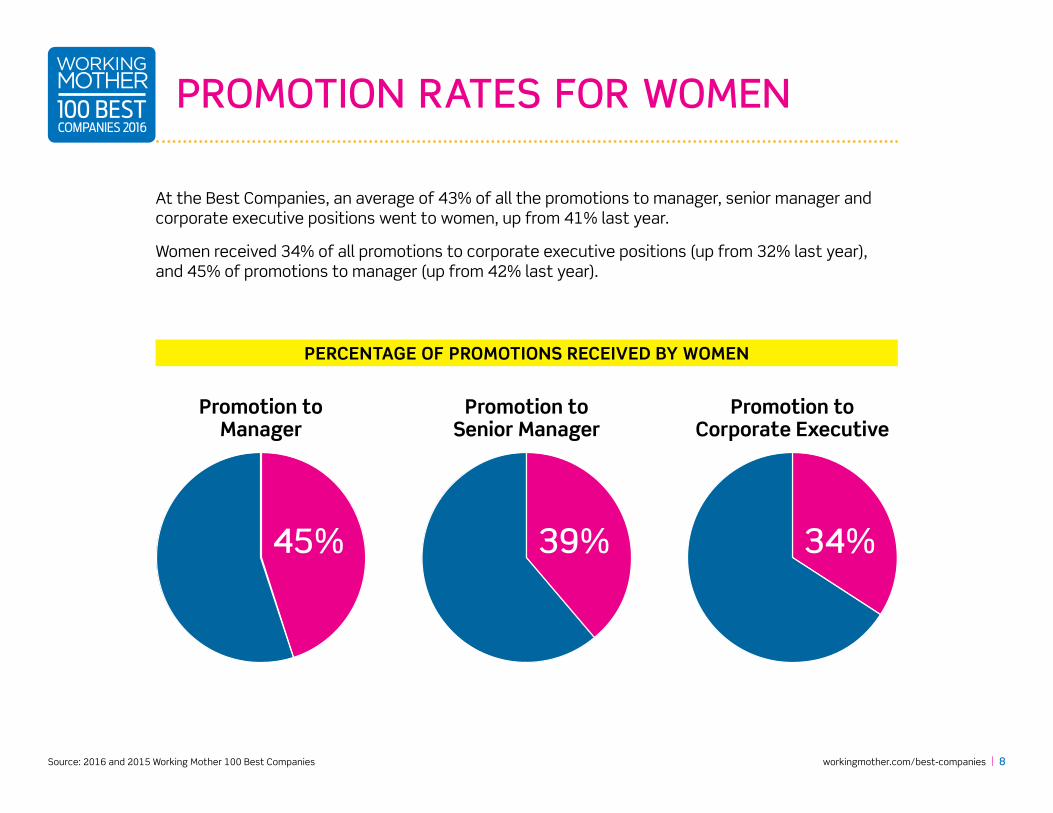
At the Best Companies, an average of 43% of all the promotions to manager, senior manager and corporate executive positions went to women, up from 41% last year.
Women received 34% of all promotions to corporate executive positions (up from 32% last year), and 45% of promotions to manager (up from 42% last year).
PROMOTION RATES FOR WOMEN
PERCENTAGE OF PROMOTIONS RECEIVED BY WOMEN
Promotion to Manager
Promotion to Senior Manager
Promotion to Corporate Executive
39% 34%45%
workingmother.com/best-companies | 9Source: 2016 and 2015 Working Mother 100 Best Companies
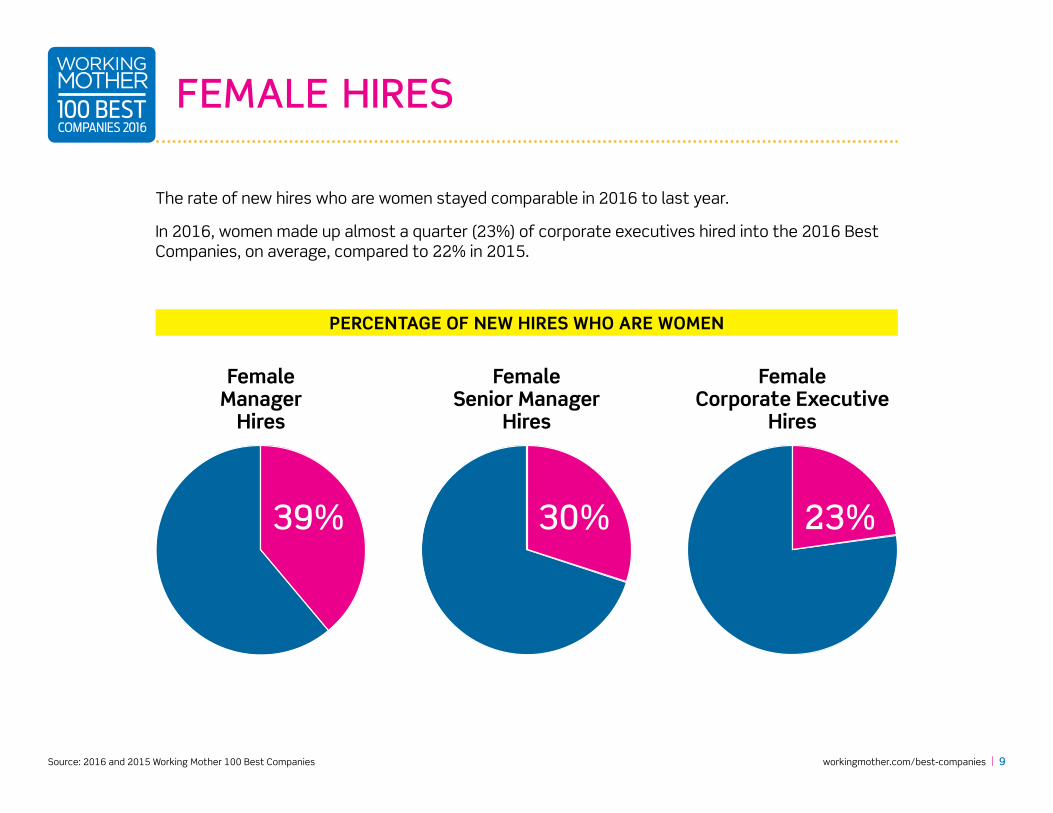
The rate of new hires who are women stayed comparable in 2016 to last year.
In 2016, women made up almost a quarter (23%) of corporate executives hired into the 2016 Best Companies, on average, compared to 22% in 2015.
FEMALE HIRES
PERCENTAGE OF NEW HIRES WHO ARE WOMEN
Female Manager
Hires
Female Senior Manager
Hires
Female Corporate Executive
Hires
39% 23%30%
workingmother.com/best-companies | 10Source: 2016 and 2012 Working Mother 100 Best Companies
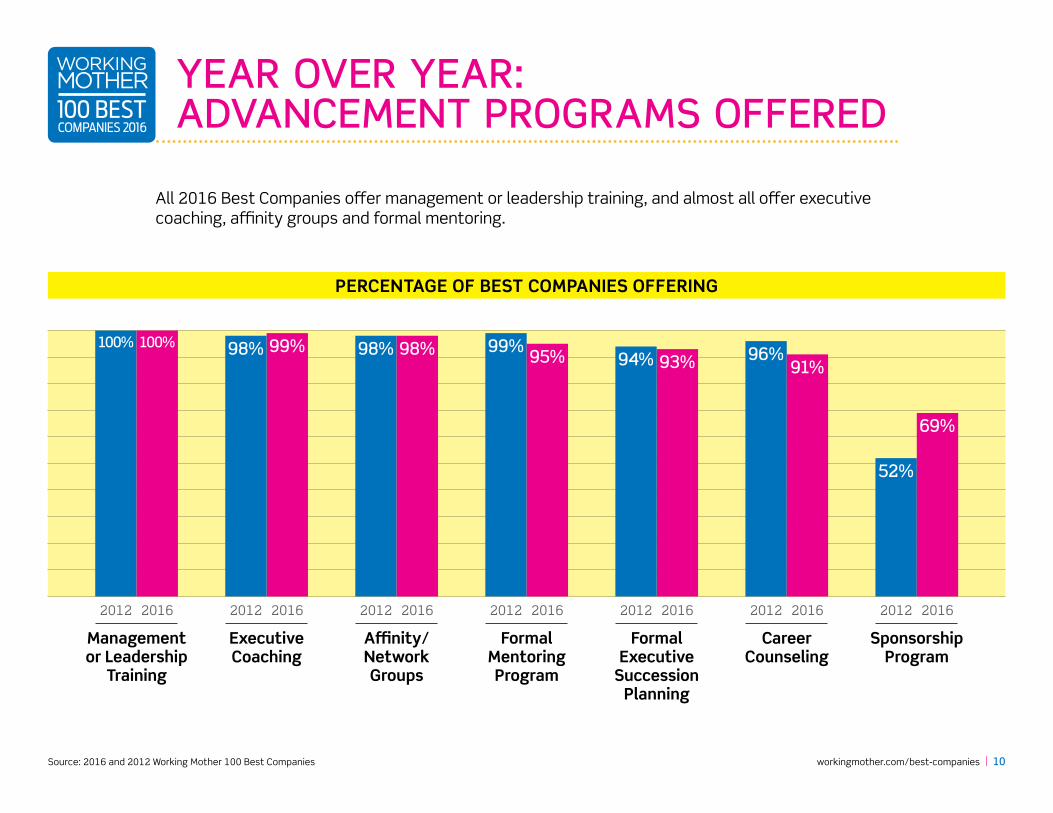
All 2016 Best Companies offer management or leadership training, and almost all offer executive coaching, affinity groups and formal mentoring.
YEAR OVER YEAR: ADVANCEMENT PROGRAMS OFFERED
PERCENTAGE OF BEST COMPANIES OFFERING
Management or Leadership
Training
Formal Mentoring Program
Affinity/Network Groups
Career Counseling
Formal Executive
Succession Planning
Executive Coaching
Sponsorship Program
2012 2016 2012 2016 2012 20162012 2016 2012 20162012 2016 2012 2016
96%91%
100% 100%
52%
69%
99% 99%95% 93%
98% 98% 98%94%
workingmother.com/best-companies | 11Source: 2016, 2015, 2014, 2013, 2012 and 2011 Working Mother 100 Best Companies
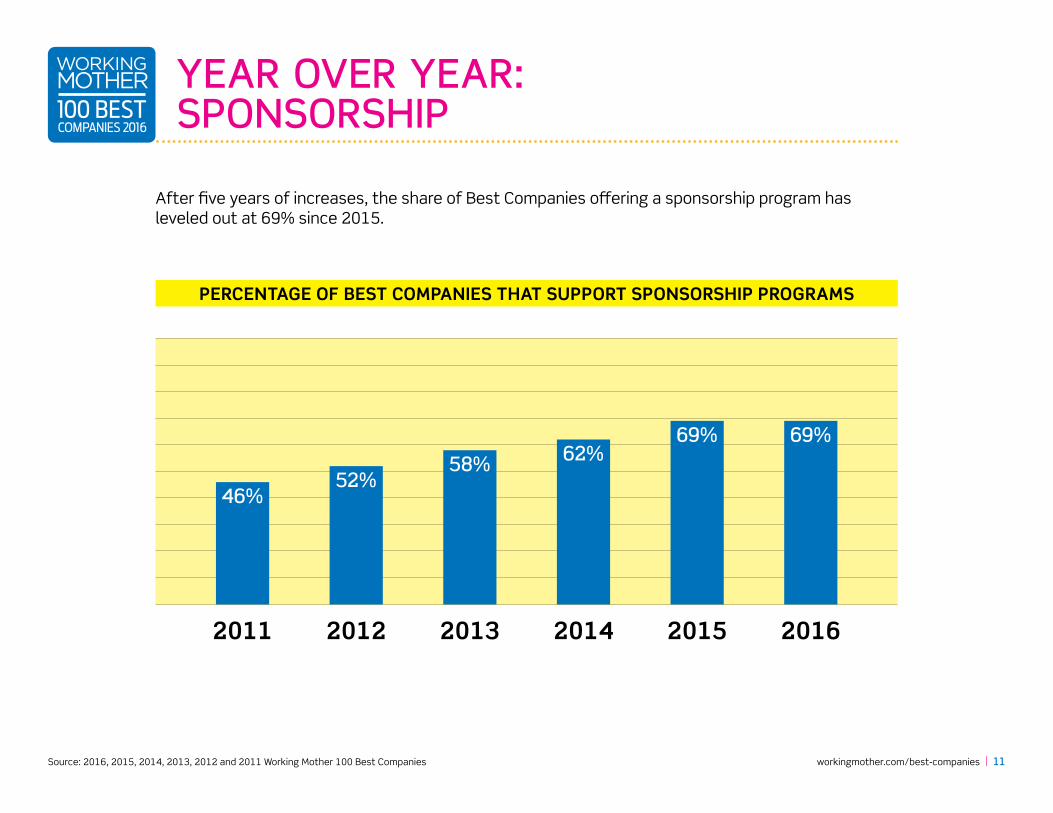
After five years of increases, the share of Best Companies offering a sponsorship program has leveled out at 69% since 2015.
YEAR OVER YEAR: SPONSORSHIP
PERCENTAGE OF BEST COMPANIES THAT SUPPORT SPONSORSHIP PROGRAMS
2011 20142013 201620152012
46%
62%58%69%69%
52%
workingmother.com/best-companies | 12Source: 2016, 2015, 2014, 2013, 2012 and 2011 Working Mother 100 Best Companies
YEAR OVER YEAR: WOMEN’S USE OF ADVANCEMENT PROGRAMS
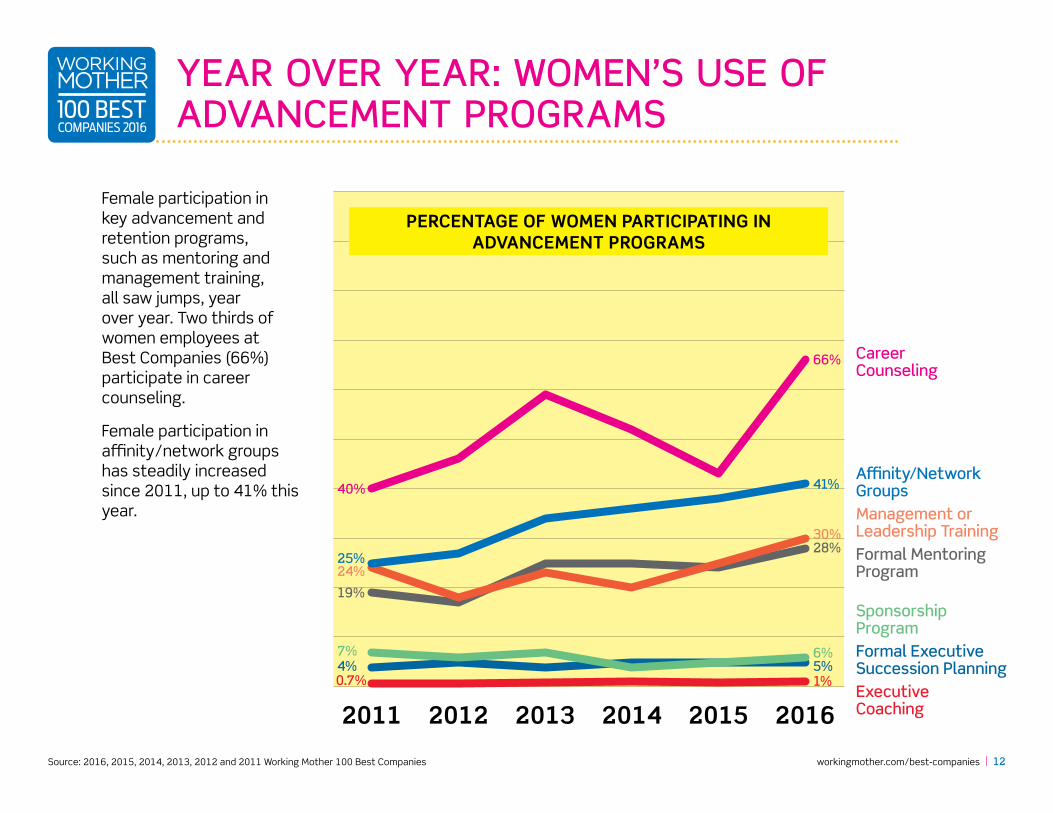
Female participation in key advancement and retention programs, such as mentoring and management training, all saw jumps, year over year. Two thirds of women employees at Best Companies (66%) participate in career counseling.
Female participation in affinity/network groups has steadily increased since 2011, up to 41% this year.
PERCENTAGE OF WOMEN PARTICIPATING IN ADVANCEMENT PROGRAMS
2011 20142013 201620152012
40%
66% Career Counseling
41%
25%
Affinity/Network Groups
19%
28% Formal Mentoring Program
30%
24%
Management or Leadership Training
7% 6%
Sponsorship Program
4% 5%Formal Executive Succession Planning
1%0.7%Executive Coaching
workingmother.com/best-companies | 13Source: 2016 Working Mother 100 Best Companies
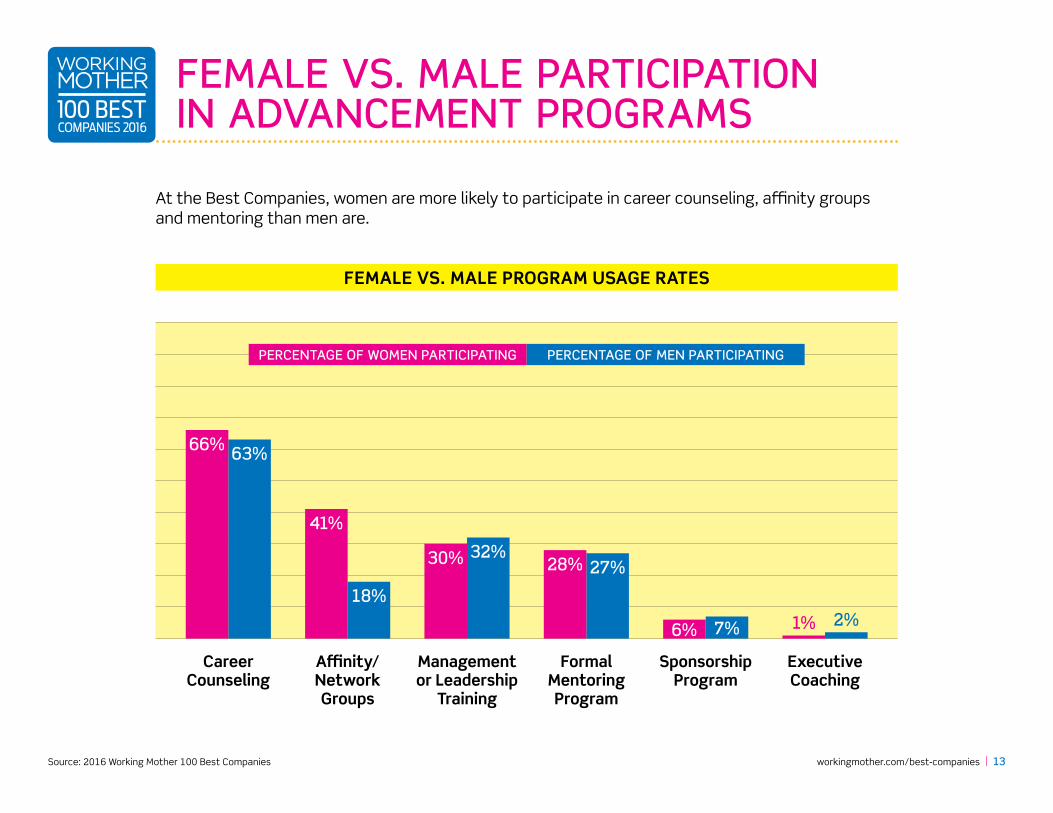
At the Best Companies, women are more likely to participate in career counseling, affinity groups and mentoring than men are.
FEMALE VS. MALE PARTICIPATION IN ADVANCEMENT PROGRAMS
FEMALE VS. MALE PROGRAM USAGE RATES
Career Counseling
Affinity/Network Groups
Sponsorship Program
Executive Coaching
63%66%
7%6%
Formal Mentoring Program
27%28%
Management or Leadership
Training
32%30%
18%
41%
1% 2%
PERCENTAGE OF WOMEN PARTICIPATING PERCENTAGE OF MEN PARTICIPATING
workingmother.com/best-companies | 14Source: 2016 Working Mother 100 Best Companies; 2016 SHRM Employee Benefits Full Report
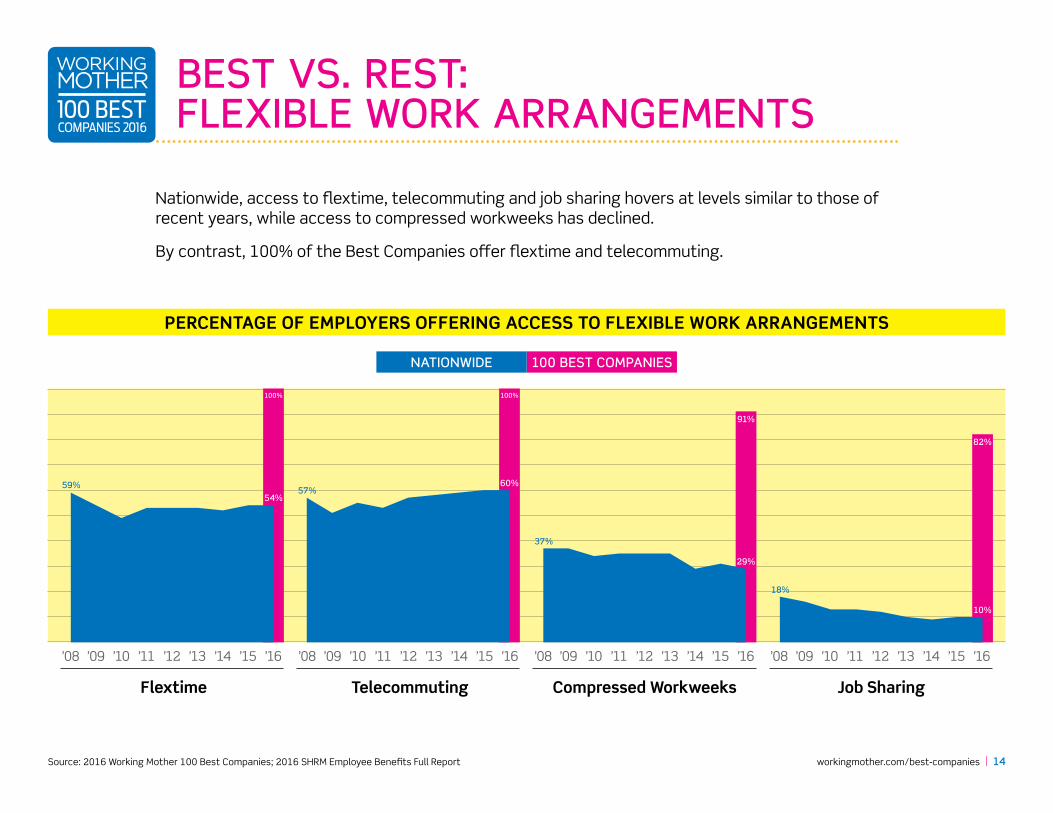
Nationwide, access to flextime, telecommuting and job sharing hovers at levels similar to those of recent years, while access to compressed workweeks has declined.
By contrast, 100% of the Best Companies offer flextime and telecommuting.
BEST VS. REST: FLEXIBLE WORK ARRANGEMENTS
PERCENTAGE OF EMPLOYERS OFFERING ACCESS TO FLEXIBLE WORK ARRANGEMENTS
100 BEST COMPANIESNATIONWIDE
Flextime
’12’11’10’09’08 ’13 ’15’14 ’16
100%
’12’11’10’09’08 ’13 ’15’14 ’16
Telecommuting
100%
59%54%
57%60%
’12’11’10’09’08 ’13 ’15’14 ’16
Job Sharing
82%
18%
10%
’12’11’10’09’08 ’13 ’15’14 ’16
Compressed Workweeks
91%
37%
29%
workingmother.com/best-companies | 15Source: 2016, 2015, 2014, 2013, 2012, 2011, 2010 and 2009 Working Mother 100 Best Companies
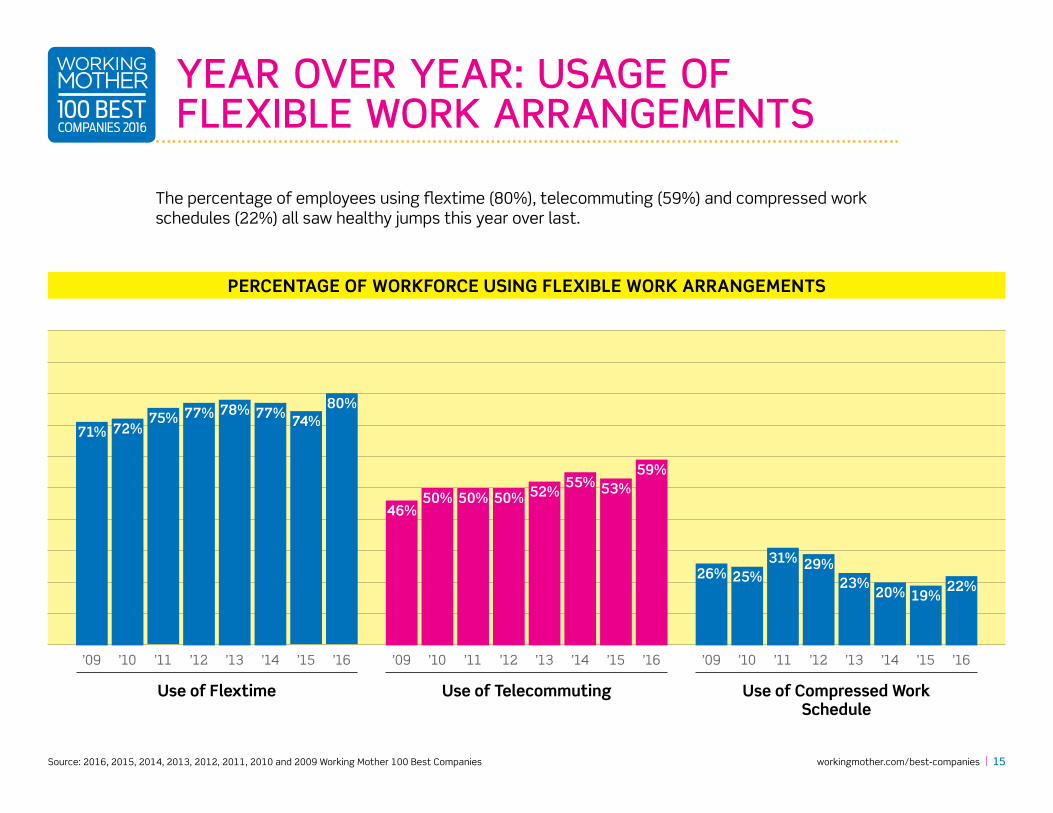
The percentage of employees using flextime (80%), telecommuting (59%) and compressed work schedules (22%) all saw healthy jumps this year over last.
YEAR OVER YEAR: USAGE OF FLEXIBLE WORK ARRANGEMENTS
PERCENTAGE OF WORKFORCE USING FLEXIBLE WORK ARRANGEMENTS
Use of Flextime
78%
71% 72%75% 74%
80%77% 77%
’13’09 ’10 ’11 ’15 ’16’12 ’14 ’13’09 ’10 ’11 ’15 ’16’12 ’14 ’13’09 ’10 ’11 ’15 ’16’12 ’14
Use of Telecommuting
55%52% 53%
59%
46%50% 50% 50%
Use of Compressed Work Schedule
22%20% 19%23%
26% 25%31% 29%
workingmother.com/best-companies | 16Source: 2016 Working Mother 100 Best Companies
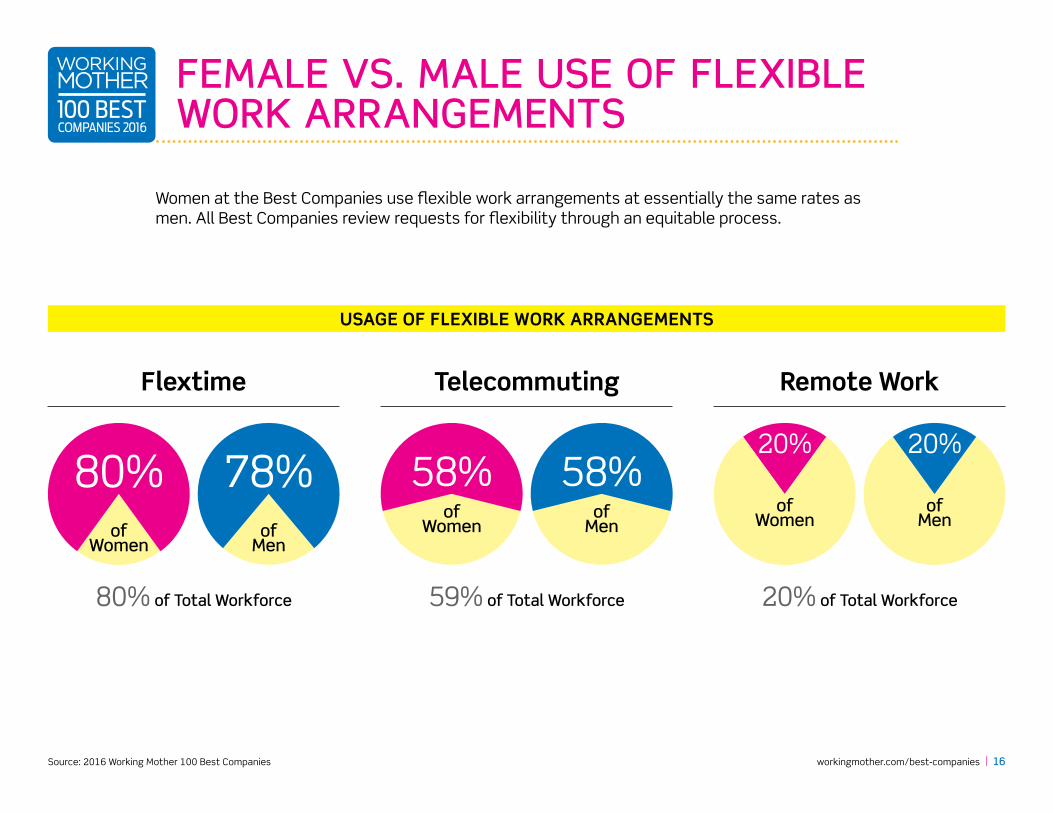
Women at the Best Companies use flexible work arrangements at essentially the same rates as men. All Best Companies review requests for flexibility through an equitable process.
FEMALE VS. MALE USE OF FLEXIBLE WORK ARRANGEMENTS
USAGE OF FLEXIBLE WORK ARRANGEMENTS
Flextime
80% of Total Workforce
Telecommuting
59% of Total Workforce
Remote Work
20% of Total Workforce
of Women
of Menof
Womenof
Men
of Women
of Men
20% 20%58% 58%80% 78%
workingmother.com/best-companies | 17Source: 2016 and 2012 Working Mother 100 Best Companies; 2016 SHRM Employee Benefits Full Report
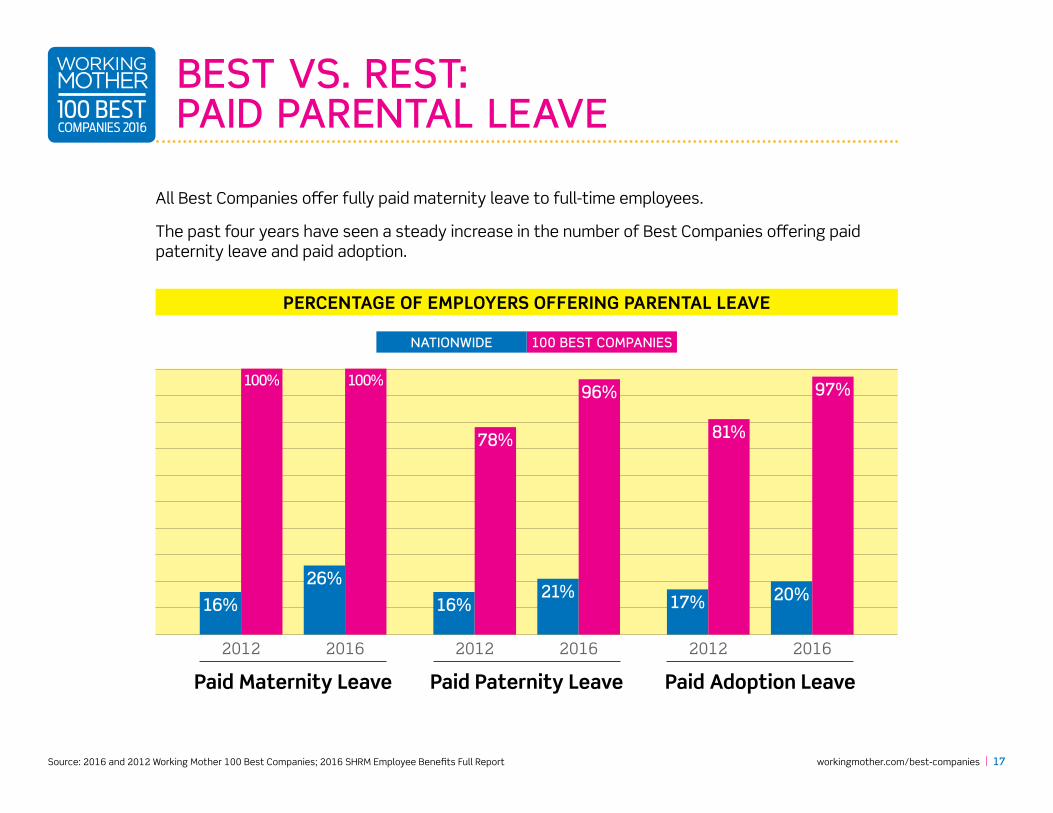
All Best Companies offer fully paid maternity leave to full-time employees.
The past four years have seen a steady increase in the number of Best Companies offering paid paternity leave and paid adoption.
BEST VS. REST: PAID PARENTAL LEAVE
PERCENTAGE OF EMPLOYERS OFFERING PARENTAL LEAVE
100 BEST COMPANIESNATIONWIDE
Paid Maternity Leave
2012 2016
16%
100%
26%
100%
Paid Adoption Leave
2012 2016
17%
81%
20%
97%
Paid Paternity Leave
2012 2016
16%
78%
21%
96%
workingmother.com/best-companies | 18Source: 2016, 2015, 2014, 2013 and 2012 Working Mother 100 Best Companies
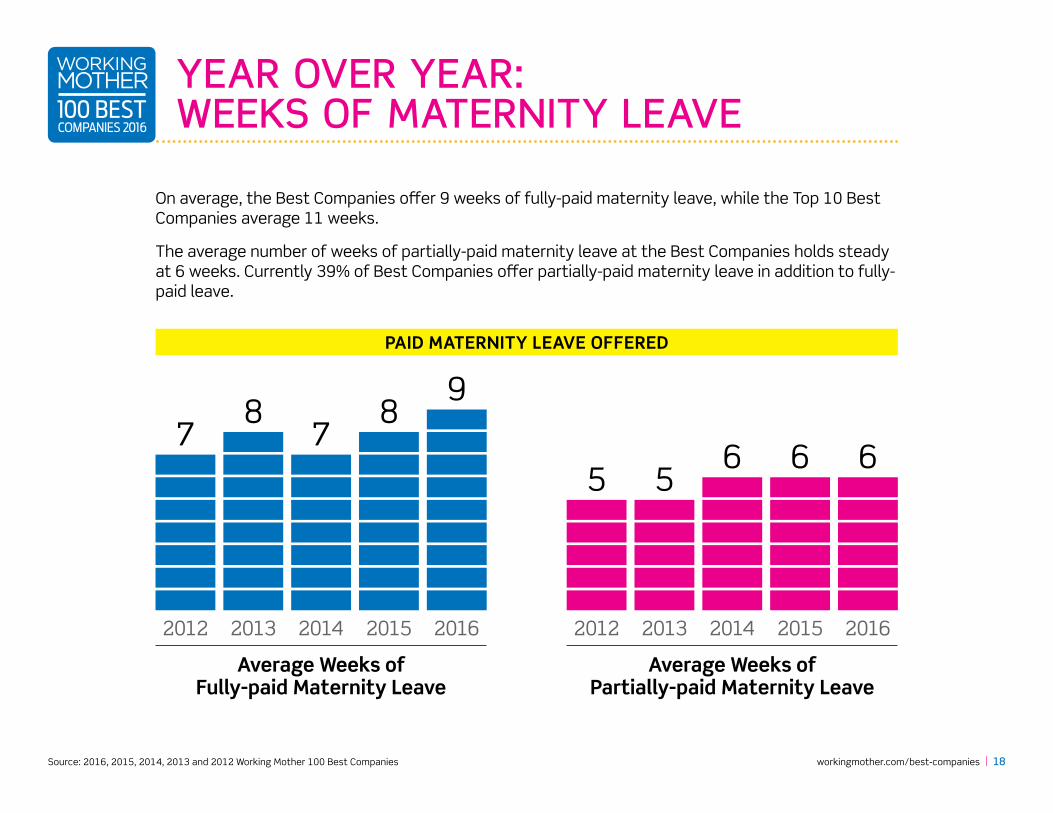
On average, the Best Companies offer 9 weeks of fully-paid maternity leave, while the Top 10 Best Companies average 11 weeks.
The average number of weeks of partially-paid maternity leave at the Best Companies holds steady at 6 weeks. Currently 39% of Best Companies offer partially-paid maternity leave in addition to fully-paid leave.
YEAR OVER YEAR: WEEKS OF MATERNITY LEAVE
PAID MATERNITY LEAVE OFFERED
Average Weeks of Fully-paid Maternity Leave
2012
79
20162014
7
2013
8
2015
8
2014
6
2015
6
2016
6
2012
5
2013
5
Average Weeks of Partially-paid Maternity Leave
workingmother.com/best-companies | 19Source: 2016, 2015, 2014, 2013 and 2012 Working Mother 100 Best Companies
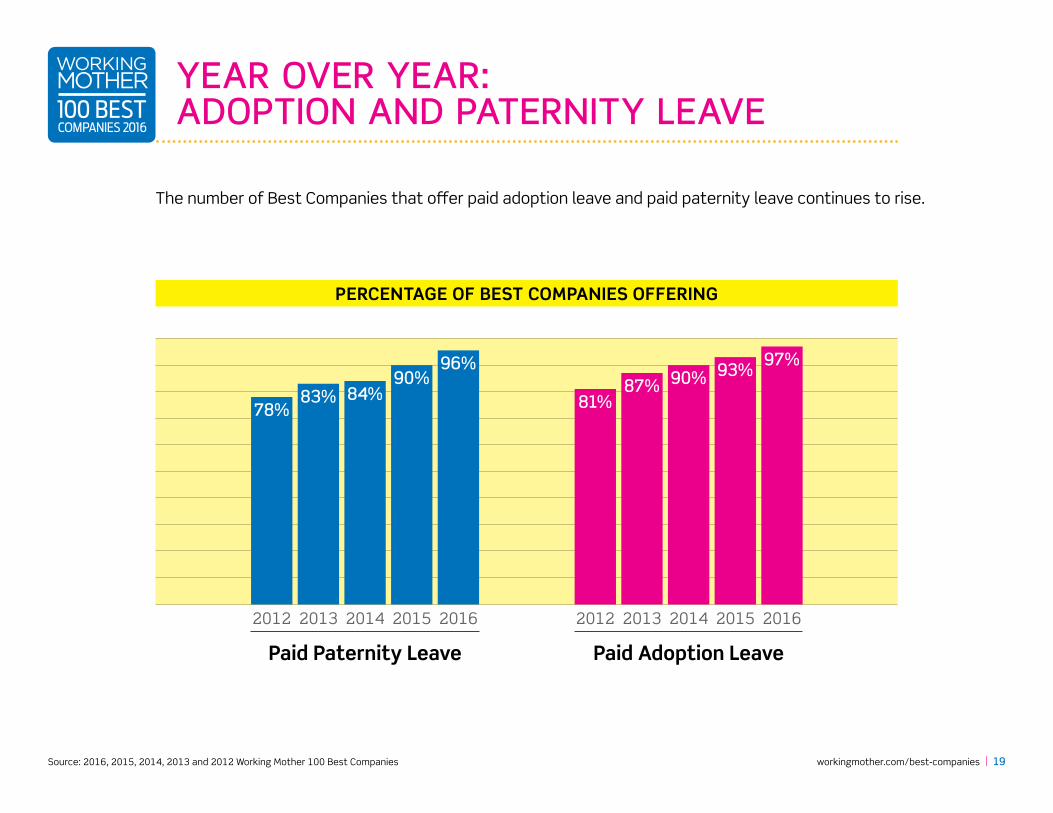
The number of Best Companies that offer paid adoption leave and paid paternity leave continues to rise.
YEAR OVER YEAR: ADOPTION AND PATERNITY LEAVE
PERCENTAGE OF BEST COMPANIES OFFERING
Paid Paternity Leave
2012
78%
2013
83%
2015
90%
2014
84%
2016
96%
Paid Adoption Leave
2012
81%
2013
87%
2015
93%
2014
90%
2016
97%
workingmother.com/best-companies | 20Source: 2016, 2015, 2014, 2013 and 2012 Working Mother 100 Best Companies
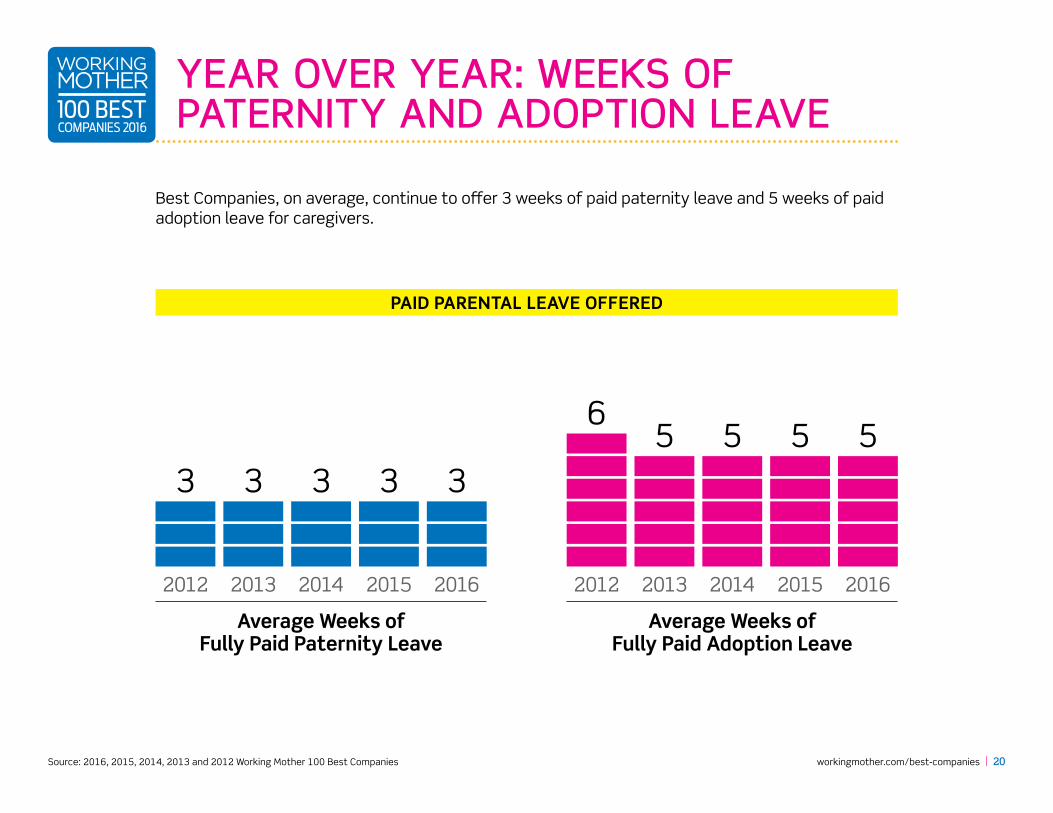
Best Companies, on average, continue to offer 3 weeks of paid paternity leave and 5 weeks of paid adoption leave for caregivers.
YEAR OVER YEAR: WEEKS OF PATERNITY AND ADOPTION LEAVE
PAID PARENTAL LEAVE OFFERED
Average Weeks of Fully Paid Paternity Leave
2012
3 3
20162014
3
2013
3
2015
3
2014
6
2015 20162012
5 5 5
2013
5
Average Weeks of Fully Paid Adoption Leave
workingmother.com/best-companies | 21Source: 2016, 2015, 2014, 2013 and 2012 Working Mother 100 Best Companies
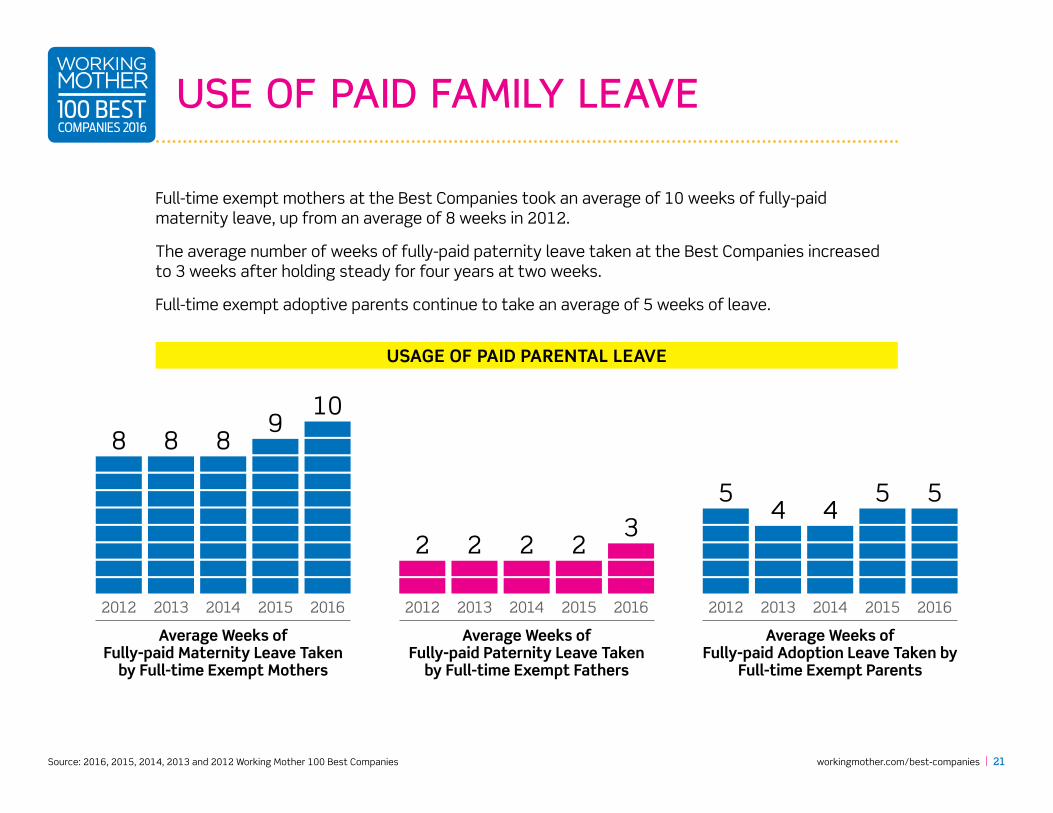
Full-time exempt mothers at the Best Companies took an average of 10 weeks of fully-paid maternity leave, up from an average of 8 weeks in 2012.
The average number of weeks of fully-paid paternity leave taken at the Best Companies increased to 3 weeks after holding steady for four years at two weeks.
Full-time exempt adoptive parents continue to take an average of 5 weeks of leave.
USE OF PAID FAMILY LEAVE
USAGE OF PAID PARENTAL LEAVE
2014
2
2015
2
2016
3
2012
2
2013
2
Average Weeks of Fully-paid Paternity Leave Taken
by Full-time Exempt Fathers
2014
4
2015
5
2016
5
2012
5
2013
4
Average Weeks of Fully-paid Adoption Leave Taken by
Full-time Exempt Parents
Average Weeks of Fully-paid Maternity Leave Taken
by Full-time Exempt Mothers
2012
10
201620142013 2015
89
8 8
workingmother.com/best-companies | 22Source: 2016 and 2012 Working Mother 100 Best Companies; 2016 SHRM Employee Benefits Full Report
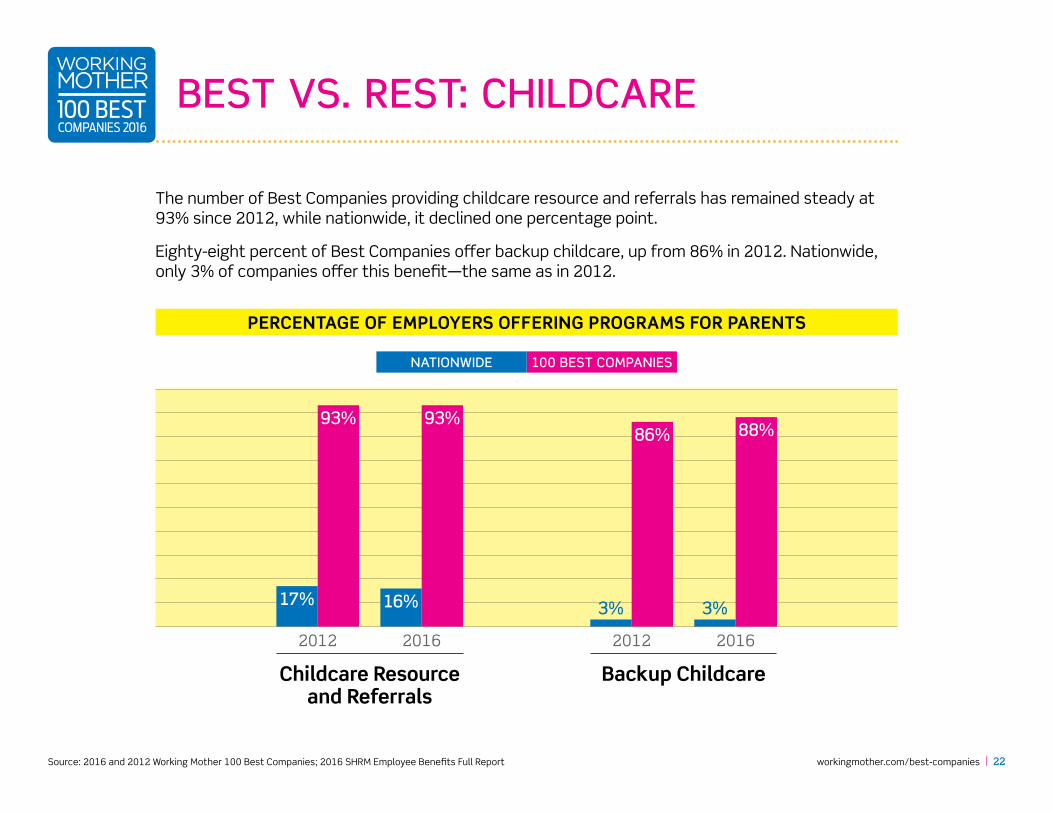
The number of Best Companies providing childcare resource and referrals has remained steady at 93% since 2012, while nationwide, it declined one percentage point.
Eighty-eight percent of Best Companies offer backup childcare, up from 86% in 2012. Nationwide, only 3% of companies offer this benefit—the same as in 2012.
BEST VS. REST: CHILDCARE
PERCENTAGE OF EMPLOYERS OFFERING PROGRAMS FOR PARENTS
100 BEST COMPANIESNATIONWIDE
Backup Childcare
2012 2016
3%
86%
3%
88%
Childcare Resource and Referrals
2012 2016
16%17%
93% 93%
workingmother.com/best-companies | 23Source: 2016 and 2012 Working Mother 100 Best Companies; 2016 SHRM Employee Benefits Full Report
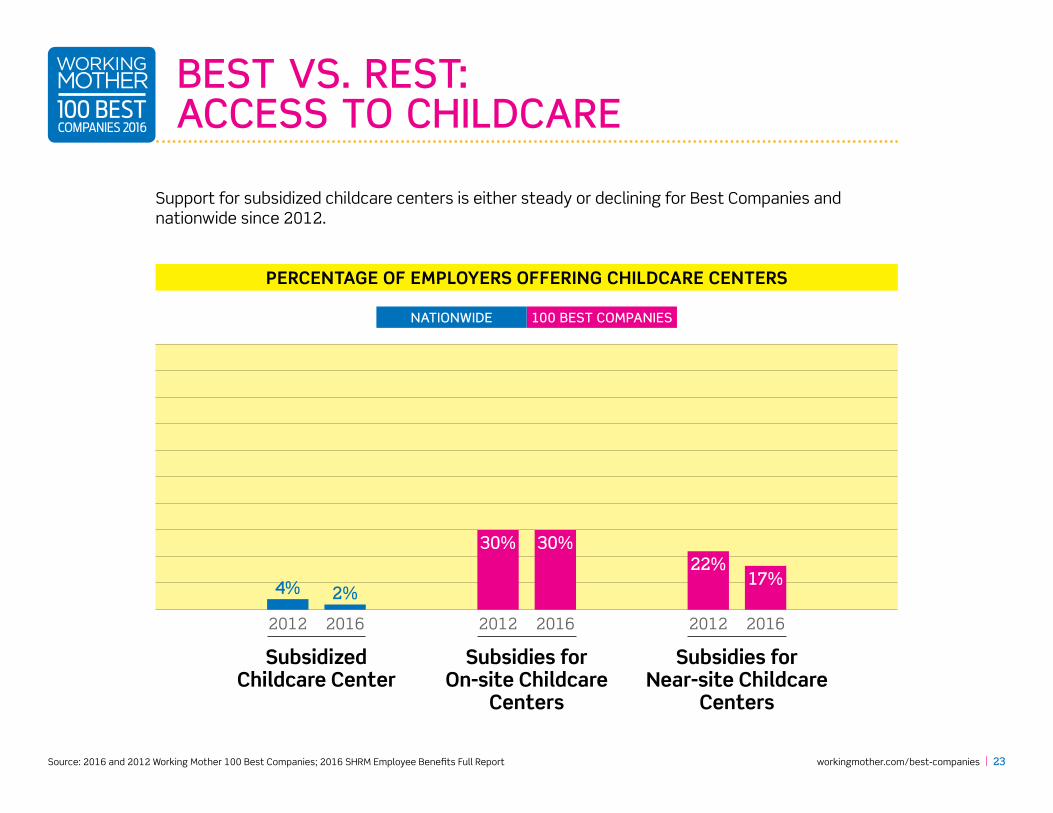
Support for subsidized childcare centers is either steady or declining for Best Companies and nationwide since 2012.
BEST VS. REST: ACCESS TO CHILDCARE
PERCENTAGE OF EMPLOYERS OFFERING CHILDCARE CENTERS
100 BEST COMPANIESNATIONWIDE
Subsidized Childcare Center
2012
4%
2016
2%
Subsidies for Near-site Childcare
Centers
2012
22%
2016
17%
Subsidies for On-site Childcare
Centers
2012
30%
2016
30%
workingmother.com/best-companies | 24Source: 2016 and 2012 Working Mother 100 Best Companies
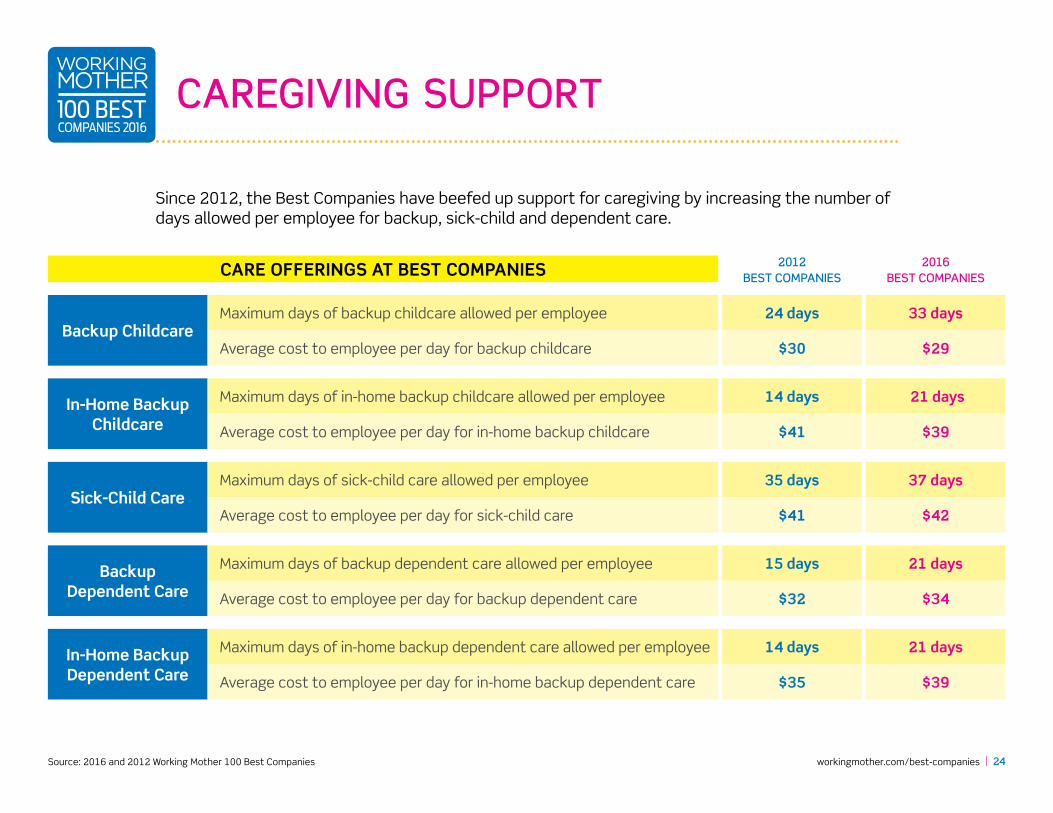
Since 2012, the Best Companies have beefed up support for caregiving by increasing the number of days allowed per employee for backup, sick-child and dependent care.
CAREGIVING SUPPORT
CARE OFFERINGS AT BEST COMPANIES
Backup ChildcareMaximum days of backup childcare allowed per employee
Average cost to employee per day for backup childcare
Sick-Child CareMaximum days of sick-child care allowed per employee
Average cost to employee per day for sick-child care
In-Home Backup Childcare
Maximum days of in-home backup childcare allowed per employee
Average cost to employee per day for in-home backup childcare
Backup Dependent Care
Maximum days of backup dependent care allowed per employee
Average cost to employee per day for backup dependent care
In-Home Backup Dependent Care
Maximum days of in-home backup dependent care allowed per employee
Average cost to employee per day for in-home backup dependent care
2012 BEST COMPANIES
24 days
$30
35 days
$41
14 days
$41
15 days
$32
14 days
$35
2016 BEST COMPANIES
33 days
$29
37 days
$42
21 days
$39
21 days
$34
21 days
$39
workingmother.com/best-companies | 25Source: 2016 and 2012 Working Mother 100 Best Companies; 2016 SHRM Employee Benefits Full Report
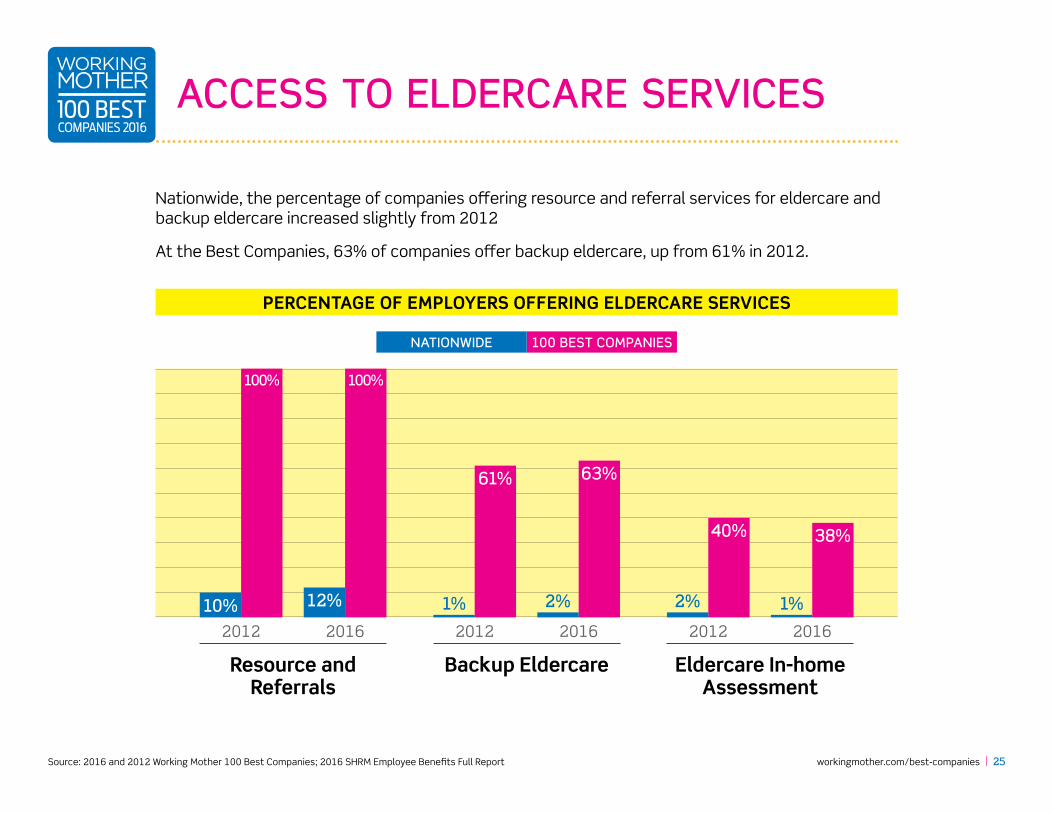
Nationwide, the percentage of companies offering resource and referral services for eldercare and backup eldercare increased slightly from 2012
At the Best Companies, 63% of companies offer backup eldercare, up from 61% in 2012.
ACCESS TO ELDERCARE SERVICES
PERCENTAGE OF EMPLOYERS OFFERING ELDERCARE SERVICES
100 BEST COMPANIESNATIONWIDE
10%
100%
12%
100%
40%
Resource and Referrals
2012 2016
Eldercare In-home Assessment
2012 2016
Backup Eldercare
2012 2016
61% 63%
2%1%
38%
1%2%
workingmother.com/best-companies | 26
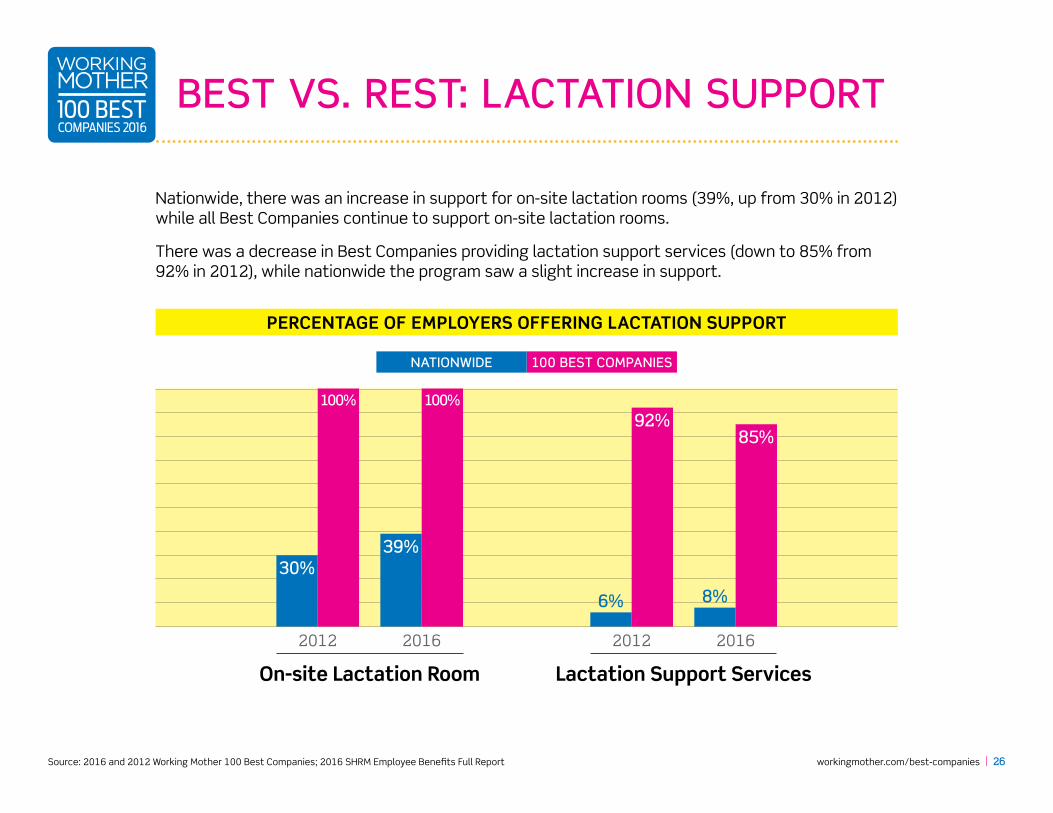
Nationwide, there was an increase in support for on-site lactation rooms (39%, up from 30% in 2012) while all Best Companies continue to support on-site lactation rooms.
There was a decrease in Best Companies providing lactation support services (down to 85% from 92% in 2012), while nationwide the program saw a slight increase in support.
BEST VS. REST: LACTATION SUPPORT
PERCENTAGE OF EMPLOYERS OFFERING LACTATION SUPPORT
100 BEST COMPANIESNATIONWIDE
Lactation Support Services
2012 2016
6%
92%
8%
85%
On-site Lactation Room
2012 2016
39%30%
100% 100%
Source: 2016 and 2012 Working Mother 100 Best Companies; 2016 SHRM Employee Benefits Full Report
workingmother.com/best-companies | 27
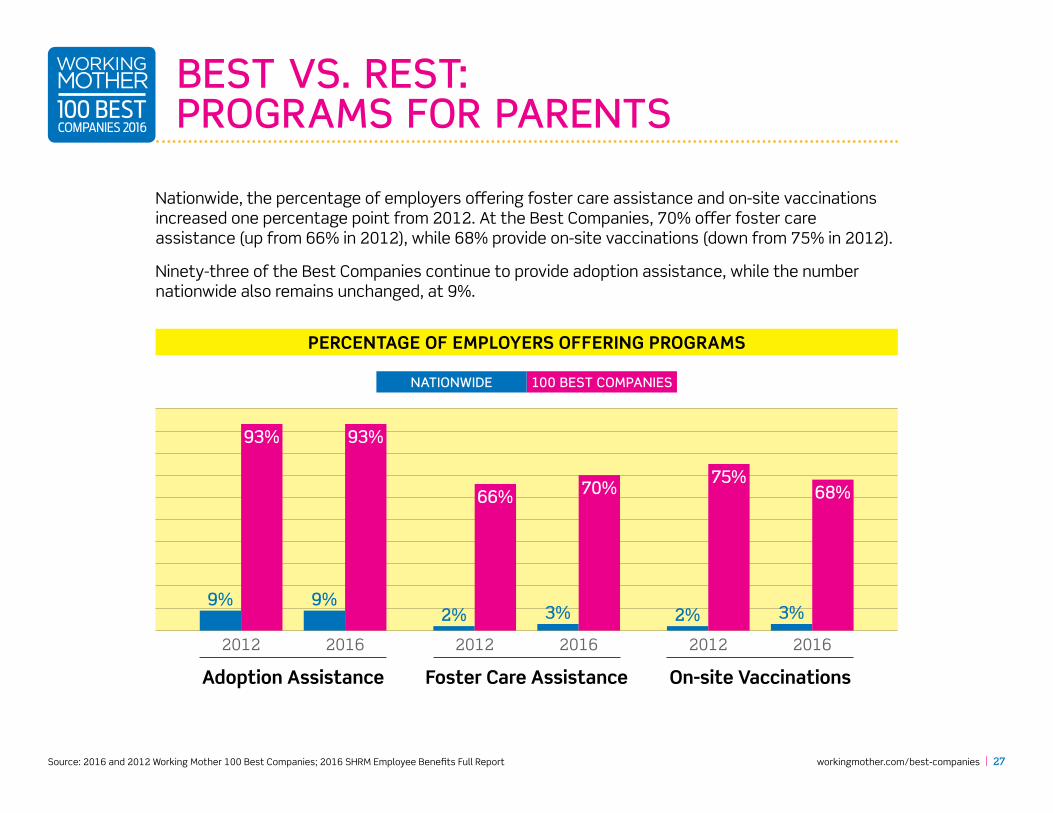
Nationwide, the percentage of employers offering foster care assistance and on-site vaccinations increased one percentage point from 2012. At the Best Companies, 70% offer foster care assistance (up from 66% in 2012), while 68% provide on-site vaccinations (down from 75% in 2012).
Ninety-three of the Best Companies continue to provide adoption assistance, while the number nationwide also remains unchanged, at 9%.
BEST VS. REST: PROGRAMS FOR PARENTS
PERCENTAGE OF EMPLOYERS OFFERING PROGRAMS
100 BEST COMPANIESNATIONWIDE
9%
Adoption Assistance
2012 2016
9%
93% 93%
2%
On-site Vaccinations
2012 2016
75%
3%
68%
3%2%
Foster Care Assistance
2012 2016
66% 70%
Source: 2016 and 2012 Working Mother 100 Best Companies; 2016 SHRM Employee Benefits Full Report
workingmother.com/best-companies | 28Source: 2016 and 2012 Working Mother 100 Best Companies; 2016 SHRM Employee Benefits Full Report
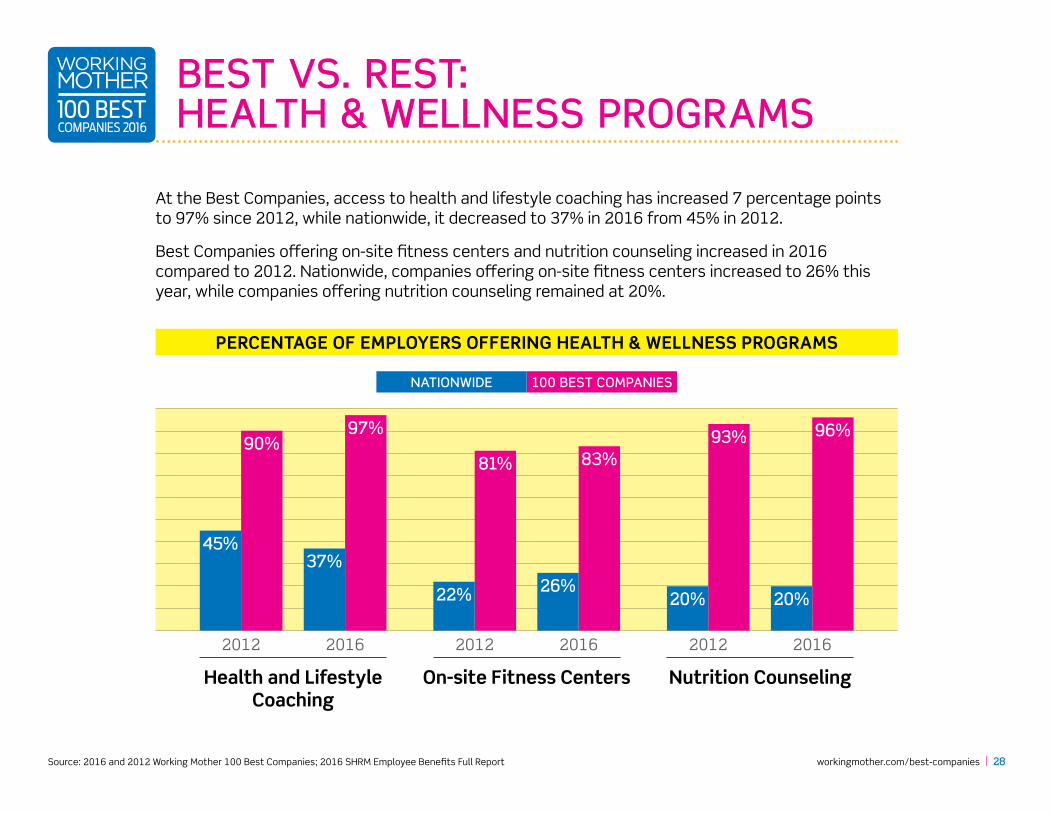
At the Best Companies, access to health and lifestyle coaching has increased 7 percentage points to 97% since 2012, while nationwide, it decreased to 37% in 2016 from 45% in 2012.
Best Companies offering on-site fitness centers and nutrition counseling increased in 2016 compared to 2012. Nationwide, companies offering on-site fitness centers increased to 26% this year, while companies offering nutrition counseling remained at 20%.
BEST VS. REST: HEALTH & WELLNESS PROGRAMS
PERCENTAGE OF EMPLOYERS OFFERING HEALTH & WELLNESS PROGRAMS
100 BEST COMPANIESNATIONWIDE
Health and Lifestyle Coaching
2012 2016
90%
45%
97%
37%
81%
22%
83%
26%
93%
20%
96%
20%
Nutrition Counseling
2012 2016
On-site Fitness Centers
2012 2016
workingmother.com/best-companies | 29Source: 2016 and 2015 Working Mother 100 Best Companies
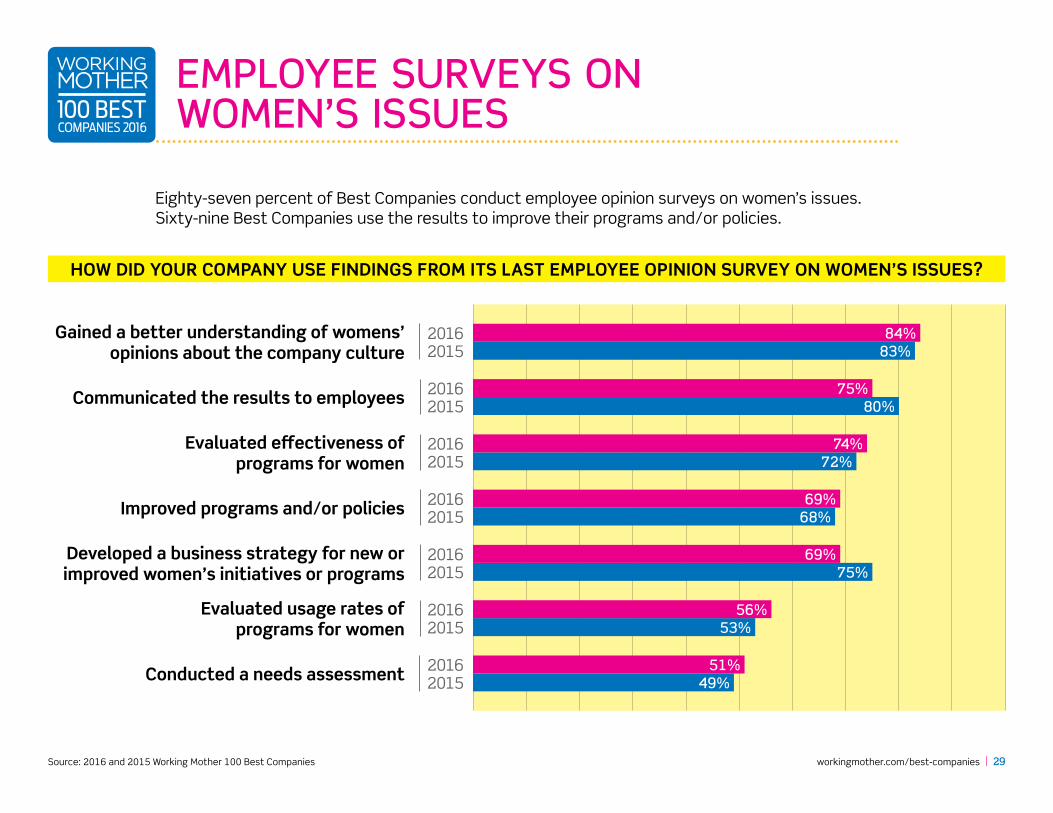
Eighty-seven percent of Best Companies conduct employee opinion surveys on women’s issues. Sixty-nine Best Companies use the results to improve their programs and/or policies.
EMPLOYEE SURVEYS ON WOMEN’S ISSUES
HOW DID YOUR COMPANY USE FINDINGS FROM ITS LAST EMPLOYEE OPINION SURVEY ON WOMEN’S ISSUES?
Gained a better understanding of womens’ opinions about the company culture
Communicated the results to employees
Evaluated effectiveness of programs for women
Improved programs and/or policies
Developed a business strategy for new or improved women’s initiatives or programs
Evaluated usage rates of programs for women
Conducted a needs assessment
20162015
20162015
20162015
20162015
20162015
20162015
20162015
83%84%
72%74%
49%51%
80%75%
53%56%
75%69%
68%69%
workingmother.com/best-companies | 30Source: 2016, 2015, 2014, 2013 and 2012 Working Mother 100 Best Companies
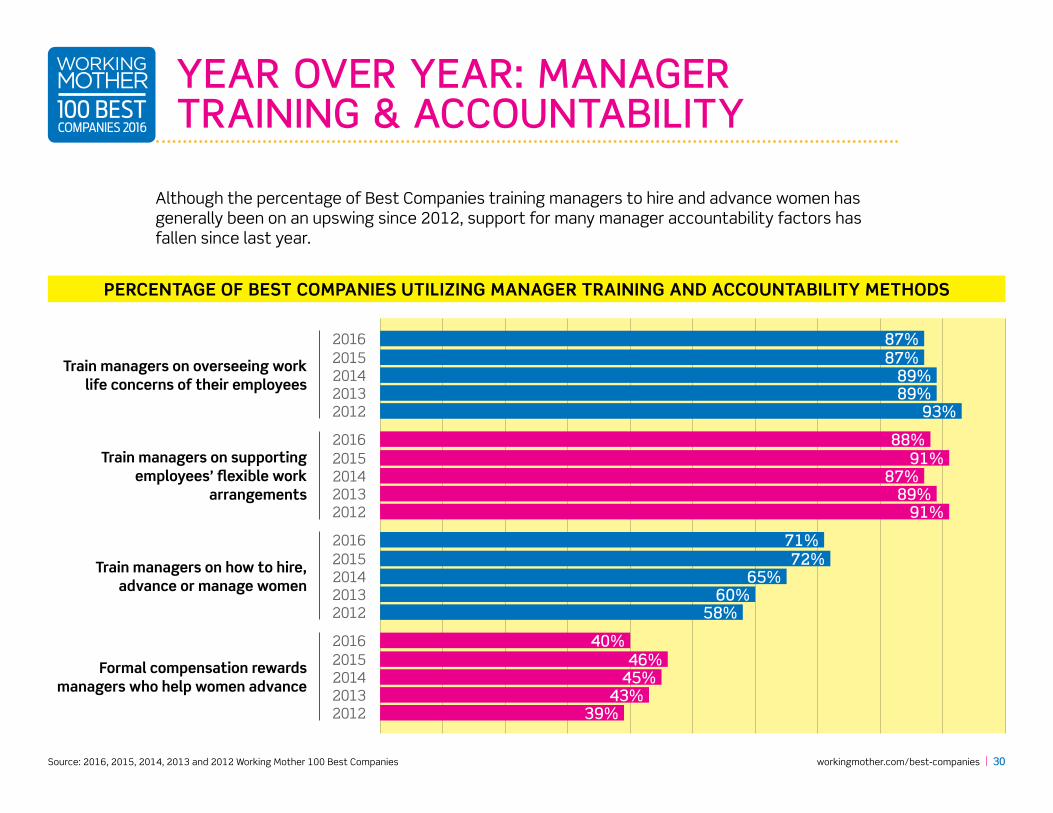
Although the percentage of Best Companies training managers to hire and advance women has generally been on an upswing since 2012, support for many manager accountability factors has fallen since last year.
YEAR OVER YEAR: MANAGER TRAINING & ACCOUNTABILITY
Train managers on how to hire, advance or manage women
58%60%
65%72%
71%
201420152016
20132012
Train managers on supporting employees’ flexible work
arrangements91%
89%87%
91%88%
201420152016
20132012
Train managers on overseeing work life concerns of their employees
93%89%89%
87%87%
201420152016
20132012
Formal compensation rewards managers who help women advance
39%43%
45%46%
40%
201420152016
20132012
PERCENTAGE OF BEST COMPANIES UTILIZING MANAGER TRAINING AND ACCOUNTABILITY METHODS
workingmother.com/best-companies | 31Source: 2016 Working Mother 100 Best Companies
Each organization completed a detailed application covering programs and activities that benefit working mothers. The 2016 application included more than 400 questions in the following clusters:
• Paid Time Off and Leaves
• Workforce Profile
• Benefits
• Women’s Issues & Advancement
• Flexible Work
• Company Culture and Work Life Programs
Completed applications for the 2016 Working Mother 100 Best Companies initiative were collected online from December 14, 2015, to March 11, 2016.Winning Companies were ranked on the data they provided in their applications.
Statistics in this report are based on the data from the 100 winning companies.
Winners are announced in the October/November 2016 issue of Working Mother magazine and online at www.workingmother.com/best-companies.
RESEARCH METHODOLOGY
workingmother.com/best-companies | 32
How do you rate in key areas like diversity & inclusion, women’s advancement and work life programs? The Working Mother Research Institute has the answer. With one of the most comprehensive databases available to corporate America, WMRI has the data you need to make the right decisions for both your employees and your bottom line.
To find out how your company rates, register today for one of our initiatives:• Working Mother 100 Best Companies• Working Mother Best Companies for Multicultural Women• Working Mother Best Law Firms for Women• NAFE Top Companies for Executive Women• Diversity Best Practices Benchmarking Tool
Participation is free and confidential.
Interested in learning more? Visit wmmsurveys.com today!
workingmother.com/best-companies | 33
For more than 30 years, the Working Mother 100 Best Companies has served as the vanguard of flexible work. What was once cutting edge is now essential not only for working parents, but for all employees—from fitness buffs and community volunteers to pet owners and anyone else who has obligations and interests outside the workplace.
That’s why Working Mother has created National Flex Day. Join us on October 18, 2016, as we celebrate all forms of flex, from flextime and remote work to off-ramping and phased retirement.
Flex is a powerful benefit that serves all employees and their employers.
Visit workingmother.com/flex to read more about National Flex Day and to learn how to participate.
CELEBRATE NATIONAL FLEX DAY
workingmother.com/best-companies | 34
BENCHMARKING Our benchmarking reports offer the most detailed data available, showing how your company rates, question-by-question, against all of the Best Companies. Custom comparisons are also available.
SCORECARDS Each participating company receives a free top-line summary of how it compares with all applicants across essential clusters of the initiative’s extensive application.
CUSTOM ASSESSMENTS Let our researchers do the assessment for you. Our experienced team will turn your benchmarking data into a turnkey presentation showing where your company leads and lags compared with the Best Companies.
Interested in learning more? Contact Kristen Willoughby at [email protected] for more information today!
workingmother.com/best-companies | 35
From flexibility and child care to the recruitment, retention and advancement of women, the Working Mother Research Institute is
dedicated to tracking and promoting the best practices of today while creating strategies for tomorrow. WMRI’s goal is to give both working
mothers and their employers the information they need to make workplaces truly family friendly.
Learn more at workingmother.com/wmri
workingmother.com/best-companies | 36
Jennifer Owens, Director [email protected]
Krista Carothers, Senior Research Editor [email protected]
Kristen Willoughby, Senior Manager, Editorial & Research Initiatives [email protected]
Michele Siegel, Director of Research Initiatives [email protected]
Aviva Rosner, Custom Insights Analyst [email protected]
Learn more at workingmother.com/wmri
CONTACT INFORMATION
![---Key--- - Tistory... · ---Key--- R Rapunzel Mandy Moore F ... Mother knows best [Lights out] G: Mother knows best Listen to your mother R: Agh! G: It's a scary world out there](https://img.pdfslide.us/doc/110x75/5ad11cf97f8b9a72118babda/-key-key-r-rapunzel-mandy-moore-f-mother-knows-best-lights.jpg)