Embed Size (px)
Citation preview
Farouk BalouchiIndustry Analyst
Bob GohnVice President, Research
EXECUTIVE SUMMARY: Wireless Power Mobile Devices, Consumer Electronics, Industrial Devices, Wireless Power Infrastructure, and Wireless Charging of Electric Vehicles: Technology Analysis, Environmental Impact, and Market Forecasts
NOTE: This document is a free excerpt of a larger report. If you are interested in purchasing the full report, please contact Pike Research at [email protected].
Published 2Q 2012
Wireless Power
© 2012 Pike Research LLC. All Rights Reserved. This publication may be used only as expressly permitted by license from Pike Research LLC and may not otherwise be accessed or used, without the express written permission of Pike Research LLC.
1
Section 1 EXECUTIVE SUMMARY
1.1 Introduction
The World Economic Forum recently listed wireless power (WP) as one of the “top 10 emerging technologies for 2012” that is “critical to building a sustainable and resilient future” and is “expected to have major social, economic and environmental impacts worldwide in 2012.” The article read:
“Society is deeply reliant on electrically powered devices. Yet, a significant limitation in their continued development and utility is the need to be attached to the electricity grid by wire – either permanently or through frequent battery recharging. Emerging approaches to wireless power transmission will free electrical devices from having to be physically plugged in, and are poised to have as significant an impact on personal electronics as Wi-Fi had on Internet use.”
Wireless power is beginning to see wide acceptance and will become a ubiquitous form of charging in many applications. The integration of WP technology into mobile and consumer electronics devices has already taken shape through standardization on a worldwide scale. The technology is enabling plug-free and, in many cases, contactless charging for a wide range of devices and machinery – from military and medical devices to electric vehicles (EVs) to unmanned aircraft. Originating with simple inductive charging mechanisms that require a direct point of contact between charger (transmitter) and device (receiver), these systems have evolved to the point of providing an intelligence that will see devices becoming connected to the wider power infrastructure.
The barriers to adoption are lifting and it is becoming clear that WP technology is an environmentally friendly technology and that, before the end of the decade, it could contribute to a significant reduction in carbon emissions and embedded energy used to produce, ship, and dispose of conventional charging equipment. The technology has matured and the industry is beginning to consolidate; a wide range of applications exist, clear leaders are emerging; and, in terms of technology, a value chain has formed from silicon vendors to technology ODMs to OEMs combining to establish standards for interoperability going forward.
This report details the most promising sectors for WP charging and transmission. It also outlines and explores the remaining technological hurdles, characterizing and segmenting the market to show the advances in technology and infrastructure. The report outlines the barriers that must be overcome including costs and optimal price points, regulatory and public-perception questions around safety, and the most appropriate and profitable business models for bringing WP technology to market rapidly. It spotlights the main players in the industry and provides market forecasts for revenue by application and by region, through 2020.
1.2 Benefits
1.2.1 Beyond Convenience and Cost
Gordon Moore’s predictions of the rate at which transistors could be placed on silicon and the simple laws of physics governing battery chemistry have meant that the pace of electronics has far exceeded the abilities of battery technology. However, it is now possible to bridge the
Wireless Power
© 2012 Pike Research LLC. All Rights Reserved. This publication may be used only as expressly permitted by license from Pike Research LLC and may not otherwise be accessed or used, without the express written permission of Pike Research LLC.
2
gap of energy supply and demand by providing integrated solutions in mobile devices that will draw their power needs from an infrastructure of WP locations in coffee shops, vehicles, homes, offices, airport lounges, and many other places. Beyond this, the WP locations and the feeding hubs, or nanogrids, will become intelligent, delivering information to the smart grid itself and connecting mobile and intelligent devices to power infrastructure at large.
The announcement of the Institute of Electrical and Electronics Engineers (IEEE) Power Matters Alliance (PMA) that it is inviting members into its ranks is a clear sign of the direction in which the WP industry is going. Approved as an IEEE Standards Association (IEEE-SA) Industry Connections program, the PMA is an alliance of leading industry and governmental organizations dedicated to advancing smart and energy-efficient WP, known as Power 2.0.
The chief Internet evangelist for Google and IEEE Fellow, Vint Cerf, is also widely acclaimed as one of the fathers of the Internet and has been appointed honorary PMA Chairman. “The PMA is dedicated to the idea that it may be possible to do for electricity what the Internet has done for information,” said Cerf. “The PMA’s recipe for delivering power wirelessly creates a vision of a new world in which power and information become parts of a whole. We are happy to invite interested prospective members to take part in shaping this new era of intelligent wireless power.”
The alliance has support from both government and industry, including National Grid, Energy Star, Google, and Facebook, and is dedicated to remaking power to be wireless, smart, and environmentally sound. Duracell, General Motors, Microsemi, Procter & Gamble, EMerge Alliance, the FCC, Powermat Technologies, and Sony Pictures Technologies, as well as contributions related to energy efficiency from the Environmental Protection Agency’s (EPA) Energy Star program, will contribute to bringing forward accelerated standards delivery to sectors like those described in this report.
As part of an IEEE-SA Industry Connections initiative, the PMA was established and the IEEE-SA Industry Connections program will help incubate new standards and related services by bringing like-minded organizations together in a quick and cost-effective manner to hone and refine their thinking on rapidly changing technologies and determine the appropriate next steps. This program offers an efficient, economical, and safe harbour environment for building consensus and producing shared results.
The opportunities posed by advances in WP for both cost savings and higher consumer satisfaction are extremely promising. Notably, the EV market, which Pike Research expects to grow at strong rates over the next several years, stands to benefit.
1.2.2 Enabling New Technologies
The benefits of WP extend beyond cost and convenience. Certain conditions, environments, and applications are simply unsuitable for conventional wired sources of electricity. These include industrial applications, such as mechanical systems with high-speed rotating or flexing joints, which require energy transfer across a distance of a few centimeters or a few feet, and miniature sensor networks across systems that operate in environments that are inaccessible or inhospitable to wiring. Military applications also exist, for which WP will enable otherwise infeasible operations, including: unmanned aerial vehicles (UAVs) that stay aloft for prolonged periods, soldiers equipped with multiple electronic devices that can be charged without carrying bulky cords and adapters, remote semi-permanent bases that cannot be supplied with cabling for mini-electrical grids, and mobile sniffer robots for detecting improvised explosive devices.
Wireless Power
© 2012 Pike Research LLC. All Rights Reserved. This publication may be used only as expressly permitted by license from Pike Research LLC and may not otherwise be accessed or used, without the express written permission of Pike Research LLC.
3
WP is also an enabling technology that will have unforeseen benefits. Many industry contacts interviewed for this report commented that new applications for WP, not yet conceived, will emerge to be established on the platform that has now, to some degree, been standardized, albeit with increased complexity regarding the issues of using power intelligently.
1.2.3 Clean Technology
It is widely assumed that WP technology is not an environmentally friendly technology due to the elimination of wires and the associated losses incurred from power transmission over the air. However, analysis limited to just mobile and CE devices, shows that the wider implications from the broad adoption of WP technology by 2020 could amount to a significant reduction in carbon emissions and embedded energy used to produce, ship and dispose of conventional charging equipment. Section 4 provides the full environmental analysis, from energy usage over a year, to the cancellation of the embedded energy for convention charging equipment.
Clearly, there is nothing inherently green about WP charging and transmission. WP systems are simply another way of transmitting electricity from fossil fuel or renewable sources. However, WP has a number of secondary effects with potentially important and far-reaching benefits for clean energy and carbon emissions reductions. The reduction in the number of cords, adapters, and wall outlets alone will carry significant benefits in terms of reducing greenhouse gas (GHG) emissions and landfill waste. Moreover, wireless charging is seen as a significant enabler for the adoption of EVs. Many believe that plug-in systems present a large market hurdle for consumer adoption of EVs; the expectation is that in-garage, WP stations will dramatically accelerate the EV market when they become available over the next few years.
If significant long-distance grids are built using WP transmission, they could reduce GHG emissions in four different ways:
Eliminate the need for copper-wire transmission grids
Transport power from remote generation sources, such as wind farms and solar arrays
Collect and utilize micro-power from ambient sources, such as cellular networks, that otherwise dissipates – a technique known as power harvesting
Replace costly and carbon-intensive electricity sources, such as diesel generators, in temporary applications and locations
Finally, many researchers have looked into the possibility of launching massive solar arrays into geosynchronous orbit and beaming power back to Earth in the form of microwaves. While the technology to achieve solar satellites exists, these systems are far too costly to be established in the timeframe covered by this report. Microwave-beaming solar satellites are discussed in Section 3, but no market forecasts are included; systems are likely several decades away.
Wireless Power
© 2012 Pike Research LLC. All Rights Reserved. This publication may be used only as expressly permitted by license from Pike Research LLC and may not otherwise be accessed or used, without the express written permission of Pike Research LLC.
4
1.3 Categories and Classifications
For the purpose of this report, WP is classified under two frameworks: by sector and by technology.
1.3.1 By Sector
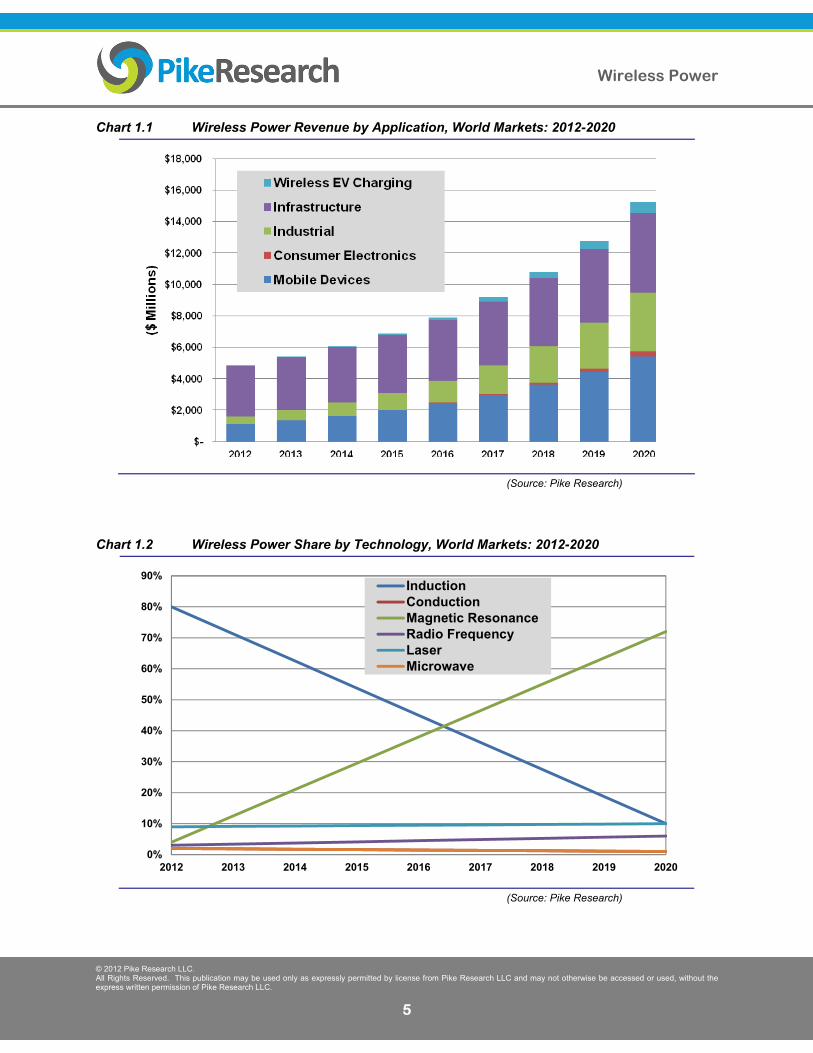
Chart 1.1 shows the WP revenue by sector. Specific applications within each sector are discussed further in the Market Forecasts section.
Mobile computing and communications devices (smartphones, tablet computers, netbooks, e-readers, and laptops)
Consumer electronics (CE) (remote controls, stationary devices, such as TVs, portable lighting, kitchen appliances, e-labels and smart packaging, cameras, and hearing aids)
Industrial devices (wireless sensor networks, slip rings, cordless power tools and communication devices; also included in industrial devices are medical and military devices)
Wireless power infrastructure (in-vehicle, office and home, airports, coffee shops, hospitality industry, and other – stadiums, malls, and restaurants)
EVs (wireless charging stations and charging systems retrofitted into an EV or integrated at design)
1.3.2 By Technology
Chart 1.2 shows the penetration of WP technologies over the forecast period through 2020. Six different technologies are covered in this report:
Induction
Magnetic Resonance Coupling (MRC)
Conduction
Radio Frequency (RF)
Microwaves
Lasers
Each technology is examined further in Section 3 of this report.
1.3.3 Market Forecasts
Pike Research believes the adoption of WP charging and transmission devices, particularly for mobile devices, CE, and EVs, will climb steadily over the next 5 years and then accelerate rapidly as prices fall and WP systems are integrated into many everyday products. Several factors – most prominently, public perception and regulatory issues around safety – could delay adoption, but those are likely to be outweighed by the convenience and simplicity of WP systems. Pike Research believes that worldwide revenues from WP transmission and charging systems will reach $15.06 billion by 2020, with a compound annual growth rate (CAGR) of 15.1%.
Wireless Power
© 2012 Pike Research LLC. All Rights Reserved. This publication may be used only as expressly permitted by license from Pike Research LLC and may not otherwise be accessed or used, without the express written permission of Pike Research LLC.
5
Chart 1.1 Wireless Power Revenue by Application, World Markets: 2012-2020
(Source: Pike Research)
Chart 1.2 Wireless Power Share by Technology, World Markets: 2012-2020
0%
10%
20%
30%
40%
50%
60%
70%
80%
90%
2012 2013 2014 2015 2016 2017 2018 2019 2020
InductionConductionMagnetic ResonanceRadio FrequencyLaserMicrowave
(Source: Pike Research)
Wireless Power
© 2012 Pike Research LLC. All Rights Reserved. This publication may be used only as expressly permitted by license from Pike Research LLC and may not otherwise be accessed or used, without the express written permission of Pike Research LLC.
6
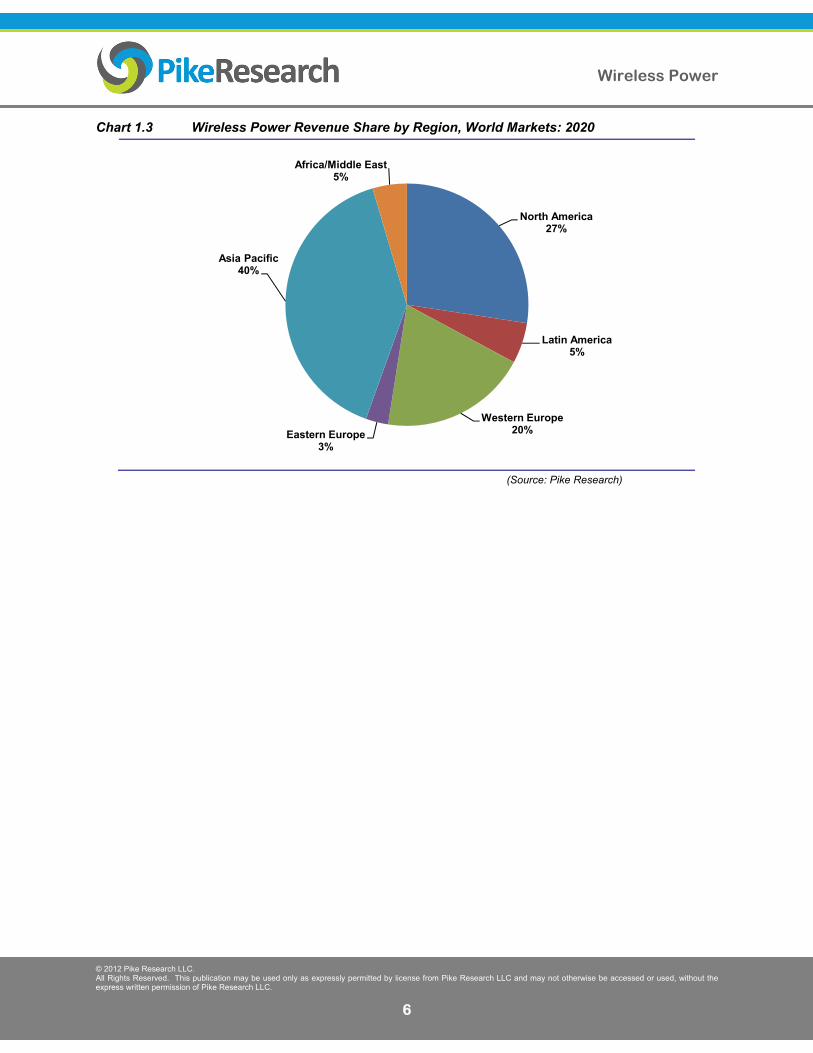
Chart 1.3 Wireless Power Revenue Share by Region, World Markets: 2020
North America27%
Latin America5%
Western Europe20%Eastern Europe
3%
Asia Pacific40%
Africa/Middle East5%
(Source: Pike Research)
Wireless Power
© 2012 Pike Research LLC. All Rights Reserved. This publication may be used only as expressly permitted by license from Pike Research LLC and may not otherwise be accessed or used, without the express written permission of Pike Research LLC.
60
Section 9 TABLE OF CONTENTS
Section 1 ...................................................................................................................................................... 1 Executive Summary .................................................................................................................................... 1
1.1 Introduction .................................................................................................................................... 1 1.2 Benefits ......................................................................................................................................... 1
1.2.1 Beyond Convenience and Cost ............................................................................................... 1 1.2.2 Enabling New Technologies .................................................................................................... 2 1.2.3 Clean Technology ................................................................................................................... 3
1.3 Categories and Classifications ...................................................................................................... 4 1.3.1 By Sector ................................................................................................................................. 4 1.3.2 By Technology ......................................................................................................................... 4 1.3.3 Market Forecasts ..................................................................................................................... 4
Section 2 ...................................................................................................................................................... 7 Market Issues .............................................................................................................................................. 7
2.1 General .......................................................................................................................................... 7 2.2 Challenges .................................................................................................................................... 7 2.3 Application Segments for Wireless Power .................................................................................... 8 2.4 Mobile Devices .............................................................................................................................. 9
2.4.1 Market Drivers ......................................................................................................................... 9 2.4.2 Market Challenges .................................................................................................................. 9
2.5 Consumer Electronics ................................................................................................................. 10 2.5.1 Market Drivers ....................................................................................................................... 10 2.5.2 Market Challenges ................................................................................................................ 10
2.6 Industrial Devices including Medical and Military Applications ................................................... 11 2.6.1 Industrial Applications - Drivers ............................................................................................. 11
2.6.1.1 Wireless Sensors .......................................................................................................... 11 2.6.1.2 Wireless Slip Rings ....................................................................................................... 12 2.6.1.3 Military Applications – Drivers ...................................................................................... 13 2.6.1.4 Military Applications – Challenge .................................................................................. 13
2.6.2 Long-Distance Transmission ................................................................................................. 14 2.6.3 Military Applications ............................................................................................................... 14 2.6.4 Terrestrial Wireless Power Transmission .............................................................................. 14 2.6.5 Space-Based Power .............................................................................................................. 15 2.6.6 Market Challenges ................................................................................................................ 15 2.6.7 Industrial Applications – Challenges ..................................................................................... 16
2.7 Wireless Power Infrastructure ..................................................................................................... 16 2.7.1 Market Drivers ....................................................................................................................... 16 2.7.2 Market Challenges ................................................................................................................ 16
2.8 Electric Vehicles .......................................................................................................................... 17 2.8.1 Wireless Electric Vehicle Charging ....................................................................................... 17
2.8.1.1 Stage of Commercialization .......................................................................................... 17 2.8.1.2 Field Trials .................................................................................................................... 17 2.8.1.3 Cost ............................................................................................................................... 17 2.8.1.4 Charging Efficiency ....................................................................................................... 17 2.8.1.5 Standards ..................................................................................................................... 18 2.8.1.6 Road-Embedded Charging Equipment ......................................................................... 18
Wireless Power
© 2012 Pike Research LLC. All Rights Reserved. This publication may be used only as expressly permitted by license from Pike Research LLC and may not otherwise be accessed or used, without the express written permission of Pike Research LLC.
61
Section 3 .................................................................................................................................................... 19 Technology Issues .................................................................................................................................... 19
3.1 Wireless Power Technology ........................................................................................................ 19 3.2 Inductive Coupling ....................................................................................................................... 20
3.2.1 Advantages of Inductive Coupling ......................................................................................... 21 3.2.2 Disadvantages of Inductive Coupling .................................................................................... 21
3.3 Magnetic Resonance Coupling ................................................................................................... 22 3.3.1 Advantages of Magnetic Resonance Coupling ..................................................................... 23 3.3.2 Disadvantages of Magnetic Resonance Coupling ................................................................ 24
3.4 Conductive Wireless Power ........................................................................................................ 24 3.4.1 Advantages of Conductive Wireless Power .......................................................................... 24 3.4.2 Disadvantages of Conductive Wireless Power ..................................................................... 25
3.5 Laser/Infrared/Optical Technologies ........................................................................................... 25 3.5.1 Advantages of Laser/Infrared/Optical Technologies ............................................................. 26 3.5.2 Disadvantages of Laser/Infrared/Optical Technologies ........................................................ 26
3.6 Radio Frequency Wireless Power ............................................................................................... 27 3.6.1 Advantages of Radio Frequency Wireless Power ................................................................. 28 3.6.2 Disadvantages of Radio Frequency Wireless Power ............................................................ 28
3.7 Microwave Wireless Power ......................................................................................................... 28 3.7.1 Advantages of Microwave Wireless Power ........................................................................... 28 3.7.2 Disadvantages of Microwave Wireless Power ...................................................................... 29
Section 4 .................................................................................................................................................... 30 Energy and Environmental Issues .......................................................................................................... 30
4.1 Introduction .................................................................................................................................. 30 4.2 Energy Usage for Charging Systems .......................................................................................... 31 4.3 Environmental Impact ................................................................................................................. 34
Section 5 .................................................................................................................................................... 36 Key Industry Players ................................................................................................................................. 36
5.1 ABB ............................................................................................................................................. 36 5.2 Bombardier Inc. ........................................................................................................................... 36 5.3 CE4A – Consumer Electronics for Automotive ........................................................................... 36 5.4 ConvenientPower HK Limited ..................................................................................................... 36 5.5 Dell .............................................................................................................................................. 37 5.6 Delphi .......................................................................................................................................... 37 5.7 Energizer Holdings, Inc. .............................................................................................................. 37 5.8 Evatran (Plugless Power) ............................................................................................................ 37 5.9 Freescale Semiconductor ........................................................................................................... 38 5.10 Fulton Innovation (eCoupled) ...................................................................................................... 38 5.11 Haier Group ................................................................................................................................. 38 5.12 Intel .............................................................................................................................................. 38 5.13 KI ................................................................................................................................................. 38 5.14 LaserMotive ................................................................................................................................. 39 5.15 Leggett & Platt, Incorporated ...................................................................................................... 39 5.16 Leyden Energy Inc. ..................................................................................................................... 39 5.17 Magna E-Car Systems ................................................................................................................ 39 5.18 Mojo Mobility, Inc. ....................................................................................................................... 39 5.19 Philips & Lite-On Digital Solutions Corporation ........................................................................... 40 5.20 PowerBeam Inc. .......................................................................................................................... 40 5.21 PowerbyProxi Ltd. ....................................................................................................................... 40 5.22 Powercast Corporation ................................................................................................................ 40 5.23 Powermat Technologies .............................................................................................................. 40 5.24 PureEnergy Solutions, Inc. .......................................................................................................... 41 5.25 Qualcomm Incorporated .............................................................................................................. 41
Wireless Power
© 2012 Pike Research LLC. All Rights Reserved. This publication may be used only as expressly permitted by license from Pike Research LLC and may not otherwise be accessed or used, without the express written permission of Pike Research LLC.
62
5.26 RRC power solutions Inc. ............................................................................................................ 41 5.27 Texas Instruments ....................................................................................................................... 41 5.28 WiTricity Corporation ................................................................................................................... 41
Section 6 .................................................................................................................................................... 43 Market Forecasts ....................................................................................................................................... 43
6.1 Introduction .................................................................................................................................. 43 6.2 Forecast Methodology ................................................................................................................. 45 6.3 Mobile Devices ............................................................................................................................ 46 6.4 Consumer Electronics ................................................................................................................. 48 6.5 Industrial Applications ................................................................................................................. 50 6.6 Wireless Power Infrastructure ..................................................................................................... 52 6.7 Electric Vehicles .......................................................................................................................... 54
Section 7 .................................................................................................................................................... 56 Company Directory ................................................................................................................................... 56 Section 8 .................................................................................................................................................... 57 Acronym and Abbreviation List ............................................................................................................... 57 Section 9 .................................................................................................................................................... 60 Table of Contents ...................................................................................................................................... 60 Section 10 .................................................................................................................................................. 63 Table of Charts and Figures..................................................................................................................... 63 Section 11 .................................................................................................................................................. 65 Scope of Study .......................................................................................................................................... 65 Sources and Methodology ....................................................................................................................... 65 Notes .......................................................................................................................................................... 66
Wireless Power
© 2012 Pike Research LLC. All Rights Reserved. This publication may be used only as expressly permitted by license from Pike Research LLC and may not otherwise be accessed or used, without the express written permission of Pike Research LLC.
63
Section 10 TABLE OF CHARTS AND FIGURES
Chart 1.1 Wireless Power Revenue by Application, World Markets: 2012-2020 .................................... 5 Chart 1.2 Wireless Power Share by Technology, World Markets: 2012-2020 ........................................ 5 Chart 1.3 Wireless Power Revenue Share by Region, World Markets: 2020 ......................................... 6 Chart 4.1 Duty Cycles for a 24 Hour Use Case .................................................................................... 31 Chart 4.2 Product Power & Energy Usage of General Charging Equipment ........................................ 32 Chart 4.3 Product Power & Energy Usage of Energy Star Compliant Equipment ................................ 32 Chart 4.4 Product Power & Energy Usage of Wireless Power Compliant Equipment .......................... 33 Chart 4.5 Addressable Population for Wireless Power, World Markets: 2020 ...................................... 34 Chart 4.6 Embedded Energy to Produce, Ship, Discard External Power Supplies, World Markets: 2020 ............................................................................................................. 35 Chart 6.1 Wireless Power Revenue by Application, World Markets: 2012-2020 ................................. 43 Chart 6.2 Wireless Power Unit Shipments by Application, World Markets: 2012-2020 ........................ 44 Chart 6.3 Wireless Power Penetration by Region, World Markets: 2012-2020 .................................... 44 Chart 6.4 Mobile Devices Wireless Power Unit Shipments by Application, World Markets: 2012-2020 ............................................................................................................................. 46 Chart 6.5 Mobile Devices Wireless Power Revenue by Application, World Markets: 2012-2020 ........ 47 Chart 6.6 Mobile Devices Wireless Power Revenue by Region, World Markets: 2012-2020 .............. 47 Chart 6.7 Consumer Electronics Wireless Power Unit Shipments by Application, World Markets: 2012-2020 .................................................................................................... 48 Chart 6.8 Consumer Electronics Wireless Power Revenue by Application, World Markets: 2012-2020 ............................................................................................................................. 49 Chart 6.9 Consumer Electronics Wireless Power Revenue by Region, World Markets: 2012-2020 ... 49 Chart 6.10 Industrial Devices Wireless Power Unit Shipments by Application, World Markets: 2012-2020 ............................................................................................................................. 50 Chart 6.11 Industrial Devices Wireless Power Revenue by Application, World Markets: 2012-2020 ... 51 Chart 6.12 Industrial Devices Wireless Power Revenue by Region, World Markets: 2012-2020 .......... 51 Chart 6.13 Wireless Power Infrastructure by Location, World Markets: 2012-2020 ............................... 52 Chart 6.14 Wireless Power Infrastructure Revenue by Location, World Markets: 2012-2020 ............... 53 Chart 6.15 Wireless Power Infrastructure Revenue by Region, World Market: 2012-2020 ................... 53 Chart 6.16 Wireless Power Systems for Electric Vehicle Charging, World Markets: 2012-2020 ........... 54 Chart 6.17 Wireless Power Systems for Electric Vehicle Charging Revenue, World Markets: 2012-2020 ............................................................................................................................. 55 Chart 6.18 Wireless Power Systems for EV Charging Revenue by Region, World Markets: 2012-2020 ............................................................................................................................. 55
Table 2.1 Wireless Power Application Adoption Timeframe ................................................................... 8 Table 3.1 Wireless Power Technologies: Advantages and Disadvantages .......................................... 19 Table 4.1 Wireless Power Application Adoption Timeframe ................................................................. 30
Wireless Power
© 2012 Pike Research LLC. All Rights Reserved. This publication may be used only as expressly permitted by license from Pike Research LLC and may not otherwise be accessed or used, without the express written permission of Pike Research LLC.
64
Figure 2.1 Wireless Sensor Network in a Robotic Production Line ........................................................ 12 Figure 2.2 Wireless Power Transmission System .................................................................................. 14 Figure 2.3 Embedded Wireless Charging ............................................................................................... 18 Figure 3.1 Transmission Efficiency versus Distance, Inductively Coupled WP Systems ...................... 21 Figure 3.2 Magnetically Coupled Resonant WP System ........................................................................ 23 Figure 3.3 Efficiency as a Function of Distance, MRC System .............................................................. 23 Figure 3.4 Laser Power Beaming System for UAVs .............................................................................. 26 Figure 3.5 RF Power Transmission System ........................................................................................... 27
Wireless Power
© 2012 Pike Research LLC. All Rights Reserved. This publication may be used only as expressly permitted by license from Pike Research LLC and may not otherwise be accessed or used, without the express written permission of Pike Research LLC.
65
Section 11 SCOPE OF STUDY
Pike Research has prepared this report to present an overview of the worldwide market for WP charging and transmission applications during the period between 2010 and 2020, as well as the technology behind those systems. WP applications include charging for mobile communications devices and, more broadly, consumer electronics; EV charging stations; industrial applications, such as wireless sensor networks and mechanical slip ring replacements; military applications, including charging for EVs and electronic devices; and long-distance transmission, including power beaming for unmanned aircraft and space-based solar satellites transmitting energy back to Earth.
The technologies covered include contact-based and contactless inductive power; MRC; conductive charging; laser and optical technologies; RF power transmission; and microwaves. The report’s purpose is not to provide an exhaustive technical assessment of these technologies, but rather to evaluate each one in relation to their potential for commercialization during the timeframe covered by this report. This report focuses on business models, critical technology issues, regulatory factors, end-user demand, and the competitive landscape. All major global regions are included and the forecast period extends through 2020.
Pike Research strives to identify and examine new market segments to aid readers in the development of their business models. While this report covers many of the significant players and primary technologies leading the market in WP and transmission, it offers only a current snapshot of an industry that is rapidly developing and changing. Periodic updates will be published as warranted.
SOURCES AND METHODOLOGY
Pike Research’s industry analysts utilize a variety of research sources in preparing Research Reports. The key component of Pike Research’s analysis is primary research gained from phone and in-person interviews with industry leaders including executives, engineers, and marketing professionals. Analysts are diligent in ensuring that they speak with representatives from every part of the value chain, including but not limited to technology companies, utilities and other service providers, industry associations, government agencies, and the investment community.
Additional analysis includes secondary research conducted by Pike Research’s analysts and the firm’s staff of research assistants. Where applicable, all secondary research sources are appropriately cited within this report.
These primary and secondary research sources, combined with the analyst’s industry expertise, are synthesized into the qualitative and quantitative analysis presented in Pike Research’s reports. Great care is taken in making sure that all analysis is well-supported by facts, but where the facts are unknown and assumptions must be made, analysts document their assumptions and are prepared to explain their methodology, both within the body of a report and in direct conversations with clients.
Pike Research is an independent market research firm whose goal is to present an objective, unbiased view of market opportunities within its coverage areas. The firm is not beholden to any special interests and is thus able to offer clear, actionable advice to help clients succeed in the industry, unfettered by technology hype, political agendas, or emotional factors that are inherent in cleantech markets.
Wireless Power
© 2012 Pike Research LLC. All Rights Reserved. This publication may be used only as expressly permitted by license from Pike Research LLC and may not otherwise be accessed or used, without the express written permission of Pike Research LLC.
66
NOTES
CAGR refers to compound average annual growth rate, using the formula:
CAGR = (End Year Value ÷ Start Year Value)(1/steps) – 1.
CAGRs presented in the tables are for the entire timeframe in the title. Where data for fewer years are given, the CAGR is for the range presented. Where relevant, CAGRs for shorter timeframes may be given as well.
Figures are based on the best estimates available at the time of calculation. Annual revenues, shipments, and sales are based on end-of-year figures unless otherwise noted. All values are expressed in year 2012 U.S. dollars unless otherwise noted. Percentages may not add up to 100 due to rounding.
Wireless Power
© 2012 Pike Research LLC. All Rights Reserved. This publication may be used only as expressly permitted by license from Pike Research LLC and may not otherwise be accessed or used, without the express written permission of Pike Research LLC.
67
Published 2Q 2012
© 2012 Pike Research LLC 1320 Pearl Street, Suite 300
Boulder, CO 80302 USA Tel: +1 303.997.7609
http://www.pikeresearch.com
This publication is provided by Pike Research LLC (“Pike”). This publication may be used only as expressly permitted by license from Pike and may not otherwise be reproduced, recorded, photocopied, distributed, displayed, modified, extracted, accessed or used without the express written permission of Pike. Notwithstanding the foregoing, Pike makes no claim to any Government data and other data obtained from public sources found in this publication (whether or not the owners of such data are noted in this publication). If you do not have a license from Pike covering this publication, please refrain from accessing or using this publication. Please contact Pike to obtain a license to this publication.