Embed Size (px)
Citation preview
Groundwater Monitoring Report
EWS Camden Class II Landfill
Initial 2013 Semi-Annual Groundwater Report
Page i
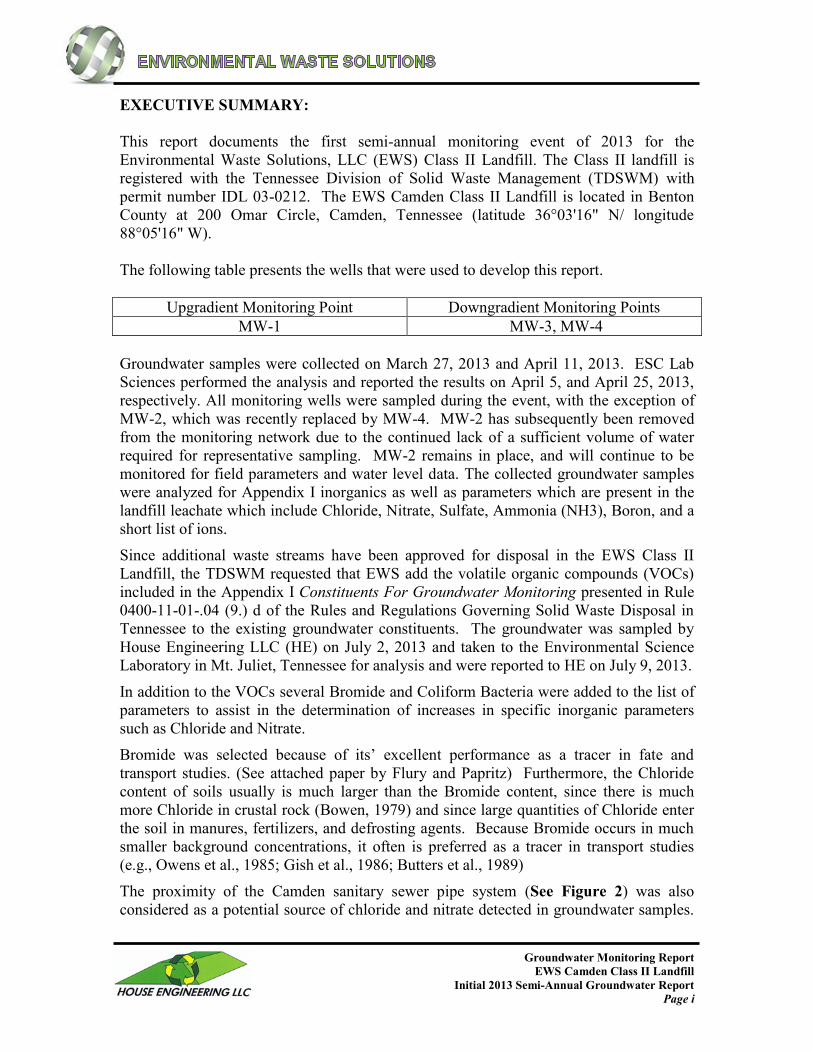
EXECUTIVE SUMMARY:
This report documents the first semi-annual monitoring event of 2013 for the
Environmental Waste Solutions, LLC (EWS) Class II Landfill. The Class II landfill is
registered with the Tennessee Division of Solid Waste Management (TDSWM) with
permit number IDL 03-0212. The EWS Camden Class II Landfill is located in Benton
County at 200 Omar Circle, Camden, Tennessee (latitude 36°03'16" N/ longitude
88°05'16" W).
The following table presents the wells that were used to develop this report.
Upgradient Monitoring Point Downgradient Monitoring Points
MW-1 MW-3, MW-4
Groundwater samples were collected on March 27, 2013 and April 11, 2013. ESC Lab
Sciences performed the analysis and reported the results on April 5, and April 25, 2013,
respectively. All monitoring wells were sampled during the event, with the exception of
MW-2, which was recently replaced by MW-4. MW-2 has subsequently been removed
from the monitoring network due to the continued lack of a sufficient volume of water
required for representative sampling. MW-2 remains in place, and will continue to be
monitored for field parameters and water level data. The collected groundwater samples
were analyzed for Appendix I inorganics as well as parameters which are present in the
landfill leachate which include Chloride, Nitrate, Sulfate, Ammonia (NH3), Boron, and a
short list of ions.
Since additional waste streams have been approved for disposal in the EWS Class II
Landfill, the TDSWM requested that EWS add the volatile organic compounds (VOCs)
included in the Appendix I Constituents For Groundwater Monitoring presented in Rule
0400-11-01-.04 (9.) d of the Rules and Regulations Governing Solid Waste Disposal in
Tennessee to the existing groundwater constituents. The groundwater was sampled by
House Engineering LLC (HE) on July 2, 2013 and taken to the Environmental Science
Laboratory in Mt. Juliet, Tennessee for analysis and were reported to HE on July 9, 2013.
In addition to the VOCs several Bromide and Coliform Bacteria were added to the list of
parameters to assist in the determination of increases in specific inorganic parameters
such as Chloride and Nitrate.
Bromide was selected because of its’ excellent performance as a tracer in fate and
transport studies. (See attached paper by Flury and Papritz) Furthermore, the Chloride
content of soils usually is much larger than the Bromide content, since there is much
more Chloride in crustal rock (Bowen, 1979) and since large quantities of Chloride enter
the soil in manures, fertilizers, and defrosting agents. Because Bromide occurs in much
smaller background concentrations, it often is preferred as a tracer in transport studies
(e.g., Owens et al., 1985; Gish et al., 1986; Butters et al., 1989)
The proximity of the Camden sanitary sewer pipe system (See Figure 2) was also
considered as a potential source of chloride and nitrate detected in groundwater samples.
Groundwater Monitoring Report
EWS Camden Class II Landfill
Initial 2013 Semi-Annual Groundwater Report
Page ii
Since chloride and nitrate are present in the landfill leachate and the sanitary sewer
effluent, it was necessary to add yet another parameter to the list which is generally
present only in the sanitary sewer effluent. Coliform bacteria were selected for
laboratory testing since its presence indicates contamination with human or animal
wastes. The EWS Landfill leachate, Camden sanitary sewer effluent and EWS
groundwater well samples were tested for Coliform bacteria to assist in the determination
in the source of the chloride and nitrate detected in the groundwater.
The results of the laboratory analytical testing of sewer effluent, groundwater and
leachate samples taken since 2011 is presented in Table 2 of this report.
Inter-well prediction interval analysis was used to identify statistically significant
increases (SSIs) over background concentrations for the analyzed water quality
parameters. The percentage of inter-well background non-detects for each parameter
determines the primary statistical method utilized for each parameter. If the percentage
of non-detects in the background samples is less than 50%, Shewart-CUSUM control
charts are utilized. If more than 50% background non-detects exist for the given
parameter, non-parametric inter-well prediction limit analysis is conducted on the data.
Only parameters reported above the detection limits of the laboratory were evaluated.
The results of the analysis are summarized as follows:
One SSI over background was identified for chloride and barium at MW-3 as a
result of the analysis. This is consistent with historical data.
The next semi-annual monitoring event is tentatively scheduled for October, 2013.
Groundwater Monitoring Report
EWS Camden Class II Landfill
Initial 2013 Semi-Annual Groundwater Report
Page iii
TABLE OF CONTENTS
Section .......................................................................................................................... Page
EXECUTIVE SUMMARY: ........................................................................................................... i
I Introduction ....................................................................................................................... 1
A. Site Location ........................................................................................................................ 1
B. Current Activities ................................................................................................................ 1
II Aquifer Characteristics ..................................................................................................... 1
A. Geologic and Aquifer Characteristics.................................................................................. 1
B. Monitor Well Integrity & Static Water Levels .................................................................... 2
C. Groundwater Flow Direction ............................................................................................... 2
D. Potentiometric Gradient ....................................................................................................... 3
E. Hydraulic Conductivity ....................................................................................................... 3
III Groundwater Sampling Procedures ................................................................................ 3
A. Instrumentation .................................................................................................................... 3
B. Purging and Collection of Field Parameter Values ............................................................. 4
C. Sample Collection & Preservation ...................................................................................... 5
D. Quality Assurance & Quality Control ................................................................................. 5
E. Sample Chain-of-Custody ................................................................................................... 6
IV Laboratory Analytical Procedures................................................................................... 6
A. Analytical Methods ............................................................................................................. 6
B. Laboratory Analytical Results ............................................................................................. 6
C. Quality Control Qualifier Codes ......................................................................................... 7
V Statistical Analysis ............................................................................................................. 7
A. Applicable Methods............................................................................................................. 7
B. Results ................................................................................................................................. 8
VI Conclusions and Recommendations ................................................................................ 8

Groundwater Monitoring Report
EWS Camden Class II Landfill
Initial 2013 Semi-Annual Groundwater Report
Page iv
APPENDICES
Appendix A Maps & Tables
Figure 1: Site Vicinity Map
Figure 2: Groundwater Map
Table 1: Groundwater Field Data
Table 2: Groundwater Analytical Results
Appendix B Field Reports
Appendix C Laboratory Analytical Reports
Appendix D Statistical & Trend Analysis
Appendix E CEC Standard Groundwater Sampling Procedures

Groundwater Monitoring Report
EWS Camden Class II Landfill
Initial 2013 Semi-Annual Groundwater Report
Page v
Glossary of Terms
Appendix I – Refers to the required regulatory sample list of groundwater parameters
CEC – Civil & Environmental Consultants, Inc.
Class I Landfill – Municipal Solid Waste Landfill accepts household waste
Class II Landfill – Industrial Waste Landfill
Class IV Landfill – Construction/Demolition Waste Landfill
Class III/IV Landfill – Landscaping and Construction/Demolition Waste Landfill
DML – Construction Demolition Landfill
EPA – Environmental Protection Agency
ESC – ESC Lab Sciences
EWS – Environmental Waste Solutions
GW – Groundwater
HDPE – High Density Polyethylene
HE – House Engineering LLC
HI – Hydrogeologic Investigation
MCL – Maximum Contaminant Level
µS·cm-1
- micro-Siemens per centimeter
mg/L – milligrams per Liter
MW – Monitor Well
NPPL - Non-parametric prediction limit analysis
ORP – Oxidation Reduction Potential
POTW – Publically Operated Treatment Works
ppm – parts per million*
PQL – Practical Quantitation Limit
QC – Quality Control
SNL – Sanitary Landfill
TDEC – Tennessee Department of Environment and Conservation
TDOG – Tennessee Division of Geology
TDSWM – Tennessee Division of Solid Waste Management
TOC – Top of Casing
VOC – Volatile Organic Compound
* ppm – parts per million* is equivalent to mg/L – milligrams per Liter

Groundwater Monitoring Report
EWS Camden Class II Landfill
2013 Initial Semi-Annual Groundwater Report
1
I Introduction
A. Site Location
EWS, LLC. owns and operates the Camden Class II landfill located just
off highway US 70 at 200 Omar Circle, Camden, Tennessee. The site can
be located on the Camden, Tennessee USGS quadrangle at north latitude
36o 3' 16" and west longitude 88
o 05' 16" at an average elevation of 400
feet above mean sea level datum (MSL). The location of the facility is
indicated in Figure 1- Site location Map. The landfill footprint can be
viewed in Figure 2 - Potentiometric Surface Map.
B. Current Activities
The EWS Camden Class II Landfill currently receives secondary
aluminum smelter waste for disposal including aluminum dross and salt
cakes and other industrial wastes approved by the TDSWM.
II Aquifer Characteristics
A. Geologic and Aquifer Characteristics
The extensive reworking of the site as a result of the excavation of chert
for local road and fill projects has significantly impacted the original site
geology. However, the large cuts within the site boundaries have exposed
the underlying geologic formations. Based upon a review of the
Tennessee Division of Geology (TDOG) Geologic Map and site
observations it appears that the site is within the Camden and Harriman
Formations. It is reported by the TDOG that the Camden and Harriman
Formations are lithologically identical, and not enough fossils are present
to form a convenient basis for subdivision.
Camden and Harriman Formations
The Camden and Harriman Formations are described as follows:
Chert, gray with specks and mottlings of very light-gray and yellowish-
gray (surfaces stained pale to dark yellowish-orange), bedded and blocky
(beds 2 to 8 inches thick), dense, conchoidal fracture, contains pods of
white to light gray tripolitic clay, locally stained yellow and brown,
fossiliferous. Locally, especially near the top, fragments of chert are
cemented into large masses and beds of breccia by dark-brown to
moderate-red limonite.
Groundwater potentiometric data collected from the uppermost water
bearing zone across the entire proposed waste area footprint during the
1999 and 2006 hydrogeological investigations indicate that the uppermost

Groundwater Monitoring Report
EWS Camden Class II Landfill
2013 Initial Semi-Annual Groundwater Report
2
aquifer is sloped to the southwest. Comparisons of the water bearing zone
elevations to static groundwater elevations for both indicate an unconfined
aquifer.
B. Monitor Well Integrity & Static Water Levels
The groundwater monitoring network for the Class II Landfill consists of
monitor wells MW-1, MW-3, and MW-4. Monitor well MW-1 serves as
an up-gradient monitoring point while monitor wells MW-3 and MW-4
serve as down-gradient monitoring points.
The integrity of each monitor well is checked during each sampling event
prior to groundwater collection. The physical condition of each wellhead
is observed and noted along with the condition and ability of any and all
locking mechanisms for each monitor well. Once the watertight seal is
removed from the top of each monitor well’s casing, the well is allowed to
de-pressurize. A decontaminated electronic probe is slowly lowered into
the monitor well to establish the distance between the established top of
casing and the elevation of free groundwater. The distance is then re-
checked to ensure that the measurement is of actual static water level and
the groundwater is not rising or falling in the monitor well. The electronic
probe is capable of determining this distance to within one, one-hundredth
of one foot (0.01 foot). This distance is written in the site-specific field
book as depth-to-water. Upon collection of this data, the electronic water
level probe is removed from the monitor well and decontaminated from
contact with the well casing / screen and groundwater.
The following equation is used to determine the elevation of groundwater
at each well:
Established Top of Casing Elevation – Depth to Water = Groundwater Elevation
Top of casing elevation has been determined by a licensed land surveyor
and is referenced to Mean Sea Level Datum of the World Geodetic Survey
of 1984. Groundwater elevations are listed in Table 1 - Field Parameters
& Potentiometric Data, Appendix A.
C. Groundwater Flow Direction
Groundwater flow at the landfill appears to flow in a southwesterly
direction towards Charlie Creek. Groundwater flow in the vicinity of the
Class II Landfill appears to flow from a topographic high north, northeast
of the landfill toward the southwest where monitor wells MW-3 and MW-
4 are positioned to intercept any possible groundwater contaminants
leaching from the landfill.
Groundwater Monitoring Report
EWS Camden Class II Landfill
2013 Initial Semi-Annual Groundwater Report
3
D. Potentiometric Gradient
The Potentiometric surface of the first aquifer occurring beneath the Class
II Landfill occurs at approximately twenty-two (23) feet below ground
surface at the up-gradient monitor well MW-1 to approximately six (8)
feet below ground surface at monitor well MW-2. The groundwater
potentiometric data interpreted from the 1999 and 2006 hydrogeological
investigations conducted at the site for the uppermost aquifer indicate that
the uppermost water bearing zone is sloped to the southwest. Comparisons
of water bearing zone elevations to static groundwater elevations for both
investigations indicate an unconfined aquifer. The potentiometric gradient
calculated from groundwater elevation data collected in March and July of
2013 ranged from 3.56% to approximately 2.2 % slope.
The potentiometric gradient from measurements taken on March 27, 2013
has been calculated according to the following formula:
Highest GW. Elev. – Lowest GW. Elev. * 100 = Pot. Grad.
Horizontal Distance between the Potentiometric Contours
(394.05’ at MW-1) - (358.4’ at MW-2) * 100 = 3.56%
1,000’
The above calculation assumes a perpendicular gradient between the
potentiometric contours drawn between MW-1 to MW-4. These
assumptions may provide an artificially higher potentiometric gradient
than is likely occurring at the site.
E. Hydraulic Conductivity
Hydraulic conductivity estimations within the first aquifer occurring
beneath either landfill have not been determined at this time.
III Groundwater Sampling Procedures
A. Instrumentation
Depth to groundwater measurements were collected by CEC using a
Solinst® electronic water level indicator, model # 122. CEC also
employed a YSI 556 Multi-parameter probe is used to record pH, specific
conductance, temperature, dissolved oxygen and ORP during groundwater
sampling events at the landfill. A LaMotte model 2020 turbidity meter or
equivalent is used to collect turbidity readings. Each instrument is either
checked against known standards or calibrated as per manufacturers’
specifications prior to the commencement of sampling activities.

Groundwater Monitoring Report
EWS Camden Class II Landfill
2013 Initial Semi-Annual Groundwater Report
4
HE utilized a Keck Water Level Meter with 100 feet of tape to check
groundwater levels in the monitor wells. HE also utilized a Horiba U22X
Multi-parameter probe to record pH, specific conductivity, temperature,
dissolved oxygen, ORP and turbidity of the groundwater within each
groundwater well prior to and at the time of sampling.
B. Purging and Collection of Field Parameter Values
The total volume of groundwater residing in each monitor well is
calculated by subtracting the depth to water from the total depth of each
well. This linear distance is next multiplied by 0.163 gallons per foot in a
2 inch (I.D.) monitor well. For purging, a disposable polyethylene bailer
with sufficient nylon twine is slowly lowered into the water column. The
bailer is allowed to completely submerse into the water column prior to
extracting the bailer from the monitor well. The first bailer of purged
groundwater is collected in a clean, high-density polyethylene (HDPE)
reservoir where it is observed for Temperature, pH, specific conductance,
dissolved oxygen, oxidation-reduction potential (ORP) and turbidity.
These values are noted in the site specific field book as V0 and then the
collected groundwater is discarded onto the ground, away from the
monitor well. Groundwater shall be purged using either a decontaminated
down-well pump using new tubing or using new tubing connected to a
peristaltic pump or in the case of a pump malfunction, a new disposable
bailer.
Normally, bailers are not used at the EWS Camden Class II Landfill.
However, if bailers are used due to pump malfunction, bailers shall be
constructed of either polyethylene or Teflon. Bailers shall be factory
decontaminated and sealed as to allow no environmental contaminants to
interact with the bailer. New nylon twine shall be fixed to each bailer via
a tied knot.
The collected groundwater will be decanted into a flow-through cell where
it will be observed for pH, specific conductance, temperature, and
turbidity. These values will be noted in the site specific field book as V0
and then the collected groundwater will be poured onto the ground, down-
gradient from the monitor well.
Groundwater shall be purged from the monitor well for a specific period
of time that allows for a new volume of water to have passed into the
flow-through cell. Once this volume of water has been purged, the field
chemistry parameters will again be observed and recorded in the field
book as V1. This procedure for purging groundwater continues for an
additional well volume, if sufficient groundwater is available. After the
second purged well volume has been observed for field parameter values,
the values are checked against values for V1. If the pH and specific

Groundwater Monitoring Report
EWS Camden Class II Landfill
2013 Initial Semi-Annual Groundwater Report
5
conductance values for each volume purged vary no more than 10% from
V1 to V2 and the temperature has stabilized to within one degree Celsius,
preparations are made to collect a groundwater sample for submittal to an
analytical laboratory. If the field parameters have not stabilized, the
purging procedure shall continue until either one of the following
conditions are met:
1. Field stabilization occurs,
2. Well is purged dry, or
3. Five well volumes have been purged.
If the monitor well is purged dry, then the recharging groundwater shall be
collected within twenty-four hours.
Field parameter values are presented in Table 1 – Groundwater Field
Data, Appendix A. A detailed account of each purge and sample
procedure conducted at each monitor well is presented in Appendix B.
C. Sample Collection & Preservation
Groundwater samples are collected from monitor wells once field
parameter data indicates that stagnant water has been purged from the
well. Groundwater is placed in laboratory supplied sample vessels in the
following order if analyzed: Appendix I inorganics – one (1), five-
hundred (500) ml preserved with nitric (HNO3) acid; Chloride, Nitrate,
Sulfate – one (1), two-hundred fifty (250) ml unpreserved HDPE jar;
Ammonia – one (1), two-hundred fifty (250) ml HDPE jar preserved with
sulfuric (H2SO4) acid.
D. Quality Assurance & Quality Control
Field blanks were collected for each sample collection event performed to
date at the EWS Class II Landfill. CEC collected a field blank next to
monitoring well MW-3. HE collected a field blank next to MW-4. The
field blanks were collected by pouring deionized water into a duplicate set
of sample bottles. Thereby, allowing any airborne contaminants a chance
to enter the field blank sample. Laboratory analytical testing of the field
blanks did not reveal the presence of any of the EWS Class II Landfill site
specific target compounds.
In addition, a duplicate sample was collected from MW-3 for laboratory
quality control purposes. The reported values for the duplicate sample are
similar to the original MW-3 sample with the exception of Aluminum and
Iron. Aluminum was detected at a concentration of 0.82 mg/L in the
original sample from MW-3 and at a concentration of 0.38 mg/L in the
duplicate from MW-3. Iron was detected at a concentration of 0.3 mg/L in

Groundwater Monitoring Report
EWS Camden Class II Landfill
2013 Initial Semi-Annual Groundwater Report
6
the original sample from MW-3 and at a concentration of 0.17 mg/L in the
duplicate from MW-3.
E. Sample Chain-of-Custody
A sample Chain-of-Custody (COC) traveled along with each sample kit
from ESC to EWS and finally back to ESC for the sampling events. The
CEC SOP for Chain of Custody 07-01-01 may be found in Appendix E.
IV Laboratory Analytical Procedures
A. Analytical Methods
All laboratory testing of groundwater samples taken in 2013 were
performed by the Environmental Science Corporation (ESC) located in
Mt. Juliet, Tennessee. However, the leachate analytical tests were
performed by TEC Lab in Jackson, Tennessee. The analytical methods
chosen for this monitoring event are the most appropriate procedures as
directed by the Tennessee Division of Solid Waste Management
(TDSWM) and the United States Environmental Protection Agency’s
publication SW-846, entitled Test Methods for Evaluating Solid Waste,
Physical/Chemical Methods (3rd
Edition).
The SW-846 methods used for the analysis of groundwater (if necessary)
were as follows:
Method 6010b Inductively Coupled Plasma (ICP) – Atomic
Emission Spectrometry
Method 6020 ICP – Mass Spectrometry
Method 7470A Mercury in Liquid Waste – Manual Cold Vapor
Technique
Method 8011 1,2-dibromoethane & 1,2 dibromo-3-chloropropane
by Micro-extraction and Gas Chromatography
Method 8260B Volatile Organic Compounds by Gas
Chromatograph / Mass Spectrometry
Method 9056 Determination of Inorganic Anions by Ion
Chromatography (Fluoride)
Method 9222D Fecal Coliform Membrane Filter Procedure
B. Laboratory Analytical Results
Laboratory reports from the analysis of groundwater samples collected
from the EWS Camden Class II Landfill during the semi-annual
monitoring event were prepared by ESC and reported to CEC on August
13, 2012. Copies of the laboratory reports are located in Appendix C –

Groundwater Monitoring Report
EWS Camden Class II Landfill
2013 Initial Semi-Annual Groundwater Report
7
Laboratory Analytical Reports. Constituent values from all laboratory
analysis along with applicable maximum contaminant levels (MCLs) are
presented in Table 2 – Analytical Results, Appendix A.
C. Quality Control Qualifier Codes
The EPA Contract Laboratory Program states that sample and result
qualifiers should be utilized as part of a total quality control process. ESC
complies with this directive and reports all qualifiers along with
explanations of QC qualifier codes. One QC qualifier code was indicated
during the laboratory analysis of groundwater samples during this
monitoring event and can be viewed along with the Laboratory
Analytical Reports, Appendix C.
V Statistical Analysis
A. Applicable Methods
The Rules of Tennessee Department of Environment and Conservation,
Division of Solid Waste Management Chapter 1200-1-7-.04 states, in part,
that each landfill must conduct and report statistical analysis as part of the
evaluation of groundwater monitoring data. Several methods may be
employed for this endeavor. EWS Camden Class II Landfill has chosen to
use Inter-well and intra-well non-parametric prediction limit analysis
(NPPL) at this time.
First, the distribution of the data was evaluated for normality. For all
wells, the data was not normally distributed; therefore, non-parametric
statistical methods were chosen. Inter-well and intra-well non-parametric
prediction limit analyses (NPPL) were deemed appropriate for this data
set. Inter-well analyses compared the concentrations observed at the
down-gradient monitoring locations to the concentrations observed at the
up-gradient monitoring location during this monitoring event. For the
Class II Landfill, monitor well MW-1 was considered as background.
Intra-well analysis was also utilized at MW-1 to compare the
concentrations observed during the July 2012 groundwater sampling event
to the established background data set.
The percentage of inter-well background non-detects for each parameter
determines the primary statistical method utilized for each parameter. If
the percentage of non-detects in the background samples is less than 50%,
Shewart-CUSUM control charts are utilized. If more than 50%
background non-detects exist for the given parameter, non-parametric
inter-well prediction limit analysis is conducted on the data.
Groundwater Monitoring Report
EWS Camden Class II Landfill
2013 Initial Semi-Annual Groundwater Report
8
The computer program ChemStat was used for all statistical computations.
Worksheets indicating inter-well and intra-well statistical analysis sheets
and time versus concentration charts may be viewed in Appendix D,
Statistical and Trend Analysis.
B. Results
Review of the statistical analysis performed on the available data indicated
that there were two statistically significant increases (SSI’s) over
background data. The SSI’s over background data were limited to Barium
(MW-3), and Chloride (MW-3). The Barium and Chloride detections at
MW-3 are well below their associated MCL’s.
Trend analysis utilizing the limited data available from the monitoring
events showed no distinct trends for the site monitoring wells.
VI Conclusions and Recommendations
Representative groundwater samples were collected from monitor wells MW-1, MW-3 and MW-
4. Groundwater samples have been analyzed for Appendix I inorganics, Bromide, Chloride,
Nitrate, Sulfate, Ammonia (NH3), a short list of ions, and Coliform bacteria.
EWS Groundwater Quality Relative to the EPA Primary Drinking Water Standards
Laboratory analytical results for the groundwater samples collected from the facility monitor
wells for the EWS Class II Landfill indicated that two compounds were detected at
concentrations which exceeded the EPA maximum contaminant levels (MCL). Specifically, the
concentration of Arsenic in MW-1 and the concentration of Nitrate in MW-4 were detected
above their respective maximum contaminant levels (MCL).
Arsenic was detected in MW-1 at a concentration of (0.049 mg/l). The MCL for Arsenic is
(0.01 mg/l). Arsenic has been detected at concentrations exceeding the primary drinking water
MCL prior to the disposal of waste in the landfill. More specifically, laboratory analytical
testing of groundwater samples taken from MW-1 during background testing of the groundwater
prior to waste placement in the landfill revealed concentrations of Arsenic ranging from 0.024
mg/L to 0.072 mg/L. Therefore, the presence of Arsenic in the groundwater is attributable to
naturally occurring deposits in the soil overburden since there is no immediate development up-
gradient of the well.
Nitrate was detected at MW-4 at a concentration of (29 mg/L) on March 27, 2013 and at (16
mg/L) on April 11, 2013. The MCL for Nitrate is (10 mg/L). A discussion relative to the source
of the Nitrate in the groundwater is provided in a later section of this document.
EWS Groundwater Quality Relative to the Tennessee Secondary Drinking Water Standards
Laboratory analytical results for the groundwater samples collected in March and April of 2013
from the EWS Class II Landfill groundwater monitor well network indicated that four of the site
specific groundwater monitor list of compounds were detected at concentrations which exceeded
the Tennessee Public Water Supply Secondary Drinking Water Standards (2DW). Those
parameters included Iron and Manganese in the upgradient groundwater well identified as MW-
1, Aluminum and Manganese in MW-3, and Chloride, Nitrate, and Manganese in MW-4.

Groundwater Monitoring Report
EWS Camden Class II Landfill
2013 Initial Semi-Annual Groundwater Report
9
Aluminum has been detected historically in each of the groundwater monitor wells. A review of
the Tennessee Division of Geology (TDOG) publication titled “Geologic Source and Chemical
Quality of Public Groundwater Supplies in Western Tennessee” written by C.R. Lanphere
reported Aluminum concentrations of 1.3 mg/L and 1.2 mg/L in two wells owned and used by
the city of Camden for drinking water. Each of the aforementioned concentrations exceeds the
Tennessee Secondary Drinking Water Standard for Public Water Supply sources. The
Aluminum which was detected in groundwater samples taken from MW-3 during the March
2013 sample event was present at a concentration of 0.82 mg/L which is under the concentration
which has been reported by the TDOG for Camden drinking water supply wells.
Iron was detected at a concentration of 26 mg/L in MW-1 prior to the placement of waste.
Therefore, the concentration in the groundwater sample taken during the March 2013 sample
event of 16 mg/L is not considered the result of a new offsite source.
Manganese has been detected in at least one of the wells since groundwater sampling was
initiated at the site. Therefore, it is believed that the Manganese is occurs naturally in the site
soils. The high turbidity of the groundwater during the July 2013 sample event would increase
the potential for detection of Manganese.
Chloride has historically been detected in MW-3 at concentrations ranging from 8.2 mg/L to 25
mg/L even prior to waste placement in the landfill. Chloride has also been historically detected
in MW-1 at concentrations ranging from 1.9 mg/L to 2.9 mg/L even prior to waste placement.
The Chloride detected in MW-4 was detected in the groundwater samples taken during the
March 2013 groundwater sample event at 270 mg/L which exceeds the Tennessee Secondary
Drinking Water Standard for Public Water Supply sources. Therefore, EWS requested a second
sample event be performed to verify the concentration and determine the potential source of the
Tennessee Secondary Drinking Water Standard for Public Water Supply Standard exceedence.
The second sample of groundwater was secured in April and the laboratory testing reported the
Chloride concentration at 150 mg/L which is below the Tennessee Secondary Drinking Water
Standard for Public Water Supply maximum concentration of 250 mg/L.
Evaluation of the Source of Chloride and Nitrate Impacts to MW-4 Groundwater
From a review of the laboratory test results performed on the initial groundwater sample taken
from MW-4 it was evident that the elevated concentration Chloride, Nitrate and Ammonia
Nitrate in the groundwater was attributable to anthropogenic sources. Due to the presence of
both Ammonia at concentrations exceeding 3,000 mg/L and Chloride present at concentrations
exceeding 30,000 mg/L in the EWS landfill leachate it was necessary to further evaluate if the
landfill leachate was the source of the high concentration of inorganic parameters in the
groundwater.
Specific Conductivity Measurements
EWS initially measured the specific conductivity of the water within the sediment pond below
the current waste disposal cell which is upgradient of MW-4 in an attempt to determine if the
landfill leachate was leaking from the landfill. Based upon the base elevation of the sediment
pond and landfill sump the sediment basin would also be impacted by the high concentration of
Chloride and Nitrates within the landfill leachate. Measurements taken by HE with a Horiba
U22x Multi-parameter meter determined the conductivity of the pond water at 67 micro-Siemens
Groundwater Monitoring Report
EWS Camden Class II Landfill
2013 Initial Semi-Annual Groundwater Report
10
per centimeter (µS·cm-1
). Measurements taken by CEC with a YSI 556 Multi-parameter probe
revealed that the conductivity of the groundwater within MW-4 was as high as 1041 µS·cm-1
on
March 27, 2013 and as high as 977 µS·cm-1
on April 11, 2013. CEC also measured the effluent
within the Camden POTW manhole on April 11, 2013 and the result was 984 µS·cm-1
. HE
measured the groundwater from within MW-4 on July 2, 2013 at 690 µS·cm-1
. It should be
noted that CEC reported groundwater measurements of specific conductivity on the other
downgradient well designated as MW-3 at a concentration of 138 µS·cm-1
on March 27, 2013.
HE reported groundwater measurements of specific conductivity in MW-3 at a concentration of
260 µS·cm-1
on July 2, 2013. All specific conductivity measurements taken from MW-3 were
substantially lower than those taken from MW-4 and the Camden POTW manhole. It should
also be noted that MW-3 is closer to the waste footprint than MW-4.
Groundwater Tracer Parameters
Prior to the promulgation of the EPA Subtitle D landfill regulations chloride was a compound
routinely used for evaluating impacts to groundwater from landfill leachate due to its mobility in
through even low permeability clay soils. However, since large quantities of Chloride enter the
soil in manures, fertilizers, and defrosting agents and since there is often a naturally occurring
concentration of Chloride in both the soil overburden and crustal rock it has been replaced as the
most reliable compound to determine impacts from anthropogenic sources. Chloride has been
replaced as a groundwater tracer by Bromide because it occurs in much smaller background
concentrations and migrates through the natural environment more rapidly. Thus, it has become
the preferred tracer in of many groundwater professionals who perform transport studies (e.g.,
Owens et al., 1985; Gish et al., 1986; Butters et al., 1989).
Chloride Summary
Historical Evaluation of Elevated Chloride Concentration in MW-2
In 2011 an evaluation was performed to determine the potential source of the Chloride in the
EWS groundwater monitor well designated as MW-2. Initially, EWS sampled the landfill
leachate and sent the sample to the lab to determine the concentration of Appendix 1 parameters
for comparison with the parameters detected in the groundwater from within MW-2. Another
potential source of impact to the groundwater in MW-2 was also identified. The sanitary sewer
manhole located 45 feet southeast of MW-2 had been observed to overflow on numerous
occasions both before and since MW-2 was sampled in 2011. The overflow of the manhole
resulted in standing water adjacent to and around MW-2. Therefore, EWS staff sampled the
overflow of water from the manhole and delivered the sample to TEC Environmental
Laboratories, Inc. in Jackson, Tennessee, for testing. The pH of the sample was also determined
along with the concentration of Aluminum and Chloride.
A review was performed of the results of both the landfill leachate testing and the Camden
POTW manhole waste water testing. The results of the testing revealed Chloride concentrations
in the water from the manhole at 367 mg/L and Aluminum at 0.284 mg/L. The results of the
testing of the leachate revealed Chloride concentrations at 23,100 mg/L while Aluminum was not
detected. Based upon this analytical testing it appears that the source of the detected Chloride at
a measured concentration of 44 mg/L in MW-2 was most likely not attributable to the migration
of leachate from the landfill. This opinion was based upon the fact that the concentration of
chloride in the landfill leachate along with the proximity of the landfill limits would potentially
result in much higher concentrations of chloride in the groundwater than 44 mg/L. This in
combination with the fact that no aluminum was detected in the leachate while the sanitary sewer

Groundwater Monitoring Report
EWS Camden Class II Landfill
2013 Initial Semi-Annual Groundwater Report
11
waste water revealed aluminum concentrations within the range detected in MW-2. Therefore,
the impacts of chloride and aluminum in MW-2 could possibly be more attributable to the recent
problems with overflows from the Camden sanitary sewer system.
To further substantiate this claim the EPA computer developed fate and transport program
referred to as Multi-Med was used to predict the concentration of chloride in MW-2 with a
transient condition such as an overflow from the Camden POTW manhole. The results of the
modeling resulted in a predicted concentration of 48 mg/L in MW-2 based on the concentration
of chloride in the manhole. This predicted concentration of Chloride at 48 mg/l in MW-2 was
extremely accurate since the actual concentration of Chloride in MW-2 was determined in the
laboratory at 44 mg/L.
Current Evaluation of Elevated Chloride in MW-4
As previously discussed Chlorides were detected in groundwater samples taken from MW-4 at
concentrations ranging from 150 mg/L to 270 mg/L. In addition, laboratory testing of leachate
samples taken at the site has revealed Chloride concentrations in excess of 30,000 mg/L. Finally,
a Camden POTW manhole located within close proximity (less than 50 feet) of MW-4 has been
sampled and tested for Chloride in April of 2013. The results indicate the concentration of
Chloride in the Camden POTW of 250 mg/L in a waste water sample taken the same day as a
groundwater sample was taken from MW-4. The lab tests performed on the groundwater sample
taken from MW-4 measured the Chloride concentration at 150 mg/L.
Bromide Summary
Bromide testing was performed on the landfill leachate, the groundwater from MW-4, and on
waste water samples secured from the Camden POTW manhole closest to MW-4. The
laboratory analytical testing revealed the presence of Bromide in the leachate at a concentration
of 19 mg/L. However, Bromide was not detected in the groundwater sample taken from MW-4
or the waste water sample taken from the Camden POTW manhole.
Anthropogenic Indicator Parameters
As previously mentioned the proximity of the Camden POTW to the groundwater monitor
network at the EWS Class II Landfill along with observations of overflows from the pipe
network manholes warranted an investigation of the POTW as a possible source of groundwater
impact. EWS has previously sampled (November 2011) the groundwater from MW-2 and
delivered the sample to ESC so they could perform the test for Fecal Coliform. ESC reported
Fecal Coliform in the groundwater sample from MW-2 at 99 col/100ml.
A review of the results of the initial testing of groundwater samples from MW-4 also created a
suspicion that the Camden POTW may be a potential source of the high levels of chloride
particularly since MW-4 is even closer to the Camden POTW pipe network than MW-2. It is
estimated that MW-4 is situated within approximately 15 feet of the Camden POTW pipe
network. Therefore, samples were collected from MW-4 and taken to ESC to determine if
Coliform was present in the groundwater from within MW-4. ESC reported a total coliform
concentration within the groundwater from MW-4 at 720 MPN/100ml which again would
suggest impact from the Camden POTW pipe network which transmits sewer wastes to the
treatment lagoons adjacent to the EWS Class II Landfill property. This opinion is also based
upon recent laboratory analytical testing of the landfill leachate for the presence of e coli, fecal
coliform and total coliform. None of the aforementioned coliform parameters were detected in
the landfill leachate.

Groundwater Monitoring Report
EWS Camden Class II Landfill
2013 Initial Semi-Annual Groundwater Report
12
In conclusion, it is the opinion of HE that MW-4 is not presently impacted from the EWS Class
II Landfill disposal operations and should not be placed into the assessment phase of
groundwater monitoring. This opinion is based upon the results of the laboratory analytical
testing of groundwater, leachate and POTW effluent and the detailed discussions presented in the
previous sections of this report.
The next semi-annual groundwater monitoring event for the EWS Class II Landfill is tentatively
scheduled for October, 2013.