Embed Size (px)
Citation preview

1
Executive Summary
Results OverviewVoter turnout for presidential general elections is higher than in presidential primary elections. Turnout in presidential general elections without an incum-bent running, as in 2008 and 2016, is generally higher than when a president is running for re-election. The 724,596 ballots cast in the November 8, 2016, Presidential General Election represent the most ever in a Santa Clara County election. The 82.8% voter turnout rate in the 2016 Presidential General Election is topped only by the 86.0% turnout rate in the 2008 Presidential General Election, of all elections in the last 48 years.
FAQQ: How did Santa Clara County's turnout rate compare with other counties?A: Among the 10 California counties with the highest numbers of registered voters, Santa Clara County had the highest voter turnout rate in
the November 8, 2016, Presidential General Election. Nearly 82.8% of Santa Clara County registered voters participated in the election, compared to the statewide average of 75.3%. Among the nine San Francisco Bay Area counties, the turnout rate in Santa Clara County trailed only those in the counties of Marin (89.0%) and Sonoma (86.8%), whose turnout rates were the two highest in the state.
November 8, 2016 Presidential GeneralSanta Clara County Registrar of Voters Post-Election Report
788,821 817,837 788,063
875,176
678,033 653,239
430,779
724,596
0
200,000
400,000
600,000
800,000
1,000,000
11/4/08 Gen 11/6/12 Gen 6/7/16 Pri 11/8/16 Gen
Total Registration and TurnoutPast Presidential Elections
Total Reg Total TO
6/7/2016Presidential
Primary
11/8/2016Presidential
General
11/6/2012Presidential
General
11/4/2008Presidential
GeneralTotal Registration Total Turnout
Total Registration and TurnoutPast Presidential Elections
The November 8, 2016, Presidential General Election saw thelargest ever voter turnout in a presidential general election
in Santa Clara County. Out of 875,176 registered vot-ers, a total of 724,596 cast valid ballots for a voter turnout rate of 82.8%. This turnout rate was the largest among the 10 California counties with the highest number of registered voters.The election set new records for voter registration, total ballots cast, vote-by-mail ballots cast, provisional ballots cast, num-ber of contests on county ballots, number of local ballot measures, percentage of registration activity from online sources, most ballot cards, number of ballots picked up prior to the close of polls, number of bilingual election officers, and number of recounted contests.Additionally, the number of ballot types created for voters was the most for a 21st-century presidential election, while the elec-tion’s turnout rate was the second highest in the past 48 years. Nearly three-quarters of the ballots cast in the election were vote-
by-mail ballots, although unlike in past elections, vote-by-mail and polling place turnout rates were nearly identical.
The election took longer to finish tallying than the most recent elections held in Santa Clara
County. Due to the record high volume of ballots, extended ballot receipt deadlines, large quantities of write-in and provisional votes, and required audits and recounts, the Registrar of Voters’ office did not finish tallying the last polling place ballots until December 6, 28 days after Election Day. Due to improvements in post-Election Day
ballot processing efficiency, more complete election results were delivered to voters earlier.
This report compares the November 8, 2016, Pres-idential General Election with the presidential general
elections held in 2012 and 2008, as well as the June 7, 2016, Pres-idential Primary Election. Statistics for other elections are presented for comparison purposes, when the data are available and help tell the story of this historic election.
PublishedJuly 7, 2017

FAQQ: What is the difference between vote-by-mail (VBM) and polling place voters?A: VBM voters are voters who have registered to permanently vote by mail, meaning that for every election, these voters receive
their ballot in the mail. Polling place voters are voters who typically vote at the polls and do not usually receive a ballot by mail. Sometimes, due to how precincts are drawn, polling place voters can be assigned to mail ballot precincts. These voters may alternatively cast their ballot at a polling place if they wish.
490,238
559,361 573,999
645,000
467,916 457,885
319,803
534,217
0
100,000
200,000
300,000
400,000
500,000
600,000
700,000
11/4/08 Gen 11/6/12 Gen 6/7/16 Pri 11/8/16 Gen
Vote-by-Mail Registration and TurnoutPast Presidential Elections
VBM Reg VBM TO
2
11/8/2016Presidential
General
11/4/2008Presidential
General
6/7/2016Presidential
Primary
11/6/2012Presidential
GeneralTotal Vote-by-Mail Registration Total Vote-by-Mail Turnout
Vote-by-Mail Registration and TurnoutPast Presidential Elections
In 2001, the California Legislature passed a law to allow resi-dents to become permanent vote-by-mail voters. Since the law went into effect the following year, the percentage of vote-by-mail voters in Santa Clara County has trended upward. On the other hand, vote-by-mail turnout, and turnout in general, depends on
a number of factors, including voter interest in the election and whether an incumbent is up for re-election. These charts reveal a stark contrast between turnout in the June 7, 2016, Presidential Primary Election and in the three presidential general elections, for both voting methods.
298,583
258,476
214,064230,176
210,137195,354
110,976
190,379
0
50,000
100,000
150,000
200,000
250,000
300,000
350,000
11/4/08 Gen 11/6/12 Gen 6/7/16 Pri 11/8/16 Gen
Polling Place Registration and TurnoutPast Presidential Elections
PP Reg PP TO
Total Polling Place Voter Registration Total Polling Place Voter Turnout
Polling Place Voter Registration and TurnoutPast Presidential Elections
11/8/2016Presidential
General
11/4/2008Presidential
General
6/7/2016Presidential
Primary
11/6/2012Presidential
General

3
Total Turnout % % Turnout of Vote-by-Mail Voters
Voter Turnout Percentages by Voting MethodPast Presidential Elections
% Turnout of Polling Place Voters
Historically, a higher percentage of vote-by-mail voters have voted in presidential-year elections than
have polling place voters. In the November 8, 2016, Presidential
General Election, vote-by-mail and polling place voters turned out at nearly the same frequency. The
overall turnout rate in November 2016 was well above typical for
presidential general elections.
86.0%
79.9%
54.7%
82.8%
95.5%
81.9%
55.7%
82.8%
70.4%
75.6%
51.8%
82.7%
0%
20%
40%
60%
80%
100%
11/4/08 Gen 11/6/12 Gen 6/7/16 Pri 11/8/16 Gen
Voter Turnout PercentagesPast Presidential Elections
TO % VBM TO % PP TO %
70.7% 70.5%
86.0%
79.9%82.8%
0%
20%
40%
60%
80%
100%
11/7/00 PresidentialGeneral
11/2/04 PresidentialGeneral
11/4/08 PresidentialGeneral
11/6/12 PresidentialGeneral
11/8/16 PresidentialGeneral
TO %
Voter Turnout PercentagesPast Presidential General Elections
6/7/2016Presidential
Primary
11/8/2016Presidential
General
11/4/2008Presidential
General
11/6/2012Presidential
General
2000G - 11/7/2000 Presidential General2004G - 11/2/2004 Presidential General2008G - 11/4/2008 Presidential General2012G - 11/6/2012 Presidential General2016G - 11/8/2016 Presidential General 20
00G
2008
G
2012
G
2016
G
2004
G

Percent
Hillary Clinton Gloria Estela La Riva Gary Johnson
Jill Stein Donald J. Trump Bernard "Bernie" Sanders
Evan McMullin
4
Percent
Hillary Clinton Gloria Estela La Riva Gary Johnson
Jill Stein Donald J. Trump Bernard "Bernie" Sanders
Evan McMullin
Percent
Hillary Clinton Gary Johnson Jill Stein Donald J. Trump All Other Candidates
Percent
Hillary Clinton Donald J. Trump All Other Candidates
Santa Clara County, Presidential VotesNovember 8, 2016, Presidential General Election
Hillary Clinton,Democratic
144,82620.6%
Not included in graph:89 votes for otherqualified write-in candidates
State of California, Presidential VotesNovember 8, 2016, Presidential General Election
U.S. Popular Vote, PresidentNovember 8, 2016, Presidential General Election
U.S. Electoral College Vote, PresidentNovember 8, 2016, Presidential General Election
511,68472.7%
12,6641.8%
25,3253.6%
2,7590.4%
2,2960.3%
4,0660.6% 8,753,788
61.7%
39,5960.3%
79,3410.6%
4,483,81031.6%
66,1010.5%
478,5003.4%
278,6572.0%
Not included in graph:1,802 votes for other
qualified write-in candidates
Gloria Estela La Riva,Peace and Freedom
Gary Johnson,Libertarian
Jill Stein,Green
Donald J. Trump,Republican/American Independent
Bernard "Bernie" Sanders,Qualified write-in
Evan McMullin,Qualified write-in
65,853,62548.0%62,985,106
45.9%
2,315,0431.7%
4,489,2333.3%
1,457,2221.1%
30456.5%
22742.2%
71.3%
Hillary Clinton
Donald J. Trump
Gary JohnsonJill SteinAll Other Candidates
Others receiving electoral votes: Colin Powell (3), John Kasich (1), Ron Paul (1), Bernie Sanders (1),
Faith Spotted Eagle (1) The graphs on this page show President Donald Trump receiving an increasingly larger share of the vote as the tallies move from county to state to national levels, and ultimately the Electoral College.
5
Percent
Bernard "Bernie" Sanders Evan McMullin Hillary Clinton Donald J. Trump All Other Candidates
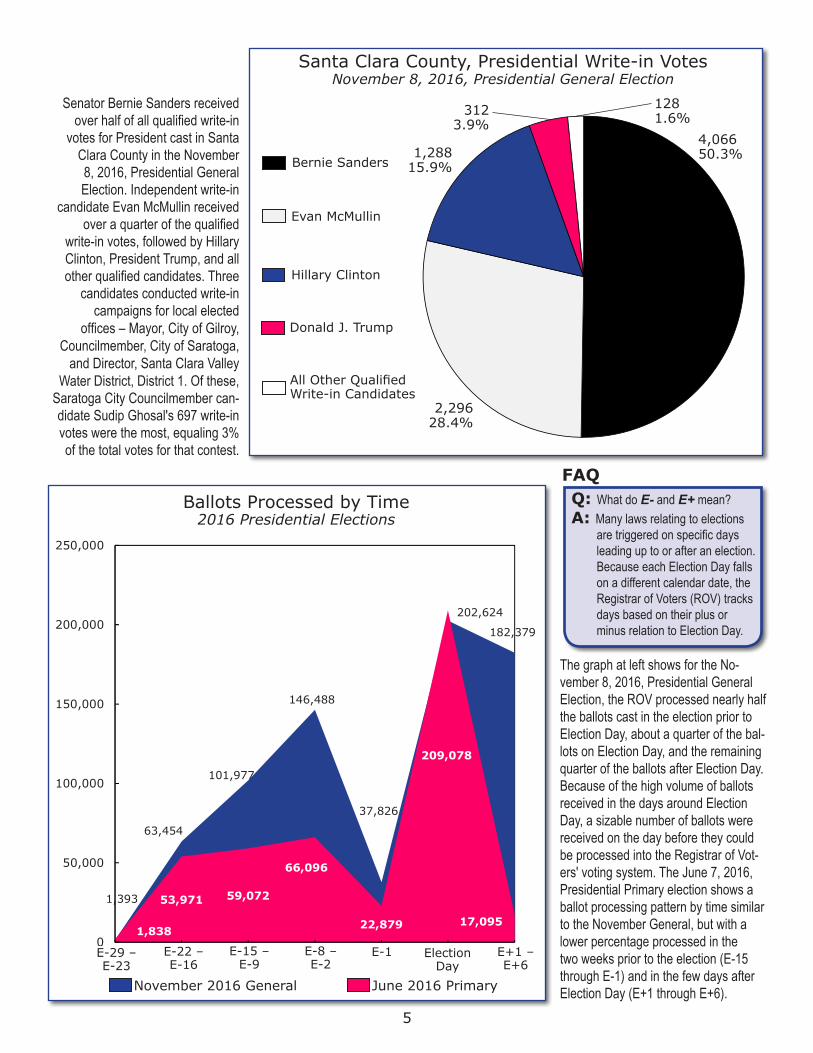
1,393
63,454
101,977
146,488
37,826
202,624
182,379
1,838
53,971 59,072
66,096
22,879
209,078
17,095
0
50,000
100,000
150,000
200,000
250,000
E‐29 ‐ E‐23 E‐22 ‐ E‐16 E‐15 ‐ E‐9 E‐8 ‐ E‐2 E‐1 E‐Day E+1 ‐ E+6
Chart Title
Series1 Series2
The graph at left shows for the No-vember 8, 2016, Presidential General Election, the ROV processed nearly half the ballots cast in the election prior to Election Day, about a quarter of the bal-lots on Election Day, and the remaining quarter of the ballots after Election Day. Because of the high volume of ballots received in the days around Election Day, a sizable number of ballots were received on the day before they could be processed into the Registrar of Vot-ers' voting system. The June 7, 2016, Presidential Primary election shows a ballot processing pattern by time similar to the November General, but with a lower percentage processed in the two weeks prior to the election (E-15 through E-1) and in the few days after Election Day (E+1 through E+6).
Ballots Processed by Time2016 Presidential Elections
November 2016 General June 2016 Primary
E-29 – E-23
E-22 – E-16
E-15 – E-9
E-8 – E-2
E-1 E+1 – E+6
ElectionDay
Santa Clara County, Presidential Write-in VotesNovember 8, 2016, Presidential General Election
All Other QualifiedWrite-in Candidates
Bernie Sanders
Evan McMullin
Hillary Clinton
Donald J. Trump
4,06650.3%
1281.6%312
3.9%
2,29628.4%
1,28815.9%
Senator Bernie Sanders received over half of all qualified write-in
votes for President cast in Santa Clara County in the November 8, 2016, Presidential General Election. Independent write-in
candidate Evan McMullin received over a quarter of the qualified
write-in votes, followed by Hillary Clinton, President Trump, and all other qualified candidates. Three
candidates conducted write-in campaigns for local elected
offices – Mayor, City of Gilroy, Councilmember, City of Saratoga,
and Director, Santa Clara Valley Water District, District 1. Of these,
Saratoga City Councilmember can-didate Sudip Ghosal's 697 write-in votes were the most, equaling 3% of the total votes for that contest.
FAQQ: What do E- and E+ mean?A: Many laws relating to elections
are triggered on specific days leading up to or after an election. Because each Election Day falls on a different calendar date, the Registrar of Voters (ROV) tracks days based on their plus or minus relation to Election Day.

6
Starting 10 days before the election, all of the vote-by-mail ballots received prior to Election Day are processed and tallied before 8 p.m. State law, however, does not allow the Registrar of Voters (ROV) to release the first results until the polls close. The first point on the upper graph – showing the number of ballots tallied as of 8 p.m. on Election Day – represents the VBM ballots that were tallied in the days prior to Election Day. The second point on Election Day shows the bulk of the tallied polling place ballots retrieved during Election Day as part of the midday pickup pro-gram. The rightmost point on the upper graph represents the final posted report including all the polling place ballots processed on Election Night. The ROV finished tallying around 9:30 a.m. in the morning, and posted the final report close to 10:30 a.m., a finish-
ing time that trailed other large counties in the state. The 443,269 ballots tallied by this final Election Night report made up 61% of the total ballots cast in the election. The ROV made up ground, however, after Election Day. By the November 14 deadline to re-ceive valid vote-by-mail ballots, the ROV had processed approxi-mately 85% of total ballots cast – well above the average for large county election offices and second only to Alameda County’s approximately 87% of total ballots processed by then.The polling place ballots tallied last in the lower graph are mostly provisional ballots, which need to be verified for voter and contest eligibility. In some cases, these ballots must be further processed to ensure that provisional voters only cast votes in contests for which they were eligible to vote.
23,393 26,473 41,068
54,141
66,493
80,844
95,207
108,265
121,322
128,309
136,330
142,787
151,022
286,774 292,247 292,247
0
100,000
200,000
300,000
400,000
1 2 3 4 5 6 7 8 9 10 11 12 13 14 15
Chart Title
Precinct Ballots Tallied VBM Ballots Tallied
151,747 152,807 153,628 153,862 154,243 155,925183,152 190,336 190,379
298,855358,145
421,779461,932
515,136 530,532 533,845 534,023 534,217
0
200,000
400,000
600,000
16 17 18 19 20 21 22 23 24 25 26 27 28 29 30 31 32 33 34 35 36 37 38 39 40
Chart Title
Precinct Ballots Tallied VBM Ballots Tallied
Ballots Tallied Over TimeNovember 8, 2016, Presidential General Election
Polling Place Ballots Tallied Vote-by-Mail Ballots Tallied11/8
Election Day11/9
8 p.m.
9 p.m.
10 p.m
.
12 a.
m.
2 a.m.
1 a.m.
a.m.
p.m.
a.m.
p.m.
a.m.
p.m.
a.m.
p.m.
11 p.m
.
3 a.m.
4 a.m.
5 a.m.
6 a.m.
7 a.m.
9 a.m.
8 a.m.
10 a.
m.
11/10 11/11 11/12
a.m.
p.m.
a.m.
p.m.
11/13 11/14
11/9 11/1
612
/612
/1
11/1
711
/19
11/2
111
/23
11/2
2
11/1
8
11/2
811
/20
11/2
9p.m.
11/15
FAQQ: Why were ballot tally updates provided only once an hour on Election Day?A: The Registrar of Voters (ROV) typically publishes vote count updates every 45 minutes on Election Day, starting at 8 p.m. when the polls
close. With the historically high volume of ballot cards in the November 8, 2016, Presidential General Election, the report from the vote tabulation program took about 45 minutes itself to generate, and required additional processing steps to produce a properly formatted vote count for the ROV’s Election Night Results website. As a result, the ROV posted hourly updated election results on the website on Election Night and through the early morning hours, until the final report with all of the polling place votes posted after 10 a.m. on November 9. Thereafter, the ROV posted updates twice daily during the 24-hour ballot processing period spanning the week after Election Day.

18-24
June Presidential Primary
25-34 35-44 45-54 55-64 65-74 75+
November Presidential General
Generally, no matter the voting method, the higher the age group, the higher the turnout in both the November 8, 2016, Presidential General Election and the June 7, 2016, Presidential Primary Election. The rate of turnout by age group rises and crests among voters between 65 and 74, before decreasing somewhat among voters at least 75. In the November General as in most other elections, the higher the age group, the more likely the voter was to vote by mail.
7
39.5%36.2%
30.7%26.8%
23.5%17.6%
12.9%
60.5%63.8%
69.3%73.2%
76.5%82.4%
87.1%
0%
20%
40%
60%
80%
100%
18‐24 25‐34 35‐44 45‐54 55‐64 65‐74 75+
Voting Method by Age Group
Voted Polling Place Voted By Mail
41.9% 43.3% 45.3%51.9%
62.2%
72.5% 71.3%
63.6%
75.2%
83.6%87.1% 88.6% 89.4%
84.4%
0%
20%
40%
60%
80%
100%
18‐24 25‐34 35‐44 45‐54 55‐64 65‐74 75+
Voter Turnout by Age Group ‐ June vs Nov
2016 June 2016 Nov
18-24 45-54 55-64 65-74 75+
Voted at Polling Place
25-34
Voted by Mail
Voter Turnout by Age Group2016 Presidential Elections
Voting Method by Age GroupNovember 8, 2016, Presidential General Election
35-44

Challenges ResolvedDue to a combination of factors ranging from the size and
scrutiny involved in the landmark election to the conduct of 10 automatic recounts, the November 8, 2016, Presidential General Election presented several unanticipated challenges that the Reg-istrar of Voters (ROV) resolved throughout the election preparation process. Below are some of the issues that were solved by the ROV’s dedicated staff behind the scenes to ensure a positive voting experience and a successful presidential election.Donald J. Trump Nominated by Two PartiesWhat happened?
As expected, presidential candidate Donald J. Trump and his vice-presidential running mate Michael R. Pence received the nomination from the national Republican Party. For California ballots, the presidential ticket also received the nomination from the American Independent Party.
Why was this challenging?The ROV is required by state law to print “Vote for One Party” instructions on the ballot, and election officials from some counties suggested that Mr. Trump therefore needed to be printed twice on the ballot. Voters might be confused if they saw a candidate listed in two places on the ballot.
How was this solved?The ROV communicated with other counties and the California Secretary of State about the unusual challenge. The Secretary of State advised that the names of Mr. Trump and Mr. Pence needed to be printed on only one line, but that both nominat-ing political parties would be listed. The “Vote for One Party” instructions would need to remain on the ballot. During the elec-tion, there were no reports of voter confusion about the ballot listing two political parties for the ticket of Trump and Pence.
Midday Ballot PickupWhat happened?
A 2016 law allows voted ballots to be retrieved from polling places before the polls close in order to relieve the burden of a high volume of returns on Election Night.
Why was this challenging?The law requires specific procedures to ensure ballot security and uniform processing of ballots. The ROV was able to se-curely process over 23,000 voted ballots picked up on Election Day from 201 polling places for the midday pickup in the June 2016 Presidential Primary, but the turnout rate in November was expected to be 25 to 30 percentage points higher than in June, and neither the vehicle entrance capacity at the ROV headquarters nor the midday ballot processing area could be expanded significantly.
How was this solved?The ROV redesigned the ballot sorting and counting process to maximize space and efficiency within the midday ballot processing area, and hired dozens of additional election volunteers to be able to process twice the number of ballots, and three times the number of ballot cards, than had been processed in June. Through process improvements and careful
planning, the ROV was able to retrieve over 46,000 ballots from 211 polling places as part of the midday pickup process during the November 8, 2016, Presidential General Election. This enabled the ballot counting teams to get a head start on providing Election Night returns to the interested public.
Accelerated Canvass and Automatic RecountsWhat happened?
A pilot program approved by the Santa Clara County Board of Supervisors called for the ROV to conduct, prior to certification of the November 8, 2016, Presidential General Election, an automatic recount for any local contest with a margin of victory within 0.5% or 25 votes.
Why was this challenging?The ROV could not be certain how many contests would quali-fy for an automatic recount until all the ballots were counted. In a major election expected to have high voter turnout, it would take weeks to count all of the vote-by-mail ballots, provisional ballots, and ballots with write-in votes. The ROV would there-fore need to recruit enough staff for hand recounts of multiple contests, and conduct many tasks involved in the post-election canvass simultaneously, instead of sequentially.
How was this solved?With the help of the County Human Resources (HR) depart-ment, the ROV recruited extensively, administering surveys, conducting phone interviews, and holding job fairs to secure enough staff for operations before, during, and after Election Day, and for potential automatic recounts. The ROV was able to recruit 407 temporary staff members, of whom 376 were submitted to HR for hiring. The ROV also received approval from the Board of Supervisors to extend the hours of some of its more experienced temporary staff members, so that they would not reach their maximum hour limit during the post-elec-tion canvass or recount operations. In addition, the ROV adjusted its typical canvass schedule, moving up some tasks and running others in parallel, so that automatic recount efforts could be carried out during the later stages of the canvass.During planning, the question remained about how many work-ers would be needed for an unknown number of recount oper-ations. A total of 297 automatic recount-eligible contests had been held in the four countywide general elections since 2008 plus the June 2016 Presidential Primary, when one contest did qualify to be recounted. Of these 297 contests, a total of 11 contests (4%) would have met the margin of victory criteria for an automatic recount. This percentage suggested as many as three or four out of 93 local contests could qualify for recount in November, although six contests out of 64 (9%) would have qualified for recount in the November 4, 2008, Presidential General Election, had the recount pilot been in place then.By November 23, 2016, the ROV confirmed a total of 10 local contests (11%) would be recounted starting Monday, Novem-ber 28. Starting with 125 staff members and reaching 307 after the canvass concluded, the ROV succesfully completed the recounts in six weeks’ time, by January 5, 2017. The election outcomes for all 10 contests were confirmed by the recounts.
8

Takeaways
9
For an election encompassing nearly 900,000 voters, 836 polling places, and nearly 725,000 ballots cast, the November 8, 2016, Presidential General Election went as smoothly as could have been hoped. Over 7,000 Registrar of Voters (ROV) staff members,
election officers, Election Day volunteers, and automatic recount staff worked tirelessly to prepare for, conduct, and verify the election.This experience has provided numerous key facts and lessons to keep in mind for future elections:
• Despite the presidential race not expected to be and notending up too close in California, turnout in Santa ClaraCounty was higher than in its peer counties,the statewide average, and the national av-erage. Extensive voter outreach through advertising andthe wealth of voting opportunities – including early votingsites, drive-thru locations, drop-off boxes, and postage paidenvelopes – likely contributed to this higher turnout.
• The election saw the most ever ballots cast in aSanta Clara County election, with the second highestturnout rate in 48 years.
• While the ROV has increased early voting opportunities,over 100,000 vote-by-mail (VBM) voters,or about 19% of participating VBM voters,dropped off their completed VBM ballots onElection Day rather than mailing them in early.
• More than 40,000 voters voted provisionally at thepolls, representing a higher than average percentage of allvoters and establishing a new record for a Santa ClaraCounty election.
• Despite nearly 75% more ballots cast in November than inthe June 2016 Presidential Primary, about 2,000 fewerVBM ballots were received after Election Dayand about 1,000 fewer valid VBM ballots werereceived after Election Day in November, as vot-ers appeared to be motivated to vote earlier in the Presiden-tial General Election.
• Although the ROV has augmented its vote-tallying opera-tions through additional vote-tallying machines, conducting24-hour processing of VBM ballots, and conducting middaypickups – all of which ultimately led to faster ballot countingthan in past elections – Santa Clara County stilltrails similarly sized counties with respect toreporting times. Santa Clara County is currently in theprocess of replacing its aging voting system with a modernone, which would significantly increase tallying efficiency.
• Despite an Election Night final reporting time trailing itspeers, the Santa Clara County ROV jumped to secondamong large county election offices in thepercentage of total ballots processed by theNovember 14 deadline to receive timely postmarked ballots.
• Voters registering to vote and updating their registrationinformation online now exceed those using paper forms, withalmost 75% of registration documents submit-ted over the internet, up from 60% in June.
• The nearly 900,000 registered voters was thehighest ever recorded in a Santa Clara County elec-tion, and that figure is expected to rise considerably in theyears ahead with the New Motor Voter Program at the DMV.
• A new law allowing midday pickups of voted ballots atpolling places enabled the ROV to retrieve about15% of the polling place ballots cast and tallythem early, which eased the burden of tallying more than160,000 polling place ballots after the polls closed.
• The turnout among polling place voters wasnearly identical to that of VBM voters, and wasthe closest to the overall countywide turnout in any presiden-tial-year election since prior to 2008.
• A total of 10 local contests with narrow victory marginsmet the criteria for automatic recount in the election, andmore than 300 ROV staff members worked sixweeks to hand recount the voted ballots in these contests.The recounts confirmed the winners in all 10 contests.Based on the ROV’s experiences in the June 7, 2016,Presidential Primary and the November 8, 2016, Presiden-tial General, it takes between three days and one week toperform a hand recount of an average-sized local contest.
Staff mem-bers close one of the county’s five early vot-ing sites in preparation for voters arriving the next day.

Figures in Pictures
Register, Update, and ParticipateThe best way to ensure that your voice is heard is to vote. The Registrar of Voters (ROV) offers numerous ways you can register to
vote, update your registration information, stay informed regarding election news, track your ballot, and locate your polling place.
Register to Vote
• In Person: Visit the ROV’s office between 8 a.m. and5 p.m., Monday through Friday, at 1555 Berger Drive, Build-ing 2, in San Jose.
• By Mail: Obtain a voter registration affidavit from a library,post office, or other government office.
• Online: Visit www.sccgov.org/sites/rov/Register/Pages/Online.aspx.
Find Your Voting Information
• By Mobile App: Visit www.sccgov.org/sites/rov/Pages/Registrar-of-Voters.aspx and click on “SCCVOTE MobileApp” to download the ROV’s app for Android or Apple.
• Access Candidate and Measure Information:View information about recent and upcoming elections atwww.sccgov.org/sites/rov/Info/Pages/CandidateINFO.aspx.
• Keep Up to Date: Look up your districts and pollingplace, verify that your ballot was received and counted, andmore at eservices.sccgov.org/rov.
Volunteer• Learn how to serve as a paid election officer by visiting
www.sccgov.org/sites/rov/Volunteer/Pages/Volunteer.aspx.Update Your Registration
• Update your registration information or provide changes toyour address, party affiliation, or language preference atwww.sccgov.org/sites/rov/Register/Pages/ChangeRegistration.aspx.
Connect with the ROV• By Phone: 1-866-430-VOTE (8683) or
1-408-299-VOTE (8683).• On the Web: Visit www.sccgov.org/sites/rov/Pages/
Registrar-of-Voters.aspx.• Facebook: Become part of the ROV’s network at
www.facebook.com/sccvote.• Twitter: Get up-to-the-minute tweets at twitter.com/sccvote.• YouTube: Watch videos at www.youtube.com/user/sccvote.• RSS: Subscribe to the ROV feed at www.sccgov.org/sites/
rov/RSS/Pages/RSS.aspx.
10
Find this and past post-election reports online by visiting www.sccgov.org/sites/rov/Resources/Pages/Statistics.aspx.Post-Election Reports
Voters in Santa Clara County participated in the election at a substantially higher
rate – 82.8% – than the statewide average of
75.3%
Among the 10 Califor-nia counties with the
largest number of registered voters,
Santa Clara County voters turned out at
the highest rate
Among the 10 California counties with the largest number of registered voters, Santa Clara County has by far the highest percentage of vote-by-mail voters at 73.7%
During the election, ROV staff members delivered, distributed and restocked more than 125 tons of polling place equipment and supplies – a weight greater than the statue of President Lincoln at the Lincoln Memorial in Washington, D.C.
ROV staff and more
than 7,000 election
officers and volunteers recruited for the election formed an organization larger
than all the registered voters in Califor-nia’s smallest two counties combined
+Alpine County
Sierra County