Embed Size (px)
Citation preview

RFTA 2014 Regional Travel Patterns Study 1
EXECUTIVE SUMMARYRoaring Fork and Colorado River Valleys Regional Travel Patterns Study
2004 2014Population1 71,037 82,2272
Population residing year-round 94% 94%Lived in region > 1 year 92% 93%Households with children under 16 31% 31%Households receiving housing assistance 12% 12%Median annual household income $75,0003 $66,000
H O U S I N G / D E M O G R A P H I C D ATA
O
V
E
R
V
I
E
W
EAGL
E
PI TK IN
GARF
IELD
Rural West Garfield County
Rural East Garfield County
Rural East Pitkin County
Rural West Pitkin County
Rural Southwest Eagle County
Missouri Heights/ Lookout Mtn.
West Aspen
Snowmass Village
Battlement Mesa
Aspen Airport/Woody Creek
El Jebel
Downtown/ West Glenwood Springs
South Rifle
East Aspen
Silt
Basalt
New CastleCentral Rifle
Carbondale
Parachute
North Rifle
Glenwood Meadows/ Red Mtn.
§̈¦70
¬«13 ¬«325
MESA
GARFIELD EAGLE
PITKIN
DELTAGUNNISON
LAKE
RIO BLANCO
CHAFFEE
SUMMIT
0 7.5 Miles
!(82
§̈¦70
Transportation Analysis Zone Map of the Region
R E G I O N A L G E O G R A P H Y
The regional travel patterns profile includes data col-lected from all of Garfield and Pitkin Counties and the portion of Eagle County within the Roaring Fork Valley. This includes all 23 transportation analysis zone(s) (TAZs) mapped below.
1 . U. S . C e n s u s B u r e a u2 . 2 0 1 2 Po p u l a t i o n ( A m e r i c a n C o m m u n i t y S u r v e y )3 . I n f l a t i o n a d j u s t e d f o r 2 0 1 4 d o l l a r s
Transportation Analysis Zones (TAZs)Parachute Missouri Heights/ Lookout Mtn.Battlement Mesa CarbondaleNorth Rifle El JebelCentral Rifle BasaltSouth Rifle Rural Southwest Eagle CountyRural East Garfield County Rural West Pitkin CountyRural West Garfield County Rural East Pitkin CountySilt Snowmass VillageNew Castle Aspen Airport/ Woody CreekDowntown/ West Glenwood Sprgs. West AspenGlenwood Meadows/ Red Mtn. East AspenSouth Glenwood Springs
Data for 2014 was collected from the 2014 Winter and Summer Roaring Fork Transportation Authority (RFTA) Travel Patterns Survey unless otherwise indicated. Data for 2004 was collected from the 2004 Local & Regional Travel Patterns Survey unless otherwise indicated.

RFTA 2014 Regional Travel Patterns Study2
EXECUTIVE SUMMARY 2014 Regional Travel Patterns Study
2004 20142012 Worker population2 43,0004 48,3855
Vehicle available for commuting 85% 87%Average commute distance 15 miles 16 milesAverage commute time 23 mins 25 minsWork and live in same community 41% 37%Workers with free parking at work 81% 91%
C O M M U T I N G D ATA
C
O
M
M
U
T
T
I
N
G
93%
1% 1% 1% 1% 2%
87%
2% 2% 1% 1% 7%
0%10%20%30%40%50%60%70%80%90%
100%
Do nottelecommute
Less than 1 daya month
1-3 days permonth
1 day per week 2 days perweek
3 or more daysa week
Telecommute Mode Shift
2004
2014
Telecommute Mode Shift Commute Mode Share by Parking Type at Work*
52%
15% 17% 9% 8%
62%
12% 19%
5% 2% 0%
10%
20%
30%
40%
50%
60%
70%
Drove Alone Carpool Bus Walk Bike
Commute Mode Share
Summer
Winter
2014 Commute Mode Share
71%
12% 8% 6% 2%
42%
20%
34%
3% 1%
31%
5%
61%
1% 1% 0%
10%
20%
30%
40%
50%
60%
70%
80%
Drove Alone Carpool Bus Walk Bike
Mode Share by Bus Pass Ownership
No Bus Pass
Stored Value Card
Bus Pass
Commute Mode Share by Bus Pass Ownership*
64%
16% 12%
6% 2%
62%
12% 19%
5% 2% 0%
10%
20%
30%
40%
50%
60%
70%
Drove Alone Carpool Bus Walk Bike
Winter Commute Mode Shift
2004 2014
Winter Commute Mode Shift Commute Mode Share by Employer Provided Bus Pass*
69%
13% 10% 6%
2%
31%
16%
50%
2% 1% 0%
10%
20%
30%
40%
50%
60%
70%
80%
Drove Alone Carpool Bus Walk Bike
Employer Provided Bus Pass Mode Share
No EmployerProvided Pass
Employer ProvidedBus Pass (partial orfull cost)
4 . E s t i m a t e b a s e d o n B u r e a u o f E c o n o m i c A n a l y s i s d a t a5 . 2 0 1 2 5 - y r A C S , Wo r k e r Po p u l a t i o n b y Wo r k p l a c e G e o g r a p h y
75%
13% 8%
2% 2%
53%
7%
39%
2% 0% 0%
10%
20%
30%
40%
50%
60%
70%
80%
Drove Alone Carpool Bus Walk Bike
Mode Share by Parking Type
Free Parking
Paid Parking
* 2 0 1 4 w i n t e r d a t a
RFTA 2014 Regional Travel Patterns Study 3
EXECUTIVE SUMMARY 2014 Regional Travel Patterns Study
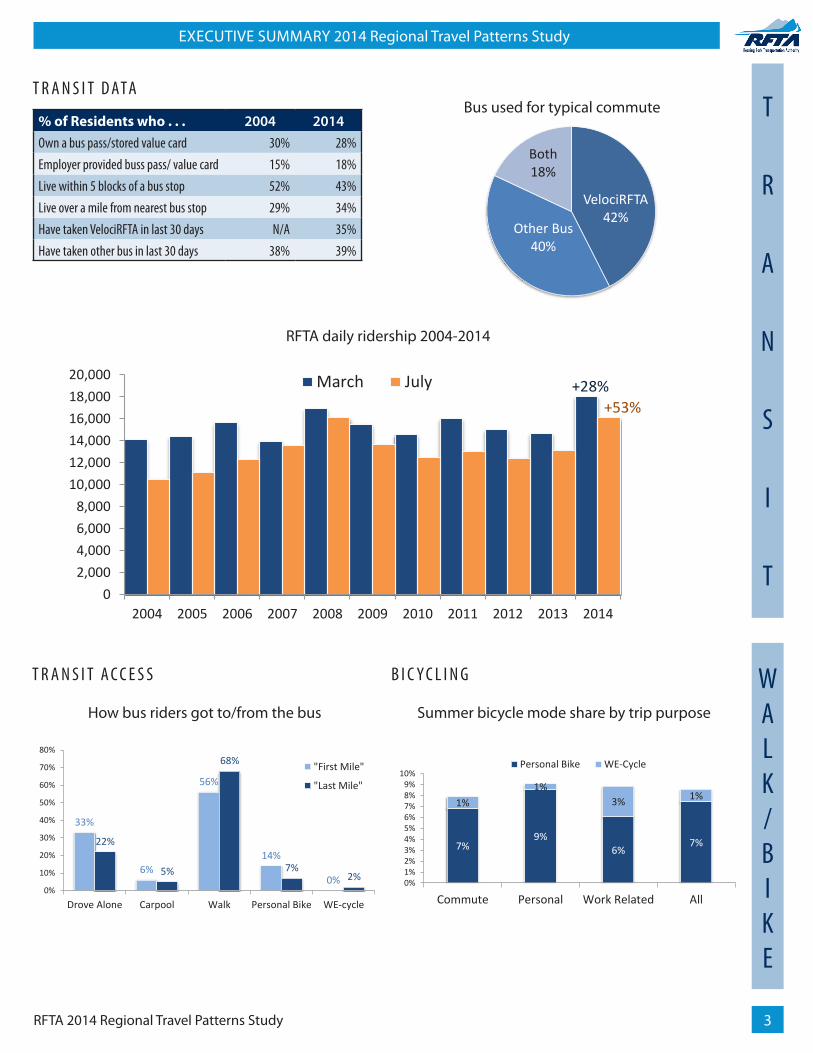
% of Residents who . . . 2004 2014Own a bus pass/stored value card 30% 28%Employer provided buss pass/ value card 15% 18%Live within 5 blocks of a bus stop 52% 43%Live over a mile from nearest bus stop 29% 34%Have taken VelociRFTA in last 30 days N/A 35%Have taken other bus in last 30 days 38% 39%
T R A N S I T D ATA
VelociRFTA 42%
Other Bus 40%
Both 18%
Bus Used For Typical Commute Bus used for typical commute
How bus riders got to/from the bus
T R A N S I T A C C E S S
Summer bicycle mode share by trip purpose
B I C Y C L I N G
T
R
A
N
S
I
T
W A L K / B I K E
02,0004,0006,0008,000
10,00012,00014,00016,00018,00020,000
2004 2005 2006 2007 2008 2009 2010 2011 2012 2013 2014
Daily Ridership March July +28%
+53%
RFTA daily ridership 2004-2014
33%
6%
56%
14%
0%
22%
5%
68%
7% 2%
0%
10%
20%
30%
40%
50%
60%
70%
80%
Drove Alone Carpool Walk Personal Bike WE-cycle
Transit Access Mode Share
"First Mile"
"Last Mile"
7% 9%
6% 7%
1% 1%
3% 1%
0%1%2%3%4%5%6%7%8%9%
10%
Commute Personal Work Related All
Summer Bicycle Mode Share by Trip Purpose
Personal Bike WE-Cycle

RFTA 2014 Regional Travel Patterns Study4
EXECUTIVE SUMMARY 2014 Regional Travel Patterns Study
O
T
H
E
R
T
R
I
P
S
A B O U T T H E P R O J E C T
41%
23%
9%
18%
9%
56%
14% 8%
19%
4%
0%
10%
20%
30%
40%
50%
60%
Drove Alone Carpool Bus Walk Bike
Personal Trips Mode Share
Summer
Winter
Personal Trips Mode Share Work-Related Trips Mode Share
53%
19%
9% 15%
3%
56%
14% 8%
19%
4%
0%
10%
20%
30%
40%
50%
60%
Drove Alone Carpool Bus Walk Bike
Winter Personal Trips Mode Shift
2004
2014
Winter Personal Trips Mode Shift Winter Work-Related Trips Mode Shift
P E R S O N A L T R I P S O F R E S I D E N T S W O R K - R E L AT E D T R I P S O F W O R K E R S
58%
14% 10% 9% 9%
64%
17%
8% 9% 3%
0%
10%
20%
30%
40%
50%
60%
70%
Drove Alone Carpool Bus Walk Bike
Work-Related Mode Share
Summer
Winter
The Roaring Fork Transportation Authority (RFTA) conducted a regional travel patterns study in 2014 of the Colorado River Valley and Roaring Fork Valley from Parachute to Aspen. Previous studies were completed in 1998 and 2004. The project was a cooperative effort of RFTA, Colorado DOT, and area counties and municipalities. The project was conducted to provide local jurisdictions and planning agencies with information on travel demand within the study area. This includes information about current and future needs for motor vehicles, for public transit and for walking and bicycling. Data from the study was also used to develop travel forecasts and will help companies and agencies design commuter support programs to address needed changes in travel choices.
The data collection methodology included two rounds of surveys, a winter and summer survey. The winter survey targeted employees and employers within the study area. The summer survey targeted residents. A total of 1,679 surveys of residents and employees were collected (1,352 in the winter and 327 in the summer) and 110 employer surveys were completed. The region was divided into 23 transportation analysis zones (TAZs) and all data will be available at the TAZ level. A comprehensive report of the study’s findings is available through RFTA.
Mode share is displayed above for the two trips purposes other than commute trips (shown on page 2 in the “Com-muting” section). These include work-related trips, which are trips made during work by employees for business purposes, and personal trips, which cover all other trips that are not commute or work-related trips.
63%
15% 11% 9%
2%
64%
17%
8% 9% 3%
0%
10%
20%
30%
40%
50%
60%
70%
Drove Alone Carpool Bus Walk Bike
Winter Work-related Mode Shift
2004 2014
RFTA 2014 Regional Travel Patterns Study 5
EXECUTIVE SUMMARY 2014 Regional Travel Patterns Study
K
E
Y
T
R
E
N
D
S
56,687 58,961 66,558 76,687 87,300 97,804 108,000 17,173 17,658
19,190 21,286
23,478 25,624
27,656
8,484 8,729 9,644
11,033 12,397
13,768 15,072
0
20,000
40,000
60,000
80,000
100,000
120,000
140,000
160,000
2013 2015 2020 2025 2030 2035 2040
Southwest Eagle County (+2.9%/yr)Pitkin County (+2.3%/yr)Garfield County (+3.4%/yr)
Region +3.1%/yr
82,344
151,000
85,000 95,000
109,000 123,000
137,000
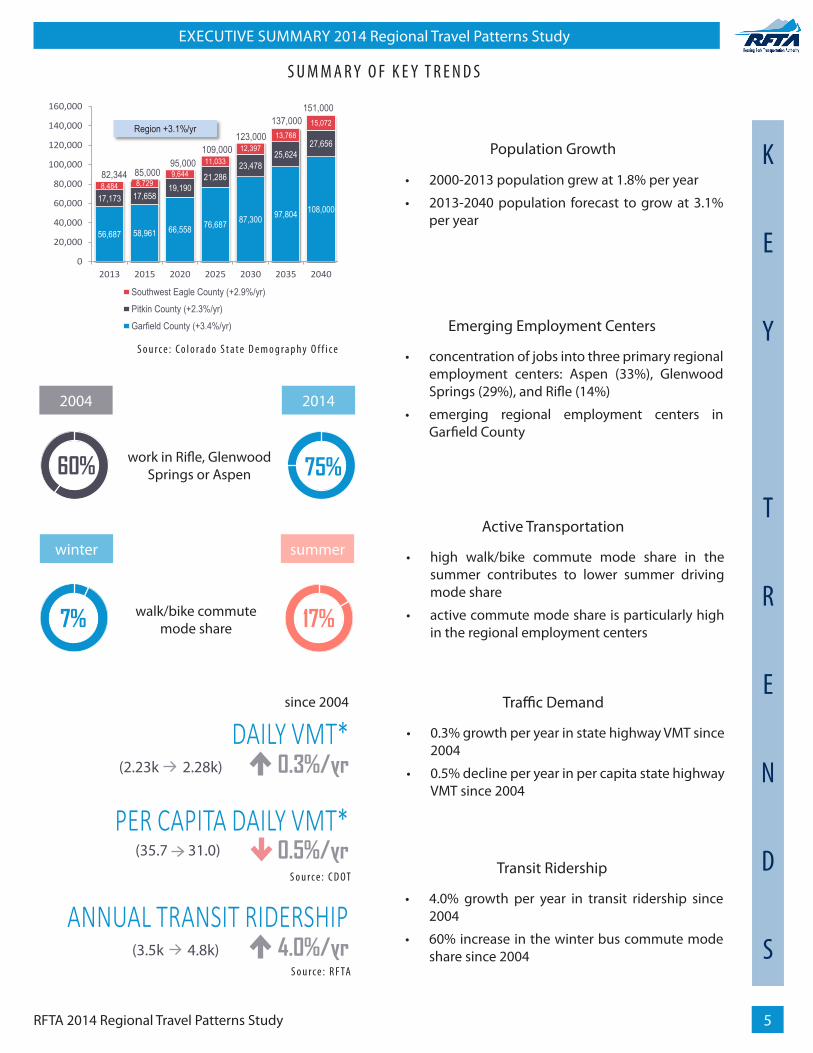
S U M M A R Y O F K E Y T R E N D S
2004 2014
work in Rifle, Glenwood Springs or Aspen 75%60%
walk/bike commute mode share
winter summer
17%7%
Population Growth
• 2000-2013 population grew at 1.8% per year
• 2013-2040 population forecast to grow at 3.1% per year
0.3%/yrDAILY VMT*
0.5%/yrPER CAPITA DAILY VMT*
since 2004
(2.23k 2.28k)
(35.7 31.0)
Emerging Employment Centers
• concentration of jobs into three primary regional employment centers: Aspen (33%), Glenwood Springs (29%), and Rifle (14%)
• emerging regional employment centers in Garfield County
Active Transportation
• high walk/bike commute mode share in the summer contributes to lower summer driving mode share
• active commute mode share is particularly high in the regional employment centers
Traffic Demand
• 0.3% growth per year in state highway VMT since 2004
• 0.5% decline per year in per capita state highway VMT since 2004
Transit Ridership
• 4.0% growth per year in transit ridership since 2004
• 60% increase in the winter bus commute mode share since 20044.0%/yr
ANNUAL TRANSIT RIDERSHIP(3.5k 4.8k)
S o u r c e : C o l o r a d o S t a t e D e m o g r a p h y O f f i c e
S o u r c e : C D OT
S o u r c e : R F TA

RFTA 2014 Regional Travel Patterns Study6
EXECUTIVE SUMMARY 2014 Regional Travel Patterns Study
I
M
P
L
I
C
A
T
I
O
N
S
S U M M A R Y O F I M P L I C AT I O N S
Regional TDM Program
The key trends from this study suggest that this region may have an opportunity in coming years to encourage a broad shift away from reliance on personal vehicles. Such an effort would coincide with a general trend al-ready underway. An effective way to encourage this would be to implement a regional transportation de-mand management (TDM) program that would coordi-nate local TDM programs in each community similar to the Transportation Program in the City of Aspen. The data provided by this study indicates that two significant opportunities could be the initial focus of a regional TDM program – transit passes and parking management.
TDM – Transit Passes
The survey results revealed that the propensity to com-mute by bus is five times higher for workers with an employer-provided bus pass than for those without an employer-provided bus pass. Only 2% of employees in Rifle and 6% of employees in Glenwood Springs own a bus pass, whereas 19% of Carbondale, 27% of Snowmass Village, and 37% of Aspen workers own passes. A region-al program coordinated by or with RFTA to increase the number of workers with bus passes would pay direct and significant dividends in increased ridership, reduced de-pendency on auto commuting and employment growth.
TDM – Parking Management
The survey data indicates that 88% of commuters with access to free parking drive to work, while only 60% of those who do not have access to free parking drive to work. As employment grows in the regional job centers, local communities and employers should consider tak-ing a more active role in parking management in order to reduce vehicle trips, more efficiently utilize develop-able land and facilitate the creation of more pedestrian-friendly urban environments.
Strategic Community Development
Transit ridership growth has created the potential for municipalities in the region to integrate land use devel-opment with these transit services. One way to do this would be update local comprehensive plans to include transit-oriented development strategies. With popula-tion growth in the region forecast to continue above 2% annually, there will be ample opportunity to guide this new housing and employment toward transit-served places. Such an approach would pay major long-term
dividends in the form of transportation and land use ef-ficiencies that would reduce future tax burdens and en-courage economic development.
Transit service in the I-70 corridor
The emergence of Glenwood Springs and Rifle as sig-nificant employment centers has implications for the regional transit network. In 2014, 38% percent of all winter commute trips by Aspen and Snowmass workers and 23% by Carbondale workers were made by transit. However, transit only accounts for 3% of winter com-mute trips by Glenwood Springs employees, and 2% by Rifle employees. These differences in transit propensities are a direct result of the limited transit service currently available within and to these communities. Future transit could include the eventual extension of BRT-style servic-es (bus rapid transit) to Rifle or even Parachute, an effort that could begin with an increase in regular bus and ex-press bus service in the I-70 corridor.
Access to VelociRFTA Service
The new VelociRFTA Bus Rapid Transit (BRT) between Glenwood Springs and Aspen has improved regional travel. However, the more streamlined system, with fewer detours off the highway is producing greater demand for “first and last mile” travel (to and from the BRT stations) in the communities along the route. Since 2004 the per-cent of bus commuters who drove to the bus increased from 15% to 25%. At the same time, RFTA’s park-n-ride lots are at or near capacity throughout most of the transit system. To leverage the BRT program investment, future regional and local transportation investments should focus on improving facilities for walking and biking to the major bus stops and increasing local bus circulation within communities, particularly in communities north and west of Aspen and Snowmass.
Local connectivity
The three regional employment centers are not only growing in size, but the percent of residents who both live and work in those communities is also growing. This presents an opportunity to increase the number of walk/bike commute trips. Local jurisdictions could support this by connecting missing links in the street, bike and pedestrian networks; establishing robust connectivity requirements for future developments; and establishing policies that support and encourage walking and biking within these communities.