Embed Size (px)
Citation preview

EXECUTIVE SUMMARY
ON
CIVIL SERVICE RETIREMENT PROGRAMS FOR A NEW ERA
A Report Prepared for the Government of Indonesia by the World Bank
Mitchell Wiener, Iene Muliati and Yves Guérard
April 2012
Pub
lic D
iscl
osur
e A
utho
rized
Pub
lic D
iscl
osur
e A
utho
rized
Pub
lic D
iscl
osur
e A
utho
rized
Pub
lic D
iscl
osur
e A
utho
rized
Pub
lic D
iscl
osur
e A
utho
rized
Pub
lic D
iscl
osur
e A
utho
rized
Pub
lic D
iscl
osur
e A
utho
rized
Pub
lic D
iscl
osur
e A
utho
rized

EXECUTIVE SUMMARY
2 Civil Service Pension Programs for a New Era
EXECUTIVE SUMMARY
ON
CIVIL SERVICE RETIREMENT PROGRAMS FOR A NEW ERA
Mitchell Wienera, Iene Muliati
b and Yves Guérard
c
a Senior Social Protection Specialist, East Asia Pacific. World Bank, Indonesia
b Social Protection Specialist, East Asia Pacific. World Bank, Indonesia
c Consultant, East Asia Pacific. World Bank, Washington, USA
This Executive Summary is prepared for the Government of Indonesia and based on the 2011 Actuarial
Consultant Report by Yves Guérard for the World Bank and on various consultations with key
representatives from the Government of Indonesia.

EXECUTIVE SUMMARY
Civil Service Pension Programs for a New Era 3
Table of Contents
List of Abbreviations and Acronyms .............................................................................................. 4
1. Introduction ............................................................................................................................. 5
2. Background .............................................................................................................................. 5
3. Analysis of the Current Program Issues .................................................................................. 7
3.1 Participant Data as of December 2010 ................................................................................. 7
3.2 Assumptions ......................................................................................................................... 7
3.3 Current Pension Program Issues .......................................................................................... 8
3.4 Current THT Program Issues ............................................................................................. 11
4. Reforming the CSP and THT Programs ................................................................................ 13
4.1 Changing political and economic environment ................................................................. 13
4.2 Design Features Meeting Reform Goals ............................................................................ 14
4.3 Civil Service Pension Reform Options .............................................................................. 16
4.3.1 Impact of Increase in Retirement Age and Change to Inflation Indexing ..................... 16
4.3.2 Design Options ............................................................................................................... 17
4.3.2.1 Reform Option 1: DB for All ..................................................................................... 18
4.3.2.2 Reform Option 2: 20% of total pay DC for All .......................................................... 19
4.3.2.3 Reform Option 3: 20% NDC for All .......................................................................... 21
4.3.2.4 Reform Option 4: DC for New Civil Servants Only .................................................. 22
4.3.2.5 Reform Option 5: Hybrid system, DB and DC for All ............................................... 23
4.3.2.6 Reform Option 6: Hybrid system, DB and NDC for All ............................................ 24
4.4 THT Program Reform Options .......................................................................................... 25
5. Recommendations ................................................................................................................. 26
5.1 Key Considerations ............................................................................................................ 26
5.2 Bank Recommendations .................................................................................................... 27
5.3 Proposed Implementation Time Line ................................................................................. 29

EXECUTIVE SUMMARY
4 Civil Service Pension Programs for a New Era
List of Abbreviations and Acronyms Askes Asuransi Kesehatan (Health Insurance Program) Indonesia
Bapepam-LK Capital Market and Financial Institution Supervisory Agency
BI Bank of Indonesia
BKN Badan Kepegawaian Negara (National Civil Service Agency)
BUMM State Owned Enterprise
CS Civil Servant
CSP Civil Service Pension
DB Defined Benefit
DC Defined Contributions (also IA: Individual accounts)
GDP Gross Domestic Product
GOI Government of Indonesia
KMK Keputusan Menteri Keuangan (Decree from Minister of Finance)
KeMenPAN State Ministry for State Apparaturs and Bureaucracy Reform
LAN Lembaga Administrasi Negara (State Administrative Institution)
MOF Ministry of Finance
NDC Notional Defined Contributions
PAYG/Paygo Pay-as-you-go
Pejabat Negara State official
PNS Pegawai Negeri Sipil (Civil Servants)
SJSN Sistem Jaminan Sosial Nasional (National Social Security System)
Taspen PT Tabungan Asuransi Pensiun
THT Tabungan Hari Tua (Endowment Savings Program)
WB World Bank

EXECUTIVE SUMMARY
Civil Service Pension Programs for a New Era 5
1. Introduction
Indonesia’s pension programs for civil servants needs to be reformed because the current system is
inconsistent with the government's bureaucracy reform and pay reform initiatives, it does not provide
adequate retirement benefits to many career civil servants and it is not sustainable although fiscally
affordable. The system should be reformed so it is more equitable for all civil servants and to harmonize
it with the government’s other initiatives.
In order to reform the system, the following major steps are required.
1. Identify the weaknesses in the current programs. This requires systematic analysis of the design
and administrative systems for the current programs to identify the reasons the current system is
not meeting the government’s goals and objectives
2. Identify the goals and objectives for a new system that are consistent with other reforms in civil
service human resource and pay policies and explain their rationale. The government should
clearly articulate the rationale for the bureaucracy and pay reforms that are currently taking place.
It should then identify the goals and objectives of the pension system that are needed to support
these initiatives
3. Identify potential reform options that are consistent with those goals and objectives and review
their relative advantages and disadvantages. There will always be a range of designs that will be
consistent with and support the government’s goals. The potential reform options should be
identified and their advantages and disadvantages relative to the government’s objectives should
be specified
4. Review international experience. The government should be aware of similar reforms that have
taken place in other countries. This should focus on the reasons that motivated the changes that
were made.
5. Select the design paradigm that best fits the government's objectives, and explain the rationale
for that selection. Finally, the government should select the reform option that is most consistent
with the government’s other goals and objectives after taking into account financial, political,
administrative, social and cultural issues.
In preparation of this report, we participated in policy dialogues with government officials from The Vice
President’s Office, Ministry of Finance (the Minister, Bapepam-LK, DG Budget and Treasury), State
Minister for State Apparatus and Bureaucracy Reform (Kemenpan), Civil Service Agency (Badan
Kepegawaian Negara, BKN), and State Administrative Institution (Lembaga Administrasi Negara,
LAN).
The balance of this paper will explain the current systems, identify the inconsistencies with the
government’s other reforms, describe the cause of these problems and their effects on program operation,
suggest alternatives and recommend the best alternative in light of our understanding of the government’s
goals and objectives.
2. Background
Indonesia's civil service pension program (CSP) and endowment savings program (Tabungan Hari Tua,
THT) are stand-alone retirement programs, providing benefits solely to civil servants and distinct from
retirement income programs covering other segments of the labor force. The CSP and THT programs are

EXECUTIVE SUMMARY
6 Civil Service Pension Programs for a New Era
sponsored by the government of Indonesia and administered by PT Taspen, a State-owned enterprise
dedicated to this sole purpose.
The mandatory retirement age for both programs is 56 for about 60% of the civil servants or 60 for most
others but can be extended to 65 or 67 for certain categories, including government officials (pejabat);
there is no mandatory retirement age for the President and Vice–President.
The CSP program was established by Law No. 11/1969 as subsequently amended by other laws and
complemented by various Regulations and Decrees. Most prominent among these is Government
Regulation No. 25/1981. The current civil service pension program provides civil servants with old-age,
disability and survivor benefits. It provides lifetime annuities at retirement age equal to 2.5% of final
base pay for each year of service to a maximum of 75%.
The civil service pension program is financed on a pay-as-you-go (PAYG) basis and all contributions are
paid by the government. PAYG means the government’s contribution each year is equal to the benefits
paid to beneficiaries in that year plus administrative expenses.
The THT program is separate and distinct from the pension program; however, it involves the same
participants and competes with it for fiscal space. The program provides an endowment benefit at
retirement and both pre- and post-retirement death benefits. Retirement ages are the same as for the civil
service pension program.
Endowment benefits are payable as a lump sum at retirement age. The benefit consists of two
components – one for contributions prior to 1 Jan 2001 and one for service thereafter.
Endowment benefit for service prior to 1 January 2001 is equal to 60% of monthly basic pay from
the 1997 Presidential matrix for the participant’s grade at retirement for each year of
contributions prior to that date
Endowment benefit for service after 1 January 2001 is equal to 60% of monthly basic pay at
retirement for each year of contributions after that date.
Pre-retirement life insurance benefits consist of two components. The first is the projected endowment
benefit the participant would have received at retirement age, but based on pay at date of death rather than
pay at date of retirement. In addition, a further multiple of base pay at date of death is payable. The lump
sum is 2 months of pay for the death of the member, 1.5 months of pay for the death of the spouse and
0.75 months of pay for the death of a child. The post-retirement life insurance benefit is a multiple of
final pay at the time of retirement. The multiple is based on the number of years from retirement to death
and increases with duration.
The THT program is supposed to be fully funded by employee contributions of 3.25% of base pay.
However, these contributions have proved to be inadequate and the government of Indonesia has been
making special additional contributions to amortize deficits under the program.
Accounting and reporting of the programs is on a cash basis that reflects the contributions, not the value
of benefit accruals. No accrued liability is included in the Audited Financial Statements; in some years a
Note referring to the unfunded liabilities has been added but the accuracy of the estimate is questionable.

EXECUTIVE SUMMARY
Civil Service Pension Programs for a New Era 7
-
100.000
200.000
300.000
400.000
500.000
600.000
700.000
800.000
900.000
1,000.000
0-19 20-24 25-29 30-34 35-39 40-44 45-49 50-54 55-59 60-64 65-69 70-74 75-79
Graph 1. Active Contributors by Age and Sex
Female
Male
-
50,000
100,000
150,000
200,000
250,000
300,000
N
u
m
b
e
r
Age
Graph 2. Beneficiaries by Age and Sex
Male
Female
3. Analysis of the Current Program Issues
3.1 Participant Data as of December 2010
Current data for active civil servants and beneficiaries covered under the CSP program were provided by
Taspen in June 2011. The data shows there were 4,483,700 active civil servants and 1,860,713
beneficiaries.
Graph 1 shows the current active distribution peaks for the 45-49 age group due to past hiring patterns,
and over 1 million civil servants are age 50 or above, most of whom are already eligible for immediate
retirement without actuarial reduction. Graph 2 shows the current beneficiaries. This distribution peaks
for the 60-64 age group, but there are a significant number of beneficiaries who are 80 or older. Graph 2
also shows that female beneficiaries live longer than male beneficiaries. About 59% of beneficiaries are
old age or disability pensioners, and approximately 35% of beneficiaries are spouses of deceased workers.
The remaining beneficiaries include children and parents.
Source: Taspen data as of December 2010
Graph 3 shows the change in the program’s
dependency ratio. The dependency ratio – the ratio
of the number of beneficiaries to the number of
active contributors – is about 42% today. Under
current conditions this ratio will increase rapidly
because of the temporary surge in retirement over
the next 20 years, and less rapidly but continuously
thereafter; it is expected to exceed 100% eventually
if no change is made in the eligibility conditions for
retirement.
Source: Author’s calculations
3.2 Assumptions
The Government of Indonesia (“the government”) is currently reviewing and analyzing the design and
financing of its CSP and THT programs. But to make informed decisions, the government needs better
knowledge of the factors driving pension and THT costs and the financial impact of changes in the
program designs. In addition, upcoming changes in accounting rules will require the government to more
0.0%
20.0%
40.0%
60.0%
80.0%
100.0%
120.0%
0
1,000,000
2,000,000
3,000,000
4,000,000
5,000,000
6,000,000
2010 2020 2030 2040 2050 2060 2070 2085
R
a
t
i
o
N
u
m
b
e
r
Year
Graph 3. Actives, Beneficiaries and Dependency Ratio
Active
Beneficiaries
Dependency Ratio

EXECUTIVE SUMMARY
8 Civil Service Pension Programs for a New Era
accurately measure and disclose the accounting expense and liabilities of its pension and THT programs.
That will make it easier to allocate total program expenses among ministries and between national and
sub-national governments. At a minimum this will also likely require the unfunded liability of the two
programs to be disclosed in a footnote to the financial statements.
In order to calculate the cost of the current programs, we made a variety of assumptions as shown in
Table 1.
Mortality rates are based on 85% of UN Mortality Projections. Taspen data could not be used to calculate
mortality rate as the data produced unrealistic results. For our analysis we used 85% of UN mortality
projections since civil servants are in better health than the population as a whole. Detailed male life
expectances based on these projected mortality rates are shown in Table 2 below. Life expectancies
increase over time due to expected continued declines in mortality rates.
Another important factor is the expected growth rate in the number of civil servants. The government has
imposed a hiring freeze that will remain in place until the end of 2012. Thereafter, the number of civil
servants is expected to grow more slowly than total population growth. We assumed only half of the civil
servants who retire between 2010 and 2015 will be replaced. We then assumed the number of civil
servants would increase by 0.25% of the 2015 number per year until 2050, and once the population
stopped growing, we assumed the number of civil servants would stop growing as well.
A more detailed description of the data and the rationale for the selection of each of the above
assumptions can be found in the full report. The data and assumptions are used to project the costs,
benefits and liabilities resulting from the current arrangements and various reform options.
3.3 Current Pension Program Issues
Despite expected increases in expenditures over the next 20 years, the civil service pension program
appears to be fiscally sustainable and the cost, even at the higher level anticipated in the near future, is

EXECUTIVE SUMMARY
Civil Service Pension Programs for a New Era 9
0.0%
5.0%
10.0%
15.0%
20.0%
25.0%
30.0%
35.0%
40.0%
45.0%
50.0%
2010 2020 2030 2040 2050 2060 2070 2085
Graph 7. Accrued Liability as a % of GDP
Beneficiaries
Actives
0
20.0%
40.0%
60.0%
80.0%
100.0%
120.0%
2010 2020 2030 2040 2050 2060 2070 2080
Graph 6. Expenditures as % of Covered Payroll
0
.2%
.4%
.6%
.8%
1.0%
1.2%
2010 2020 2030 2040 2050 2060 2070 2080
Graph 4. Total Expenditures As % of GDP
0
1.0%
2.0%
3.0%
4.0%
5.0%
6.0%
2010 2020 2030 2040 2050 2060 2070 2080
Graph 5. Total Expenditures As % of Government
Budget
well below what comparable countries spend on civil service pensions. Graphs 4 to 7 summarize the
results of our analysis of the current civil service pension program.
Graph 4 shows current program costs as a percent of GDP rise from 0.7% of GDP to 1.1% due to the
temporary surge in retirements mentioned above, but then decline and stabilize at 0.9%.
Graph 5 shows a similar curve for results as a percent of government expenditures. We assumed
government expenditures remain at the current level of about 20% of GDP for the entire projection
period. International experience for developing countries suggests that, if anything, government
expenditures are more likely to increase than decrease as a percent of GDP so expenditures as a
percent of the government budget may be even lower than illustrated.
Source: Author’s calculations
Graph 6 shows the expenditures as a percent of covered payroll (base pay in this case). This graph
tells a very different story. Costs increases sharply over the next 20 years and then continue to go up
as a percent of covered payroll, primarily because the number of beneficiaries is increasing faster than
the number of active contributors.
Graph 7 shows the accrued liability of the civil service pension program is about 44% of GDP today
and declines steadily over time due to rapid GDP growth relative to wage increases. The size of the
accrued liability should not be of concern since it declines over time and the annual costs of the
program appear to be affordable and sustainable.
Source: Author’s calculations
Despite the favorable financial outlook, reform is necessary because there are major design and equity
issues surrounding the current pension program.
EXECUTIVE SUMMARY
10 Civil Service Pension Programs for a New Era
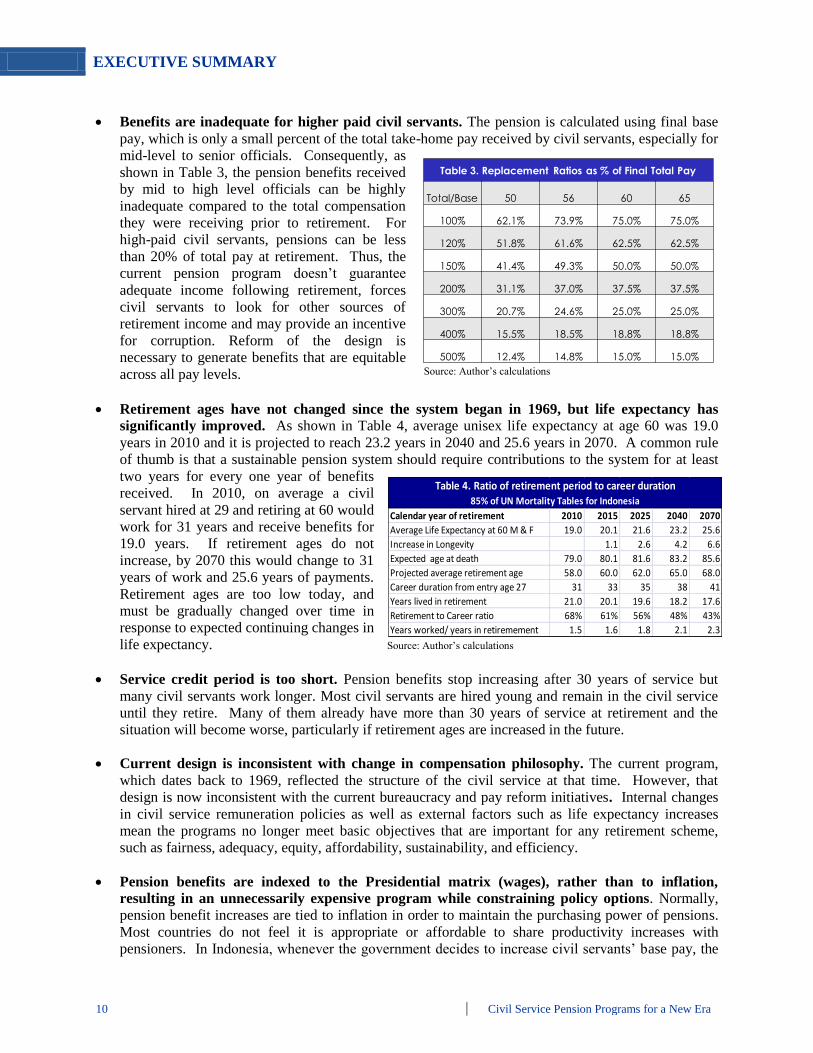
Benefits are inadequate for higher paid civil servants. The pension is calculated using final base
pay, which is only a small percent of the total take-home pay received by civil servants, especially for
mid-level to senior officials. Consequently, as
shown in Table 3, the pension benefits received
by mid to high level officials can be highly
inadequate compared to the total compensation
they were receiving prior to retirement. For
high-paid civil servants, pensions can be less
than 20% of total pay at retirement. Thus, the
current pension program doesn’t guarantee
adequate income following retirement, forces
civil servants to look for other sources of
retirement income and may provide an incentive
for corruption. Reform of the design is
necessary to generate benefits that are equitable
across all pay levels.
Retirement ages have not changed since the system began in 1969, but life expectancy has
significantly improved. As shown in Table 4, average unisex life expectancy at age 60 was 19.0
years in 2010 and it is projected to reach 23.2 years in 2040 and 25.6 years in 2070. A common rule
of thumb is that a sustainable pension system should require contributions to the system for at least
two years for every one year of benefits
received. In 2010, on average a civil
servant hired at 29 and retiring at 60 would
work for 31 years and receive benefits for
19.0 years. If retirement ages do not
increase, by 2070 this would change to 31
years of work and 25.6 years of payments.
Retirement ages are too low today, and
must be gradually changed over time in
response to expected continuing changes in
life expectancy.
Service credit period is too short. Pension benefits stop increasing after 30 years of service but
many civil servants work longer. Most civil servants are hired young and remain in the civil service
until they retire. Many of them already have more than 30 years of service at retirement and the
situation will become worse, particularly if retirement ages are increased in the future.
Current design is inconsistent with change in compensation philosophy. The current program,
which dates back to 1969, reflected the structure of the civil service at that time. However, that
design is now inconsistent with the current bureaucracy and pay reform initiatives. Internal changes
in civil service remuneration policies as well as external factors such as life expectancy increases
mean the programs no longer meet basic objectives that are important for any retirement scheme,
such as fairness, adequacy, equity, affordability, sustainability, and efficiency.
Pension benefits are indexed to the Presidential matrix (wages), rather than to inflation,
resulting in an unnecessarily expensive program while constraining policy options. Normally,
pension benefit increases are tied to inflation in order to maintain the purchasing power of pensions.
Most countries do not feel it is appropriate or affordable to share productivity increases with
pensioners. In Indonesia, whenever the government decides to increase civil servants’ base pay, the
Source: Author’s calculations
Source: Author’s calculations
Table 3. Replacement Ratios as % of Final Total Pay
Total/Base 50 56 60 65
100% 62.1% 73.9% 75.0% 75.0%
120% 51.8% 61.6% 62.5% 62.5%
150% 41.4% 49.3% 50.0% 50.0%
200% 31.1% 37.0% 37.5% 37.5%
300% 20.7% 24.6% 25.0% 25.0%
400% 15.5% 18.5% 18.8% 18.8%
500% 12.4% 14.8% 15.0% 15.0%
Calendar year of retirement 2010 2015 2025 2040 2070
Average Life Expectancy at 60 M & F 19.0 20.1 21.6 23.2 25.6
Increase in Longevity 1.1 2.6 4.2 6.6
Expected age at death 79.0 80.1 81.6 83.2 85.6
Projected average retirement age 58.0 60.0 62.0 65.0 68.0
Career duration from entry age 27 31 33 35 38 41
Years lived in retirement 21.0 20.1 19.6 18.2 17.6
Retirement to Career ratio 68% 61% 56% 48% 43%
Years worked/ years in retiremement 1.5 1.6 1.8 2.1 2.3
Table 4. Ratio of retirement period to career duration85% of UN Mortality Tables for Indonesia

EXECUTIVE SUMMARY
Civil Service Pension Programs for a New Era 11
same increase is automatically applied to pension benefits. This is expensive and unnecessarily
constrains the government’s policy options. Pay and pension increase decisions should be decoupled.
Final base pay is used to calculate benefits under the current programs rather than average pay
for some or all years of a worker's career. There are two main concerns with using final base pay
for benefit calculations. Base pay increases can be granted when civil servants are about to retire
resulting in pension benefits based on an artificially increased salary. Prior to the implementation of
bureaucracy reform, the pay system was primarily based on seniority. Consequently, base pay
normally increased every year and final base pay would be the highest pay in a worker's career.
However, under bureaucracy reform, which provides civil servants in reforming institutions with
significant new allowances based on job evaluation, pay may vary from year to year, and pay in the
last year may not be representative of pay during a worker's career. Therefore, final base pay is not a
fair basis for the calculation of benefits.
Current reporting procedures don’t give an accurate and transparent view of the financial
status of the CSP program and doesn’t allow for cost allocation to sub-national governments.
Cash accounting is currently used for pension expense in the government’s financial statements.
While PAYG funding is acceptable, PAYG accounting is not consistent with basic accounting
principles and does not allow accounting costs to be easily and equitably allocated to sub-national
units. The Government should properly disclose the program’s unfunded liability, pension expense
should equal the cost of benefits accruing each year for active workers (normal cost) and interest
should be paid on the unfunded liability. Furthermore, since most civil servants are employed by sub-
national governments it is important for accounting costs to be directly allocated in the same manner
as pay. A change to accrual accounting would allow easy cost allocation.
The legal framework of the current program consists of Law 11 of 1969 and a complex
collection of amendments, regulations, decrees and ministerial decisions. After 43 years, Law No.
11/1969 needs to be replaced rather than further amended, to improve clarity and consolidate all
stipulations into a single Law and a consistent set of implementing regulations.
The purpose of employee contributions is unclear. In the past, employee contributions were used
to meet a portion of the cost of the civil service pension program. However, today the government
budget pays the entire cost, but employee contributions continue to be required and the employee
contribution account continues to grow in size with no clear objective.
3.4 Current THT Program Issues
Unlike the civil service pension program, the current THT program is not financially sustainable and will
create an ever increasing burden for the State budget. There are also questions about the design and
purpose of this program.
It appears the primary purpose of this program is to provide participants with a lump sum at retirement
age and to provide death benefits in addition to those already provided by the civil service pension
program. THT retirement benefits are paid as a lump sum and offer liquidity and additional flexibility to
retirees at a time when it can be needed to adjust their income stream to new circumstances. However,
retirees may spend lump sum payments too fast and end up requiring financial assistance when they are
older.

EXECUTIVE SUMMARY
12 Civil Service Pension Programs for a New Era
The government also needs to focus attention on the financial condition of the THT program. Graph 8
shows the current THT Accrued Liability, on both a liquidation basis (ABO) and on an ongoing plan
basis (PBO), separately for the following categories of benefits:
Endowment liability for active participants
Pre-retirement death benefit liability for active
participants
Post-retirement death benefit liability for active
participants
Post-retirement death benefit liability for those old-
age and disability pensioners who are receiving
benefits under the civil service retirement program
Post-retirement death benefit liability for eligible
spouse pensioners who are receiving benefits under
the civil service retirement program.
The ABO, or liability on a liquidation basis, is the liabilities of the THT program assuming it was
terminated today. Benefits would be based on pay and years of contributions as of the date the program is
terminated. The PBO liability assumes the THT program will be continued indefinitely. Benefits are
based on expected pay at retirement date and years of contributions as of the date the liability is
measured. Because the PBO takes into account future increases in pay, the liability is considerably larger.
This is the standard method of measuring liabilities for an ongoing plan.
As can be seen on Graph 8, the total liability on an ABO basis is approximately 65 trillion rupiah and on a
PBO basis, approximately 110 trillion rupiah. The liability for endowment benefits accounts for almost
55% of total liability. The post-retirement death benefits for both active workers and old-age pensioners
combined is approximately 45% of total THT liability.
These liabilities are backed by only 34 trillion rupiah of current assets. This means if the THT program
was terminated today, the government would need to contribute more than 30 trillion rupiah to the
program to fund benefits earned through the date of termination. On an ongoing plan basis, the unfunded
liability is approximately 75 trillion rupiah.
These liabilities are considerably higher than reported by Taspen in its most recently valuation of the THT
program. In our opinion, many of the assumptions used by Taspen’s actuary to calculate plan liabilities
are inconsistent with recent experience and the current macroeconomic environment. In addition, the
post-retirement death benefit liability for current and future retirees is significant and much higher than
has been previously reported. Therefore, the program liabilities reported by Taspen are significantly
understated on both a liquidation and ongoing plan basis.
These liabilities would be even higher if the government had not frozen benefits earned for service prior
to January 1, 2001. This benefit freeze based benefits for service before that date on the 1997 Presidential
matrix rather than the matrix at retirement date. For someone retiring in 2012 with 30 years of
contributions, the benefit for the first 19 years of his or her career would be based on the 1997 matrix and
only the benefit for the last 11 years would be based on final pay at retirement, resulting in a significant
reduction in plan benefits. The THT Accrued Liabilities without the 2001 benefit freeze are
approximately 54% higher than the liability with the 2001 benefit freeze.
20,000,000
40,000,000
60,000,000
80,000,000
100,000,000
120,000,000
140,000,000
160,000,000
180,000,000
ABO with
freeze
PBO with
freeze
ABO no
freeze
PBO no
freeze
Graph 8. THT Accrued Liability Comparison
Post-retirement death spouse
pensioners
Post-retirement death old-age
pensioners
Pre-retirement death actives,
spouses and children
Post-retirement death actives
Endowment liability actives
Source: Author’s calculations

EXECUTIVE SUMMARY
Civil Service Pension Programs for a New Era 13
0.0%
0.5%
1.0%
1.5%
2.0%
2.5%
2010 2015 2020 2030 2040
Graph 9. THT Accrued Liability as % of GDPGraph 9 shows a projection of THT liabilities as a
percent of GDP through 2040 under the current
design. THT liabilities will increase rapidly in the
future. The current THT program will never be
financially stable as currently designed and is not
sustainable without significant and increasing annual
government special contributions.
The THT program appears to be a defined
contribution program because a 3.25% employee
contribution rate is stipulated. However, it is in
reality a defined benefit scheme because benefits at
retirement are based on a formula and not on the
accumulated employee contributions.
The problem is the THT contribution rate is not based on actuarial calculations of the required funding
rate. The required contribution rate to fully fund the program is more than double the current 3.25% rate.
The THT program has been underfunded for many years and the current structure assures that the
unfunded liability will continue to increase each year. The size of the unfunded liability is expected to
continue increasing as a percent of GDP for the next 5-10 years before starting to decline. The improper
funding has already necessitated a benefit freeze in 2001 and significant government special contributions
to the program, which are expected to continue and increase.
If the GOI chooses to base THT benefits on total pay it would likely triple program liabilities. This could
be offset, however, by reducing the 0.60 actuarial factor and reducing the multiplier for the death benefit
in order to keep program costs the same as under the current THT program.
4. Reforming the CSP and THT Programs
4.1 Changing political and economic environment
The current CSP and THT programs would benefit from a major overhaul to adapt to current and
expected future economic and demographic conditions, ongoing bureaucracy and pay reforms in the civil
service and the increasing importance of sub-national government.
The Indonesian political and economic environment has changed dramatically since 1969. The
Indonesian economy has grown rapidly and Indonesia is now a lower-middle income country with a
rapidly growing middle class. Indonesia has also become vastly more democratic since the end of the
Suharto era and it has given much greater power and financial resources to regions under its
decentralization law. As a result, the types of services citizens expect from the government have
changed. This requires a better educated and more professional civil service work force.
Furthermore, the Government has adopted four key criteria -- professionalism, effectiveness,
integrity, and service quality – to improve the public service. These four criteria resemble a private
sector model that aligns pay with performance and puts less emphasis on seniority. By adopting a private
sector human resource model, the future civil service focuses more on people with the right qualifications,
expertise and experience rather than basing promotions primarily on seniority. To attract professionals
and experts qualified to work in the public sector, it is necessary to align benefits with other human
resource objectives.
Source: Author’s calculations

EXECUTIVE SUMMARY
14 Civil Service Pension Programs for a New Era
CSP and THT reform is necessary to support the strategic orientation of Indonesia’s bureaucracy
and pay reforms and assure consistency with the overall HR strategy for civil servants. When
defining reform options, the Government must take into account political economy, technical,
administrative, legacy and transition issues and the following reform goals:
Design goals
Support bureaucracy and pay reforms
Help attract and retain highly-qualified and productive workers
Support HR policy by linking benefits to total career average pay
Provide adequate and equitable benefits to all civil servants at all pay levels
Provide balance between monthly income and liquidity
Accrue benefits over workers’ entire career
Increase retirement ages and link future retirement age adjustments to life expectancy changes to
maximize workforce productivity
Financial goals
Keep costs within the fiscal envelope for civil servant total compensation
Assure fiscal sustainability in the short and long-term
Fairly allocate risks between civil servants and the government
Assure equity among generations of civil servants and taxpayers
Tie funding policy to macroeconomic goals
Implement international accounting standards and properly allocate accounting expense among
ministries and to the sub-national level
Efficient and accurate program administration.
4.2 Design Features Meeting Reform Goals
To meet the reform goals outlined in the previous section, it is necessary to take a look at the main cost
drivers and how they will impact the financial cost of the program. As a first step, we look at several
different possible scenarios for improving benefits and equity
within the current cost corridor by examining alternative ways of
changing key cost drivers.
Use total pay to calculate benefits. One of the goals of the
proposed reform is to provide fair benefits to all civil servants.
This would require benefits to be based on total compensation
rather than base pay. In 2007, on average, base pay was only
46% of total pay and it is likely the ratio has decreased due to
the introduction of pay for performance. Unfortunately,
government budget processes make it difficult to determine the
ratio of base to total pay for workers. In the absence of GOI
information on total pay we constructed a model (Table 5) to estimate the relationship between base
and total pay. We postulated that the ratio of total pay to base pay for the entire civil service is 250%
Source: Author’s calculations
Table 5. Total Pay Assumptions
Age
Total to Base Age
Total to Base
18 1.50000 50 2.72131
25 1.56767 55 3.03867
30 1.75048 60 3.39304
35 1.95463 65 3.54610
40 2.18257 70 3.54610
45 2.43710

EXECUTIVE SUMMARY
Civil Service Pension Programs for a New Era 15
(i.e., base pay is 40% of total pay) and that the ratio of total to base pay increases with age. Since
benefits today under the civil service pension program are based on final pay, this is an important cost
driver. Changing the formula from base to total pay without other offsetting changes would likely
triple costs, so other changes must be made.
Take into account average pay in all years of service. Final monthly pay may not reflect periods of
higher compensation earlier in a worker’s career and can be manipulated too easily. Career average
pay is the best option since it reflects average pay over an entire career. Of course, pay at young ages
can be quite low relative to pay at retirement due to the cumulative impact of many years of inflation,
merit increases and promotions. Consequently, international best practice is to index pay in prior
years by the increase in national average wages and/or inflation from the time the salary was earned
to the time of retirement. There are many different methods of indexing in use, but all of them
embody this same principle. These indexed earnings are then used to calculate average pay for
benefit calculation purposes
Increase retirement ages over time to reflect increasing life
expectancy. Current retirement ages are too low, compared to
current life expectancy and retirement at the specified age is
mandatory. To create a more flexible system, a first change
would be to replace the concept of Mandatory Retirement Age by
the concept of Normal Retirement Age (NRA), which is a more
common practice. This allows more flexibility in the management
of human resources. A civil servant would have the choice to
retire at the NRA with full benefits, or alternatively, retire earlier
with reduced benefits or later with increased benefits. However,
retirement age is a policy issue that reaches beyond CSP because
of its impact on labor policy, portability between sectors and
productivity of the economy.
Based on recent data, the average retirement age is 57.3 for males and 58.2 for females or 57.8
overall. Table 2 shows the increase in male life expectancy that is expected to occur over the next 75
years. As can be seen, life expectancy will increase by about 7 years at current retirement ages.
Today a male worker hired at age 27 and retiring at 56 would work for 29 years and receive benefits
for 20.9 years. By 2040, this same worker would receive benefits for 25.1 years. This means the
ratio of years of contributions to years receiving benefits is as low as 1.39 today and will decrease to
1.15 by 2040.
To maintain a financially sustainable program, a ratio of 2.00 or over is generally needed.
Consequently, it is necessary to raise retirement ages now and then to further adjust them as life
expectancy increases. The GOI needs to keep workers who are highly productive in the workforce.
They improve the overall productivity of the civil service work force through their own efforts and
through the positive impact they have on the productivity of others. Retirement ages should be set so
workers are retired only when their presence in the labor force reduces overall productivity.
Raising retirement ages is also an excellent way to improve benefits. Longer career durations
increase pension accruals and allow resources to be concentrated in a shorter survival period. Even a
small increase in retirement age can have a big impact on the affordable level of benefits. Table 6
shows one possible scenario for increasing retirement ages and we have used these ages in our reform
projections as they are consistent with our mortality assumptions.
Source: Author’s calculations
Table 6. Retirement Age Increase
Earliest ageAverage
age
2010-2020 50 57
2021-2030 56 62
2031-2050 60 65
2051-2085 65 68
EXECUTIVE SUMMARY
16 Civil Service Pension Programs for a New Era
Index pensions to inflation rather than wages. Indexing to wages is unaffordable, especially when
the number of beneficiaries is growing relative to number of active civil servants. Most employers
also feel their obligation is to protect the purchasing power of workers after they retire, and not
necessarily to share future productivity gains with pensioners. Therefore, the most common practice
worldwide is to index pensions to inflation. This increases the government’s flexibility in setting
annual wage increases as those increases will no longer automatically affect pension benefits. It also
produces very substantial fiscal space that can be used to finance other benefit improvements, such as
basing benefits on total pay
Adjust maximum period of service for calculating pension benefits. Most civil servants would
welcome the opportunity to work longer. They often have insufficient resources for their entire
period of retirement if they retire at 56 or 60 and have trouble finding private sector jobs after
working in the public sector for their entire career. Many workers already have careers that are
longer than 30 years and this will be even more common if retirement ages are increased. Any new
formula should give service credit for more than 30 years; 35 to 40 years would be more appropriate.
4.3 Civil Service Pension Reform Options
If the government wishes to improve benefits while keeping the cost of the program unchanged, any
viable solution will involve increasing retirement ages and changing to inflation indexing. These two
changes create the fiscal room needed for benefit improvements. Once these two changes are made, there
are many options available to the GOI for changing the pension program’s design and financing.
4.3.1 Impact of Increase in Retirement Age and Change to Inflation Indexing
Increasing the retirement age and changing the method of indexing benefits does not change expected
replacement ratios since the benefit formula is still the same (based on final base pay) and length of
credited service at retirement age is also unchanged since years of credited service is limited to 30.
Nonetheless, a retirement age increase is still necessary for policy and financial reasons:
Maximize expected workforce productivity
Reflect increased life expectancy
Maintain balance between length of working career and number of years receiving pension
Reduce pension cost due to shorter payment period as a result of longer years of service
Control dependency ratio.
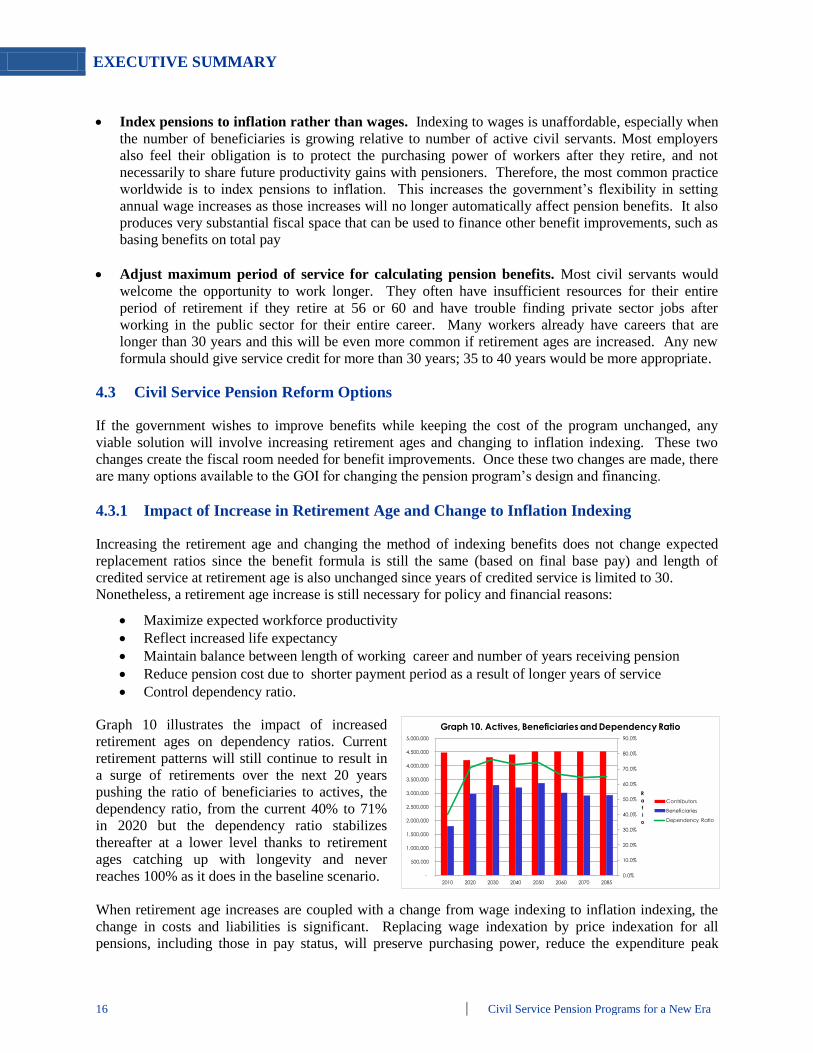
Graph 10 illustrates the impact of increased
retirement ages on dependency ratios. Current
retirement patterns will still continue to result in
a surge of retirements over the next 20 years
pushing the ratio of beneficiaries to actives, the
dependency ratio, from the current 40% to 71%
in 2020 but the dependency ratio stabilizes
thereafter at a lower level thanks to retirement
ages catching up with longevity and never
reaches 100% as it does in the baseline scenario.
When retirement age increases are coupled with a change from wage indexing to inflation indexing, the
change in costs and liabilities is significant. Replacing wage indexation by price indexation for all
pensions, including those in pay status, will preserve purchasing power, reduce the expenditure peak
0.0%
10.0%
20.0%
30.0%
40.0%
50.0%
60.0%
70.0%
80.0%
90.0%
-
500,000
1,000,000
1,500,000
2,000,000
2,500,000
3,000,000
3,500,000
4,000,000
4,500,000
5,000,000
2010 2020 2030 2040 2050 2060 2070 2085
R
a
t
i
o
Graph 10. Actives, Beneficiaries and Dependency Ratio
Contributors
Beneficiaries
Dependency Ratio

EXECUTIVE SUMMARY
Civil Service Pension Programs for a New Era 17
0.0%
0.2%
0.4%
0.6%
0.8%
1.0%
1.2%
2010 2020 2030 2040 2050 2060 2070 2080
Graph 11. Expenditures as % of GDP
Existing Program
Increase RA, CPI
0.0%
5.0%
10.0%
15.0%
20.0%
25.0%
30.0%
35.0%
40.0%
45.0%
2010 2020 2030 2040 2050 2060 2070 2080
Graph 12. Accrued Liability as % of GDP
Existing Program
Increase RA, CPI
caused by the upcoming surge in retirements and reduce pension cost without decreasing amounts payable
at retirement.
Source: Author’s calculations
As shown in Graph 11 and Graph 12, increasing the retirement age and changing to inflation indexing
significantly decreases the cost and liabilities of the program, because benefits begin at a later age and
benefit increases following retirement are smaller. Some or all of these savings can be used to finance
benefit improvements. In this way, it is possible to provide better benefits to civil servants without
increasing the government’s liabilities and cost, while at the same time maintaining the fiscal
sustainability of the CSP programs.
4.3.2 Design Options
The existing program does not provide adequate levels of income for high echelons, so modifications to
the current design for existing civil servants are necessary. There have been several proposals for dealing
with the reform alternatives and funding mechanism of the CSP program over the past year.
Pension benefit formulas meeting the GOI’s strategic objectives can be designed in several possible ways
– as defined benefit (DB), defined contribution (DC), notional defined contribution (NDC) or a
combination of these approaches. Many in the government are predisposed toward changing to a fully
funded defined contribution pension system for some or all civil servants. We believe the GOI should
more carefully examine a wider range of possible solutions before making a final decision. The current
economic environment is not conducive to fully funded programs as they actually increase costs when
GDP and labor productivity are growing rapidly and interest rates are low. Defined contribution
programs also introduce new risks for both employers and employees that must be properly understood
and managed.
This report examines the following reform options:
Option 1: Defined benefit (DB) for all. Indexed career average defined benefit pension for
everyone, with increasing retirement ages and inflation indexing
Option 2: Defined contribution (DC) for all. Current program until the change date and
defined contribution after the change date, with retirement ages and indexing method left
unchanged. This option was requested by the Government of Indonesia. However, without an
increase in retirement ages and a change to inflation indexing, we do not consider this a viable
option.
Source: Author’s calculations

EXECUTIVE SUMMARY
18 Civil Service Pension Programs for a New Era
Option 3: Notional defined contribution (NDC) for all. Current program until the change date
and notional defined contribution after the change date, with retirement ages and indexing method
left unchanged. This option was requested by the Government of Indonesia. However, without
an increase in retirement ages and a change to inflation indexing, we do not consider this a viable
option
Option 4: Defined benefit (DB) for existing civil servants and defined contribution (DC) for
new civil servants. Indexed career average plan for current civil servants and defined
contribution program for new civil servants, with increasing retirement ages and inflation
indexing. This option was requested by the Government of Indonesia. We are not in favor of
options that give differing benefits to those performing similar jobs based solely on date of hire.
Option 5: Defined benefit (DB) and defined contribution (DC) for all. Combination of
indexed career average plan and defined contribution plan for everyone, with increasing
retirement ages and inflation indexing.
Option 6: Defined benefit (DB) and notional defined contribution (NDC) for all.
Combination of indexed career average plan and notional defined contribution plan for everyone,
with increasing retirement ages and inflation indexing.
4.3.2.1 Reform Option 1: DB for All
Under reform option 1 the following plan will apply for all civil servants:
Defined Benefit plan based on total indexed career average pay (ICA)
Accrual rate of 2% per year of service for a maximum of 40 years
Benefits are indexed to inflation following retirement.
Table 7 shows this benefit design will
result in higher replacement ratios as a
percent of final total pay compared to
benefits under the current program.
Under reform option 1, cash outlays for the
government consists of the cost of benefit
payments under the DB program for all
participants. Financing remains on a pay-
as-you-go basis. Despite the improved
benefits, the cost and liabilities are about
the same as the current program due to
higher retirement ages and inflation
indexing as illustrated in Graphs 13 and 14.
Table 7. Replacement Ratio Comparison
2011 2025 2040 2070
Retirement age 57 62 65 68
Final Base Pay, 2.5% accrual rate, 30 years maximum service
Final base pay 3,102,302 5,969,427 10,390,514 28,550,333
Length of service 30 35 38 41
Accrual rate 2.5% 2.5% 2.5% 2.5%
Benefit 2,326,727 4,477,070 7,792,885 21,412,750
RR as % of final base pay 75.0% 75.0% 75.0% 75.0%
RR as % of final total pay 25.1% 22.5% 22.0% 22.0%
Indexed career average pay, 2% accrual rate, 40 years maximum service
Final total pay 5,621,864 12,131,439 20,851,109 58,363,238
Length of service 30 35 38 41
Accrual rate 2.00% 2.00% 2.00% 2.00%
Benefit 3,373,119 8,492,007 15,846,843 46,690,590
RR as % of final base pay 108.7% 142.3% 152.5% 163.5%
RR as % of final total pay 36.4% 42.7% 44.8% 48.0%

EXECUTIVE SUMMARY
Civil Service Pension Programs for a New Era 19
0.0%
0.2%
0.4%
0.6%
0.8%
1.0%
1.2%
2010 2020 2030 2040 2050 2060 2070 2080
Graph 13. Expenditures as % of GDP
Existing Program
ICA, 2%
0.0%
5.0%
10.0%
15.0%
20.0%
25.0%
30.0%
35.0%
40.0%
45.0%
2010 2020 2030 2040 2050 2060 2070 2080
Graph 14. Accrued Liability as % of GDP
Existing Program
ICA, 2%
4.3.2.2 Reform Option 2: 20% of total pay DC for All
As requested by the GOI, under reform option 2, the following rules will apply for all civil servants:
Current program until the change date
20% of total pay defined contribution plan after the change date, with retirement ages and wage
indexing left unchanged.
Table 8a shows that this benefit design will
result in lower replacement ratios as a percent
of final total pay than reform option 1. This is
due to investment expenses, the high cost of
converting to an annuity and the small spread
between interest rates and wage increase rates.
In fact, a contribution rate of 35% is needed to
provide benefits that are comparable to the
current benefit formula in the long term.
This finding overturned the government’s initial expectation that the DC design for all after the change
date would provide higher benefits than the current program. This is because the economic environment is
not conducive to funding today for two reasons.
GDP growth rates exceed interest rates. Consequently, costs are lower if they are deferred to a
later time period when they are an even smaller percentage of GDP
Wage increase rates are almost equal to interest rates. Funding works best when interest rates
significantly exceed wage increases.
Under reform option 2, cash outlays for the government consist of:
Cost of benefit payments earned under the current DB program prior to the change date; plus
Cost of required contributions to the DC fund for all participants after the change date.
As shown in Graph 15, unlike reform option 1, government expenditures under reform option 2 will
require significantly higher contributions in the early years following reform. The cost of the new
program will reach its peak in 2021 before declining rapidly. After year 2051, the expenditures under this
option will become gradually lower than under reform option 1.
Source: Author’s calculations
Source: Author’s calculations
Table 8a. DB for All and 20% DC Replacement Ratio Comparison2011 2025 2040 2070
Retirement age 57 62 65 68
Indexed career average pay, 2% accrual rate, 40 years maximum serviceRR as % of final base pay 108.7% 142.3% 152.5% 163.5%RR as % of final total pay 36.4% 42.7% 44.8% 48.0%
20% DC
RR for DC as % of final base pay 0.0% 22.5% 41.4% 42.8%Total RR as % of final base pay 75.0% 62.5% 43.9% 42.8%Total RR as % of final total pay 25.1% 20.9% 14.7% 14.4%
Source: Author’s calculations

EXECUTIVE SUMMARY
20 Civil Service Pension Programs for a New Era
0.0%
5.0%
10.0%
15.0%
20.0%
25.0%
30.0%
35.0%
40.0%
45.0%
2011 2021 2031 2041 2051 2061 2071 2081
Graph 16. Reform Options vs. Existing Program: Accrued Liability as % of GDP
Option 1: Reformed DB for All (ICA, 2%)
Existing Plan
Option 2: Existing Plan until cutoff date; 20% DC for All after cutoff date
0.0%
0.2%
0.4%
0.6%
0.8%
1.0%
1.2%
1.4%
1.6%
1.8%
2011 2021 2031 2041 2051 2061 2071 2081
Graph 15. Reform Options vs. Existing Program: Expenditures as % of GDP
Option 1: Reformed DB for All (ICA, 2%)
Existing Plan
Option 2: Existing Plan until cutoff date; 20% DC for All after cutoff date
Graph 16 shows accrued liabilities under reform option 2 will remain lower than those under reform
option 1 in all years. The accrued liability goes to zero when the last current active worker has retired and
the retiree and his/her beneficiaries have died. It decreases faster than the existing program and reform
option 1 due to the significantly higher contribution requirements between now and 2051.
The benefit design under reform option 2 will
result in large asset accumulations as shown in
Graph 17. Although the defined contribution plan
creates a big fund, it does not mean it will directly
create good benefits for civil servants. The
financial security and the growth of DC plan
assets will rest heavily on the governance structure
and investment strategy implemented by the
government. The major concerns will be meeting
fiduciary obligations, fund management,
oversight, and supervision and control of the fund
managers.
Note also that the nature of defined contribution plans means that investment and longevity risks will be
fully borne by individual civil servants. Consequently, the replacement ratio percentages shown in the
lower sections of Table 8a are subject to greater uncertainty. Any adverse fluctuations will directly impact
the accumulated contributions in individual accounts. A 1% difference in annual rate of return can reduce
account balances by nearly 50% for someone who contributes for 40 years. The GOI could also remain at
risk if poor returns, mismanagement, fraud or faster longevity increases result in benefits that do not meet
expectations, as participants will expect the GOI to mitigate the difference. Sustained underperformance
could create pressure to increase the contribution rate above the initial 20%.
The replacement ratio shown in Table 8a also presumes that indexed annuities are available. However the
ability of civil servants to convert the lump sums received at retirement into any type of annuity should be
a major concern. Indonesia’s private insurance industry doesn’t currently offer viable individual annuity
products, primarily because the local capital market does not offer sufficient long-term bonds to manage
the product’s investment risk. If the conversion to an annuity is mandatory the Government could
prescribe the use of unisex rates so that there is no difference by gender. If the annuitization process
reflects longevity, annuities will be more expensive for women than men.
Many of the problems inherent in defined contribution programs can be more easily managed through a
defined benefit plan. In a defined contribution program, the government manages the assets but any losses
incurred as a result of its management are borne by the participants. If the government wishes to
0.0%
1.0%
2.0%
3.0%
4.0%
5.0%
6.0%
7.0%
8.0%
9.0%
10.0%
2011 2021 2031 2041 2051 2061 2071 2081
Graph 17. DC for All: Assets as a % of GDP
Option 2: Existing Plan until cutoff date; 20% DC for All after cutoff date
Source: Author’s calculations
Source: Author’s calculations

EXECUTIVE SUMMARY
Civil Service Pension Programs for a New Era 21
0.0%
5.0%
10.0%
15.0%
20.0%
25.0%
30.0%
35.0%
40.0%
45.0%
2011 2021 2031 2041 2051 2061 2071 2081
Graph 19. Reform Options vs. Existing Program: Accrued Liability as % of GDP
Option 1: Reformed DB for All (ICA, 2%)
Existing Plan
Option 2: Existing Plan until cutoff date; 20% DC for All after cutoff date
Option 3: Existing Plan until cutoff date; 20% NDC for All after cutoff date
Table 8b. DB for All and 20% DC /NDC Replacement Ratio Comparison2011 2025 2040 2070
Retirement age 57 62 65 68
Indexed career average pay, 2% accrual rate, 40 years maximum serviceRR as % of final base pay 108.7% 142.3% 152.5% 163.5%RR as % of final total pay 36.4% 42.7% 44.8% 48.0%
20% DC
RR for DC as % of final base pay 0.0% 22.5% 41.4% 42.8%Total RR as % of final base pay 75.0% 62.5% 43.9% 42.8%Total RR as % of final total pay 25.1% 20.9% 14.7% 14.4%
20% NDCRR for NDC as % of final base pay 0.0% 25.4% 46.8% 47.6%Total RR as % of final base pay 75.0% 65.4% 49.3% 47.6%Total RR as % of final total pay 25.1% 21.9% 16.5% 15.9%
accumulate a fund, it can do so at lower risk of conflicts of interest and moral hazard through a defined
benefit pension program. In a defined benefit plan, adverse experience will result in higher government
contributions to the pension fund which over a period of time can be offset by re-allocations within the
remuneration envelope. The government also has far better capacity than individual civil servants to
manage investment risk and the risk of life annuities as it can average fluctuations over many years and
millions of participants.
4.3.2.3 Reform Option 3: 20% NDC for All
As requested by the GOI, under reform option 3, the following rules will apply for all civil servants:
Current program until the change date
20% of total pay notional defined contribution plan after the change date, with retirement ages and
pension indexing left unchanged.
The NDC plan will operate very similarly to the defined contribution plan, except the interest credits will
be based on an investment return index and contributions will be converted into an annuity benefit by a
prescribed factor and be paid by the pension plan rather than by individuals purchasing annuities from an
insurance company. Note that the NDC plan is a defined benefit plan despite its use of defined
contribution terminology and is almost always funded on a pay-as-you-go basis.
Table 8b shows the replacement ratios for this
benefit design will result in lower replacement
ratios as a percent of final total pay in all years
compared to benefits under reform option 1 but
higher than reform option 2 because there are no
investment and annuity expenses.
Cash outlays for the government will consist of:
Cost of benefit payments earned under the
current pension program prior to the change
date; plus
Cost of benefit payments under NDC
program for all participants.
The expenditures pattern under reform option 3 is similar to the existing program and reform Option 1, as
illustrated in Graph 18 and Graph 19 below, but some of the risks are retained by the Government.
Source: Author’s calculations
Source: Author’s calculations
EXECUTIVE SUMMARY
22 Civil Service Pension Programs for a New Era
0.0%
0.2%
0.4%
0.6%
0.8%
1.0%
1.2%
1.4%
1.6%
1.8%
2011 2021 2031 2041 2051 2061 2071 2081
Graph 20. Reform Options vs. Existing Program: Expenditures as % of GDP
Option 1: Reformed DB for All (ICA, 2%)
Existing Plan
Option 4: ICA 2% for existing; 20% DC for New Workers
0.0%
5.0%
10.0%
15.0%
20.0%
25.0%
30.0%
35.0%
40.0%
45.0%
2011 2021 2031 2041 2051 2061 2071 2081
Graph 21. Reform Options vs. Existing Program: Accrued Liability as % of GDP
Option 1: Reformed DB for All (ICA, 2%)
Existing Plan
Option 4: ICA 2% for existing; 20% DC for New Workers
The trend of expenditure and liability under reform option 3 mirror the trend under reform option 1 rather
than those under reform option 2. There is no funded DC program or related asset build-up. The
expenditure under reform option 3 is lower than reform option 1 because the replacement ratios are lower,
but the shape of the expenditure curve is very similar. This is due to the nature of NDC, which does not
require actual cash contributions to a fund. Under reform option 3, benefits are financed PAYG. The
accrued liability is also nearly the same since both the ICA and NDC programs are defined benefit.
4.3.2.4 Reform Option 4: DC for New Civil Servants Only
Under reform option 4, the following rules apply:
Existing civil servants receive benefits based on ICA formula, total pay and 2% accrual rate, with
increased retirement ages and inflation indexing
All new civil servants become participants to a defined contribution program with contribution rate of
20% of total pay. Retirement ages are increased as proposed for the ICA formula, and for purposes of
comparing replacement ratios, all lump sums payable from the program are assumed to be converted
into inflation indexed life annuities.
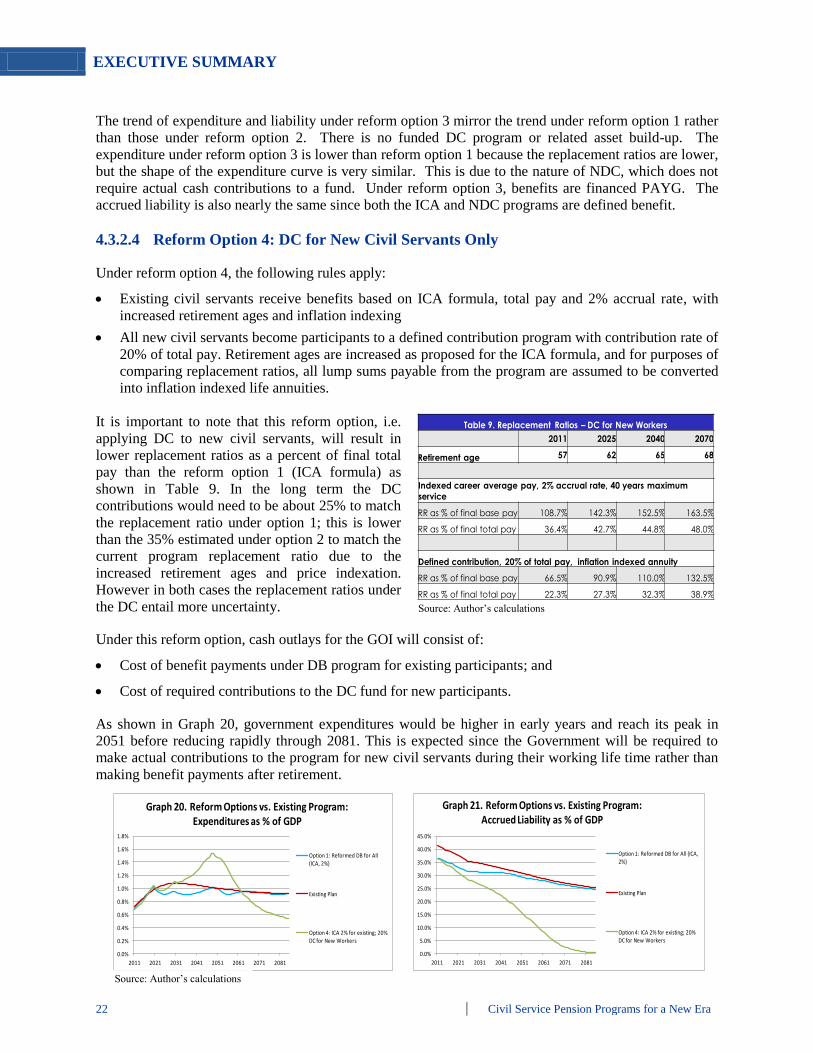
It is important to note that this reform option, i.e.
applying DC to new civil servants, will result in
lower replacement ratios as a percent of final total
pay than the reform option 1 (ICA formula) as
shown in Table 9. In the long term the DC
contributions would need to be about 25% to match
the replacement ratio under option 1; this is lower
than the 35% estimated under option 2 to match the
current program replacement ratio due to the
increased retirement ages and price indexation.
However in both cases the replacement ratios under
the DC entail more uncertainty.
Under this reform option, cash outlays for the GOI will consist of:
Cost of benefit payments under DB program for existing participants; and
Cost of required contributions to the DC fund for new participants.
As shown in Graph 20, government expenditures would be higher in early years and reach its peak in
2051 before reducing rapidly through 2081. This is expected since the Government will be required to
make actual contributions to the program for new civil servants during their working life time rather than
making benefit payments after retirement.
Source: Author’s calculations
Table 9. Replacement Ratios – DC for New Workers
2011 2025 2040 2070
Retirement age 57 62 65 68
Indexed career average pay, 2% accrual rate, 40 years maximum service
RR as % of final base pay 108.7% 142.3% 152.5% 163.5%
RR as % of final total pay 36.4% 42.7% 44.8% 48.0%
Defined contribution, 20% of total pay, inflation indexed annuity
RR as % of final base pay 66.5% 90.9% 110.0% 132.5%
RR as % of final total pay 22.3% 27.3% 32.3% 38.9%
Source: Author’s calculations

EXECUTIVE SUMMARY
Civil Service Pension Programs for a New Era 23
As illustrated in Graph 21, accrued liabilities will be equal to liabilities under reform option 1 in 2011 but
will decrease more rapidly than under reform option 1 because benefits for new entrants are full funded.
The accrued liability for existing participants goes to zero when the last active participant in the current
defined benefit plan has retired and the participant and spouse are both dead. While some may consider
the reduction of the accrued liability to be a positive, note that it is financed by higher expenditures than
under the current program through 2062.
Graph 22 shows the comparison of defined
contribution plan assets under reform option 2
and reform option 4. For the first 50 years, the
assets will be lower under reform option 4 as
the GOI will make contributions to the DC
program for new workers only. All defined
contribution plan risks discussed in reform
option 2 also apply to reform option 4.
4.3.2.5 Reform Option 5: Hybrid system, DB and DC for All
Under this benefit design, civil servants will receive lifetime annuity benefits from the pension program
based on two different benefit formulas. The following multi-pillar plan will apply for all civil servants:
DB plan based on ICA formula, total pay and 1.3% accrual rate (instead of the 2% accurate rate
under option 1), with increased retirement age and inflation indexing; plus
DC plan of 10% of total pay, with increased retirement age and inflation indexed annuities.
Table 10 shows the replacement ratio for this
benefit design will result in lower
replacement ratios as a percent of final total
pay compared to benefits under Option 1
from 2011 until 2040 but the ratios will
exceed those under Option 1 from year 2040
onward. This is due to the higher retirement
ages and longer period of contributions to the
defined contribution program in the later
years.
Under reform option 5, cash outlays for the government consist of:
Cost of benefit payments under DB program for all participants; and
Cost of required contributions to DC fund for all participants.
As shown in Graph 23, government expenditures for the first 40 years will be higher than the pure defined
benefit plan approach. Unlike reform option 1, government expenditure under reform option 5 will
require contributions to the DC plan in the early years following reform. The cost of the new program
will reach its peak in 2021 before declining gradually. After 2051, the expenditures under this option will
be slightly lower than under the ICA formula only.
0.0%
2.0%
4.0%
6.0%
8.0%
10.0%
12.0%
2011 2021 2031 2041 2051 2061 2071 2081
Graph 22. DC For NE vs. DC for All: Assets as a % of GDP
Option 2: Existing Plan until cutoff date; 20% DC for All after cutoff date
Option 4: ICA 2% for existing; 20% DC for New Workers
Source: Author’s calculations
Source: Author’s calculations
Table 10. Replacement Ratios – DB + DC for All
2011 2025 2040 2070
Retirement age 57 62 65 68
Indexed career average pay, 2% accrual rate, 40 years maximum service
RR as % of final base pay 108.7% 142.3% 152.5% 163.5%
RR as % of final total pay 36.4% 42.7% 44.8% 48.0%
1.3% DB + 10% DC for all
RR as % of final base pay 103.9% 137.9% 154.1% 172.5%
RR as % of final total pay 34.8% 41.4% 45.3% 50.7%

EXECUTIVE SUMMARY
24 Civil Service Pension Programs for a New Era
0.0%
0.2%
0.4%
0.6%
0.8%
1.0%
1.2%
1.4%
2011 2021 2031 2041 2051 2061 2071 2081
Graph 23. Reform Options: Expenditures as % of GDP
Option 1: Reformed DB for All (ICA, 2%)
Existing Plan
Option 5: ICA 1.3% + DC 10% for all
0.0%
5.0%
10.0%
15.0%
20.0%
25.0%
30.0%
35.0%
40.0%
45.0%
2011 2021 2031 2041 2051 2061 2071 2081
Graph 24. Reform Options: Accrued Liability as % of GDP
Option 1: Reformed DB for All (ICA, 2%)
Existing Plan
Option 5: ICA 1.3% + DC 10% for all
0.0%
2.0%
4.0%
6.0%
8.0%
10.0%
12.0%
2011 2021 2031 2041 2051 2061 2071 2081
Graph 25. Reform Options: Assets as a % of GDP
Option 2: Existing Plan until cutoff date; 20% DC for All after cutoff date
Option 4: ICA 2% for existing; 20% DC for New Workers
Option 5: ICA 1.3% + DC 10% for all
Graph 24 shows accrued liabilities under reform option 5 will remain lower than those under the 2% ICA
formula in all years because the accrual rate for the ICA portion of the hybrid pension program is 1.3%
rather than 2% under the pure defined benefit approach.
Similar to reform options 2 and 4, this benefit
design will also accumulate significant assets as
shown in Graph 25, but assets build up more
slowly. All defined contribution plan risks
discussed in reform option 2 also apply to reform
option 5, but to a lesser extent since all workers
participate in the defined benefit program and only
10% is put in the defined contribution plan.
4.3.2.6 Reform Option 6: Hybrid system, DB and NDC for All
Under this benefit design, civil servants will receive lifetime annuity benefits from the pension program
based on two different benefit formulas. The following multi-pillar plan will apply for all civil servants:
DB plan based on ICA formula, total pay and 1.3% accrual rate (instead of the 2% accurate rate
under option 1), with increased retirement age and inflation indexing; plus
NDC plan of 10% of total pay, with increased retirement age and inflation indexed annuities.
Cash outlays for government will consist of:
Cost of benefit payments under DB program for all participants;
Cost of benefit payments under NDC program for all participants;
As illustrated in Graph 26 and Graph 27, the trend of expenditure and liability under reform option 6
mirror the trend under reform option 1 (DB ICA for all) rather than those under reform option 5. This is
due to the nature of NDC, which does not require actual cash contributions to a fund. The expenditure
under reform option 6 is slightly lower than reform option 1 but the shape of the expenditure curve is very
similar. The accrued liability is also nearly the same since both the ICA and NDC programs are defined
benefit.
Source: Author’s calculations
Source: Author’s calculations

EXECUTIVE SUMMARY
Civil Service Pension Programs for a New Era 25
0.0%
0.2%
0.4%
0.6%
0.8%
1.0%
1.2%
2011 2021 2031 2041 2051 2061 2071 2081
Graph 26. Reform Options: Expenditures as % of GDP
Option 1: Reformed DB for All (ICA, 2%)
Existing Plan
Option 6: ICA 1.3% + NDC 10% for all
0.0%
5.0%
10.0%
15.0%
20.0%
25.0%
30.0%
35.0%
40.0%
45.0%
2011 2021 2031 2041 2051 2061 2071 2081
Graph 27. Reform Options: Accrued Liability as % of GDP
Option 1: Reformed DB for All (ICA, 2%)
Existing Plan
Option 6: ICA 1.3% + NDC 10% for all
Source: Author’s calculations
Under reform option 6, benefits are financed on a PAYG basis. There is no funded DC program or
related asset build-up. Replacement ratios under this option would be marginally higher than those shown
in Table 10.
4.4 THT Program Reform Options
It is critical for the GOI to properly measure the liabilities of the THT program in order to understand the
financial implications of reform options. Our analysis indicates the program’s unfunded liability is much
larger than previously disclosed. This unfunded liability on an ongoing plan basis, which we estimate at
about 75 trillion rupiah on an ongoing basis, may eventually appear on the GOI’s balance sheet, either
directly or as a footnote, and the accounting expense for this program will eventually have to be
recognized in the government’s income statement. The unfunded liability on a termination basis is about
30 trillion rupiah.
The most important step for THT reform is to decide on the THT reform paradigm. It should be
converted to either pure DB or pure DC. If DB, it can be maintained as a separate program or be merged
into the civil service pension program. In the second case, a portion of the civil service pension benefit
would be payable as a lump-sum at the option of the retiree. If the program remains a separate defined
benefit program, then the contributions should not be fixed at 3.25%. Instead the contributions should be
actuarially determined to fully fund promised benefits and to pay off the current unfunded liability. This
should include a specific cost-sharing agreement between civil servants and the government.
If THT becomes defined contribution, it would remain a separate program, providing lump sums at
retirement. However, the government’s and worker’s obligation would be limited to making required
contributions and the program would not create any additional unfunded liabilities. The contribution rate
should be fixed and the benefit should equal the accumulated value of contributions. Under this option,
the benefit under the current program should be frozen to stop the unfunded liability from growing and
the government should contribute the termination liability in a lump sum or over time. The size of the
termination liability is a significant factor to consider when determining how to reform the THT program.
If the government chooses not to modify the THT program at this time, it should be aware that although
the THT program is separate from the pension plan, the two are linked. Therefore, changes in CSP
arrangements could significantly increase THT liabilities. In an earlier section of this report, we
discussed several pension program reform options including potential changes in key cost drivers such as
retirement age, pension indexing, accrual rate and pay definition. It is logical that changes made to the
pension program would also be applied to the THT program. Of the pension cost drivers mentioned, only
retirement age and pay definition will impact the THT program; pension indexing and accrual rate are

EXECUTIVE SUMMARY
26 Civil Service Pension Programs for a New Era
issues for the pension program only. Projected THT liabilities resulting from those changes are illustrated
in Graph 28.
The change in retirement age has a minimal
impact on liabilities. Benefits will be higher
because years of service and pay at retirement will
likely be higher. However, benefits are also
payable at a later date. After taking into account
the time value of money, these two factors offset
each other. However, the change in pay definition,
assuming it is applied to the calculation of THT
benefits, will increase the THT endowment and
life insurance liabilities significantly. Total
liabilities jump from about 110 trillion rupiah to
more than 250 trillion rupiah.
The main report analyzes two possible options in more detail: one a stand-alone DC and one integrated
with the ICA formula with a higher accrual rate and flexible cash out options.
5. Recommendations
5.1 Key Considerations
Reform is necessary for both civil service pension (CSP) and THT programs, but for very different
reasons.
The civil service pension program is arguably fiscally sustainable and the cost is low by
international standards. However, the current design is inequitable, particularly to mid to high-
level civil servants, and it is inconsistent with the government’s bureaucracy reform strategy
which focuses on pay for performance
The THT program is not fiscally sustainable in its current form and the liabilities are higher than
has been previously reported. If not reformed, the unfunded liability will continue to increase and
the government will have to make ever higher contributions to the program to maintain its
solvency.
In deciding which reform options will be taken by the GOI, there are a few key considerations:
Ensure alignment with bureaucracy reform, pay reform and rightsizing
Ensure the programs meet the government’s human resource objectives, help attract and retain
workers with needed skills, reflect the desired allocation of total compensation between direct and
indirect pay and maintain total compensation within the available fiscal envelope
The accounting method should be changed to use international accounting standards to determine
pension expense and liabilities. Expense should be properly allocated to national and sub-national
government units to achieve more transparency in reporting.
Assure all programs are affordable, equitable and fiscally sustainable. Assure fiscal sustainability
of THT without constantly escalating costs by either converting THT to DC, maintaining it as a
stand-alone DB plan with proper contribution rates or merging it with CSP
Source: Author’s calculations
-
50,000,000
100,000,000
150,000,000
200,000,000
250,000,000
300,000,000
Baseline Incr RA, CPI Total pay
Graph 28. THT Accrued Liability Comparison
Post-retirement death spouse pensioners
Post-retirement death old-age pensioners
Pre-retirement death actives, spouses and children
Post-retirement death actives

EXECUTIVE SUMMARY
Civil Service Pension Programs for a New Era 27
Assure the programs offer both liquidity and lifetime monthly income. This could be done by
keeping CSP as DB and converting THT to DC or by combining CSP and THT and allowing a
portion of the pension benefit to be taken as a lump sum
Keep CSP fiscally sustainable while allowing the government to finance benefits in the most
efficient way. CSP may remain PAYG but proper accounting, transparency and good governance
should be adopted to minimize financial risk
5.2 Bank Recommendations
In our view, any sustainable pension reform will require an increase in retirement ages and a change from
wage to inflation indexing. Without these two features, it is unlikely any reform that provides adequate
benefits will be fiscally sustainable and it will be difficult to improve program equity without large cost
increases.
On balance, we do not favor converting the civil service pension program from defined benefit to defined
contribution. There is a mistaken belief that the only way to fund the civil service pension program is to
convert it to defined contribution and the only way to secure benefits is to accumulate a large fund. Both
of these beliefs are false. Defined benefit plans can also be funded if the government wishes and in many
ways, the government has far more flexibility with defined benefit funding than defined contribution.
Ultimately, the security of plan benefits does not depend on a big fund. Benefit security comes from the
government’s power of taxation. Private sector plans are funded to protect against the risk of corporate
bankruptcy and to take advantage of tax laws that favor pension benefits over direct pay. Neither of these
arguments applies to civil service pension schemes. Thus a funded defined contribution program does not
increase the security of pension expectations but rather increases benefit uncertainty.
Indeed, defined contribution plans also introduce new risks that are not present now and that individuals
and the Indonesian government are ill equipped to manage. Defined contribution plans transfer
investment and longevity risk from the government to workers. Workers’ benefits at retirement depend
entirely on their accumulated account balance. The ultimate account balance is impacted by many factors
such as the rate of investment return, the level of investment and administrative expenses, the amount by
which interest rates exceed wage growth rates, patterns of wage increases and promotions and length of
career. Workers also face the risk of significant declines in their account balances just prior to planned
retirement. At the same time, longevity increases and the low interest rate environment have made
annuities more expensive if they are available at all.
Under defined contribution plans, workers are entitled to lump sums rather than lifetime annuities. This
gives workers great flexibility but the pension program will fail to meet its primary purpose, to prevent
poverty and assure lifetime income after leaving the labor market. Individuals have limited or no ability
to convert the lump sums they receive into a life annuity as the insurance industry in Indonesia does not
offer this product, and if it was offered, the pricing would likely remain very unattractive in the
foreseeable future.
Insurance companies need a deep market in long-term, high quality fixed income securities in order to
offer annuities at attractive prices. Insurance companies must also deal with the risk of increasing life
expectancy. If on average individuals live longer than expected, the insurance company will lose money.
If individuals can choose between annuities and lump sums, annuities will become even more expensive
because only those in good health will select the annuity option. Given these risks, insurance companies
will build large safety margins into the pricing of their products and the products will be less attractive to
potential purchasers. Matters are made even worse by the low level of interest rates. Annuity purchase

EXECUTIVE SUMMARY
28 Civil Service Pension Programs for a New Era
rates are similar to bonds – the price is lower when interest rates are high and vice versa. Since interest
rates are currently at historically low levels, annuities are expensive.
Another critical issue for defined contribution plans is the asset management process. The government
has a fiduciary obligation to assure all assets are invested in the best interests of participants and that
investment and administrative expenses are minimized. This often leads to a conflict of interest between
the government and plan participants. Governments are subject to pressures to use assets to meet
political goals or support monetary policy They often impose restrictions by law or regulation on
overseas investments, require funds to invest in politically favored projects or use pension assets to help
protect against capital flight, currency depreciation or to fund State budget deficits. These actions often
have a negative impact on rate of return and participant retirement benefits. In addition, defined
contribution plans require sophisticated individual account recordkeeping, a strong domestic asset
management industry, a robust prudential framework and a strong system of supervision and control.
Most of these are lacking or seriously deficient in developing countries.
If today’s civil service pension program were fully converted to a defined contribution plan, a
contribution rate of 35% of total pay (close to 90% of base pay) would be needed in order to match the
benefits payable under the current civil service pension program. This is higher than the cost of the
current plan because the level of expenses is higher in a defined contribution plan than in a defined
benefit plan. Such a high contribution rate would lead to the rapid accumulation of a large fund which
would have to be properly invested. Pension assets should only be invested in the highest quality stocks
and bonds and there would only be a handful of local bonds and equities that would meet the normal
requirements for pension investments. The large infusion of cash into the local stock markets could
overwhelm supply and create bubbles in the market. Consequently, the government would need to invest
a significant amount of pension assets outside of Indonesia, which might prove politically challenging.
The macroeconomic environment for funding is also likely to be unfavorable in Indonesia for the
foreseeable future. Real GDP growth rates are substantially higher than real risk-adjusted rates of return
on investments. Consequently, it is cheaper to defer payment of pension expenses to a later date when
they will represent a smaller burden on GDP than it is to fund those expenses now. Money is not free and
there is an opportunity cost in allocating assets to pensions rather than other needs. Funding the plan
would also not change the government’s total debt burden if the government had to borrow the money for
plan funding. The government would just be substituting unfunded pension debt for an equivalent
amount of bond debt unless it raises taxes or cut other expenses by an equivalent amount.
Yet another consideration is the likely funding under the SJSN pension and old-age savings programs.
The old age savings program contribution rate has not yet been established. However, our analysis
indicates that a 3% contribution rate would result in contributions of about 1% of GDP annually.
Consequently, after 20 years, assets would equal about 18% of GDP. If the current JHT contribution rate
of 5.7% were used, the assets would be about 35% of GDP.
For the pension program, population aging will increase the number of pensioners relative to the size of
the workforce, leading to sharply rising costs as a percent of covered payroll on a pay-as-you-go basis.
Consequently, the SJSN pension program will likely require some prefunding to deal with population
aging, and this will also lead to the accumulation of significant assets as a percent of GDP. Consequently,
there is no need to fund the civil service pension programs in order to accumulate assets for
macroeconomic goals.
An analysis of international experience shows that civil service pension programs are still predominantly
defined benefit and financed on a pay-as-you-go basis. Even countries with national defined contribution
EXECUTIVE SUMMARY
Civil Service Pension Programs for a New Era 29
social security system often have defined benefit programs for their civil servants. There are several
possible reasons for this preference for defined benefit plans. In developing countries, governments are
often far better equipped to manage longevity risk than individuals. Individuals have no effective way to
convert lump sums into life annuities and this product is rarely offered in the market place. However,
through defined benefit plans, the government has a way to pool the longevity risk of millions of civil
servants and efficiently provide the life annuities that are not available from the private sector. Another
reason for the popularity of defined benefit programs is that they work best when employees remain with
one employer throughout their career. In many civil service systems throughout the world, including
Indonesia and many Western countries, workers join the civil service in their 20’s and remain in the civil
service throughout their entire career. Thus, civil servants are one of the last groups that tend to remain
with one employer throughout their career. This makes defined benefit programs an excellent fit for
government employees.
For all these reasons, we suggest the government keep the civil service pension program defined benefit,
but restructure the program to increase benefits and make it more equitable to all civil servants.
Consequently, we suggest Option 1, the indexed career average plan, as the basis for the civil service
pension program reform. As previously emphasized, this must include an immediate increase in
retirement age, future changes in retirement age as life expectancy changes and a change to inflation
indexing.
If the government wishes to introduce a defined contribution element to the civil service retirement
program package, the best way would be to change the THT program from its current form to defined
contribution. This would allow the government to accumulate some funding in its civil service old age
program, develop the capacity to administer, manage assets and properly supervise a defined contribution
program starting with much lower contributions and assets, and find a solution to the THT program’s
fiscal sustainability problems. Under this arrangement, THT would continue to provide civil servants
with liquidity at retirement to supplement the life annuities payable from the civil service pension
program.
Another option would be to terminate the THT plan and increase the benefits payable under the civil
service defined benefit pension program to compensate. Current employee contributions totaling 8% of
base pay could be used for that purpose. In order to provide some liquidity to civil servants at retirement,
the civil service pension program could allow participants to choose to take a portion of their benefit as a
lump sum and receive the balance as a life annuity.
It is possible to restructure the current programs to provide equitable benefits based on total pay for all
civil servants at comparable cost and integrated with bureaucracy reform, pay reform and rightsizing.
Current entitlements would be protected but retirement ages would be gradually increased and post
retirement pension adjustments would be based on price indexation to maintain the purchasing power of
the pensions. In our opinion, this is an optimal option which the government may want to consider for its
civil servants.
5.3 Proposed Implementation Time Line
We have prepared a roadmap for the civil service pension and THT reform process, which can further be
broken down into several distinct phases.
Establishment of bureaucratic framework for the reform effort. It is important to have a team or
an individuals clearly responsible for managing the reform project. To ensure the effectiveness of

EXECUTIVE SUMMARY
30 Civil Service Pension Programs for a New Era
reform process, it is important for the GOI to clearly assign the government office that will lead the
reform process, the institutions and individuals involved and their roles, and responsibilities.
Identify implementation steps and timing. While the GOI has committed to the pension and THT
reforms, nevertheless, the reform needs be carried out systematically. Otherwise the reform may not
achieve its objectives and the process may take far more time than anticipated.
Design
The first step in any reform process should be to develop a reform strategy, which is often
documented in a “concept paper”. The GOI should analyze the existing programs and the current
system’s strengths and weaknesses, including all the institutions that are responsible for managing the
system. This includes an analysis of benefit adequacy, financing, reporting, data collection,
communication, administration and governance structure. In parallel, the GOI should establish its
strategic goals and objectives for the new system taking into account bureaucracy and pay reform,
fiscal envelope, and other GOI objectives. One of the reasons many reforms flounder is that the
strategic goals and objectives are not established prior to looking at alternative designs and preparing
draft laws and regulations.
After formulating the reform strategy, the GOI will need to work out the technical details of the
reformed program design. When this is completed, a “White Paper” is often written documenting the
rationale and details of the selected design and the legal, financial, governance and administrative
ramifications of the new design.
Another important step is to put in place a communication program to increase awareness of the role
of the GOI as plan sponsor, manage expectations, prevent misunderstandings, maximize participants’
satisfaction, explain participants’ rights and obligations and explain the role of the various
organizations involved in managing the reformed system. There are many misperceptions about the
current pension and THT programs. One of the most detrimental is the perception that Taspen, and
not the government of Indonesia, is the sponsor of the programs, and that the government is not
contributing to the pension program. Both of these are false.
Implementation steps. Once the design is completed, there is still a great deal of work to be done to
assure smooth implementation. Reform of the compensation structure and pension reform need to be
harmonized, implementing legislation (new laws and regulations) must be drafted, outdated or
conflicting laws and legislation should be repealed and other legislation should be conformed to the
new law. The GOI should also build infrastructure and capacity within relevant government offices to
support the new system. It is important for all institutions and IT systems to be in place prior to
starting the reformed system. This is particularly true for systems used for keeping data records that
will be needed for calculating benefits, and systems used to accumulate experience data that will be
needed to confirm or revise parameters and assumptions used for financial projections and liability
calculations.
The above reform process can be translated into an implementation time line as shown below.

EXECUTIVE SUMMARY
Civil Service Pension Programs for a New Era 31
GOI: Government of Indonesia
WB: World Bank
1Q 2Q 3Q 4Q 1Q 2Q 3Q 4Q 1Q 2Q 3Q 4Q
DESIGN
WB runs series of workshops on civil service reform issues
WB analyzes current program design and finances (CSP and THT)
WB analyzes range of potential reform options
WB presents findings and recommendations to government
GOI establishes bureaucratic framework for reform
GOI sets goals and objectives for new system
GOI selects design paradigm for new system
GOI assesses governance, administrative and IT needs of new system
GOI finalizes detailed design and funding for new system
GOI finalizes financing path for new system
IMPLEMENTATION
Draft needed legislation and regulations
Create/upgrade institutions and business processes
Create/upgrade IT systems and software
Implement stakeholder communication program
Create/improve governance, supervision and control system
Start new system X
2011 2012 2013