Embed Size (px)
Citation preview
guntram B. Wolff is
the director of Bruegel
(guntram.wolff@bruegel.
org).
Robert Kalcik is a
research assistant at Bruegel
The authors are grateful
to Simon Hix, Anna Iara
and Bruegel colleagues for
helpful comments on an
earlier draft. Remaining
errors are ours.
Executive summary
• The United Kingdom’s departure from the European Union will have implications for the European Parliament. Seventy-three of its 751 members are elected in the UK. Brexit offers a political opportunity to reform the allocation of seats to member states.
• The European Parliament is a highly unequal parliament: large countries are underrepresented while small countries are overrepresented. This is desired in the EU treaties. But the EU treaties also emphasise the importance of equality and equal treatment of citizens by EU institutions. Inequality of representation in the European Parliament has been criticised as reducing its democratic legitimacy. The European Parliament itself has called for increased “electoral equality,” or enhanced equality of representation.
• We explore different options for reform and their implications for equality of representation and distribution of seats to countries. We do so within the constraints set by the EU treaties.
• One option would be simply to drop the 73 seats currently occupied by MEPs elected in the UK. However, this would increase the inequality of representation in the European Parliament. We also consider other pragmatic options but they would not yield significantly different outcomes.
• Alternatively, the allocation of MEPs to member states could be reconsidered with a view to reducing the inequality of representation within the constraints set by the EU treaties. We use two measures of inequality and perform a mathematical optimisation.
• By one measure of inequality of citizens’ representation, the European Parliament would shrink to 639 MEPs. By the other measure, it would shrink to 736 MEPs. Inequality can be reduced by around 25 percent, making the parliament somewhat more comparable to the levels of inequality of representation seen in the British and French national parliaments. The European Parliament would still be twice as unequal, however.
• We also consider the idea of a transnational list, an option that would require treaty change, and offer an online tool to explore other options that would require treaty change.
• At a time of a shrinking EU budget and high levels of scepticism about the legitimacy and efficiency of EU institutions, Brexit offers an opportunity to reform the European Parliament to address some of the criticisms. However, we note that only a change to the EU Treaties would enable changes to make the European Parliament comparable to national parliaments in terms of equality of representation.
Policy Contribution Issue n˚2 | 2017 Is Brexit an opportunity
to reform the European Parliament?Robert Kalcik and Guntram B. Wolff
2 Policy Contribution | Issue n˚2 | 2017
1 IntroductionAs the United Kingdom leaves the European Union, one issue for the EU to resolve is the
implications of the departure for the European Parliament. Currently, 73 members of the Eu-
ropean Parliament (MEPs) are elected in the UK, but the UK is likely to have left the EU by the
time of the next European elections in 2019. This raises the question of whether these 73 seats
should be dropped or reallocated to the remaining 27 EU countries. And if they are to be real-
located, how should it be done? How will the European Parliament change without the UK?
Even before the UK’s Brexit referendum, the Council of the European Union in 2013 called
on the European Parliament to make a proposal in time for the 2019-24 parliamentary term
for the allocation of seats to EU countries “in an objective, fair, durable and transparent way,
translating the principle of degressive proportionality,”1 with ‘degressive proportionality’
meaning that more populated EU countries have more citizens per MEP than their less-pop-
ulated counterparts. Prior to the UK Brexit vote, the European Parliament itself called for a
reform to increase equality of representation2.
Brexit offers a unique political opportunity to revive the discussion on the distribution of
seats and to reassess the resulting political and geographical balance in the parliament. The
current distribution of seats is the result of long political negotiations and represents a com-
promise. The departure of one of the largest EU countries means there is new opportunity for
political compromises on the composition of the European Parliament.
We explore different possible distributions of seats in the European Parliament after
Brexit. In particular, we present two options that fulfil the requirements of the EU treaties,
in particular on minimum and maximum thresholds and degressive proportionality, but
that also aim to achieve the greatest possible equality of representation, as demanded by
the European Parliament within the treaty constraints. We analyse the implications of those
changes in terms of degressive proportionality, equality of representation, number of seats
per country, and possible impact on the share of seats of the political groups in the European
Parliament3
2 Why does the allocation of seats to countries matter?
The allocation of European Parliament seats to countries has a number of implications. An
obvious point is that different weights for different countries imply different distributions of
1 See Article 4 of ‘European Council Decision establishing the composition of the European Parliament’, 28 June
2013. Degressive proportionality is required by Article 14 of the Treaty on European Union.
2 The European Parliament itself aims to reinforce the concept of “citizenship of the Union and electoral equality”. In
its resolution of 11 November 2015, the European Parliament discussed the reform of the electoral law of the EU.
It called for “providing for the greatest possible degree of electoral equality and participation for Union citizens.” See
European Parliament resolution of 11 November 2015, P8_TA(2015)0395, ‘Reform of the electoral law of the EU,’ in
which the Parliament: “Decides to reform its electoral procedure in good time before the 2019 elections, with the aim
of enhancing the democratic and transnational dimension of the European elections and the democratic legitimacy of
the EU decision-making process, reinforcing the concept of citizenship of the Union and electoral equality, promoting
the principle of representative democracy and the direct representation of Union citizens in the European Parliament,
in accordance with Article 10 TFEU, improving the functioning of the European Parliament and the governance of
the Union, making the work of the European Parliament more legitimate and efficient, enhancing the effectiveness of
the system for conducting European elections, fostering common ownership among citizens from all Member States,
enhancing the balanced composition of the European Parliament, and providing for the greatest possible degree of
electoral equality and participation for Union citizens”.
3 We also complement this paper with an online tool that shows how the number of European Parliament seats per
EU country would change, depending on different variables.
3 Policy Contribution | Issue n˚2 | 2017
votes across party groups, because of differing national voting patterns. For example, while 35
percent of Germany’s European Parliament seats went to the conservative European People’s
Party (EPP) group in the 2014 European elections, the EPP secured only 27 percent of seats in
France. Assuming voting patterns remain the same, a change in the relative number of seats
allocated to France and Germany would have an impact on the strengths of different political
groups. Of course, the absence of the UK MEPs by itself will already change the shares of seats
held by different groups in the European Parliament. Hix et al (2016) document the voting
patterns of MEPs from the UK: their departure would immediately change voting patterns.
However, beyond the impact on voting patterns of changes in the allocation of seats, a
deeper and more controversial question is how the distribution of seats to countries affects
the legitimacy of the European Parliament. With the Lisbon Treaty, the European Parliament
has become the parliament that represents EU citizens. But the notion of representing EU
citizens seems to be at odds with the principle of degressive proportionality, which gives dif-
ferent weights to EU citizens depending on the country in which they live. Degressive propor-
tionality also appears to be at odds with the basic call of the EU treaties to ensure equality of
all citizens and, in particular, that citizens should receive equal attention from EU institutions
(Art 9 TEU)4. However, degressive proportionality is enshrined in the treaties (Art 14 TEU) so
that large countries do not dominate the European Parliament.
The EU treaties are therefore somewhat ambiguous on the question of whether the Euro-
pean Parliament represents primarily EU citizens or citizens of EU states. In other words, the
treaties still differentiate between, say, French and Slovenian EU citizens in elections to the
European Parliament, while considering that the parliamentarians represent EU citizens and
not national citizens with nationally determined preferences. Implicitly, the treaties therefore
assume that a French and a Slovenian MEP could decide differently in a vote based on their
nationality and not based on political preferences. In line with that reasoning, the European
Parliament’s former rapporteur for electoral procedure, Andrew Duff, summarised that the
European Parliament “reflects a giant historical compromise between the international law
principle of the equality of states and the democratic motto of ‘One person, one vote’” (Duff,
2014).
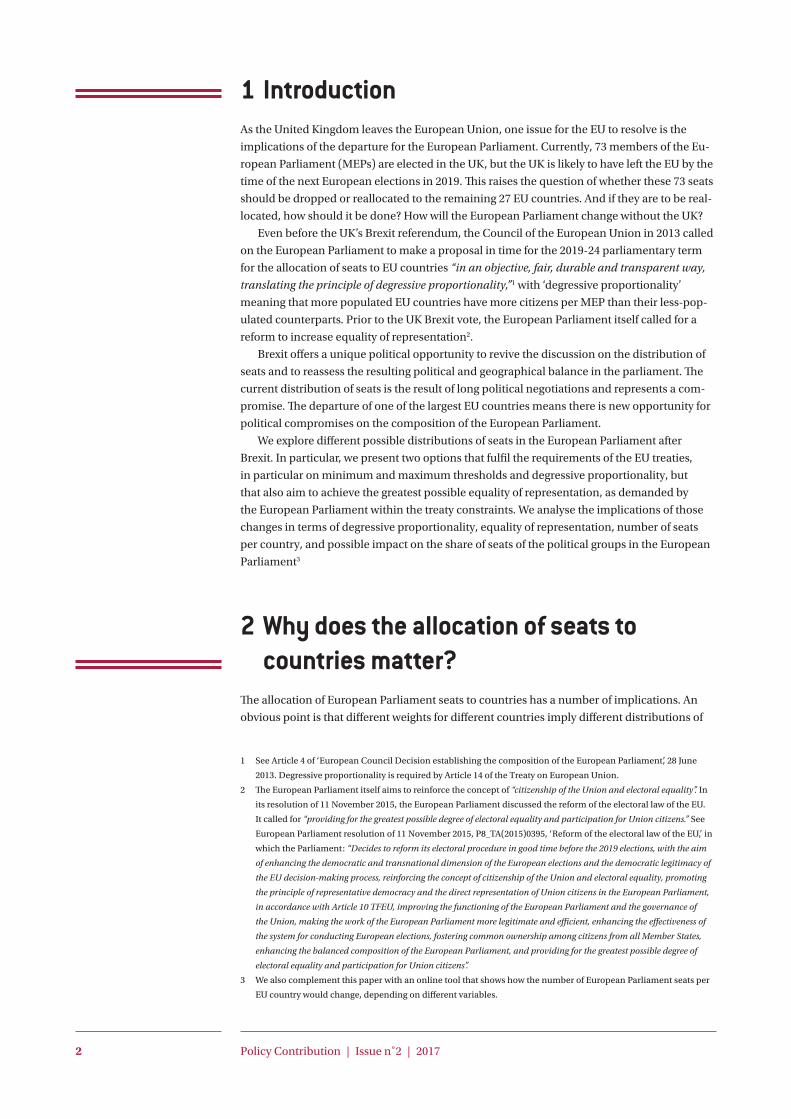
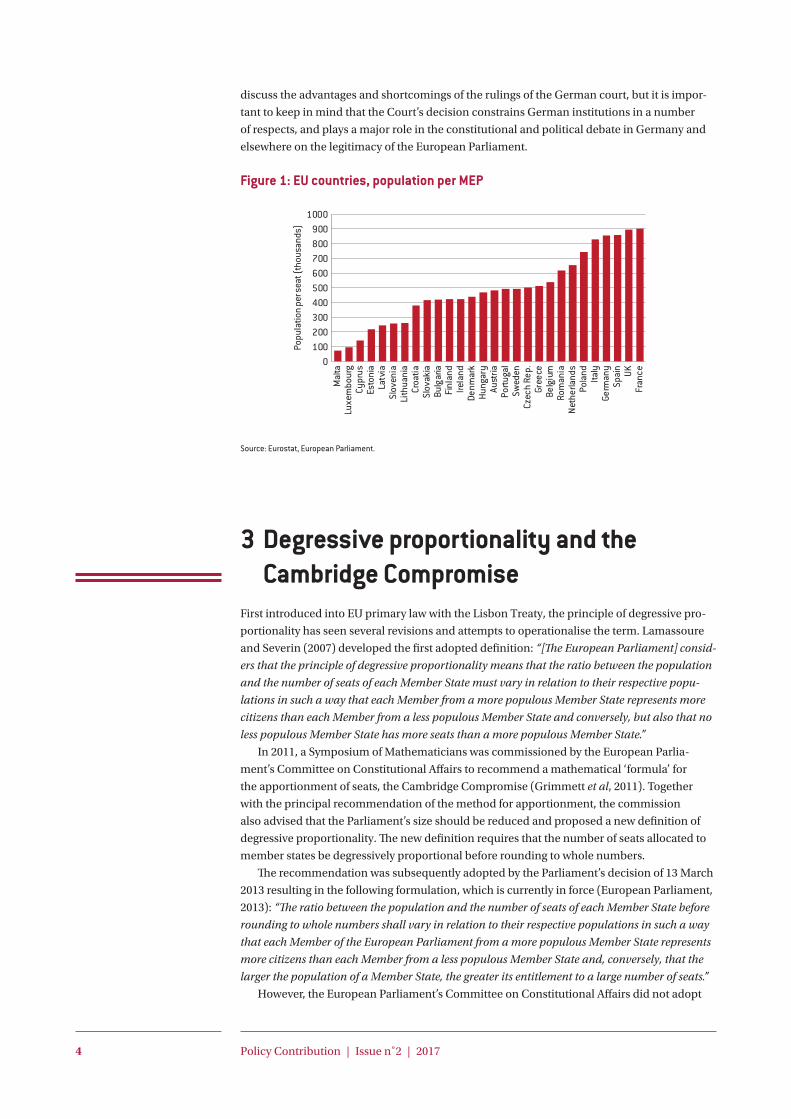
The constraints in the EU treaties on the allocation of seats to countries are therefore at
odds with the principle of equality of representation. It is broadly desired that small member
states should have more seats than their population sizes would suggest. Figure 1 on the next
page shows the distribution of seats across EU citizens as it is currently implemented, based
on the constraints of the EU treaties and current electoral agreements.
The intellectual and political foundations for the current composition of the European
Parliament are given in the European Parliament report by Lamassoure and Severin (2007),
which also defines the concept of degressive proportionality. It was revised in a 2013 Euro-
pean Parliament report by Gualtieri and Trzaskowski (2013), in which the ‘Cambridge Com-
promise’ is introduced (Grimmett et al, 2011, see the next section). The call of the European
Parliament for more electoral equality therefore suggests that it increasingly leans towards an
interpretation of its role in which the nationality of MEPs matters less as voting patterns are
the result of political preferences and not nationality.
The extent of proportionality is also a highly controversial issue in the legal discussion.
In a landmark ruling of the German constitutional court (BVerfG, 2009), equality of rep-
resentation in the European Parliament is explicitly mentioned to not be satisfied, measured
against requirements placed on democracy in states. The German court concluded that the
EU’s “structural democratic deficit” cannot be resolved in an association of states and that the
European Parliament cannot close this “structural democratic deficit”. This is not the place to
4 Article 9 of the Treaty on European Union (TEU) says that “In all its activities, the Union shall observe the principle
of the equality of its citizens, who shall receive equal attention from its institutions, bodies, offices and agencies.” Article
14(2) of the TEU says of the European Parliament that it “shall be composed of representatives of the Union’s citizens.”
However, the same article also specifies the principle of degressive proportionality.
4 Policy Contribution | Issue n˚2 | 2017
discuss the advantages and shortcomings of the rulings of the German court, but it is impor-
tant to keep in mind that the Court’s decision constrains German institutions in a number
of respects, and plays a major role in the constitutional and political debate in Germany and
elsewhere on the legitimacy of the European Parliament.
Figure 1: EU countries, population per MEP
0100200300400500600700800900
1000
Mal
taLu
xem
bour
gCy
prus
Esto
nia
Latv
iaSl
oven
iaLi
thua
nia
Croa
tiaSl
ovak
iaBu
lgar
iaFi
nlan
dIre
land
Denm
ark
Hung
ary
Aust
riaPo
rtuga
lSw
eden
Czec
h Re
p.Gr
eece
Belg
ium
Rom
ania
Neth
erla
nds
Pola
ndIta
lyGe
rman
ySp
ain UK
Fran
ce
Popu
latio
n pe
r sea
t (th
ousa
nds)
Source: Eurostat, European Parliament.
3 Degressive proportionality and the Cambridge Compromise
First introduced into EU primary law with the Lisbon Treaty, the principle of degressive pro-
portionality has seen several revisions and attempts to operationalise the term. Lamassoure
and Severin (2007) developed the first adopted definition: “[The European Parliament] consid-
ers that the principle of degressive proportionality means that the ratio between the population
and the number of seats of each Member State must vary in relation to their respective popu-
lations in such a way that each Member from a more populous Member State represents more
citizens than each Member from a less populous Member State and conversely, but also that no
less populous Member State has more seats than a more populous Member State.”
In 2011, a Symposium of Mathematicians was commissioned by the European Parlia-
ment’s Committee on Constitutional Affairs to recommend a mathematical ‘formula’ for
the apportionment of seats, the Cambridge Compromise (Grimmett et al, 2011). Together
with the principal recommendation of the method for apportionment, the commission
also advised that the Parliament’s size should be reduced and proposed a new definition of
degressive proportionality. The new definition requires that the number of seats allocated to
member states be degressively proportional before rounding to whole numbers.
The recommendation was subsequently adopted by the Parliament’s decision of 13 March
2013 resulting in the following formulation, which is currently in force (European Parliament,
2013): “The ratio between the population and the number of seats of each Member State before
rounding to whole numbers shall vary in relation to their respective populations in such a way
that each Member of the European Parliament from a more populous Member State represents
more citizens than each Member from a less populous Member State and, conversely, that the
larger the population of a Member State, the greater its entitlement to a large number of seats.”
However, the European Parliament’s Committee on Constitutional Affairs did not adopt
5 Policy Contribution | Issue n˚2 | 2017
the recommendations of the group of mathematicians that proposed the Cambridge Compro-
mise, but rather opted for a “pragmatic solution”. Instead of following the Cambridge Com-
promise, the pragmatic solution meant that seats were distributed according to the principle
that no state should gain seats and none should lose more than one.
4 The distribution of seats in the European Parliament and in national parliaments
The EU treaties specify the distribution of seats in the European Parliament. The minimum
number of seats a country can have is six, and the maximum is 96, with a total of 751 (750 plus
a president).
In line with the principle of degressive proportionality, the number of citizens per MEP
increases with the size of the country, meaning citizens of smaller EU countries are over-rep-
resented relative to their counterparts from large countries. Degressive proportionality thus
implies inequality of representation. We define equality of representation to mean that the
population per MEP would be the same for all countries.
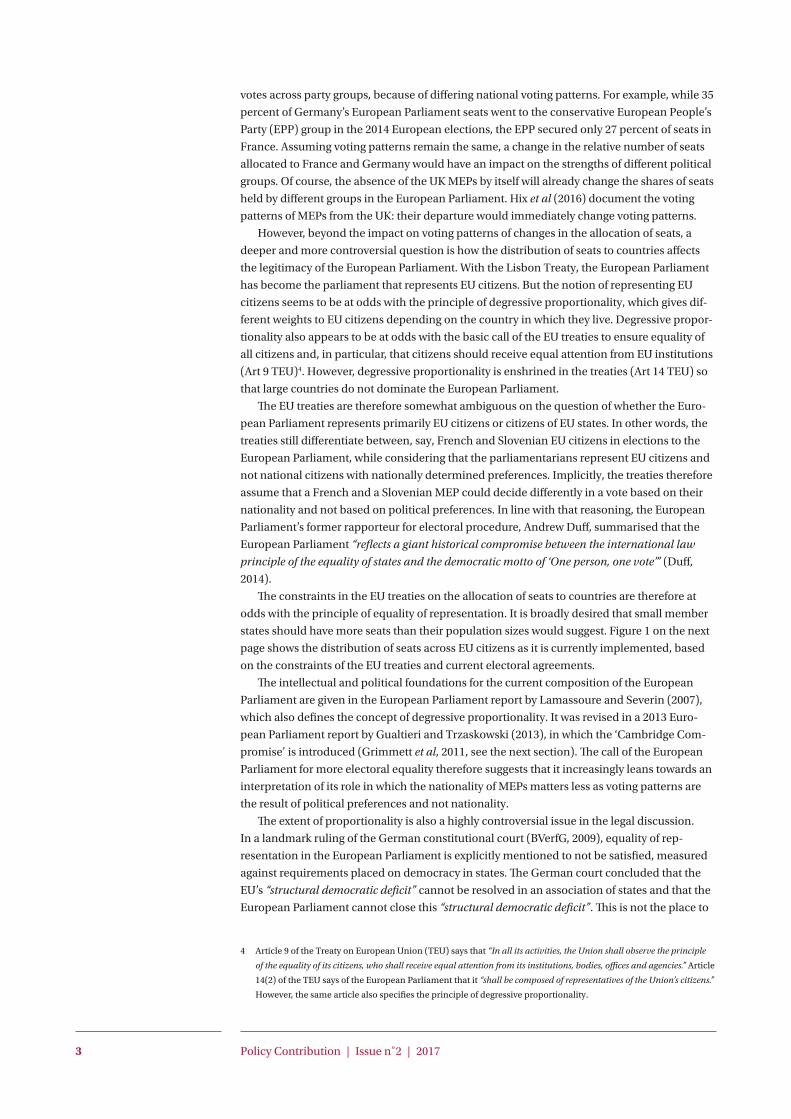
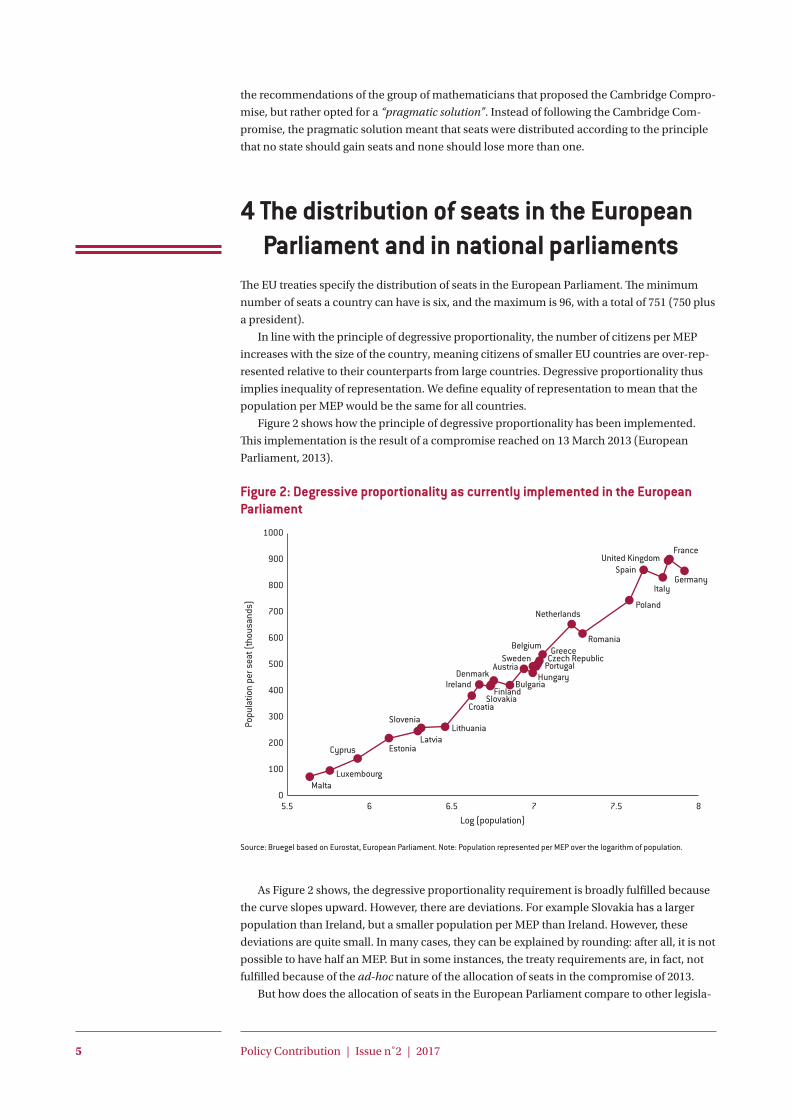
Figure 2 shows how the principle of degressive proportionality has been implemented.
This implementation is the result of a compromise reached on 13 March 2013 (European
Parliament, 2013).
Figure 2: Degressive proportionality as currently implemented in the European Parliament
MaltaLuxembourg
Cyprus EstoniaLatvia
SloveniaLithuania
Croatia
Ireland
Slovakia
DenmarkBulgaria
AustriaHungary
Portugal
GreeceBelgium
Netherlands
Romania
Poland
Spain
Italy
United KingdomFrance
Germany
0
100
200
300
400
500
600
700
800
900
1000
5.5 6 6.5 7 7.5 8
Popu
latio
n pe
r sea
t (th
ousa
nds)
Log (population)
Sweden Czech Republic
Finland
Source: Bruegel based on Eurostat, European Parliament. Note: Population represented per MEP over the logarithm of population.
As Figure 2 shows, the degressive proportionality requirement is broadly fulfilled because
the curve slopes upward. However, there are deviations. For example Slovakia has a larger
population than Ireland, but a smaller population per MEP than Ireland. However, these
deviations are quite small. In many cases, they can be explained by rounding: after all, it is not
possible to have half an MEP. But in some instances, the treaty requirements are, in fact, not
fulfilled because of the ad-hoc nature of the allocation of seats in the compromise of 2013.
But how does the allocation of seats in the European Parliament compare to other legisla-
6 Policy Contribution | Issue n˚2 | 2017
tures in terms of equality of representation?
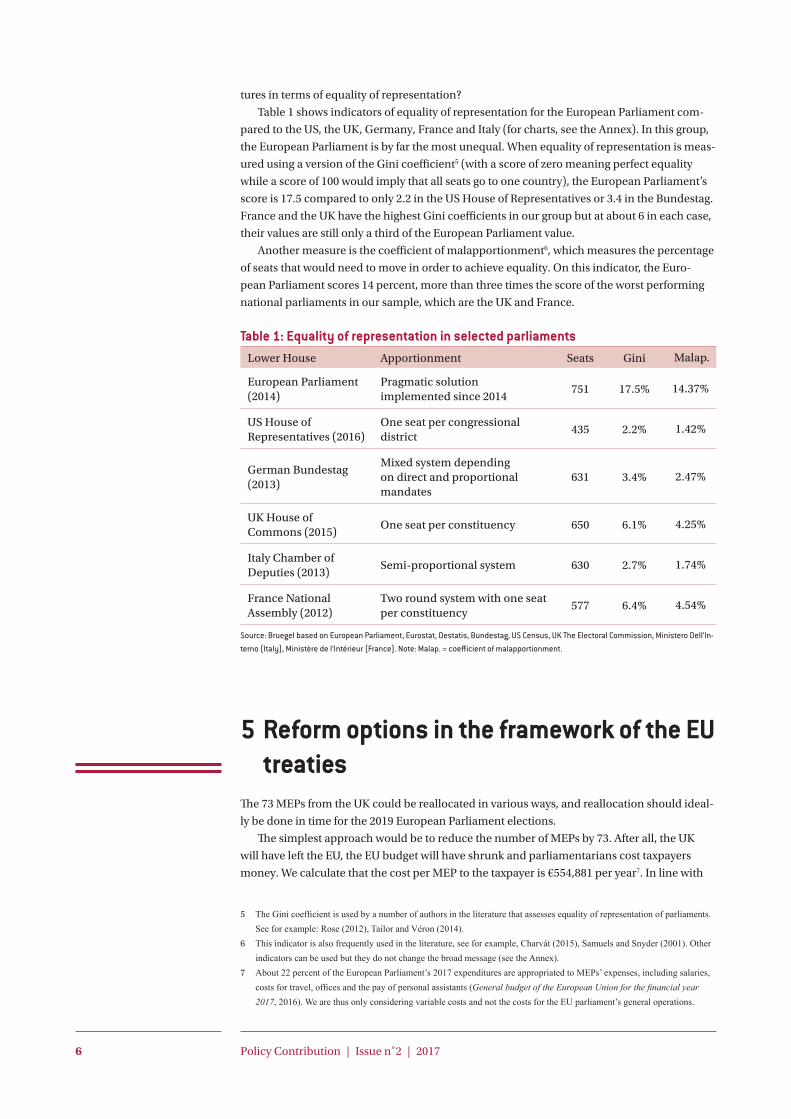
Table 1 shows indicators of equality of representation for the European Parliament com-
pared to the US, the UK, Germany, France and Italy (for charts, see the Annex). In this group,
the European Parliament is by far the most unequal. When equality of representation is meas-
ured using a version of the Gini coefficient5 (with a score of zero meaning perfect equality
while a score of 100 would imply that all seats go to one country), the European Parliament’s
score is 17.5 compared to only 2.2 in the US House of Representatives or 3.4 in the Bundestag.
France and the UK have the highest Gini coefficients in our group but at about 6 in each case,
their values are still only a third of the European Parliament value.
Another measure is the coefficient of malapportionment6, which measures the percentage
of seats that would need to move in order to achieve equality. On this indicator, the Euro-
pean Parliament scores 14 percent, more than three times the score of the worst performing
national parliaments in our sample, which are the UK and France.
Table 1: Equality of representation in selected parliamentsLower House Apportionment Seats Gini Malap.
European Parliament (2014)
Pragmatic solution implemented since 2014
751 17.5% 14.37%
US House of Representatives (2016)
One seat per congressional district
435 2.2% 1.42%
German Bundestag (2013)
Mixed system depending on direct and proportional mandates
631 3.4% 2.47%
UK House of Commons (2015)
One seat per constituency 650 6.1% 4.25%
Italy Chamber of Deputies (2013)
Semi-proportional system 630 2.7% 1.74%
France National Assembly (2012)
Two round system with one seat per constituency
577 6.4% 4.54%
Source: Bruegel based on European Parliament, Eurostat, Destatis, Bundestag, US Census, UK The Electoral Commission, Ministero Dell’In-terno (Italy), Ministère de l’Intérieur (France). Note: Malap. = coefficient of malapportionment.
5 Reform options in the framework of the EU treaties
The 73 MEPs from the UK could be reallocated in various ways, and reallocation should ideal-
ly be done in time for the 2019 European Parliament elections.
The simplest approach would be to reduce the number of MEPs by 73. After all, the UK
will have left the EU, the EU budget will have shrunk and parliamentarians cost taxpayers
money. We calculate that the cost per MEP to the taxpayer is €554,881 per year7. In line with
5 TheGinicoefficientisusedbyanumberofauthorsintheliteraturethatassessesequalityofrepresentationofparliaments.Seeforexample:Rose(2012),TailorandVéron(2014).
6 Thisindicatorisalsofrequentlyusedintheliterature,seeforexample,Charvát(2015),SamuelsandSnyder(2001).Otherindicatorscanbeusedbuttheydonotchangethebroadmessage(seetheAnnex).
7 About22percentoftheEuropeanParliament’s2017expendituresareappropriatedtoMEPs’expenses,includingsalaries,costsfortravel,officesandthepayofpersonalassistants(General budget of the European Union for the financial year 2017,2016).WearethusonlyconsideringvariablecostsandnotthecostsfortheEUparliament’sgeneraloperations.

7 Policy Contribution | Issue n˚2 | 2017
this approach, the European Parliament would shrink to 678 MEPs. The number of seats per
country would remain unaltered, which may be politically the easiest solution. However, the
Gini coefficient and the indicator of malapportionment would both increase, worsening the
European Parliament’s problem of inequality of representation.
A second option would be to distribute the 73 seats to all remaining countries while
keeping within the constraint of a national maximum of 96. This would dramatically increase
the inequality of representation. Evenly distributing seats following the current proportions of
MEPs per country would lead to an increase in inequality.
Finally, all or some seats could be redistributed to try to minimise inequality within the
constraints of the treaties (Box 1 describes how the mathematical optimisation is structured
to achieve this reduction in inequality). By following this approach, the optimal number of
MEPs would be 639 or 736, depending on how inequality of representation is measured. If
such an approach were pursued, the Gini index would fall from 17.5 to 14.2, and the malap-
portionment index would fall from 14.4 to 10.5, a decline of more than a quarter.
Table 2: Comparison of possible allocations in terms of Gini and malapportionment coefficients
Lower House Apportionment Seats Gini Malap.
European Parliament
Pragmatic solution implemented since 2014
751 17.5% 14.4%
Different scenarios for the European Parliament:
Redistribute only 73 seats, no treaty change required
Dropping of 73 MEPs 678 ↑18.3% ↑14.8%
Distribute seats equally between countries
751 ↑22.6% ↑18.2%
Distribute seats following the current proportions of MEPs per country
751 ↑19.7% ↑15.6%
Distribute seats to increase representativeness
751 ↓14.8% ↓10.6%
Cambridge Compromise, no treaty change required
Current EP size 751 ↓15.1% ↓10.8%
EP size to minimize Gini 639 ↓14.2% ↓11.3%
EP size to minimize malapportionment
736 ↓14.6% ↓10.5%
Change of TEU Art. 14(2) required
Allocate 73 seats to a transnational list following Duff (2011)
751 ↓16.5% ↓13.3%
Source: Bruegel based on European Parliament, Eurostat.
8 Policy Contribution | Issue n˚2 | 2017
Box 1: Choosing the optimal size of the European Parliament
The core recommendation of the Cambridge Apportionment Meeting was a method of
distributing seats to member states termed ‘Base+prop method’ (Grimmett et al, 2011). In
a first stage, a fixed base number of seats is allocated to each country, ie five seats. In the
second stage, the remainder is distributed proportionally to population sizes with upwards
rounding. The recommended method is a compromise that follows the principle of equality
among states with the base number of seats, and the principle of equality among citizens by
the proportional part.
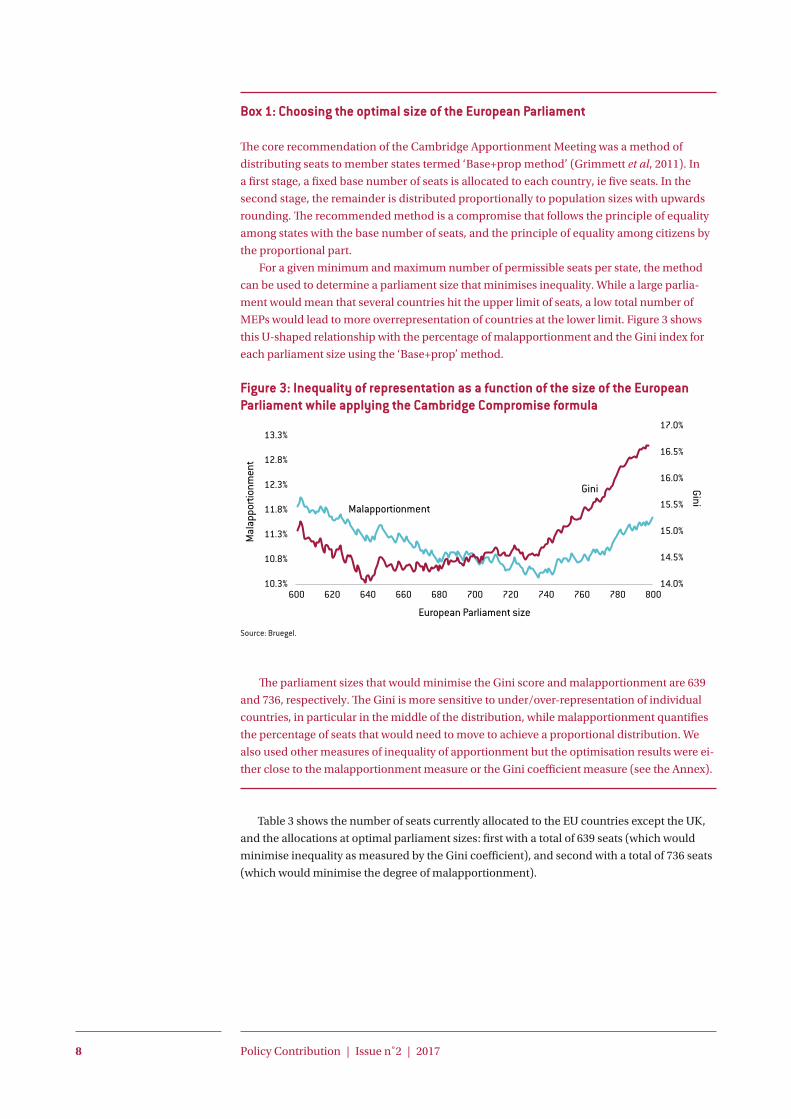
For a given minimum and maximum number of permissible seats per state, the method
can be used to determine a parliament size that minimises inequality. While a large parlia-
ment would mean that several countries hit the upper limit of seats, a low total number of
MEPs would lead to more overrepresentation of countries at the lower limit. Figure 3 shows
this U-shaped relationship with the percentage of malapportionment and the Gini index for
each parliament size using the ‘Base+prop’ method.
Figure 3: Inequality of representation as a function of the size of the European Parliament while applying the Cambridge Compromise formula
Source: Bruegel.
The parliament sizes that would minimise the Gini score and malapportionment are 639
and 736, respectively. The Gini is more sensitive to under/over-representation of individual
countries, in particular in the middle of the distribution, while malapportionment quantifies
the percentage of seats that would need to move to achieve a proportional distribution. We
also used other measures of inequality of apportionment but the optimisation results were ei-
ther close to the malapportionment measure or the Gini coefficient measure (see the Annex).
Table 3 shows the number of seats currently allocated to the EU countries except the UK,
and the allocations at optimal parliament sizes: first with a total of 639 seats (which would
minimise inequality as measured by the Gini coefficient), and second with a total of 736 seats
(which would minimise the degree of malapportionment).
12.8%
14.0%
14.5%
15.0%
15.5%
16.0%
16.5%
17.0%
10.3%
10.8%
11.3%
11.8%
12.3%
13.3%
600 620 640 660 680 700 720 740 760 780 800
Gini
Mal
appo
rtion
men
t
European Parliament size
Malapportionment
Gini

9 Policy Contribution | Issue n˚2 | 2017
Table 3: Allocation of seats to EU countries according to the Cambridge Compromise, with Parliament sizes of 639 and 736
European Parliament without UK
Cambridge Compromise 639 seats
Cambridge Compromise 736 seats
Pop. % Seats % Seats % Diff.Pop. / seats
Seats % Diff.Pop. / seats
Germany 18.5% 96 14.2% 96 15.0% 855854 96 13.0% 855854
France 15.0% 74 10.9% 79 12.4% + 5 843818 96 13.0% + 22 694392
Italy 13.6% 73 10.8% 73 11.4% 831035 89 12.1% + 16 681635
Spain 10.4% 54 8.0% 57 8.9% + 3 814709 70 9.5% + 16 663406
Poland 8.5% 51 7.5% 47 7.4% - 4 807813 58 7.9% + 7 654607
Romania 4.4% 32 4.7% 27 4.2% - 5 731851 33 4.5% + 1 598787
Netherlands 3.8% 26 3.8% 24 3.8% - 2 707463 29 3.9% + 3 585487
Belgium 2.5% 21 3.1% 18 2.8% - 3 627214 21 2.9% 537612
Greece 2.4% 21 3.1% 17 2.7% - 4 634913 20 2.7% -1 539676
Czech R. 2.4% 21 3.1% 17 2.7% - 4 620814 20 2.7% -1 527692
Portugal 2.3% 21 3.1% 17 2.7% - 4 608314 20 2.7% -1 517067
Sweden 2.2% 20 2.9% 16 2.5% - 4 615689 19 2.6% -1 518475
Hungary 2.2% 21 3.1% 16 2.5% - 5 614405 19 2.6% -2 517394
Austria 2.0% 18 2.7% 15 2.3% - 3 580031 18 2.4% 483360
Bulgaria 1.6% 17 2.5% 13 2.0% - 4 550291 15 2.0% -2 476919
Denmark 1.3% 13 1.9% 12 1.9% - 1 475604 13 1.8% 439019
Finland 1.2% 13 1.9% 12 1.9% - 1 457276 13 1.8% 422101
Slovakia 1.2% 13 1.9% 12 1.9% - 1 452188 13 1.8% 417404
Ireland 1.0% 11 1.6% 11 1.7% 423503 12 1.6% + 1 388211
Croatia 0.9% 11 1.6% 10 1.6% - 1 419067 11 1.5% 380970
Lithuania 0.6% 11 1.6% 9 1.4% - 2 320951 9 1.2% -2 320951
Slovenia 0.5% 8 1.2% 8 1.3% 258024 8 1.1% 258024
Latvia 0.4% 8 1.2% 8 1.3% 246120 8 1.1% 246120
Estonia 0.3% 6 0.9% 7 1.1% + 1 187992 7 1.0% + 1 187992
Cyprus 0.2% 6 0.9% 6 0.9% 141387 7 1.0% + 1 121188
Luxembourg 0.1% 6 0.9% 6 0.9% 96042 6 0.8% 96042
Malta 0.1% 6 0.9% 6 0.9% 72401 6 0.8% 72401
Total 100% 678 100% 639 100% - 39 736 100% 58
Source: Bruegel based on Eurostat, European Parliament. Note: European Parliament apportionment of seats for EU27 at 1) current distribution, 2) Cambridge Compromise method with a total of 736 and 3) Cambridge Compromise method with a total of 639 seats. The table shows share of population, number of seats in each scenario, share of seats in the EP, difference to current allocation and population-to-seats ratio. Population-to-seats ratios which are not strictly increasing with population are italicised.

10 Policy Contribution | Issue n˚2 | 2017
In a European Parliament of 27 countries with 639 seats, France, Italy and Estonia would
gain seats, eight countries would be unaffected and 16 would receive fewer seats. Although
Germany’s number of MEPs would not change, its share of the European Parliament total
would increase by 2.2 percentage points (see Table A1 in the Annex for current allocation).
Romania and Hungary would lose the most, with five fewer seats each. However, Romania’s
share of the seats in the European Parliament would be unchanged, and Hungary’s share
would be 0.3 percentage points lower. The ratio of population to seats would be the same
or would fall in three instances. This is in accordance with the current definition of degres-
sive proportionality, which requires the proportion of population to seats to increase before
rounding. The apparent deviation from degressive proportionality is thus only a result of the
fact that there can be no shared MEPs across countries.
This 639-seat option would decrease the inequality of representation in the European Par-
liament by almost 20 percent. At the extremes, France, which currently has the largest number
of people per MEP, has 12.4 times more people than the country with the lowest number of
MEPs, Malta. In a 639-seat parliament, that multiple would fall to 11.8. The minimisation of
inequality of representation as measured by the Gini coefficient would thus lead in par-
ticular to an adjustment for the countries in the middle of the range – while the constraint
of a minimum of six and a maximum of 96 seats prevents adjustments for the smallest and
largest countries. In other words, the EU treaty limits the reduction of inequality that can be
achieved. Nevertheless, the reduction of inequality would lead to a Gini coefficient that would
at least be somewhat closer to the levels of inequality of representation in the French and UK
parliament, even though it would still be more than twice as large than in both cases.
Distributing seats according to the Cambridge Compromise in a Parliament with 736
seats, a third of countries would gain and seven countries would receive a smaller number
of seats. France, as the currently most underrepresented country, would receive the largest
number of additional MEPs (22) followed by Italy (16) and Spain (16). The countries that
would lose seats are Portugal, Sweden, Greece, the Czech Republic, Hungary, Bulgaria and
Lithuania. The losses in terms of shares of total European Parliament seats would be below 0.3
percentage points compared to current shares.
In this option, the 73 UK seats can, thus, be used to increase the equality of representation
of citizens in the European Parliament – reducing the measure of malapportionment – while
limiting the loss of seats to a minimum. In three cases – Greece, Hungary and Sweden – the
ratio of population to seats would not increase for more populous countries. The EU treaties
again limit the adjustment for the smallest and for the largest member states. Nevertheless,
one can achieve a reduction of the extent of malapportionment that makes the European Par-
liament somewhat more comparable to the French and UK parliament, even though inequal-
ity would still be more than twice as large, respectively.
Finally, we simulate the Andrew Duff proposal to create a transnational list to which the 73
UK seats would be allocated. This would require EU treaty change and is therefore unlikely to
be implemented but, since it is discussed in Brussels, we want to show its effects on inequality
and malapportionment. As Table 2 shows, the option would also substantially decrease ine-
quality. However, we note that if treaty change is an option, much more significant changes
in electoral equality could be achieved. The interested reader can explore various options
that would drop various EU treaty constraints via an online tool that accompanies this Policy
Contribution. However, we consider the debate in this area to be a long-term one.
In political terms, changes in seat distribution could lead to changes in the relative shares
of political groups in the European Parliament (Table 4). Without the 73 British MEPs, the
Socialists and Democrats group (S&D) would lose out while the European People’s Party
(EPP) would gain. Assuming current country-level voting patterns, it is possible to estimate
the distribution of seats between political groups in a European Parliament of 639 or 736
seats. The EPP would gain most, with increases of 2.9 and 2.7 percentage points, respectively.
The centrist Alliance of Liberals and Democrats for Europe group (ALDE) and the Greens
group would benefit from a smaller parliament in which Germany has a greater weight.

11 Policy Contribution | Issue n˚2 | 2017
Table 4: Political groups in the European Parliament assuming national percentages of votes based on the 2014 elections
Political Group Current Brexit: Drop 73 MEPs
Cambridge Compromise,
639 seats
Cambridge Compromise,
736 seats
European People’s Party (EPP)
217 28.9% 217 32.0% 203 31.8% 232 31.6%
Progressive Alliance of Socialists and Democrats (S&D)
189 25.2% 169 24.9% 159 24.9% 183 24.9%
European Conservatives and Reformists (ECR)
74 9.9% 53 7.8% 49 7.7% 56 7.6%
Alliance of Liberals and Democrats for Europe (ALDE)
68 9.1% 67 9.9% 63 9.9% 72 9.7%
United Green Left (GUE/NGL)
52 6.9% 51 7.5% 49 7.7% 56 7.7%
Greens/European Free Alliance (Greens/EFA)
50 6.7% 44 6.5% 42 6.6% 47 6.4%
Europe of Freedom and Direct Democracy (EFDD)
44 5.9% 24 3.5% 23 3.6% 28 3.8%
Europe of Nations and Freedom (ENF)
39 5.2% 38 5.6% 38 5.9% 46 6.2%
Non-attached members
18 2.4% 15 2.2% 13 2.0% 16 2.1%
Total 751 100% 678 100% 639 100% 736 100%
Source: Bruegel. Note: Distribution of seats across political groups 1) currently, 2) without the 73 British MEPs, 3) at a Cambridge Com-promise allocation with 736 seats and 4) with 639 seats. The number of seats in the latter two scenarios are approximated using voting patterns from the 2014 parliamentary election.
6 ConclusionsThe departure of the UK from the EU offers a political opportunity to change the number and
allocation of seats in the European Parliament. The European Parliament has itself called for
a reassessment and for greater equality of representation. A straightforward option would be
to drop the 73 seats currently allocated to the UK – this would also be a cost saving option, but
it would increase electoral inequality. Another option would be to share out some of the seats
between EU countries. Our two scenarios for optimal redistribution would reduce inequality
of representation in the European Parliament, as measured by the Gini coefficient and the
malapportionment coefficient, within the constraints of the EU treaties. In these scenarios,
the number of European Parliament seats would shrink by 112 or 15.
We consider it important to reform the parliament to increase equality of representa-
tion with a view to increase its legitimacy as a parliament representing EU citizens equally.
At a time when the EU budget will shrink and scepticism about EU institutions is high, the
EU should carefully explore our options. It should also consider whether a smaller parlia-
ment would be more efficient. However, within the constraints of the Treaties, only limited
increases of equality are possible so that our reform options will not fully settle the debate.
With a treaty change, equality of representation could be achieved that would render the

12 Policy Contribution | Issue n˚2 | 2017
European Parliament more comparable to a lower house in a national parliamentary context.
But we consider such treaty change and debate unlikely, which is why we have not presented
such options in this paper. We hope that our computations and the online tool will contribute
to transparency in the upcoming debate on the European Parliament, which no doubt will be
highly controversial.
ReferencesBVerfG (2009) ‘Judgement of the Second Senate of 30 June 2009, 2 BvE 2/08 - pars. (1-421)’, Bundesverfas-
sungsgericht, Karlsruhe
Charvát, J. (2015) ‘Apportionment amongst Member States and the Value of a Vote in the 2014 European
Parliamentary Elections’, Revista de Stiinte Politice no 48, pp179-190
Duff, A. (2011) ‘Report on a proposal for a modification of the Act concerning the election of the Members
of the European Parliament by direct universal suffrage of 20 September 1976’, (2009/2134(INI)).
A7–0176/2011, Committee on Constitutional Affairs, Brussels
Duff, A. (2014) ‘Foreword, in Pukelsheim, Friedrich, Proportional Representation, Springer International
Publishing, Cham, Switzerland
European Parliament (2013) ‘Composition of the European Parliament with a view to the 2014 elections’,
2012/2309(INL), European Parliament resolution of 13 March
European Parliament (2015) ‘Reform of the electoral law of the EU’, P8_TA(2015)0395, European Parlia-
ment resolution of 11 November
Fry, V. and McLean, I. (1991) ‘A note on Rose’s proportionality index’, Electoral Studies 10(1), pp. 52–59.
European Commission (2016) General budget of the European Union for the financial year 2017,
COM(2016) 300, vol 1, sec 1
Grimmett, G., Laslier, J.-F., Pukelsheim, F., Gonzalez, V. R., Rose, R., Slomczynski, W., Zachariasen, M.
and Zyczkowski, K. (2011) ‘The allocation between the EU member states of the seats in the European
Parliament Cambridge Compromise’, PE 432.760, Policy Department C - Citizens’ Rights and Consti-
tutional Affairs, European Parliament
Gualtieri, R. and Trzaskowski, R. (2013) ‘Report on the composition of the European Parliament with a
view to the 2014 elections’, A7–0041/2013, Committee on Constitutional Affairs, European Parliament
Hix, S., Hagemann, S. and Frantescu, D. (2016) ‘Would Brexit matter? The UK’s voting record in the Coun-
cil and the European Parliament’, VoteWatch Europe, Brussels
Lamassoure, A. and Severin, A. (2007) ‘Report on the composition of the European Parliament’,
A6–0351/2007, Committee on Constitutional Affairs, European Parliament
Loosemore, J. and Hanby, V. J. (1971) ‘The theoretical limits of maximum distortion: Some analytic
expressions for electoral systems’, British Journal of Political Science 1(04), pp. 467–477
Marcelino, D. (2016) ‘SciencesPo: A tool set for analyzing political behavior data’, www.CRAN.R-project.
org/package=SciencesPo, accessed 26 January 2017
Rose, R. (2012) ‘Representation in Parliamentary Democracies: The European Parliament as a Deviant
Case’, in T. Evas, U. Liebert and C. Lord (eds) Multilayered Representation in the European Union,
Nomos Verlagsgesellschaft mbH & Co. KG
Samuels, D. and Snyder, R. (2001) ‘The value of a vote: malapportionment in comparative perspective’,
British Journal of Political Science 31(04), pp. 651–671
Taagepera, R. and Grofman, B. (2003) ‘Mapping the indices of seats–votes disproportionality and
inter-election volatility’, Party Politics 9(6), pp. 659–677
Tailor A. and Véron, N. (2014) ‘How unequal is the European Parliament’s representation?’, www. voxeu.
org/article/inequality-european-parliament-representation, accessed 26 January 2017

13 Policy Contribution | Issue n˚2 | 2017
Annex
Figure A1: The European Parliament in comparison to other parliaments
Source: Bruegel.
0
2%
4%
6%
8%
10%
12%
14%
16%
18%
0
0.5%
1%
1.5%
2%
2.5%
3%
3.5%
Share of population
Share of seats
0
5%
10%
15%
20%
25%
Share of population
Share of seats
EU member states German federal states
Share of population
Share of seats
Share of population
Share of seats in Congress
US districts
Share of population
Share of House of Commons seats
0
0.5%
1%
1.5%
2%
2.5%
UK constituencies
0
1%
2%
3%
4%
5%
6%
7%
8%
Share of population
Share of seats
Italian constituencies0
0.5%
1%
1.5%
2%
2.5%
French constituencies
European Parliament German Bundestag
US House of Representatives British Parliament
Italian Chamber of Deputies French National Assembly
14 Policy Contribution | Issue n˚2 | 2017
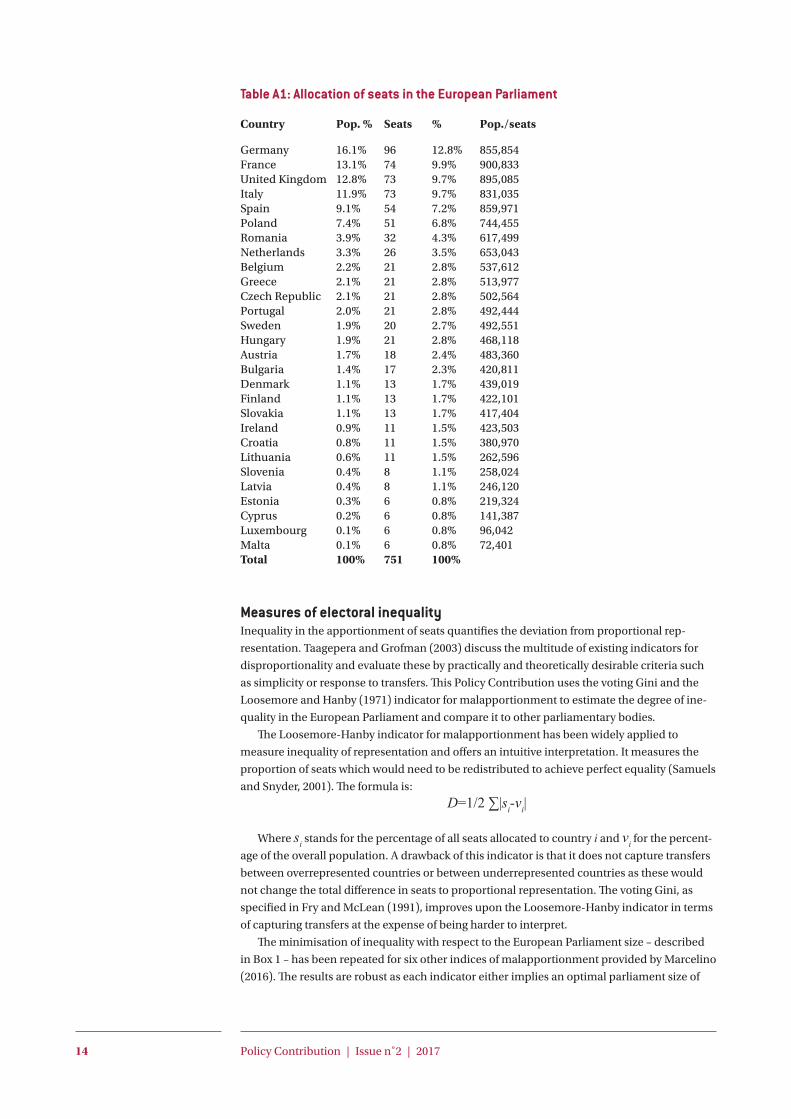
Table A1: Allocation of seats in the European Parliament Country Pop. % Seats % Pop./seats
Germany 16.1% 96 12.8% 855,854France 13.1% 74 9.9% 900,833United Kingdom 12.8% 73 9.7% 895,085Italy 11.9% 73 9.7% 831,035Spain 9.1% 54 7.2% 859,971Poland 7.4% 51 6.8% 744,455Romania 3.9% 32 4.3% 617,499Netherlands 3.3% 26 3.5% 653,043Belgium 2.2% 21 2.8% 537,612Greece 2.1% 21 2.8% 513,977Czech Republic 2.1% 21 2.8% 502,564Portugal 2.0% 21 2.8% 492,444Sweden 1.9% 20 2.7% 492,551Hungary 1.9% 21 2.8% 468,118Austria 1.7% 18 2.4% 483,360Bulgaria 1.4% 17 2.3% 420,811Denmark 1.1% 13 1.7% 439,019Finland 1.1% 13 1.7% 422,101Slovakia 1.1% 13 1.7% 417,404Ireland 0.9% 11 1.5% 423,503Croatia 0.8% 11 1.5% 380,970Lithuania 0.6% 11 1.5% 262,596Slovenia 0.4% 8 1.1% 258,024Latvia 0.4% 8 1.1% 246,120Estonia 0.3% 6 0.8% 219,324Cyprus 0.2% 6 0.8% 141,387Luxembourg 0.1% 6 0.8% 96,042Malta 0.1% 6 0.8% 72,401Total 100% 751 100%
Measures of electoral inequalityInequality in the apportionment of seats quantifies the deviation from proportional rep-
resentation. Taagepera and Grofman (2003) discuss the multitude of existing indicators for
disproportionality and evaluate these by practically and theoretically desirable criteria such
as simplicity or response to transfers. This Policy Contribution uses the voting Gini and the
Loosemore and Hanby (1971) indicator for malapportionment to estimate the degree of ine-
quality in the European Parliament and compare it to other parliamentary bodies.
The Loosemore-Hanby indicator for malapportionment has been widely applied to
measure inequality of representation and offers an intuitive interpretation. It measures the
proportion of seats which would need to be redistributed to achieve perfect equality (Samuels
and Snyder, 2001). The formula is:
D=1/2∑|si-vi|
Where si stands for the percentage of all seats allocated to country i and vi for the percent-
age of the overall population. A drawback of this indicator is that it does not capture transfers
between overrepresented countries or between underrepresented countries as these would
not change the total difference in seats to proportional representation. The voting Gini, as
specified in Fry and McLean (1991), improves upon the Loosemore-Hanby indicator in terms
of capturing transfers at the expense of being harder to interpret.
The minimisation of inequality with respect to the European Parliament size – described
in Box 1 – has been repeated for six other indices of malapportionment provided by Marcelino
(2016). The results are robust as each indicator either implies an optimal parliament size of

15 Policy Contribution | Issue n˚2 | 2017
639 or 739. The class of indicators including Loosemore-Hanby specify a linear penalty for
differences to proportionality while the class including the Gini have a larger penalty for
deviations.
Min: 639
Min: 736
Min: 639
Min: 736
Min: 639
Min: 736
Min: 639
Min: 736
LoosemoreHanby Grofman Rae Rose
Gini Cox Farina Gallagher
600
700
800
600
700
800
600
700
800
600
700
800
−0.025
0.000
0.025
0.050
−0.025
0.000
0.025
0.050
Parliament size
Dem
eane
d in
equa
lity
coeffi
cien
ts