Embed Size (px)
Citation preview
Wilshire Associates Incorporated 1299 Ocean Avenue, Suite 700
Santa Monica, CA 90401 Phone: 310-451-3051
Executive Summary of Performance Prepared For
California Public Employees’ Retirement System
Judges II Legislators’ Fund
Long-Term Care California Employers’ Retiree Benefit Trust
Health Care Fund Supplemental Income Plans
Second Quarter 2017
Item 5b, Attachment 2, Page 1 of 53
Capital Market Overview
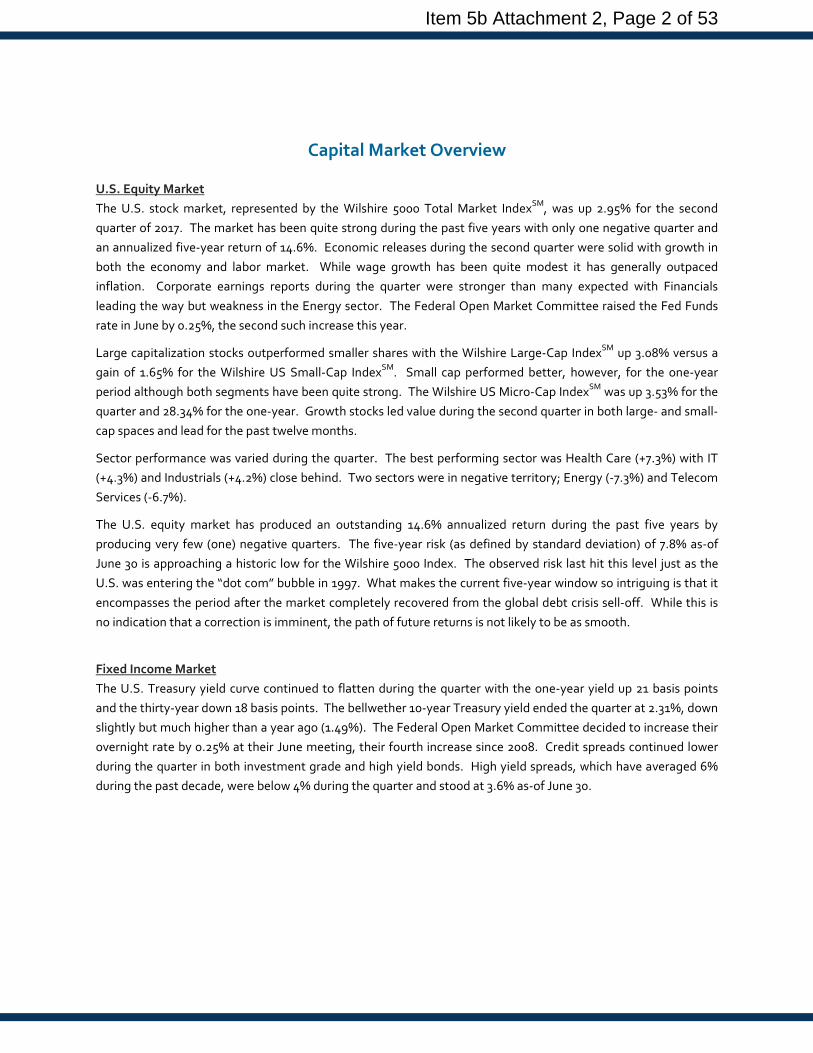
U.S. Equity Market The U.S. stock market, represented by the Wilshire 5000 Total Market IndexSM, was up 2.95% for the second quarter of 2017. The market has been quite strong during the past five years with only one negative quarter and an annualized five-year return of 14.6%. Economic releases during the second quarter were solid with growth in both the economy and labor market. While wage growth has been quite modest it has generally outpaced inflation. Corporate earnings reports during the quarter were stronger than many expected with Financials leading the way but weakness in the Energy sector. The Federal Open Market Committee raised the Fed Funds rate in June by 0.25%, the second such increase this year.
Large capitalization stocks outperformed smaller shares with the Wilshire Large-Cap IndexSM up 3.08% versus a gain of 1.65% for the Wilshire US Small-Cap IndexSM. Small cap performed better, however, for the one-year period although both segments have been quite strong. The Wilshire US Micro-Cap IndexSM was up 3.53% for the quarter and 28.34% for the one-year. Growth stocks led value during the second quarter in both large- and small-cap spaces and lead for the past twelve months.
Sector performance was varied during the quarter. The best performing sector was Health Care (+7.3%) with IT (+4.3%) and Industrials (+4.2%) close behind. Two sectors were in negative territory; Energy (-7.3%) and Telecom Services (-6.7%).
The U.S. equity market has produced an outstanding 14.6% annualized return during the past five years by producing very few (one) negative quarters. The five-year risk (as defined by standard deviation) of 7.8% as-of June 30 is approaching a historic low for the Wilshire 5000 Index. The observed risk last hit this level just as the U.S. was entering the “dot com” bubble in 1997. What makes the current five-year window so intriguing is that it encompasses the period after the market completely recovered from the global debt crisis sell-off. While this is no indication that a correction is imminent, the path of future returns is not likely to be as smooth.
Fixed Income Market The U.S. Treasury yield curve continued to flatten during the quarter with the one-year yield up 21 basis points and the thirty-year down 18 basis points. The bellwether 10-year Treasury yield ended the quarter at 2.31%, down slightly but much higher than a year ago (1.49%). The Federal Open Market Committee decided to increase their overnight rate by 0.25% at their June meeting, their fourth increase since 2008. Credit spreads continued lower during the quarter in both investment grade and high yield bonds. High yield spreads, which have averaged 6% during the past decade, were below 4% during the quarter and stood at 3.6% as-of June 30.
Item 5b Attachment 2, Page 2 of 53

Non-U.S. Markets Equity markets outside of the U.S. produced very strong returns during the second quarter of 2017, in both developed and emerging markets. The U.S. dollar continued to weaken during the quarter, providing an additional boost for U.S. investors holding foreign currencies. While economic releases out of Europe continue to improve, Britain is showing signs of struggling with Brexit; although stocks in the U.K. are still producing positive returns. Japanese equities lifted the Pacific index higher as the labor market in Japan improved during the quarter as did domestic demand and consumption. Emerging Markets are up the most in 2017 among the three major global equity market segments. Returns have been broad based with 21 of the 24 countries in the index (representing more than 95% of the market value) producing positive gains.
Real Assets Markets Real estate securities were up in the U.S. during the second quarter with a stronger return globally, due in part to a weakening dollar. Commodities were down for the quarter as crude oil fell -9.0% to $46.04 per barrel. Oil is down -14.3% for the first six months of 2017. Natural gas prices were down, as well, with a loss of -4.9%, ending the quarter at $3.04 per million BTUs. MLP returns were negative for the quarter and roughly flat for the past 12 months. Finally, gold prices were down and finished at approximately $1,242 per troy ounce, down -0.7% from last quarter.
Item 5b Attachment 2, Page 3 of 53
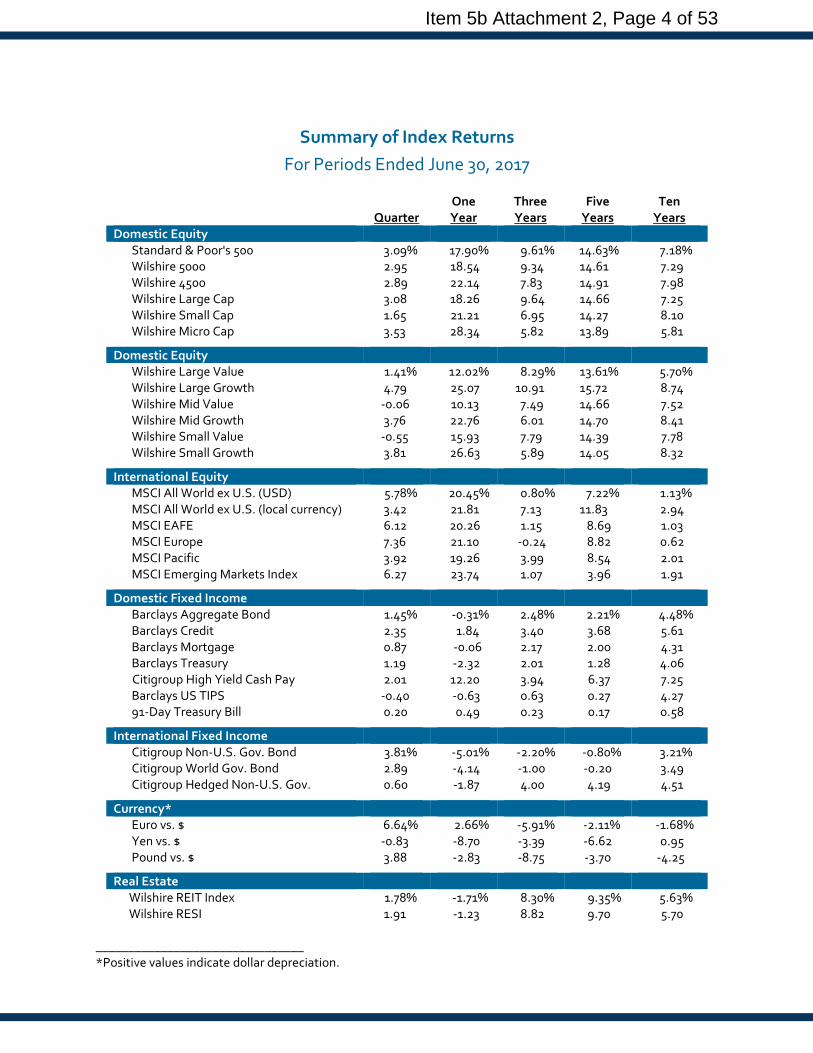
Summary of Index Returns For Periods Ended June 30, 2017
One Three Five Ten
Quarter Year Years Years Years Domestic Equity
Standard & Poor's 500 3.09% 17.90% 9.61% 14.63% 7.18% Wilshire 5000 2.95 18.54 9.34 14.61 7.29 Wilshire 4500 2.89 22.14 7.83 14.91 7.98 Wilshire Large Cap 3.08 18.26 9.64 14.66 7.25 Wilshire Small Cap 1.65 21.21 6.95 14.27 8.10 Wilshire Micro Cap 3.53 28.34 5.82 13.89 5.81
Domestic Equity Wilshire Large Value 1.41% 12.02% 8.29% 13.61% 5.70% Wilshire Large Growth 4.79 25.07 10.91 15.72 8.74 Wilshire Mid Value -0.06 10.13 7.49 14.66 7.52 Wilshire Mid Growth 3.76 22.76 6.01 14.70 8.41 Wilshire Small Value -0.55 15.93 7.79 14.39 7.78 Wilshire Small Growth 3.81 26.63 5.89 14.05 8.32
International Equity MSCI All World ex U.S. (USD) 5.78% 20.45% 0.80% 7.22% 1.13% MSCI All World ex U.S. (local currency) 3.42 21.81 7.13 11.83 2.94 MSCI EAFE 6.12 20.26 1.15 8.69 1.03 MSCI Europe 7.36 21.10 -0.24 8.82 0.62 MSCI Pacific 3.92 19.26 3.99 8.54 2.01 MSCI Emerging Markets Index 6.27 23.74 1.07 3.96 1.91
Domestic Fixed Income Barclays Aggregate Bond 1.45% -0.31% 2.48% 2.21% 4.48% Barclays Credit 2.35 1.84 3.40 3.68 5.61 Barclays Mortgage 0.87 -0.06 2.17 2.00 4.31 Barclays Treasury 1.19 -2.32 2.01 1.28 4.06 Citigroup High Yield Cash Pay 2.01 12.20 3.94 6.37 7.25
Barclays US TIPS -0.40 -0.63 0.63 0.27 4.27 91-Day Treasury Bill 0.20 0.49 0.23 0.17 0.58
International Fixed Income Citigroup Non-U.S. Gov. Bond 3.81% -5.01% -2.20% -0.80% 3.21% Citigroup World Gov. Bond 2.89 -4.14 -1.00 -0.20 3.49 Citigroup Hedged Non-U.S. Gov. 0.60 -1.87 4.00 4.19 4.51
Currency* Euro vs. $ 6.64% 2.66% -5.91% -2.11% -1.68% Yen vs. $ -0.83 -8.70 -3.39 -6.62 0.95 Pound vs. $ 3.88 -2.83 -8.75 -3.70 -4.25
Real Estate Wilshire REIT Index 1.78% -1.71% 8.30% 9.35% 5.63% Wilshire RESI 1.91 -1.23 8.82 9.70 5.70
________________________________ *Positive values indicate dollar depreciation.
Item 5b Attachment 2, Page 4 of 53

Summary Review of Plans Periods Ended 6/30/2017
Market Value Qtr 1-Year 3-Year 5-Year 10-YearTOTAL FUND for PERF $323.5 bil 3.0% 11.2% 4.6% 8.8% 4.4%Total Fund Policy Benchmark 1 3.2% 11.3% 4.9% 8.6% 5.6%Actuarial Rate 1.8% 7.5% 7.5% 7.5% 7.6%Affiliate Funds
Judges I $44.3 mil 0.2% 0.7% 0.4% 0.3% 0.7%91-Day Treasury Bill 0.2% 0.5% 0.2% 0.2% 0.6%
Judges II $1,341.2 mil 3.0% 9.6% 3.6% 8.2% 5.1%Weighted Policy Benchmark 3.0% 9.0% 3.4% 7.9% 5.0%
Legislators' Retirement System $116.6 mil 1.9% 4.4% 2.8% 5.4% 5.3%Weighted Policy Benchmark 1.9% 3.8% 2.5% 4.9% 5.0%
Long-Term Care ("LTC") $4,375.6 mil 2.1% 1.6% 2.0% 3.9% 3.6%Weighted Policy Benchmark 1.9% 1.5% 1.8% 3.7% 3.5%
CERBT Strategy 1 $5,655.3 mil 3.1% 10.6% 3.7% 8.1% 4.6%CERBT Strategy 1 Policy Benchmark 3.0% 9.9% 3.2% 7.7% 4.2%
CERBT Strategy 2 $880.3 mil 2.7% 7.2% 3.2% 6.7% -.-%CERBT Strategy 2 Policy Benchmark 2.6% 6.5% 2.8% 6.3% -.-%
CERBT Strategy 3 $260.6 mil 1.9% 4.1% 2.7% 5.2% -.-%CERBT Strategy 3 Policy Benchmark 1.8% 3.5% 2.3% 4.7% -.-%
Health Care Fund $444.7 mil 1.4% -0.3% 2.7% 2.8% 4.7%Barclays U.S. Aggregate 1.4% -0.3% 2.5% 2.2% 4.5%
Supplemental Contribution Plan $114.4 mil 2.2% 6.3% 2.7% 5.7% -.-%CalPERS Custom SCP Plan Index 2.2% 6.6% 3.0% 6.1% -.-%
457 Program $1,397.7 mil 2.5% 10.4% 4.4% 7.6% 4.2%CalPERS Custom 457 Plan Index 2.5% 10.7% 4.7% 8.0% 4.6%
1
1 The Total Fund Policy Benchmark return equals the return for each asset class benchmark weighted at the current target asset allocation.
Item 5b Attachment 2, Page 5 of 53
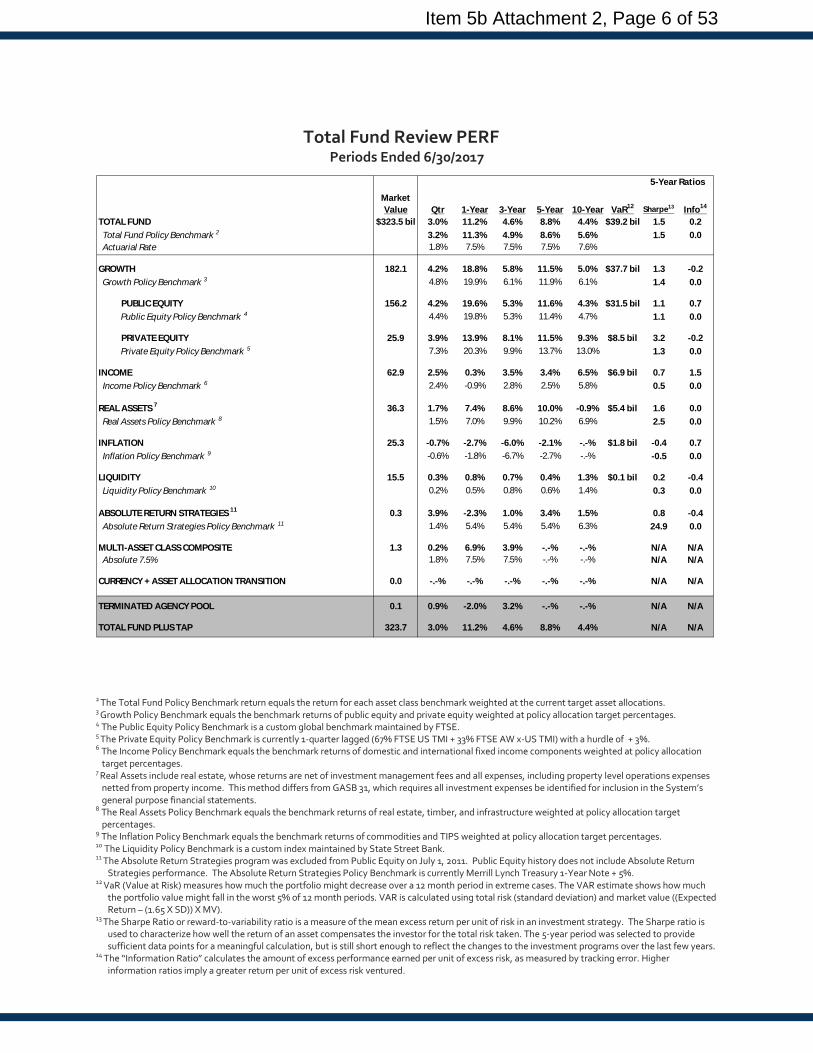
Total Fund Review PERF21 Periods Ended 6/30/2017
Market Value Qtr 1-Year 3-Year 5-Year 10-Year VaR12 Sharpe13 Info14
TOTAL FUND $323.5 bil 3.0% 11.2% 4.6% 8.8% 4.4% $39.2 bil 1.5 0.2Total Fund Policy Benchmark 2 3.2% 11.3% 4.9% 8.6% 5.6% 1.5 0.0Actuarial Rate 1.8% 7.5% 7.5% 7.5% 7.6%
GROWTH 182.1 4.2% 18.8% 5.8% 11.5% 5.0% $37.7 bil 1.3 -0.2Growth Policy Benchmark 3 4.8% 19.9% 6.1% 11.9% 6.1% 1.4 0.0
PUBLIC EQUITY 156.2 4.2% 19.6% 5.3% 11.6% 4.3% $31.5 bil 1.1 0.7Public Equity Policy Benchmark 4 4.4% 19.8% 5.3% 11.4% 4.7% 1.1 0.0
PRIVATE EQUITY 25.9 3.9% 13.9% 8.1% 11.5% 9.3% $8.5 bil 3.2 -0.2Private Equity Policy Benchmark 5 7.3% 20.3% 9.9% 13.7% 13.0% 1.3 0.0
INCOME 62.9 2.5% 0.3% 3.5% 3.4% 6.5% $6.9 bil 0.7 1.5Income Policy Benchmark 6 2.4% -0.9% 2.8% 2.5% 5.8% 0.5 0.0
REAL ASSETS 7 36.3 1.7% 7.4% 8.6% 10.0% -0.9% $5.4 bil 1.6 0.0Real Assets Policy Benchmark 8 1.5% 7.0% 9.9% 10.2% 6.9% 2.5 0.0
INFLATION 25.3 -0.7% -2.7% -6.0% -2.1% -.-% $1.8 bil -0.4 0.7Inflation Policy Benchmark 9 -0.6% -1.8% -6.7% -2.7% -.-% -0.5 0.0
LIQUIDITY 15.5 0.3% 0.8% 0.7% 0.4% 1.3% $0.1 bil 0.2 -0.4Liquidity Policy Benchmark 10 0.2% 0.5% 0.8% 0.6% 1.4% 0.3 0.0
ABSOLUTE RETURN STRATEGIES 11 0.3 3.9% -2.3% 1.0% 3.4% 1.5% 0.8 -0.4Absolute Return Strategies Policy Benchmark 11 1.4% 5.4% 5.4% 5.4% 6.3% 24.9 0.0
MULTI-ASSET CLASS COMPOSITE 1.3 0.2% 6.9% 3.9% -.-% -.-% N/A N/AAbsolute 7.5% 1.8% 7.5% 7.5% -.-% -.-% N/A N/A
CURRENCY + ASSET ALLOCATION TRANSITION 0.0 -.-% -.-% -.-% -.-% -.-% N/A N/A
TERMINATED AGENCY POOL 0.1 0.9% -2.0% 3.2% -.-% -.-% N/A N/A
TOTAL FUND PLUS TAP 323.7 3.0% 11.2% 4.6% 8.8% 4.4% N/A N/A
5-Year Ratios
2 The Total Fund Policy Benchmark return equals the return for each asset class benchmark weighted at the current target asset allocations. 3 Growth Policy Benchmark equals the benchmark returns of public equity and private equity weighted at policy allocation target percentages. 4 The Public Equity Policy Benchmark is a custom global benchmark maintained by FTSE. 5 The Private Equity Policy Benchmark is currently 1-quarter lagged (67% FTSE US TMI + 33% FTSE AW x-US TMI) with a hurdle of + 3%. 6 The Income Policy Benchmark equals the benchmark returns of domestic and international fixed income components weighted at policy allocation
target percentages. 7 Real Assets include real estate, whose returns are net of investment management fees and all expenses, including property level operations expenses
netted from property income. This method differs from GASB 31, which requires all investment expenses be identified for inclusion in the System’s general purpose financial statements.
8 The Real Assets Policy Benchmark equals the benchmark returns of real estate, timber, and infrastructure weighted at policy allocation target percentages.
9 The Inflation Policy Benchmark equals the benchmark returns of commodities and TIPS weighted at policy allocation target percentages. 10 The Liquidity Policy Benchmark is a custom index maintained by State Street Bank. 11 The Absolute Return Strategies program was excluded from Public Equity on July 1, 2011. Public Equity history does not include Absolute Return
Strategies performance. The Absolute Return Strategies Policy Benchmark is currently Merrill Lynch Treasury 1-Year Note + 5%. 12 VaR (Value at Risk) measures how much the portfolio might decrease over a 12 month period in extreme cases. The VAR estimate shows how much
the portfolio value might fall in the worst 5% of 12 month periods. VAR is calculated using total risk (standard deviation) and market value ((Expected Return – (1.65 X SD)) X MV).
13 The Sharpe Ratio or reward-to-variability ratio is a measure of the mean excess return per unit of risk in an investment strategy. The Sharpe ratio is used to characterize how well the return of an asset compensates the investor for the total risk taken. The 5-year period was selected to provide sufficient data points for a meaningful calculation, but is still short enough to reflect the changes to the investment programs over the last few years.
14 The “Information Ratio” calculates the amount of excess performance earned per unit of excess risk, as measured by tracking error. Higher information ratios imply a greater return per unit of excess risk ventured.
Item 5b Attachment 2, Page 6 of 53
Total Fund Review for PERF (continued) Periods Ended 6/30/2017
Total Fund Flow
Total Fund Market Value
$100
$125
$150
$175
$200
$225
$250
$275
$300
$325
$350
Jun-
07
Sep-
07
Dec-
07
Mar
-08
Jun-
08
Sep-
08
Dec-
08
Mar
-09
Jun-
09
Sep-
09
Dec-
09
Mar
-10
Jun-
10
Sep-
10
Dec-
10
Mar
-11
Jun-
11
Sep-
11
Dec-
11
Mar
-12
Jun-
12
Sep-
12
Dec-
12
Mar
-13
Jun-
13
Sep-
13
Dec-
13
Mar
-14
Jun-
14
Sep-
14
Dec-
14
Mar
-15
Jun-
15
Sep-
15
Dec-
15
Mar
-16
Jun-
16
Sep-
16
Dec-
16
Mar
-17
Jun-
17
CalPERS
Asset Allocation
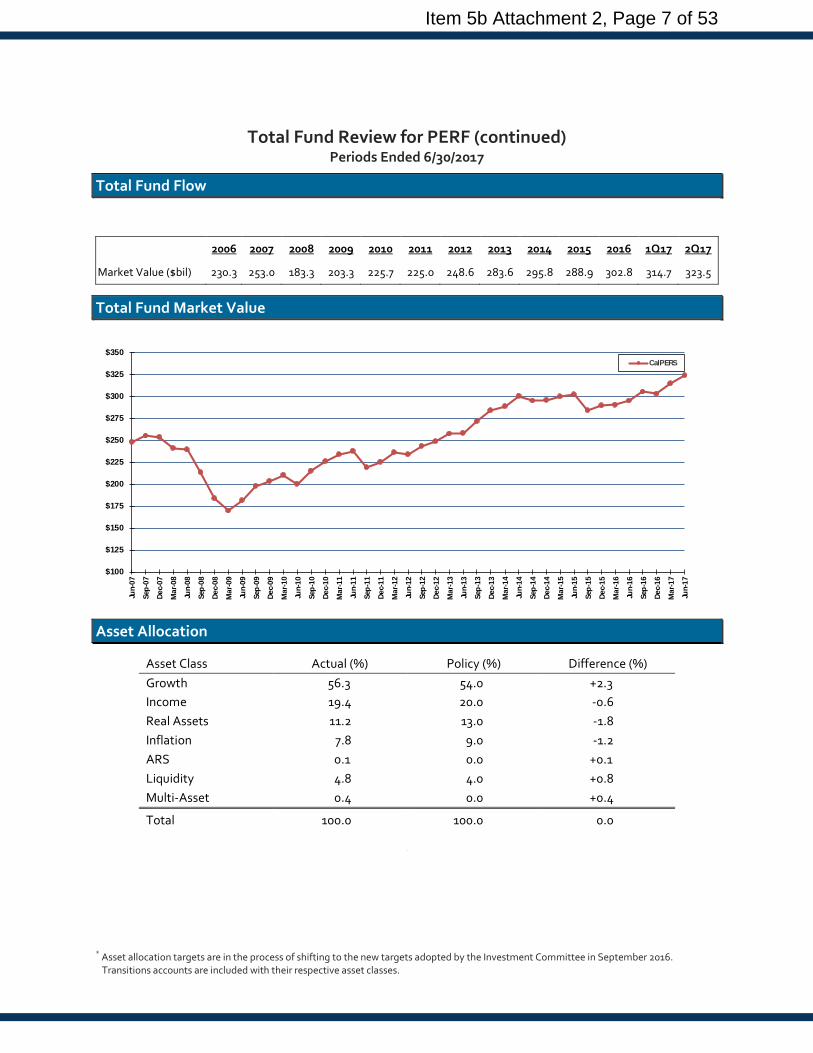
Asset Class Actual (%) Policy (%) Difference (%) Growth 56.3 54.0 +2.3 Income 19.4 20.0 -0.6 Real Assets 11.2 13.0 -1.8 Inflation 7.8 9.0 -1.2 ARS 0.1 0.0 +0.1 Liquidity 4.8 4.0 +0.8 Multi-Asset 0.4 0.0 +0.4
Total 100.0 100.0 0.0 *
* Asset allocation targets are in the process of shifting to the new targets adopted by the Investment Committee in September 2016. Transitions accounts are included with their respective asset classes.
2006 2007 2008 2009 2010 2011 2012 2013 2014 2015 2016 1Q17 2Q17
Market Value ($bil) 230.3 253.0 183.3 203.3 225.7 225.0 248.6 283.6 295.8 288.9 302.8 314.7 323.5
Item 5b Attachment 2, Page 7 of 53

Total Fund Review for PERF (continued) Periods Ended 6/30/2017
Expected Return/Risk and Tracking Error based on Wilshire’s Asset Class Assumptions
6.09% 6.11%7.41% 7.41%
11.43% 11.65%
0.36%0.0%
5.0%
10.0%
15.0%
Target Allocation Actual AllocationExpected Return - 10 Yr Expected Return - 30 Yr
Expected Risk Expected Allocation Based TE
Total Fund Asset Allocation
54.0%
20.0%
13.0%
9.0% 4.0%0.0%
Target Asset Allocation
Growth
Income
Real Assets
Inflation
Liquidity
ARS + Multi-Asset
56.3%19.4%
11.2%7.8%
4.8% 0.5%
Actual Asset Allocation
Growth
Income
Real Assets
Inflation
Liquidity
ARS + Multi-Asset
2.27%
-0.57%
-1.78%-1.19%
0.79%0.48%
-3.0%
-2.0%
-1.0%
0.0%
1.0%
2.0%
3.0%
Growth Income Real Assets Inflation Liquidity ARS + Multi-Asset
CalPERS Asset Allocation Variance
83.33%
1.70% 4.74% 5.24%
-0.15%
5.13%
-20.0%
0.0%
20.0%
40.0%
60.0%
80.0%
100.0%
Growth Income Real Assets Inflation Liquidity ARS + Multi-Asset
Contribution to TF Tracking Error
Item 5b Attachment 2, Page 8 of 53
Total Fund Review for PERF (continued) Periods Ended 6/30/2017
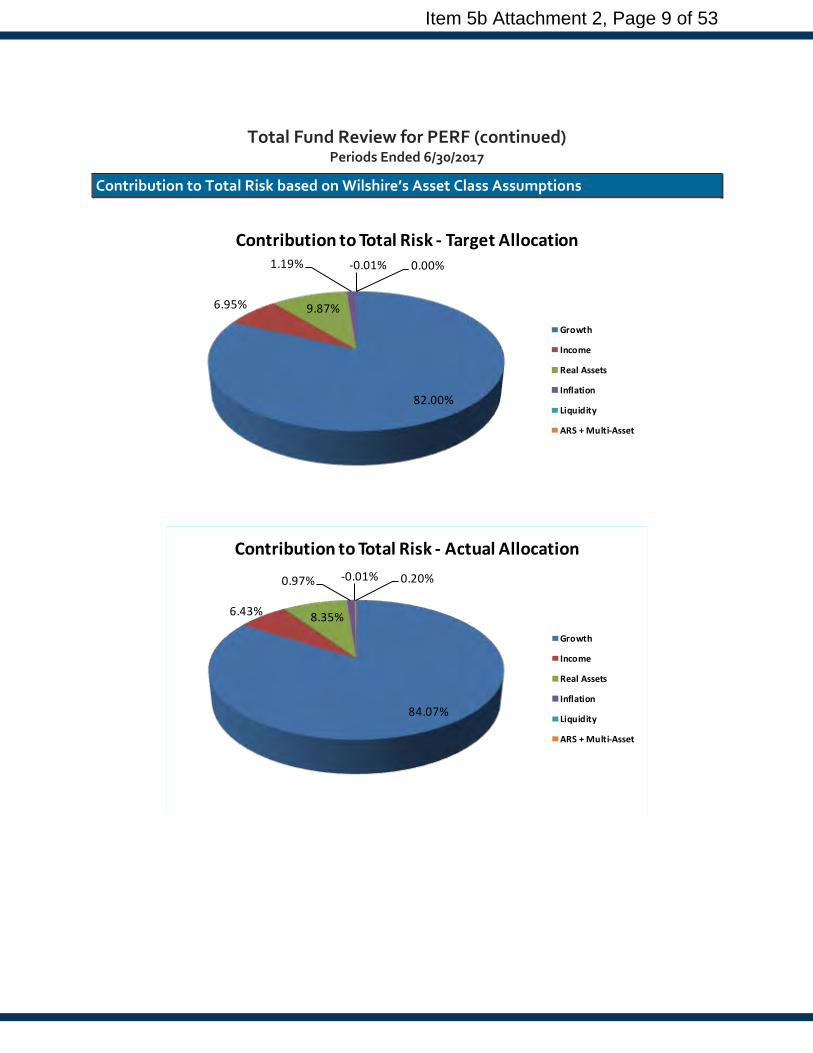
Contribution to Total Risk based on Wilshire’s Asset Class Assumptions
82.00%
6.95% 9.87%
1.19% -0.01% 0.00%
Contribution to Total Risk - Target Allocation
Growth
Income
Real Assets
Inflation
Liquidity
ARS + Multi-Asset
84.07%
6.43% 8.35%
0.97% -0.01% 0.20%
Contribution to Total Risk - Actual Allocation
Growth
Income
Real Assets
Inflation
Liquidity
ARS + Multi-Asset
Item 5b Attachment 2, Page 9 of 53
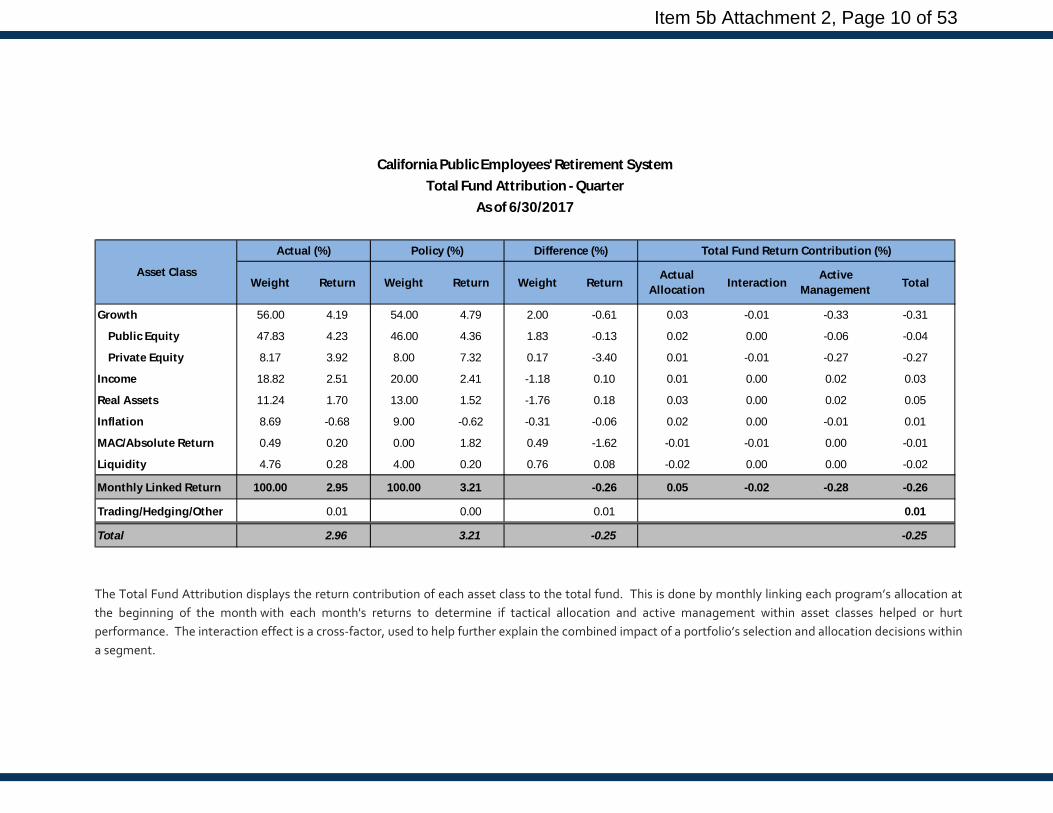
Growth 56.00 4.19 54.00 4.79 2.00 -0.61 0.03 -0.01 -0.33 -0.31
Public Equity 47.83 4.23 46.00 4.36 1.83 -0.13 0.02 0.00 -0.06 -0.04
Private Equity 8.17 3.92 8.00 7.32 0.17 -3.40 0.01 -0.01 -0.27 -0.27
Income 18.82 2.51 20.00 2.41 -1.18 0.10 0.01 0.00 0.02 0.03
Real Assets 11.24 1.70 13.00 1.52 -1.76 0.18 0.03 0.00 0.02 0.05
Inflation 8.69 -0.68 9.00 -0.62 -0.31 -0.06 0.02 0.00 -0.01 0.01
MAC/Absolute Return 0.49 0.20 0.00 1.82 0.49 -1.62 -0.01 -0.01 0.00 -0.01
Liquidity 4.76 0.28 4.00 0.20 0.76 0.08 -0.02 0.00 0.00 -0.02
Monthly Linked Return 100.00 2.95 100.00 3.21 -0.26 0.05 -0.02 -0.28 -0.26
Trading/Hedging/Other 0.01 0.00 0.01 0.01
Total 2.96 3.21 -0.25 -0.25
Total Fund Attribution - QuarterAs of 6/30/2017
Asset Class
Actual (%) Policy (%) Difference (%) Total Fund Return Contribution (%)
Weight Return Weight Return Weight Return Actual Allocation Interaction Active
Management Total
California Public Employees' Retirement System
The Total Fund Attribution displays the return contribution of each asset class to the total fund. This is done by monthly linking each program’s allocation at the beginning of the month with each month's returns to determine if tactical allocation and active management within asset classes helped or hurt performance. The interaction effect is a cross-factor, used to help further explain the combined impact of a portfolio’s selection and allocation decisions within a segment.
Item 5b Attachment 2, Page 10 of 53

Growth 56.06 10.59 54.00 11.33 2.06 -0.74 0.08 -0.01 -0.38 -0.32
Public Equity 47.81 11.12 46.00 11.43 1.81 -0.31 0.07 -0.01 -0.14 -0.07
Private Equity 8.26 7.58 8.00 10.61 0.26 -3.04 0.00 0.00 -0.25 -0.25
Income 18.79 4.38 20.00 3.87 -1.21 0.52 0.04 -0.01 0.11 0.14
Real Assets 11.00 3.80 13.00 3.30 -2.00 0.50 0.07 -0.01 0.07 0.13
Inflation 9.04 -0.98 9.00 -0.78 0.04 -0.21 0.00 0.00 -0.02 -0.02
MAC/Absolute Return 0.49 4.42 0.00 3.68 0.49 0.74 -0.02 0.00 0.00 -0.01
Liquidity 4.62 0.47 4.00 0.31 0.62 0.16 -0.04 0.00 0.01 -0.03
Monthly Linked Return 100.00 7.07 100.00 7.19 -0.11 0.13 -0.02 -0.22 -0.11
Trading/Hedging/Other 0.00 0.00 0.00 0.00
Total 7.07 7.19 -0.12 -0.12
Weight Return Actual Allocation Interaction Active
Management Total
As of 6/30/2017
Asset Class
Actual (%) Policy (%) Difference (%) Total Fund Return Contribution (%)
Weight Return Weight Return
California Public Employees' Retirement SystemTotal Fund Attribution - Calendar Year-to-Date
The Total Fund Attribution displays the return contribution of each asset class to the total fund. This is done by monthly linking each program’s allocation at the beginning of the month with each month's returns to determine if tactical allocation and active management within asset classes helped or hurt performance. The interaction effect is a cross-factor, used to help further explain the combined impact of a portfolio’s selection and allocation decisions within a segment.
Item 5b Attachment 2, Page 11 of 53
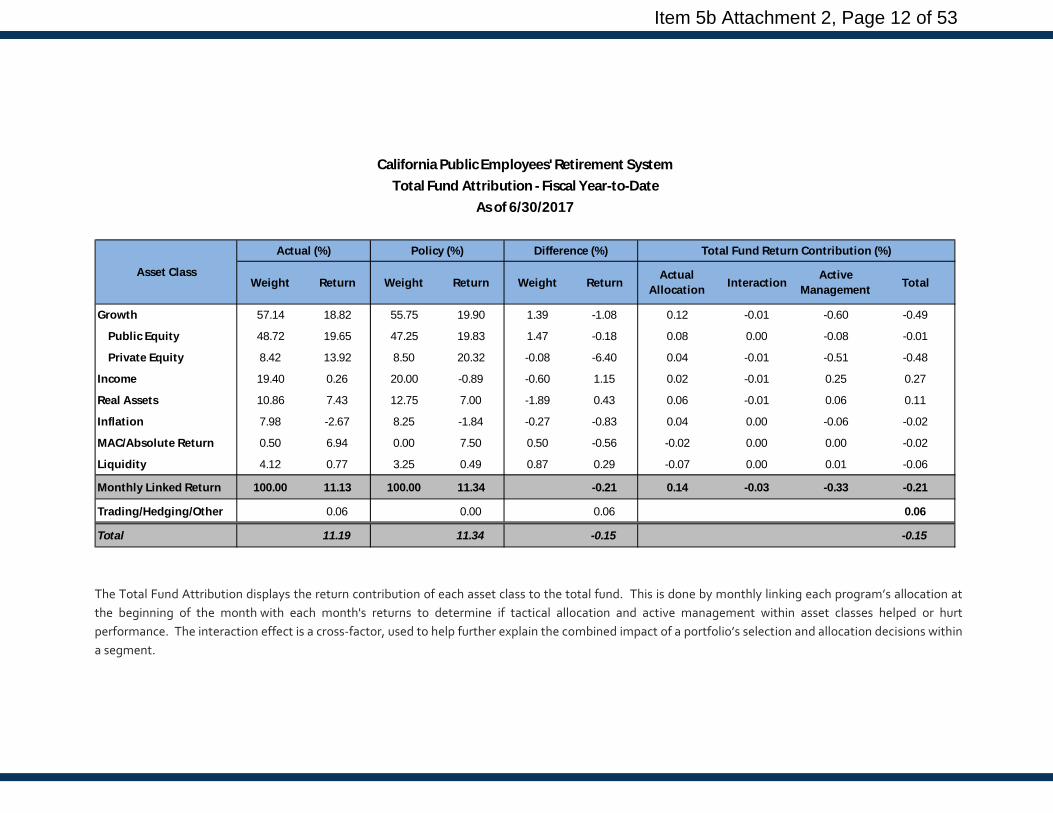
Growth 57.14 18.82 55.75 19.90 1.39 -1.08 0.12 -0.01 -0.60 -0.49
Public Equity 48.72 19.65 47.25 19.83 1.47 -0.18 0.08 0.00 -0.08 -0.01
Private Equity 8.42 13.92 8.50 20.32 -0.08 -6.40 0.04 -0.01 -0.51 -0.48
Income 19.40 0.26 20.00 -0.89 -0.60 1.15 0.02 -0.01 0.25 0.27
Real Assets 10.86 7.43 12.75 7.00 -1.89 0.43 0.06 -0.01 0.06 0.11
Inflation 7.98 -2.67 8.25 -1.84 -0.27 -0.83 0.04 0.00 -0.06 -0.02
MAC/Absolute Return 0.50 6.94 0.00 7.50 0.50 -0.56 -0.02 0.00 0.00 -0.02
Liquidity 4.12 0.77 3.25 0.49 0.87 0.29 -0.07 0.00 0.01 -0.06
Monthly Linked Return 100.00 11.13 100.00 11.34 -0.21 0.14 -0.03 -0.33 -0.21
Trading/Hedging/Other 0.06 0.00 0.06 0.06
Total 11.19 11.34 -0.15 -0.15
California Public Employees' Retirement SystemTotal Fund Attribution - Fiscal Year-to-Date
As of 6/30/2017
Asset Class
Actual (%) Policy (%) Difference (%) Total Fund Return Contribution (%)
Weight Return Active Management TotalWeight Return Weight Return Actual
Allocation Interaction
The Total Fund Attribution displays the return contribution of each asset class to the total fund. This is done by monthly linking each program’s allocation at the beginning of the month with each month's returns to determine if tactical allocation and active management within asset classes helped or hurt performance. The interaction effect is a cross-factor, used to help further explain the combined impact of a portfolio’s selection and allocation decisions within a segment.
Item 5b Attachment 2, Page 12 of 53

Total Fund Review for PERF (continued) Periods Ended 6/30/2017
♦ The California Public Employees’ Retirement System (“CalPERS, the System”) generated a total fund return of 2.96%, for the quarter ended June 30, 2017. CalPERS’ return can be attributed as follows:
3.21% Strategic Policy Allocation 0.05% Actual/Tactical Asset Allocation -0.28% Active Management -0.02% Interaction 0.01% Trading/Currency Hedging 2.96% Total Return
♦ The total fund attribution table on the previous page displays the return contribution of each asset class to
the total fund. This table will allow the Board to see if tactical allocation and active management within asset classes helped or hurt performance during the quarter.
− Strategic Policy: The contribution to total return from each asset class, calculated as the percentage allocated to each asset class multiplied by the benchmark for that asset class.
− Actual Allocation: The return contribution during the quarter due to differences in the actual allocation from the policy allocation (i.e. the actual allocation to total equity was higher than the policy allocation). A positive number would indicate an overweight benefited performance and vice versa.
− Active Management: The return contribution from active management. The number would be positive if the asset class outperformed the designated policy index and vice versa (i.e. the US fixed income segment outperformed its custom benchmark during the quarter and contributed positively to active management.
− Interaction: Captures the interaction of managers’ performance and asset class weighting differences.
− Actual Return: The actual return of the asset classes if allocations to them were static during the quarter. These returns will not match exactly with the actual segment returns since asset class allocations change during the quarter due to market movement, cash flows, etc.
♦ The cautious but steady pace of investment performance experienced by CalPERS to open the year largely carried unchanged into the second quarter, where the System concluded with a modest-sized 3.0% total return. When compared to CalPERS’ strategic policy benchmark, this represented a small miss of -25 bps. Similar to what was observed in recent past, asset allocation variance continued to play a minimum role in influencing the plan’s overall performance: it added just 5 bps during the second quarter mainly due to smaller-than-target exposure to the softer performing asset classes such as Real Assets and Inflation. The active management component was the primary performance driver for Q2, posting a -28 bps detraction that was weighed down by underperformance from both of the Growth segment’s public and private equity portfolios.
Item 5b Attachment 2, Page 13 of 53
Total Fund Review for PERF (continued) Periods Ended 6/30/2017
Relative to the Total Fund Policy Benchmark:
♦ Growth Exposure: Within the confines of steady global expansion, stable inflation outlook and measured changes in monetary policies among major world economies, investment landscape remained conducive for risk assets during the second quarter. The Growth composite did not disappoint under this favorable condition, finishing the period with a 4.2% return that also paced CalPERS’ major asset classes for the fourth consecutive quarter. Q2’s solid performance easily topped the total fund policy benchmark by 98 bps, although it did miss the composite’s own policy benchmark of 4.8% by a modest margin. Within Growth, both the public and private equity components benefited from the risk-on sentiment and recorded welcoming gains of 4.2% and 3.9%, respectively. However, both components also missed their respective benchmarks, which in turn contributed to the Growth composite’s relative underperformance this quarter.
♦ Income Exposure: Yield movements during the second quarter of 2017 were beneficial to most fixed income investments, and allowed the Income composite to sustain its rebound from last November’s post-election shock selloff. With policy disappointment in the U.S. dampening growth expectations and leading to a drop in long-term rates, and yield-hunting global investors driving a further narrowing in credit spreads, the Income composite rode this favorable macro condition to conclude the quarter up 2.5%. This performance didn’t quite match the total fund policy benchmark’s 3.2% pace, but it did fare well to the Income policy benchmark (2.4%), and represented the composite’s strongest quarterly output over the past year. For Q2, the two main components within Income both reported solid results; this was led by the international fixed income portfolio’s 4.4% advance, followed by the U.S. fixed income portfolio’s 2.3% total return.
♦ Real Assets Exposure: Performance of the Real Assets asset class has been consistent over the years due to the generally slow-but-steady nature of the underlying investment portfolios, which include private real estate, forestland, and infrastructure. Quarterly returns of Real Assets has averaged in the high 1% range over the past year, and this trend continued into Q2 of 2017 where CalPERS’ real assets investments generated an overall gain of 1.7%. This performance came in below total fund policy benchmark’s 3.2% return, but at the asset class level did compare favorably to Real Assets’ own benchmark return of 1.5%.
♦ Inflation Exposure: Weighed down by declining commodity prices, performance of the Inflation program was soft in the second quarter of 2017 as this was the only major PERS asset class to finish in the red. Inflation’s -0.7% Q2 decline, while minor in absolute terms, was an obvious laggard when compared to the 3.2% gain of the total fund policy; it missed the Inflation asset class benchmark by a small margin as well.
♦ Liquidity: The Liquidity composite saw a very small but positive gain of 0.3% this quarter, coming in below the total fund policy benchmark but was ahead of its own asset class benchmark. Starting Q3 2015, the composite is solely comprised of short term investment funds.
♦ Multi-Asset Class Composite: Results of the System’s Multi-Asset Class program (MAC) was muted for Q2, as it generated a meager 0.2% overall gain that trailed both the total fund policy benchmark as well as the program’s own absolute 7.5% objective.
Item 5b Attachment 2, Page 14 of 53
Growth Review for PERF16 Periods Ended 6/30/2017
Growth Allocation
Asset Allocation: Actual versus Target Weights
Asset Class
Actual Asset Allocation
Target Asset Allocation
Difference
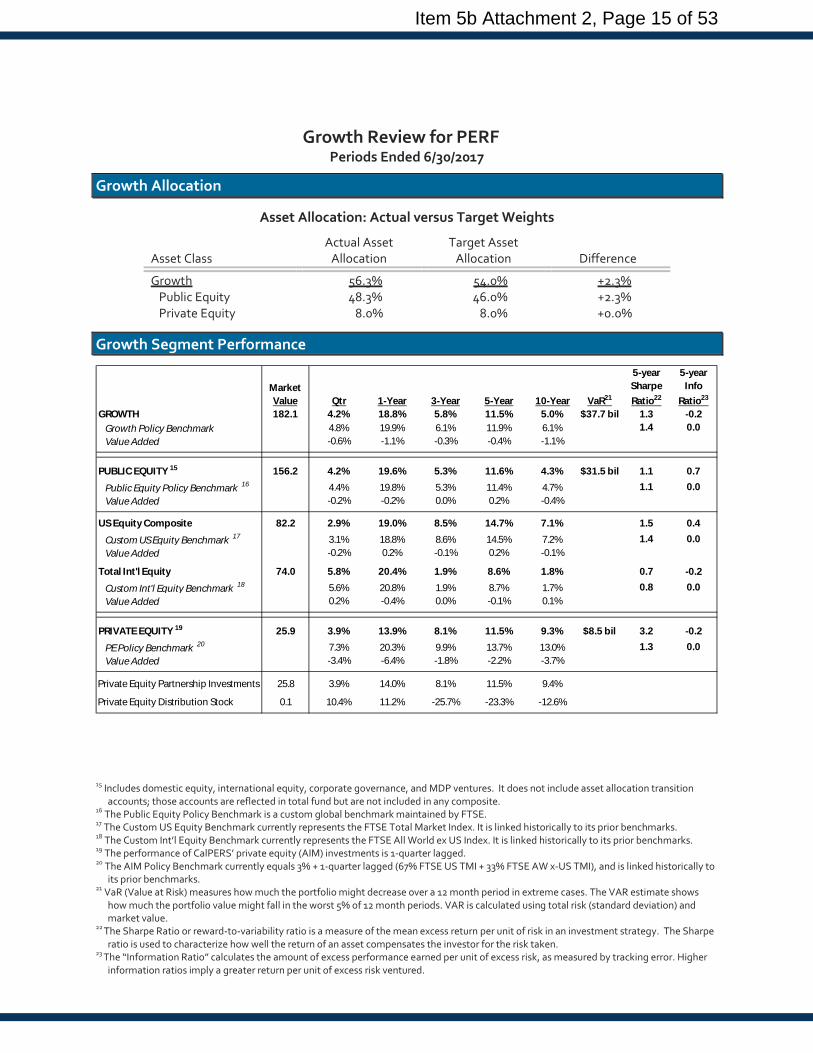
Growth 56.3% 54.0% +2.3% Public Equity 48.3% 46.0% +2.3% Private Equity 8.0% 8.0% +0.0%
Growth Segment Performance
Market Value Qtr 1-Year 3-Year 5-Year 10-Year VaR21
5-year Sharpe Ratio22
5-year Info
Ratio23
GROWTH 182.1 4.2% 18.8% 5.8% 11.5% 5.0% $37.7 bil 1.3 -0.2Growth Policy Benchmark 4.8% 19.9% 6.1% 11.9% 6.1% 1.4 0.0Value Added -0.6% -1.1% -0.3% -0.4% -1.1%
PUBLIC EQUITY 15 156.2 4.2% 19.6% 5.3% 11.6% 4.3% $31.5 bil 1.1 0.7Public Equity Policy Benchmark 16 4.4% 19.8% 5.3% 11.4% 4.7% 1.1 0.0Value Added -0.2% -0.2% 0.0% 0.2% -0.4%
US Equity Composite 82.2 2.9% 19.0% 8.5% 14.7% 7.1% 1.5 0.4Custom US Equity Benchmark 17 3.1% 18.8% 8.6% 14.5% 7.2% 1.4 0.0Value Added -0.2% 0.2% -0.1% 0.2% -0.1%
Total Int'l Equity 74.0 5.8% 20.4% 1.9% 8.6% 1.8% 0.7 -0.2Custom Int'l Equity Benchmark 18 5.6% 20.8% 1.9% 8.7% 1.7% 0.8 0.0Value Added 0.2% -0.4% 0.0% -0.1% 0.1%
PRIVATE EQUITY 19 25.9 3.9% 13.9% 8.1% 11.5% 9.3% $8.5 bil 3.2 -0.2PE Policy Benchmark 20 7.3% 20.3% 9.9% 13.7% 13.0% 1.3 0.0Value Added -3.4% -6.4% -1.8% -2.2% -3.7%
Private Equity Partnership Investments 25.8 3.9% 14.0% 8.1% 11.5% 9.4%
Private Equity Distribution Stock 0.1 10.4% 11.2% -25.7% -23.3% -12.6%
15 Includes domestic equity, international equity, corporate governance, and MDP ventures. It does not include asset allocation transition accounts; those accounts are reflected in total fund but are not included in any composite.
16 The Public Equity Policy Benchmark is a custom global benchmark maintained by FTSE. 17 The Custom US Equity Benchmark currently represents the FTSE Total Market Index. It is linked historically to its prior benchmarks. 18 The Custom Int’l Equity Benchmark currently represents the FTSE All World ex US Index. It is linked historically to its prior benchmarks. 19 The performance of CalPERS’ private equity (AIM) investments is 1-quarter lagged. 20 The AIM Policy Benchmark currently equals 3% + 1-quarter lagged (67% FTSE US TMI + 33% FTSE AW x-US TMI), and is linked historically to
its prior benchmarks. 21 VaR (Value at Risk) measures how much the portfolio might decrease over a 12 month period in extreme cases. The VAR estimate shows
how much the portfolio value might fall in the worst 5% of 12 month periods. VAR is calculated using total risk (standard deviation) and market value.
22 The Sharpe Ratio or reward-to-variability ratio is a measure of the mean excess return per unit of risk in an investment strategy. The Sharpe ratio is used to characterize how well the return of an asset compensates the investor for the risk taken.
23 The “Information Ratio” calculates the amount of excess performance earned per unit of excess risk, as measured by tracking error. Higher information ratios imply a greater return per unit of excess risk ventured.
Item 5b Attachment 2, Page 15 of 53

Growth Review for PERF (continued)
Comments Regarding Growth Segment Performance Helped Performance: ♦ International Equity Exposure: Performance in the international equity space has outstripped domestic
equity thus far in 2017, thanks to good corporate earnings, low inflation pressure, and continued signs of economic growth. With U.S.-based investors receiving an additional level of boost through the weakening of the dollar, PERS’ international equity composite finished the second quarter on a very strong note, jumping 5.8%. This output was double the pace of the domestic equity composite, and squarely beat the Growth policy benchmark’s 4.8% return. Results within the international equity segment were fairly even, with the larger-sized internally managed composite netting a 5.9% gain while the smaller externally managed composite was up 5.5%.
♦ Corporate Governance: Also benefiting from the buoyant sentiment in public traded equities, the corporate governance program saw its performance jump 8.0% in the second quarter and added value relative to the Growth policy benchmark. The process of reducing/winding down of some of the corporate governance portfolios remains on-going.
Impeded Performance: ♦ U.S. Equity Exposure: The overall investment landscape of the U.S. equity market remained quite positive
in the second quarter, primarily supported by continued jobs growth and strong corporate earnings. However, the domestic market’s advance was reigned-in by patches of less-exciting current events that ranged from soft economic indicators (manufacturing PMI, consumer sentiment), Congress’ struggle with healthcare reform, and the widening investigation of Russian meddling in last year’s election. As a result, the U.S. equity composite turned in a modest gain of 2.9% for Q2 that was -194 bps behind the pace of the Growth policy benchmark. Within the composite, the internal U.S. equity component continues to be the stronger performing unit, finishing the quarter up 2.9. The smaller external U.S. equity component was in the positive territory as well, but came in a couple steps behind at 2.2%.
♦ Private Equity Exposure: After a resurgence at the end of 2016, private equity largely kept up that forward momentum into 2017 as investors continued to find appeal in this segment for diversification and absolute return. Performance of CalPERS’ private equity investments trended in this direction as well, as this program followed up its 3.5% Q1 gain with a total return of 3.9% for Q2. This result was a nice complement to the total public equity program’s 4.2% gain, although in relative terms it missed private equity’s own policy benchmark by a large -340 bps margin and therefore was a net performance detractor to Growth.
Item 5b Attachment 2, Page 16 of 53
Public Equity Review for PERF - U.S. Equity ∗
Market Value Qtr 1-Year 3-Year 5-Year 10-Year Date
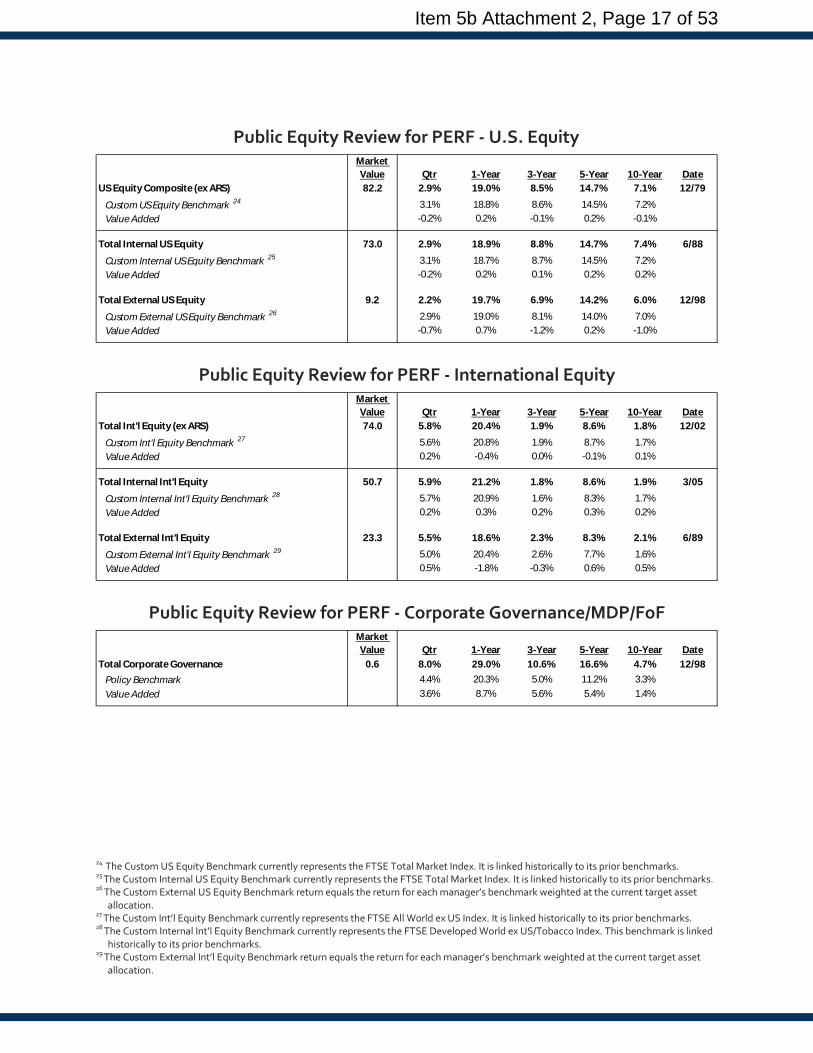
US Equity Composite (ex ARS) 82.2 2.9% 19.0% 8.5% 14.7% 7.1% 12/79Custom US Equity Benchmark 24 3.1% 18.8% 8.6% 14.5% 7.2%Value Added -0.2% 0.2% -0.1% 0.2% -0.1%
Total Internal US Equity 73.0 2.9% 18.9% 8.8% 14.7% 7.4% 6/88Custom Internal US Equity Benchmark 25 3.1% 18.7% 8.7% 14.5% 7.2%Value Added -0.2% 0.2% 0.1% 0.2% 0.2%
Total External US Equity 9.2 2.2% 19.7% 6.9% 14.2% 6.0% 12/98Custom External US Equity Benchmark 26 2.9% 19.0% 8.1% 14.0% 7.0%Value Added -0.7% 0.7% -1.2% 0.2% -1.0%
Public Equity Review for PERF - International Equity
Market Value Qtr 1-Year 3-Year 5-Year 10-Year Date
Total Int'l Equity (ex ARS) 74.0 5.8% 20.4% 1.9% 8.6% 1.8% 12/02Custom Int'l Equity Benchmark 27 5.6% 20.8% 1.9% 8.7% 1.7%Value Added 0.2% -0.4% 0.0% -0.1% 0.1%
Total Internal Int'l Equity 50.7 5.9% 21.2% 1.8% 8.6% 1.9% 3/05Custom Internal Int'l Equity Benchmark 28 5.7% 20.9% 1.6% 8.3% 1.7%Value Added 0.2% 0.3% 0.2% 0.3% 0.2%
Total External Int'l Equity 23.3 5.5% 18.6% 2.3% 8.3% 2.1% 6/89Custom External Int'l Equity Benchmark 29 5.0% 20.4% 2.6% 7.7% 1.6%Value Added 0.5% -1.8% -0.3% 0.6% 0.5%
Public Equity Review for PERF - Corporate Governance/MDP/FoF
Market Value Qtr 1-Year 3-Year 5-Year 10-Year Date
Total Corporate Governance 0.6 8.0% 29.0% 10.6% 16.6% 4.7% 12/98Policy Benchmark 4.4% 20.3% 5.0% 11.2% 3.3%Value Added 3.6% 8.7% 5.6% 5.4% 1.4%
24 The Custom US Equity Benchmark currently represents the FTSE Total Market Index. It is linked historically to its prior benchmarks. 25 The Custom Internal US Equity Benchmark currently represents the FTSE Total Market Index. It is linked historically to its prior benchmarks. 26 The Custom External US Equity Benchmark return equals the return for each manager’s benchmark weighted at the current target asset
allocation. 27 The Custom Int’l Equity Benchmark currently represents the FTSE All World ex US Index. It is linked historically to its prior benchmarks. 28 The Custom Internal Int’l Equity Benchmark currently represents the FTSE Developed World ex US/Tobacco Index. This benchmark is linked
historically to its prior benchmarks. 29 The Custom External Int’l Equity Benchmark return equals the return for each manager’s benchmark weighted at the current target asset
allocation.
Item 5b Attachment 2, Page 17 of 53
35Absolute Return Strategies Review for PERF Period Ended 6/30/2017
ARS Allocation
Asset Allocation: Actual versus Target Weights
Asset Class
Actual Asset Allocation
Target Asset Allocation
Difference
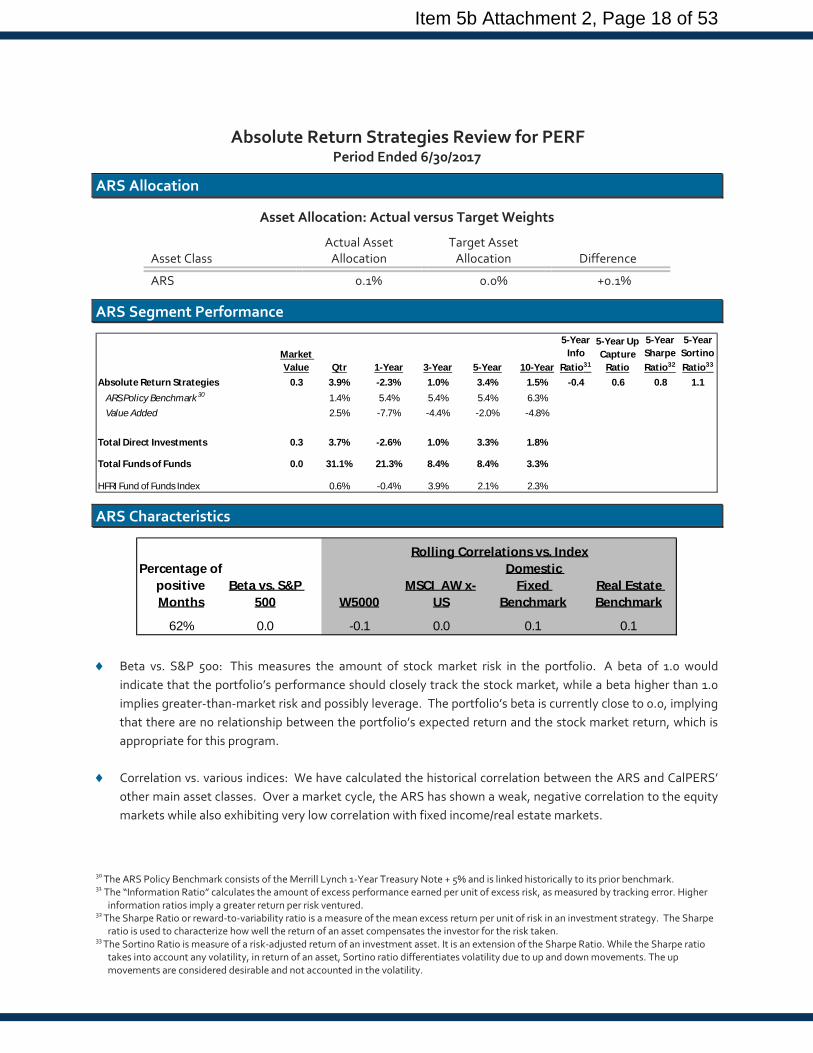
ARS 0.1% 0.0% +0.1%
ARS Segment Performance
Market Value Qtr 1-Year 3-Year 5-Year 10-Year
5-Year Info
Ratio31
5-Year Up Capture
Ratio
5-Year Sharpe Ratio32
5-Year Sortino Ratio33
Absolute Return Strategies 0.3 3.9% -2.3% 1.0% 3.4% 1.5% -0.4 0.6 0.8 1.1ARS Policy Benchmark30 1.4% 5.4% 5.4% 5.4% 6.3%Value Added 2.5% -7.7% -4.4% -2.0% -4.8%
Total Direct Investments 0.3 3.7% -2.6% 1.0% 3.3% 1.8%
Total Funds of Funds 0.0 31.1% 21.3% 8.4% 8.4% 3.3%
HFRI Fund of Funds Index 0.6% -0.4% 3.9% 2.1% 2.3%
ARS Characteristics
Percentage of positive Months
Beta vs. S&P 500 W5000
MSCI AW x-US
Domestic Fixed
BenchmarkReal Estate Benchmark
62% 0.0 -0.1 0.0 0.1 0.1
Rolling Correlations vs. Index
♦ Beta vs. S&P 500: This measures the amount of stock market risk in the portfolio. A beta of 1.0 would indicate that the portfolio’s performance should closely track the stock market, while a beta higher than 1.0 implies greater-than-market risk and possibly leverage. The portfolio’s beta is currently close to 0.0, implying that there are no relationship between the portfolio’s expected return and the stock market return, which is appropriate for this program.
♦ Correlation vs. various indices: We have calculated the historical correlation between the ARS and CalPERS’
other main asset classes. Over a market cycle, the ARS has shown a weak, negative correlation to the equity markets while also exhibiting very low correlation with fixed income/real estate markets.
30 The ARS Policy Benchmark consists of the Merrill Lynch 1-Year Treasury Note + 5% and is linked historically to its prior benchmark. 31 The “Information Ratio” calculates the amount of excess performance earned per unit of excess risk, as measured by tracking error. Higher
information ratios imply a greater return per risk ventured. 32 The Sharpe Ratio or reward-to-variability ratio is a measure of the mean excess return per unit of risk in an investment strategy. The Sharpe
ratio is used to characterize how well the return of an asset compensates the investor for the risk taken. 33 The Sortino Ratio is measure of a risk-adjusted return of an investment asset. It is an extension of the Sharpe Ratio. While the Sharpe ratio
takes into account any volatility, in return of an asset, Sortino ratio differentiates volatility due to up and down movements. The up movements are considered desirable and not accounted in the volatility.
Item 5b Attachment 2, Page 18 of 53
Absolute Return Strategies Review for PERF (Continued) Period Ended 6/30/2017
1.6% 1.6%
12.0%
22.4%27.9%
24.0%
7.7%2.7%
0%
10%
20%
30%
40%
50%
Below-3.0
-3.0 to-2.0
-2.0 to-1.0
-1.0 to0.0
0.0 to1.0
1.0 to2.0
2.0 to3.0
Above3.0
Freq
uenc
y
CalPERS- ARS (net) Monthly Histogram April 2001 to June 2017
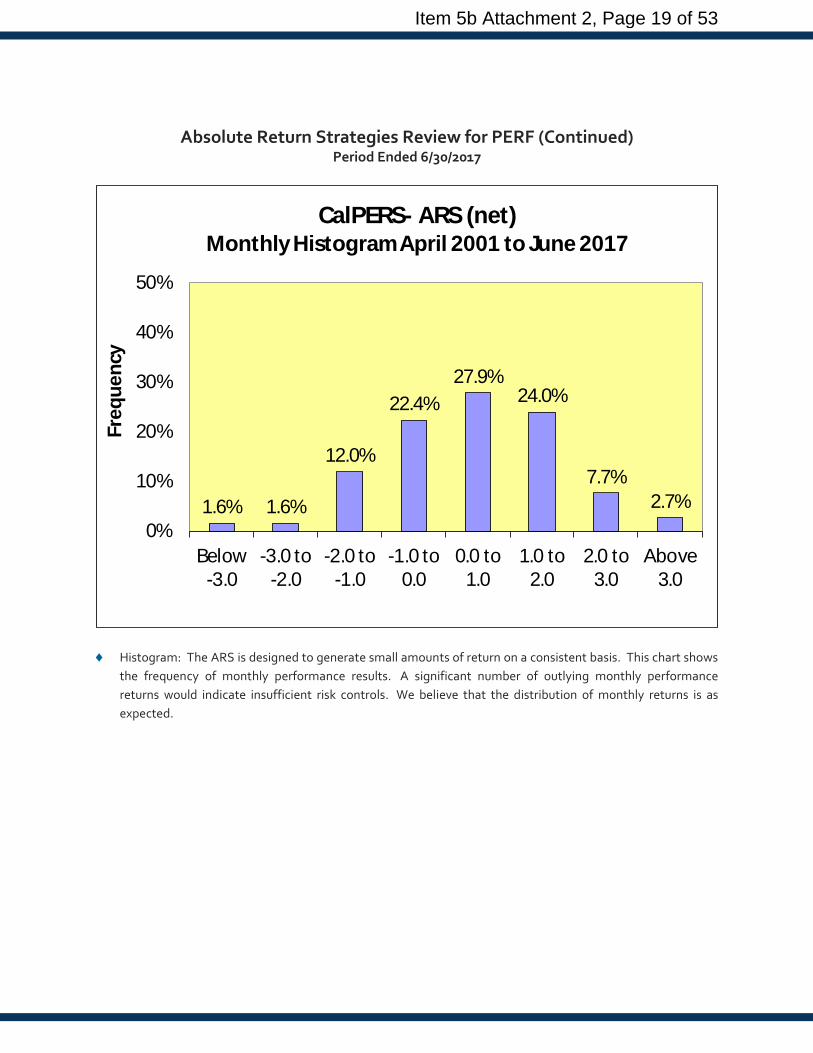
♦ Histogram: The ARS is designed to generate small amounts of return on a consistent basis. This chart shows the frequency of monthly performance results. A significant number of outlying monthly performance returns would indicate insufficient risk controls. We believe that the distribution of monthly returns is as expected.
Item 5b Attachment 2, Page 19 of 53

Income Review for PERF27 Periods Ended 6/30/2017
Income Allocation
Asset Allocation: Actual versus Target Weights
Asset Class
Actual Asset Allocation
Target Asset Allocation
Difference
Income 19.4% 20.0% -0.6%
Income Segment Performance
Market Value Qtr 1-Year 3-Year 5-Year 10-Year VaR37
5-year Sharpe Ratio38
5-year Info
Ratio39
INCOME 62.9 2.5% 0.3% 3.5% 3.4% 6.5% $6.9 bil 0.7 1.5Income Policy Benchmark 34 2.4% -0.9% 2.8% 2.5% 5.8% 0.5 0.0Value Added 0.1% 1.2% 0.7% 0.9% 0.7%
U.S. Income 56.4 2.3% 0.3% 4.3% 3.9% 6.8% 0.8 1.4U.S. Income Policy Benchmark 35 2.2% -0.9% 3.5% 2.9% 6.1% 0.5 0.0Value Added 0.1% 1.2% 0.8% 1.0% 0.7%
Non-U.S. Income 6.5 4.4% 0.1% -2.6% -0.9% 3.8% -0.2 0.8Non-US Income Policy Benchmark 36 4.1% -1.1% -3.4% -1.6% 2.8% -0.2 0.0Value Added 0.3% 1.2% 0.8% 0.7% 1.0%
Comments Regarding Income Segment Performance
Helped Performance: ♦ International Fixed Income / Sovereign Bonds: Non-U.S. bond performance was robust during the second
quarter of 2017. A late-quarter selloff triggered by Mario Draghi’s hawkish comments towards future ECB monetary policy direction was easily offset by favorable forex swings throughout the quarter, as the US dollar ceded more ground to most major currencies (i.e. euro gained 6.6% and the pound gained 3.9%). U.S.-based investors in general saw their investment results boosted by this tailwind: CalPERS’ international fixed income and sovereign bonds portfolios were up 4.4% and 2.5% respectively during Q2, and both finished above the Income policy benchmark.
34 The Income Policy Benchmark return equals the benchmark returns for domestic and international fixed income components weighted at policy allocation target percentages.
35 The US Fixed Income Policy Benchmark consists of the Barclays Long Liability Index and is linked historically to its prior benchmark. 36 The Non-US Fixed Income Policy Benchmark consists of the Barclays International Fixed Income and is linked historically to its prior
benchmark.
37 VaR (Value at Risk) measures how much the portfolio might decrease over a 12 month period in extreme cases. The VAR estimate shows how much the portfolio value might fall in the worst 5% of 12 month periods. VAR is calculated using total risk (standard deviation) and market value.
38 The Sharpe Ratio or reward-to-variability ratio is a measure of the mean excess return per unit of risk in an investment strategy. The Sharpe ratio is used to characterize how well the return of an asset compensates the investor for the risk taken.
39 The “Information Ratio” calculates the amount of excess performance earned per unit of excess risk, as measured by tracking error. Higher information ratios imply a greater return per risk ventured.
Item 5b Attachment 2, Page 20 of 53

♦ Corporate Bonds: Corporate bonds was another bright spot during the second quarter. The dampened
growth expectations essentially drove the narrowing of credit spreads as investors push ahead their search for yield in this low interest rate environment - investment grade credit out-gained Treasuries by more than 100 bps this quarter. CalPERS’ $11.4 billion corporate bond portfolio and $3.2 billion long duration corporate bond portfolio both rallied more than 4%, and outperformed relative to the Income policy benchmark.
Impeded Performance: ♦ Government Bonds: The System’s internal Treasuries and government-sponsored bonds portfolio netted a
solid positive return during Q2, but its 2% pace wasn’t quite enough to match the Income policy benchmark, missing it by 40 bps.
♦ Mortgage Bonds: With returns of 1.1% from the mortgage portfolio and 1.6% from the long duration
mortgage portfolio, MBS was among the weaker performing fixed income segment in the second quarter and did not contribute to the relative results of the Income asset class.
♦ High Yield Bonds: Similar to investment grade credit, high yield credit experienced continued spread
tightening this quarter. Under this favorable market condition CalPERS saw welcoming gains from its internal high yield portfolio (2.1%) and external high yield portfolio (+1.0%), but neither was strong enough to match the Income policy benchmark.
Item 5b Attachment 2, Page 21 of 53
Income Review for PERF (Continued)
Income Portfolios Performance
Market Value Qtr 1-Year 3-Year 5-Year 10-Year Date
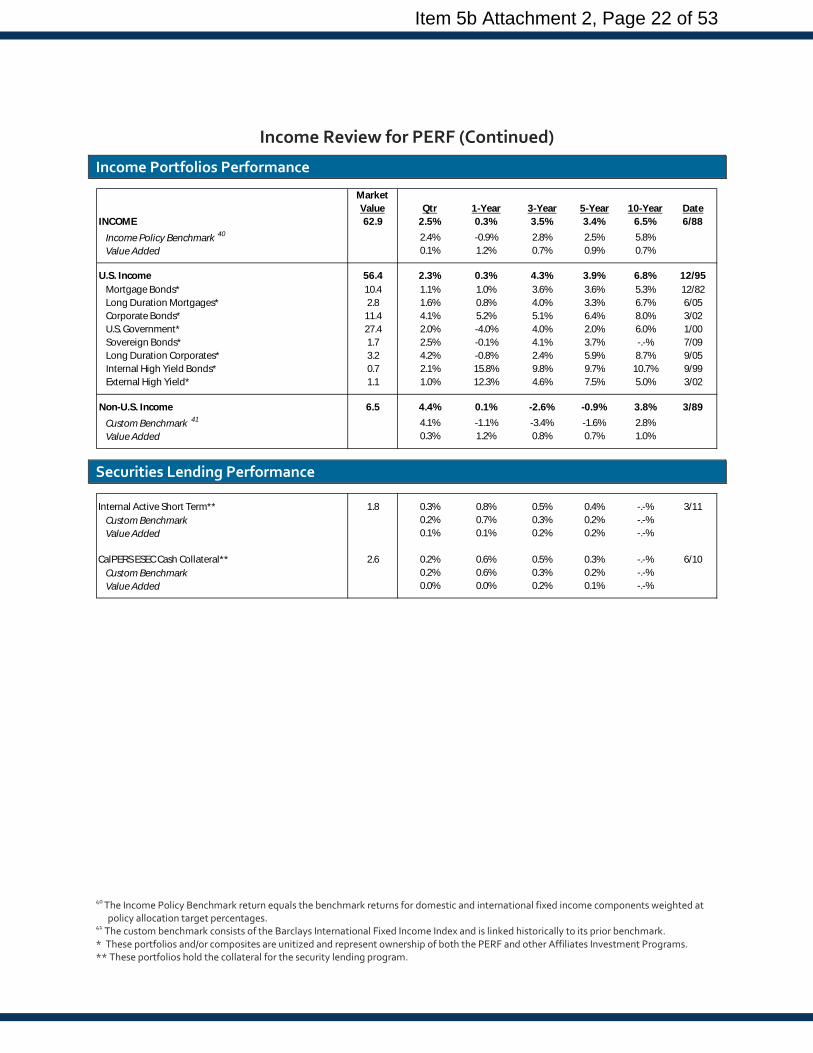
INCOME 62.9 2.5% 0.3% 3.5% 3.4% 6.5% 6/88Income Policy Benchmark 40 2.4% -0.9% 2.8% 2.5% 5.8%Value Added 0.1% 1.2% 0.7% 0.9% 0.7%
U.S. Income 56.4 2.3% 0.3% 4.3% 3.9% 6.8% 12/95Mortgage Bonds* 10.4 1.1% 1.0% 3.6% 3.6% 5.3% 12/82Long Duration Mortgages* 2.8 1.6% 0.8% 4.0% 3.3% 6.7% 6/05Corporate Bonds* 11.4 4.1% 5.2% 5.1% 6.4% 8.0% 3/02U.S. Government* 27.4 2.0% -4.0% 4.0% 2.0% 6.0% 1/00Sovereign Bonds* 1.7 2.5% -0.1% 4.1% 3.7% -.-% 7/09Long Duration Corporates* 3.2 4.2% -0.8% 2.4% 5.9% 8.7% 9/05Internal High Yield Bonds* 0.7 2.1% 15.8% 9.8% 9.7% 10.7% 9/99External High Yield* 1.1 1.0% 12.3% 4.6% 7.5% 5.0% 3/02
Non-U.S. Income 6.5 4.4% 0.1% -2.6% -0.9% 3.8% 3/89Custom Benchmark 41 4.1% -1.1% -3.4% -1.6% 2.8%Value Added 0.3% 1.2% 0.8% 0.7% 1.0%
Securities Lending Performance
Internal Active Short Term** 1.8 0.3% 0.8% 0.5% 0.4% -.-% 3/11Custom Benchmark 0.2% 0.7% 0.3% 0.2% -.-%Value Added 0.1% 0.1% 0.2% 0.2% -.-%
CalPERS ESEC Cash Collateral** 2.6 0.2% 0.6% 0.5% 0.3% -.-% 6/10Custom Benchmark 0.2% 0.6% 0.3% 0.2% -.-%Value Added 0.0% 0.0% 0.2% 0.1% -.-%
40 The Income Policy Benchmark return equals the benchmark returns for domestic and international fixed income components weighted at policy allocation target percentages.
41 The custom benchmark consists of the Barclays International Fixed Income Index and is linked historically to its prior benchmark. * These portfolios and/or composites are unitized and represent ownership of both the PERF and other Affiliates Investment Programs. ** These portfolios hold the collateral for the security lending program.
Item 5b Attachment 2, Page 22 of 53
Inflation Performance for PERF Period Ended 6/30/2017
Inflation Allocation
Asset Allocation: Actual versus Target Weights
Asset Class
Actual Asset Allocation
Target Asset Allocation
Difference
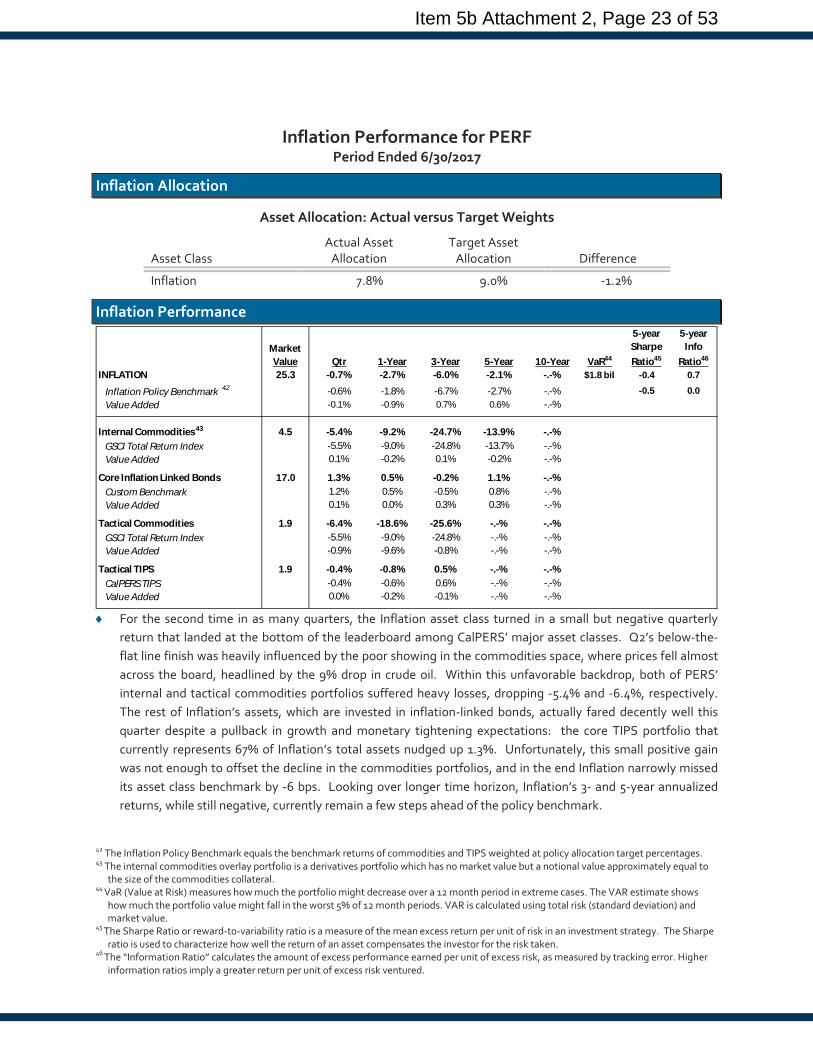
Inflation 7.8% 9.0% -1.2%
Inflation Performance *
Market Value Qtr 1-Year 3-Year 5-Year 10-Year VaR44
5-year Sharpe Ratio45
5-year Info
Ratio46
INFLATION 25.3 -0.7% -2.7% -6.0% -2.1% -.-% $1.8 bil -0.4 0.7
Inflation Policy Benchmark 42 -0.6% -1.8% -6.7% -2.7% -.-% -0.5 0.0Value Added -0.1% -0.9% 0.7% 0.6% -.-%
Internal Commodities 43 4.5 -5.4% -9.2% -24.7% -13.9% -.-%GSCI Total Return Index -5.5% -9.0% -24.8% -13.7% -.-%Value Added 0.1% -0.2% 0.1% -0.2% -.-%
Core Inflation Linked Bonds 17.0 1.3% 0.5% -0.2% 1.1% -.-%Custom Benchmark 1.2% 0.5% -0.5% 0.8% -.-%Value Added 0.1% 0.0% 0.3% 0.3% -.-%
Tactical Commodities 1.9 -6.4% -18.6% -25.6% -.-% -.-%GSCI Total Return Index -5.5% -9.0% -24.8% -.-% -.-%Value Added -0.9% -9.6% -0.8% -.-% -.-%
Tactical TIPS 1.9 -0.4% -0.8% 0.5% -.-% -.-%CalPERS TIPS -0.4% -0.6% 0.6% -.-% -.-%Value Added 0.0% -0.2% -0.1% -.-% -.-%
♦ For the second time in as many quarters, the Inflation asset class turned in a small but negative quarterly
return that landed at the bottom of the leaderboard among CalPERS’ major asset classes. Q2’s below-the-flat line finish was heavily influenced by the poor showing in the commodities space, where prices fell almost across the board, headlined by the 9% drop in crude oil. Within this unfavorable backdrop, both of PERS’ internal and tactical commodities portfolios suffered heavy losses, dropping -5.4% and -6.4%, respectively. The rest of Inflation’s assets, which are invested in inflation-linked bonds, actually fared decently well this quarter despite a pullback in growth and monetary tightening expectations: the core TIPS portfolio that currently represents 67% of Inflation’s total assets nudged up 1.3%. Unfortunately, this small positive gain was not enough to offset the decline in the commodities portfolios, and in the end Inflation narrowly missed its asset class benchmark by -6 bps. Looking over longer time horizon, Inflation’s 3- and 5-year annualized returns, while still negative, currently remain a few steps ahead of the policy benchmark.
42 The Inflation Policy Benchmark equals the benchmark returns of commodities and TIPS weighted at policy allocation target percentages. 43 The internal commodities overlay portfolio is a derivatives portfolio which has no market value but a notional value approximately equal to
the size of the commodities collateral. 44 VaR (Value at Risk) measures how much the portfolio might decrease over a 12 month period in extreme cases. The VAR estimate shows
how much the portfolio value might fall in the worst 5% of 12 month periods. VAR is calculated using total risk (standard deviation) and market value.
45 The Sharpe Ratio or reward-to-variability ratio is a measure of the mean excess return per unit of risk in an investment strategy. The Sharpe ratio is used to characterize how well the return of an asset compensates the investor for the risk taken.
46 The “Information Ratio” calculates the amount of excess performance earned per unit of excess risk, as measured by tracking error. Higher information ratios imply a greater return per unit of excess risk ventured.
Item 5b Attachment 2, Page 23 of 53
Real Assets Review for PERF31 Period Ended 6/30/2017
Real Assets Allocation
Asset Allocation: Actual versus Target Weights
Asset Class
Actual Asset Allocation
Target Asset Allocation
Difference
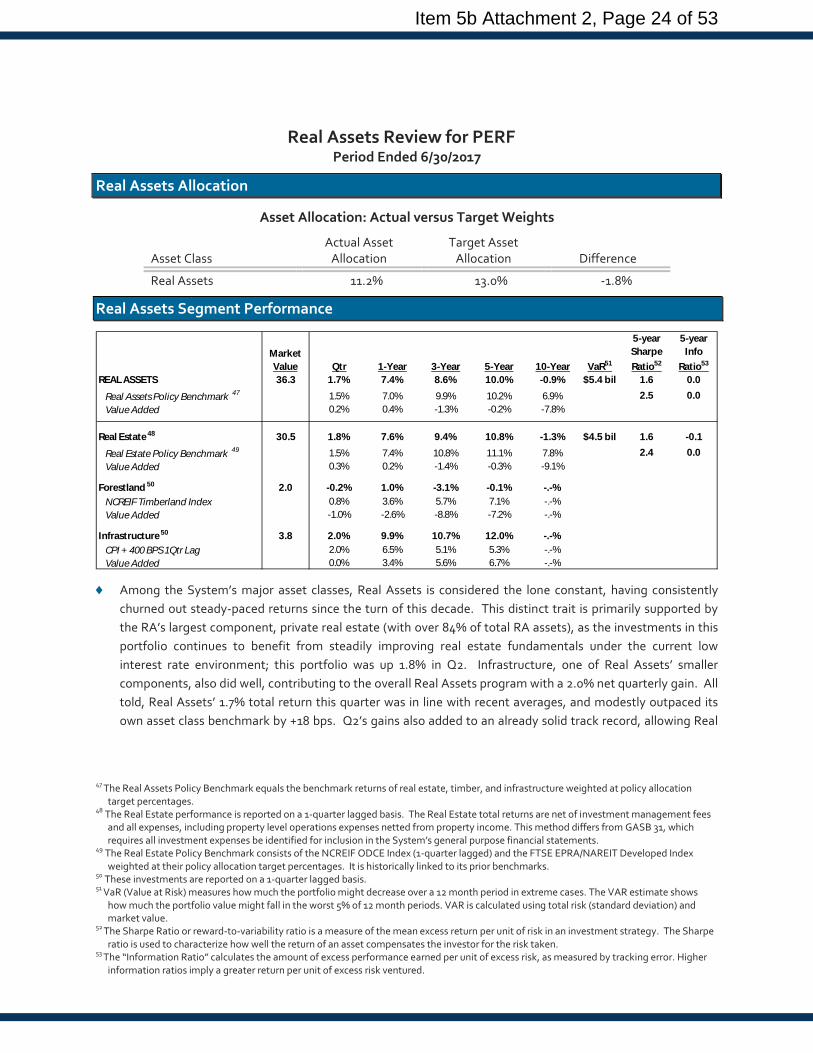
Real Assets 11.2% 13.0% -1.8%
Real Assets Segment Performance
Market Value Qtr 1-Year 3-Year 5-Year 10-Year VaR51
5-year Sharpe Ratio52
5-year Info
Ratio53
REAL ASSETS 36.3 1.7% 7.4% 8.6% 10.0% -0.9% $5.4 bil 1.6 0.0Real Assets Policy Benchmark 47 1.5% 7.0% 9.9% 10.2% 6.9% 2.5 0.0Value Added 0.2% 0.4% -1.3% -0.2% -7.8%
Real Estate 48 30.5 1.8% 7.6% 9.4% 10.8% -1.3% $4.5 bil 1.6 -0.1Real Estate Policy Benchmark 49 1.5% 7.4% 10.8% 11.1% 7.8% 2.4 0.0Value Added 0.3% 0.2% -1.4% -0.3% -9.1%
Forestland 50 2.0 -0.2% 1.0% -3.1% -0.1% -.-%NCREIF Timberland Index 0.8% 3.6% 5.7% 7.1% -.-%Value Added -1.0% -2.6% -8.8% -7.2% -.-%
Infrastructure 50 3.8 2.0% 9.9% 10.7% 12.0% -.-%CPI + 400 BPS 1Qtr Lag 2.0% 6.5% 5.1% 5.3% -.-%Value Added 0.0% 3.4% 5.6% 6.7% -.-%
♦ Among the System’s major asset classes, Real Assets is considered the lone constant, having consistently churned out steady-paced returns since the turn of this decade. This distinct trait is primarily supported by the RA’s largest component, private real estate (with over 84% of total RA assets), as the investments in this portfolio continues to benefit from steadily improving real estate fundamentals under the current low interest rate environment; this portfolio was up 1.8% in Q2. Infrastructure, one of Real Assets’ smaller components, also did well, contributing to the overall Real Assets program with a 2.0% net quarterly gain. All told, Real Assets’ 1.7% total return this quarter was in line with recent averages, and modestly outpaced its own asset class benchmark by +18 bps. Q2’s gains also added to an already solid track record, allowing Real
47 The Real Assets Policy Benchmark equals the benchmark returns of real estate, timber, and infrastructure weighted at policy allocation target percentages.
48 The Real Estate performance is reported on a 1-quarter lagged basis. The Real Estate total returns are net of investment management fees and all expenses, including property level operations expenses netted from property income. This method differs from GASB 31, which requires all investment expenses be identified for inclusion in the System’s general purpose financial statements.
49 The Real Estate Policy Benchmark consists of the NCREIF ODCE Index (1-quarter lagged) and the FTSE EPRA/NAREIT Developed Index weighted at their policy allocation target percentages. It is historically linked to its prior benchmarks.
50 These investments are reported on a 1-quarter lagged basis. 51 VaR (Value at Risk) measures how much the portfolio might decrease over a 12 month period in extreme cases. The VAR estimate shows
how much the portfolio value might fall in the worst 5% of 12 month periods. VAR is calculated using total risk (standard deviation) and market value.
52 The Sharpe Ratio or reward-to-variability ratio is a measure of the mean excess return per unit of risk in an investment strategy. The Sharpe ratio is used to characterize how well the return of an asset compensates the investor for the risk taken.
53 The “Information Ratio” calculates the amount of excess performance earned per unit of excess risk, as measured by tracking error. Higher information ratios imply a greater return per unit of excess risk ventured.
Item 5b Attachment 2, Page 24 of 53
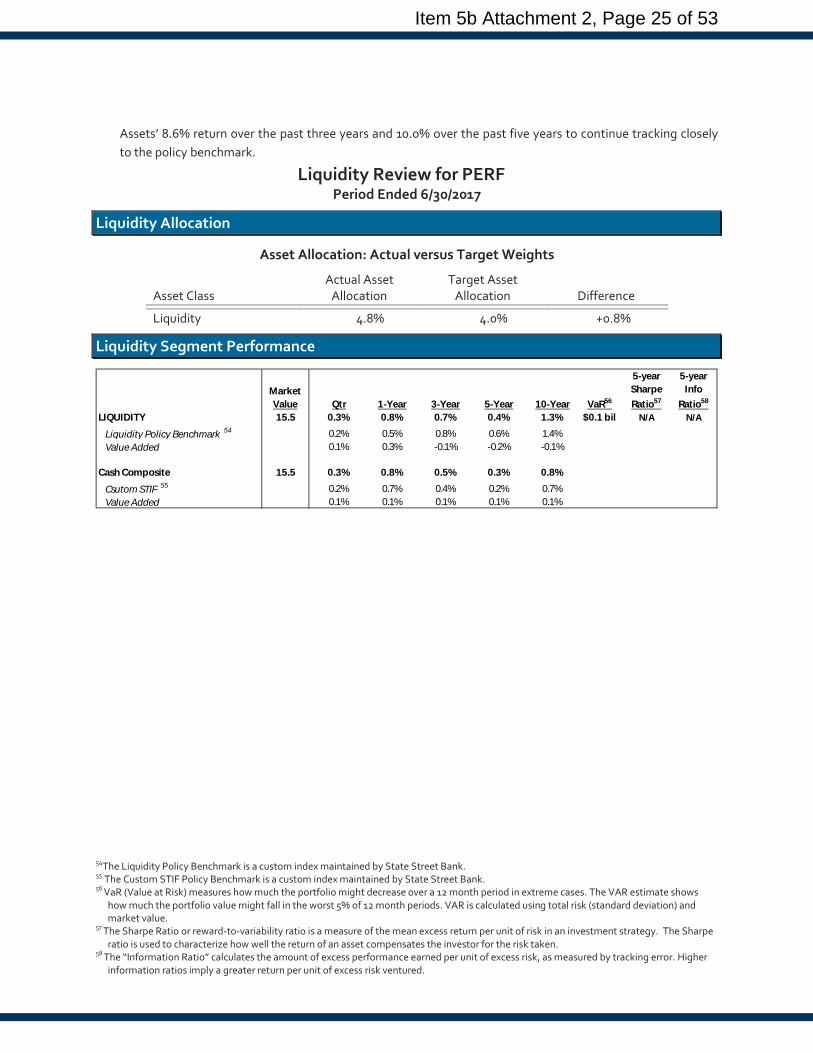
Assets’ 8.6% return over the past three years and 10.0% over the past five years to continue tracking closely to the policy benchmark.
Liquidity Review for PERF31 Period Ended 6/30/2017
Liquidity Allocation
Asset Allocation: Actual versus Target Weights
Asset Class
Actual Asset Allocation
Target Asset Allocation
Difference
Liquidity 4.8% 4.0% +0.8%
Liquidity Segment Performance
Market Value Qtr 1-Year 3-Year 5-Year 10-Year VaR56
5-year Sharpe Ratio57
5-year Info
Ratio58
LIQUIDITY 15.5 0.3% 0.8% 0.7% 0.4% 1.3% $0.1 bil N/A N/A
Liquidity Policy Benchmark 54 0.2% 0.5% 0.8% 0.6% 1.4%Value Added 0.1% 0.3% -0.1% -0.2% -0.1%
Cash Composite 15.5 0.3% 0.8% 0.5% 0.3% 0.8%Csutom STIF 55 0.2% 0.7% 0.4% 0.2% 0.7%Value Added 0.1% 0.1% 0.1% 0.1% 0.1%
54The Liquidity Policy Benchmark is a custom index maintained by State Street Bank. 55 The Custom STIF Policy Benchmark is a custom index maintained by State Street Bank. 56 VaR (Value at Risk) measures how much the portfolio might decrease over a 12 month period in extreme cases. The VAR estimate shows
how much the portfolio value might fall in the worst 5% of 12 month periods. VAR is calculated using total risk (standard deviation) and market value.
57 The Sharpe Ratio or reward-to-variability ratio is a measure of the mean excess return per unit of risk in an investment strategy. The Sharpe ratio is used to characterize how well the return of an asset compensates the investor for the risk taken.
58 The “Information Ratio” calculates the amount of excess performance earned per unit of excess risk, as measured by tracking error. Higher information ratios imply a greater return per unit of excess risk ventured.
Item 5b Attachment 2, Page 25 of 53
Affiliate Fund Information
Item 5b Attachment 2, Page 26 of 53
Judges’ Retirement System I Fund
Item 5b Attachment 2, Page 27 of 53
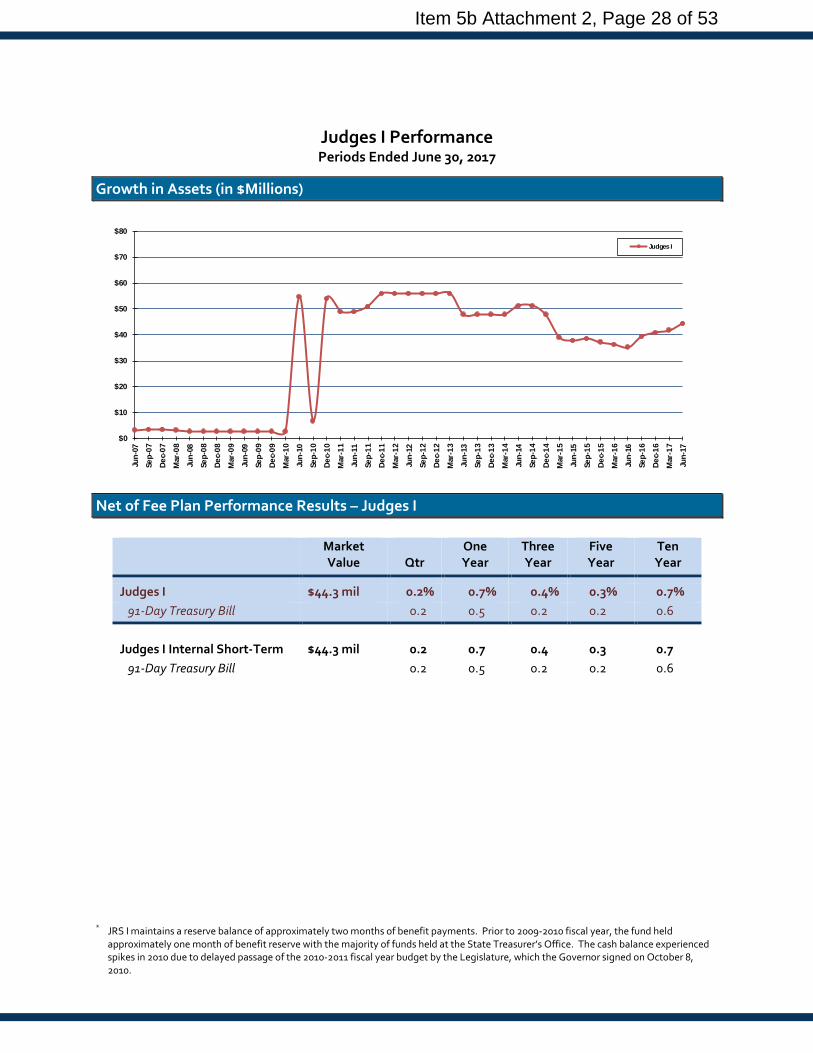
Judges I Performance Periods Ended June 30, 2017
Growth in Assets (in $Millions)
$0
$10
$20
$30
$40
$50
$60
$70
$80
Jun-
07
Sep-
07
Dec-
07
Mar
-08
Jun-
08
Sep-
08
Dec-
08
Mar
-09
Jun-
09
Sep-
09
Dec-
09
Mar
-10
Jun-
10
Sep-
10
Dec-
10
Mar
-11
Jun-
11
Sep-
11
Dec-
11
Mar
-12
Jun-
12
Sep-
12
Dec-
12
Mar
-13
Jun-
13
Sep-
13
Dec-
13
Mar
-14
Jun-
14
Sep-
14
Dec-
14
Mar
-15
Jun-
15
Sep-
15
Dec-
15
Mar
-16
Jun-
16
Sep-
16
Dec-
16
Mar
-17
Jun-
17
Judges I
Net of Fee Plan Performance Results – Judges I
Market Value
Qtr
One Year
Three Year
Five Year
Ten Year
Judges I $44.3 mil 0.2% 0.7% 0.4% 0.3% 0.7% 91-Day Treasury Bill 0.2 0.5 0.2 0.2 0.6
Judges I Internal Short-Term $44.3 mil 0.2 0.7 0.4 0.3 0.7 91-Day Treasury Bill 0.2 0.5 0.2 0.2 0.6
*
* JRS I maintains a reserve balance of approximately two months of benefit payments. Prior to 2009-2010 fiscal year, the fund held approximately one month of benefit reserve with the majority of funds held at the State Treasurer’s Office. The cash balance experienced spikes in 2010 due to delayed passage of the 2010-2011 fiscal year budget by the Legislature, which the Governor signed on October 8, 2010.
Item 5b Attachment 2, Page 28 of 53
Judges’ Retirement System II Fund
Item 5b Attachment 2, Page 29 of 53

Judges II Performance Period Ended June 30, 2017
Growth in Assets (in $Millions)
$0
$200
$400
$600
$800
$1,000
$1,200
$1,400
$1,600
Jun-
07
Sep-
07
Dec-
07
Mar
-08
Jun-
08
Sep-
08
Dec-
08
Mar
-09
Jun-
09
Sep-
09
Dec-
09
Mar
-10
Jun-
10
Sep-
10
Dec-
10
Mar
-11
Jun-
11
Sep-
11
Dec-
11
Mar
-12
Jun-
12
Sep-
12
Dec-
12
Mar
-13
Jun-
13
Sep-
13
Dec-
13
Mar
-14
Jun-
14
Sep-
14
Dec-
14
Mar
-15
Jun-
15
Sep-
15
Dec-
15
Mar
-16
Jun-
16
Sep-
16
Dec-
16
Mar
-17
Jun-
17
Judges II
Total Plan Asset Allocation
Asset Class Actual (%) Policy (%) Difference (%) Global Equity 50.1 50.0 +0.1 US Fixed Income 33.8 34.0 -0.2 TIPS 4.8 5.0 -0.2 REITS 7.9 8.0 -0.1 Commodities 3.2 3.0 +0.2 Cash/Short-Term 0.2 0.0 +0.2
Total Judges II 100.0 100.0 0.0
Item 5b Attachment 2, Page 30 of 53
Commentary – Judges II
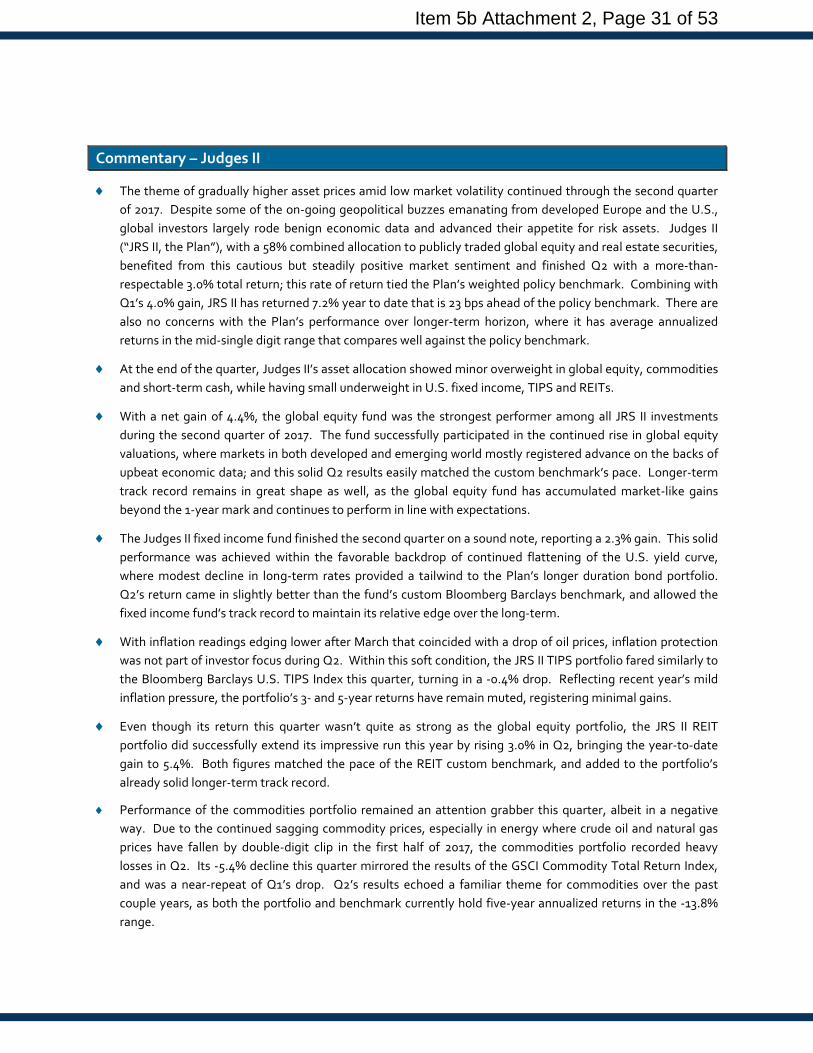
♦ The theme of gradually higher asset prices amid low market volatility continued through the second quarter of 2017. Despite some of the on-going geopolitical buzzes emanating from developed Europe and the U.S., global investors largely rode benign economic data and advanced their appetite for risk assets. Judges II (“JRS II, the Plan”), with a 58% combined allocation to publicly traded global equity and real estate securities, benefited from this cautious but steadily positive market sentiment and finished Q2 with a more-than-respectable 3.0% total return; this rate of return tied the Plan’s weighted policy benchmark. Combining with Q1’s 4.0% gain, JRS II has returned 7.2% year to date that is 23 bps ahead of the policy benchmark. There are also no concerns with the Plan’s performance over longer-term horizon, where it has average annualized returns in the mid-single digit range that compares well against the policy benchmark.
♦ At the end of the quarter, Judges II’s asset allocation showed minor overweight in global equity, commodities and short-term cash, while having small underweight in U.S. fixed income, TIPS and REITs.
♦ With a net gain of 4.4%, the global equity fund was the strongest performer among all JRS II investments during the second quarter of 2017. The fund successfully participated in the continued rise in global equity valuations, where markets in both developed and emerging world mostly registered advance on the backs of upbeat economic data; and this solid Q2 results easily matched the custom benchmark’s pace. Longer-term track record remains in great shape as well, as the global equity fund has accumulated market-like gains beyond the 1-year mark and continues to perform in line with expectations.
♦ The Judges II fixed income fund finished the second quarter on a sound note, reporting a 2.3% gain. This solid performance was achieved within the favorable backdrop of continued flattening of the U.S. yield curve, where modest decline in long-term rates provided a tailwind to the Plan’s longer duration bond portfolio. Q2’s return came in slightly better than the fund’s custom Bloomberg Barclays benchmark, and allowed the fixed income fund’s track record to maintain its relative edge over the long-term.
♦ With inflation readings edging lower after March that coincided with a drop of oil prices, inflation protection was not part of investor focus during Q2. Within this soft condition, the JRS II TIPS portfolio fared similarly to the Bloomberg Barclays U.S. TIPS Index this quarter, turning in a -0.4% drop. Reflecting recent year’s mild inflation pressure, the portfolio’s 3- and 5-year returns have remain muted, registering minimal gains.
♦ Even though its return this quarter wasn’t quite as strong as the global equity portfolio, the JRS II REIT portfolio did successfully extend its impressive run this year by rising 3.0% in Q2, bringing the year-to-date gain to 5.4%. Both figures matched the pace of the REIT custom benchmark, and added to the portfolio’s already solid longer-term track record.
♦ Performance of the commodities portfolio remained an attention grabber this quarter, albeit in a negative way. Due to the continued sagging commodity prices, especially in energy where crude oil and natural gas prices have fallen by double-digit clip in the first half of 2017, the commodities portfolio recorded heavy losses in Q2. Its -5.4% decline this quarter mirrored the results of the GSCI Commodity Total Return Index, and was a near-repeat of Q1’s drop. Q2’s results echoed a familiar theme for commodities over the past couple years, as both the portfolio and benchmark currently hold five-year annualized returns in the -13.8% range.
Item 5b Attachment 2, Page 31 of 53

Net of Fee Plan Performance Results – Judges II
Market Value
Qtr
One Year
Three Year
Five Year
Ten Year
Judges II $1,341.2 mil 3.0% 9.6% 3.6% 8.2% 5.1% Weighted Policy Benchmark59 3.0 9.0 3.4 7.9 5.0
JRS II Global Equity $672.0 mil 4.4 20.0 5.4 11.5 4.2 Global Equity Benchmark 60 4.4 19.8 5.3 11.4 4.1 JRS II US Fixed Income $453.5 mil 2.3 0.3 4.2 3.9 6.7 Custom Benchmark 61 2.2 -0.9 3.5 2.9 6.1 JRS II TIPS $64.8 mil -0.4 -0.6 0.5 0.2 -.- Custom Benchmark 62 -0.4 -0.6 0.6 0.3 -.- JRS II REITs $106.4 mil 3.0 1.2 4.6 8.4 2.4 Custom Benchmark 63 3.0 1.1 4.6 8.4 2.1 JRS II Commodities $42.4 mil -5.4 -8.8 -24.6 -13.8 -.- GSCI Total Return Index -5.5 -9.0 -24.8 -13.7 -.- JRS II Cash/Short-Term $2.1 mil 0.5 1.0 0.9 0.5 0.9 91-Day Treasury Bill 0.2 0.5 0.2 0.2 0.6
59 The weighted policy benchmark returns are calculated based on asset class index returns weighted by asset class policy targets. 60 The JRS II Global Equity Benchmark is a custom global benchmark maintained by FTSE starting on 9/8/2011. Prior of that it is calculated as
an asset weighted benchmark of its underlying domestic and international funds. 61 The current US Fixed Income Custom Benchmark is the Bloomberg Barclays Long Liability Index. Barclays Long Liability ex TIPS was used as
the benchmark between June 2005 and May 2007. Prior of that the benchmark was Citigroup LPF. 62 The TIPS benchmark is the Bloomberg Barclays U.S. TIPS Index. 63 The REIT Custom Benchmark is the FTSE EPRA/NAREIT Developed Index. Historically, it has been the Wilshire RESI and REIT Indices.
Item 5b Attachment 2, Page 32 of 53

Legislators’ Retirement System Fund
Item 5b Attachment 2, Page 33 of 53
LRS Performance Period Ended June 30, 2017
Growth in Assets (in $Millions)
$0.0
$20.0
$40.0
$60.0
$80.0
$100.0
$120.0
$140.0
$160.0
$180.0
Jun-
07
Sep-
07
Dec-
07
Mar
-08
Jun-
08
Sep-
08
Dec-
08
Mar
-09
Jun-
09
Sep-
09
Dec-
09
Mar
-10
Jun-
10
Sep-
10
Dec-
10
Mar
-11
Jun-
11
Sep-
11
Dec-
11
Mar
-12
Jun-
12
Sep-
12
Dec-
12
Mar
-13
Jun-
13
Sep-
13
Dec-
13
Mar
-14
Jun-
14
Sep-
14
Dec-
14
Mar
-15
Jun-
15
Sep-
15
Dec-
15
Mar
-16
Jun-
16
Sep-
16
Dec-
16
Mar
-17
Jun-
17
Legislators'
Total Plan Asset Allocation
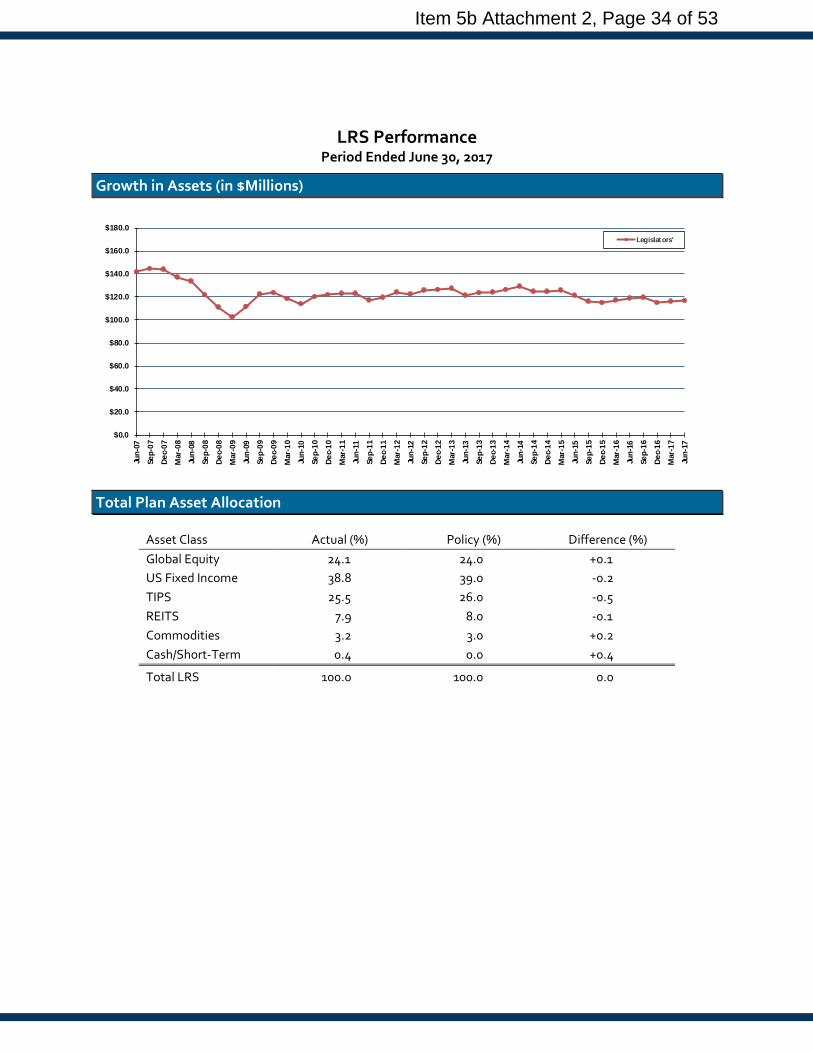
Asset Class Actual (%) Policy (%) Difference (%) Global Equity 24.1 24.0 +0.1 US Fixed Income 38.8 39.0 -0.2 TIPS 25.5 26.0 -0.5 REITS 7.9 8.0 -0.1 Commodities 3.2 3.0 +0.2 Cash/Short-Term 0.4 0.0 +0.4
Total LRS 100.0 100.0 0.0
Item 5b Attachment 2, Page 34 of 53

Commentary – LRS
♦ The California Legislators’ Retirement System (“LRS, the System”) logged back-to-back quarterly gains thus far in 2017 thanks to welcoming performance from most of its investments, sans the struggling commodities portfolio. The System’s higher allocation to fixed income (39% to U.S. fixed income and 26% to TIPS) means that its performance generally does not share too much of the up side swings, but its 1.9% Q2 total return was still steady enough that it mimicked the output of the weighted policy benchmark. This relatively consistent pace of return is also reflected in the System’s longer-term results, where its 5- and 10-year returns have both averaged in the 5% range while modestly outpacing the weighted policy benchmark.
♦ As of June 30, the System was overweight in global equity, commodities and short-term cash while underweight in U.S. fixed income, TIPS and REITs.
♦ With a new gain of 4.4%, the global equity fund was the strongest performer among all LRS investments during the second quarter of 2017. The fund successfully participated in the continued rise in global equity valuations, where markets in both developed and emerging world mostly registered advance on the backs of upbeat economic data; and this solid Q2 results easily matched the custom benchmark’s pace. Longer-term track record remains in great shape as well, as the global equity fund has accumulated market-like gains beyond the 1-year mark and continues to perform in line with expectations.
♦ The LRS fixed income fund finished the second quarter on a sound note, reporting a 2.3% gain. This solid performance was achieved within the favorable backdrop of continued flattening of the U.S. yield curve, where modest decline in long-term rates provided a tailwind to the System’s longer duration bond portfolio. Q2’s return came in slightly better than the fund’s custom Bloomberg Barclays benchmark, and allowed the fixed income fund’s track record to maintain its relative edge over the long-term.
♦ With inflation readings edging lower after March that coincided with a drop of oil prices, inflation protection was not part of investor focus during Q2. Within this soft condition, the LRS TIPS portfolio fared similarly to the Bloomberg Barclays U.S. TIPS Index this quarter, turning in a -0.4% drop. Reflecting recent year’s mild inflation pressure, the portfolio’s 3- and 5-year returns have remain muted, registering minimal gains.
♦ Even though its return this quarter was not quite as strong as the global equity portfolio, the LRS REIT portfolio did successfully extend its impressive run this year by rising 3.0% in Q2, bringing the year-to-date gain to 5.4%. Both figures matched the pace of the REIT custom benchmark, and added to the portfolio’s already solid longer-term track record.
♦ Performance of the commodities portfolio remained an attention grabber this quarter, albeit in a negative way. Due to the continued sagging commodity prices, especially in energy where crude oil and natural gas prices have fallen by double-digit clip in the first half of 2017, the commodities portfolio recorded heavy losses in Q2. Its -5.4% decline this quarter mirrored the results of the GSCI Commodity Total Return Index, and was a near-repeat of Q1’s drop. Q2’s results echoed a familiar theme for commodities over the past couple years, as both the portfolio and the benchmark currently hold 5-year annualized returns in the -13.8% range.
Item 5b Attachment 2, Page 35 of 53
Net of Fee Plan Performance Results – LRS
Market Value
Qtr
One Year
Three Year
Five Year
Ten Year
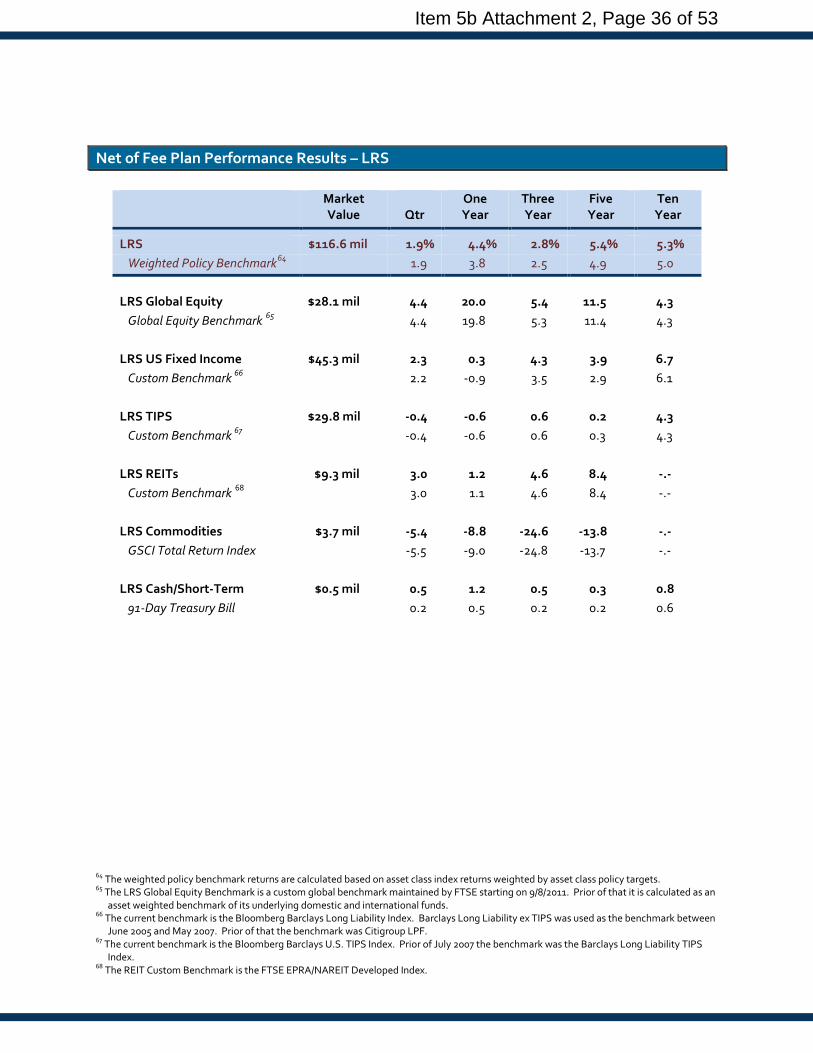
LRS $116.6 mil 1.9% 4.4% 2.8% 5.4% 5.3% Weighted Policy Benchmark64 1.9 3.8 2.5 4.9 5.0
LRS Global Equity $28.1 mil 4.4 20.0 5.4 11.5 4.3 Global Equity Benchmark 65 4.4 19.8 5.3 11.4 4.3 LRS US Fixed Income $45.3 mil 2.3 0.3 4.3 3.9 6.7 Custom Benchmark 66 2.2 -0.9 3.5 2.9 6.1 LRS TIPS $29.8 mil -0.4 -0.6 0.6 0.2 4.3 Custom Benchmark 67 -0.4 -0.6 0.6 0.3 4.3 LRS REITs $9.3 mil 3.0 1.2 4.6 8.4 -.- Custom Benchmark 68 3.0 1.1 4.6 8.4 -.- LRS Commodities $3.7 mil -5.4 -8.8 -24.6 -13.8 -.- GSCI Total Return Index -5.5 -9.0 -24.8 -13.7 -.- LRS Cash/Short-Term $0.5 mil 0.5 1.2 0.5 0.3 0.8 91-Day Treasury Bill 0.2 0.5 0.2 0.2 0.6
64 The weighted policy benchmark returns are calculated based on asset class index returns weighted by asset class policy targets. 65 The LRS Global Equity Benchmark is a custom global benchmark maintained by FTSE starting on 9/8/2011. Prior of that it is calculated as an
asset weighted benchmark of its underlying domestic and international funds. 66 The current benchmark is the Bloomberg Barclays Long Liability Index. Barclays Long Liability ex TIPS was used as the benchmark between
June 2005 and May 2007. Prior of that the benchmark was Citigroup LPF. 67 The current benchmark is the Bloomberg Barclays U.S. TIPS Index. Prior of July 2007 the benchmark was the Barclays Long Liability TIPS
Index. 68 The REIT Custom Benchmark is the FTSE EPRA/NAREIT Developed Index.
Item 5b Attachment 2, Page 36 of 53
Long-Term Care Fund
Item 5b Attachment 2, Page 37 of 53

LTC Performance Period Ended June 30, 2017
Growth in Assets (in $Millions)
$0
$500
$1,000
$1,500
$2,000
$2,500
$3,000
$3,500
$4,000
$4,500
$5,000
Jun-
07
Sep-
07
Dec-
07
Mar
-08
Jun-
08
Sep-
08
Dec-
08
Mar
-09
Jun-
09
Sep-
09
Dec-
09
Mar
-10
Jun-
10
Sep-
10
Dec-
10
Mar
-11
Jun-
11
Sep-
11
Dec-
11
Mar
-12
Jun-
12
Sep-
12
Dec-
12
Mar
-13
Jun-
13
Sep-
13
Dec-
13
Mar
-14
Jun-
14
Sep-
14
Dec-
14
Mar
-15
Jun-
15
Sep-
15
Dec-
15
Mar
-16
Jun-
16
Sep-
16
Dec-
16
Mar
-17
Jun-
17
Long-Term Care
Total Plan Asset Allocation
Asset Class Actual (%) Policy (%) Difference (%) Global Equity 16.1 15.0 +1.1 US Fixed Income 60.8 61.0 -0.2 TIPS 5.9 6.0 -0.1 REITS 12.3 12.0 +0.3 Commodities 4.8 6.0 -1.2 Cash/Short-Term 0.0 0.0 0.0
Total LTC 100.0 100.0 0.0
Item 5b Attachment 2, Page 38 of 53

Commentary – LTC
♦ With a 61% of asset target assigned to U.S. fixed income, the Long-Term Care Program’s 2.1% Q2 return was also on the modest side among the Affiliates funds. However, relative to LRS’ 1.9% total return, LTC’s results came in slightly stronger primarily due to its smaller TIPS exposure and higher target to REITs, where the former asset class was nearly flat for the quarter while the latter participated in public equity market’s advance. Thanks to the Program’s higher-than-target allocation weights in global equity and REITs, LTC also outperformed its own policy benchmark by 12 bps during Q2. Over longer time horizon, the Program has done well and is currently beating the policy benchmark in all measured periods 1-year and beyond.
♦ The LTC’s asset allocation showed that it was overweight in global equity and REITs, while underweight in U.S. fixed income, TIPS and commodities.
♦ With a net gain of 4.3%, the global equity fund was the strongest performer among all LTC investments during the second quarter of 2017. The fund successfully participated in the continued rise in global equity valuations, where markets in both developed and emerging world mostly registered advance on the backs of upbeat economic data; and this solid Q2 results easily matched the custom benchmark’s pace. Longer-term track record remains in great shape as well, as the global equity fund has accumulated market-like gains beyond the 1-year mark and continues to perform in line with expectations.
♦ The LTC fixed income fund finished the second quarter on a sound note, reporting a 2.2% gain. This solid performance was achieved within the favorable backdrop of continued flattening of the U.S. yield curve, where modest decline in long-term rates provided a tailwind to the Program’s longer duration bond portfolio. Q2’s return came in on par with the fund’s custom Bloomberg Barclays benchmark, and allowed the fixed income fund’s track record to maintain its small relative edge over the long-term.
♦ With inflation readings edging lower after March that coincided with a drop of oil prices, inflation protection was not part of investor focus during Q2. Within this soft condition, the LTC TIPS portfolio fared similarly to the Bloomberg Barclays U.S. TIPS Index this quarter, turning in a -0.4% drop. Reflecting recent year’s mild inflation pressure, the portfolio’s 3- and 5-year returns have remain muted, registering minimal gains.
♦ Even though its return this quarter wasn’t quite as strong as the global equity portfolio, the LTC REIT portfolio did successfully extend its impressive run this year by rising 2.8% in Q2, bringing the year-to-date gain to 5.0%. Both figures came in modestly ahead of the REIT custom benchmark, and added to the portfolio’s already solid longer-term track record.
♦ Performance of the commodities portfolio remained an attention grabber this quarter, albeit in a negative way. Due to the continued sagging commodity prices, especially in energy where crude oil and natural gas have fallen by double-digit clip in the first half of 2017, the commodities portfolio recorded heavy losses in Q2. Its -5.6% decline this quarter nearly mirrored the results of the GSCI Commodity Total Return Index, and was a near-repeat of Q1’s drop. Q2’s results echoed a familiar theme for commodities over the past couple years, as both the portfolio and benchmark currently hold 5-year annualized returns in the -13.6% range.
Item 5b Attachment 2, Page 39 of 53

Net of Fee Plan Performance Results – LTC
Market Value
Qtr
One Year
Three Year
Five Year
Ten Year
Long-Term Care (“LTC”) $4,375.6 mil 2.1% 1.6% 2.0% 3.9% 3.6% Weighted Policy Benchmark69 1.9 1.5 1.8 3.7 3.5
LTC Global Equity $706.1 mil 4.3 19.4 5.2 11.0 4.2 Custom Benchmark 70 4.2 19.0 4.9 10.8 4.1 LTC US Fixed Income $2,661.2mil 2.2 -0.8 3.5 3.1 6.3 Custom Benchmark 71 2.2 -0.9 3.5 2.9 6.1 LTC TIPS $257.1 mil -0.4 -0.6 0.6 0.2 4.3 Bloomberg Barclays U.S. TIPS Index -0.4 -0.6 0.6 0.3 4.3 LTC REITs $540.3 mil 2.8 -0.1 3.8 7.6 1.8 Custom Benchmark 72 2.6 -0.9 3.1 7.0 1.4 LTC Commodities $210.9 mil -5.6 -9.2 -24.8 -13.6 -.- GSCI Total Return Index -5.5 -9.0 -24.8 -13.7 -.- LTC Cash/Short-Term $0.0 mil 0.2 6.6 2.2 1.3 1.3 91-Day Treasury Bill 0.2 0.5 0.2 0.2 0.6
69 The weighted policy benchmark returns are calculated based on asset class index returns weighted by asset class policy targets. 70 Effective 12/12/2012 the domestic and international equity asset classes were aggregated into a single global equity asset class,
benchmarked against the MSCI ACWI IMI (net). 71 The LTC US Fixed Income Custom Benchmark is the Bloomberg Barclays Long Liability Index. Barclays Long Liability ex TIPS ex High Yield
was the benchmark between June 2007 and July 2005. Prior of that the benchmark was the Barclays Aggregate Bond Index. 72 Effective 12/12/2012, the REIT Custom Benchmark changed to the FTSE EPRA/NAREIT Developed Liquid (net) Index.
Item 5b Attachment 2, Page 40 of 53
California Employees’ Retiree Benefit Trust
Item 5b Attachment 2, Page 41 of 53

Capital Market Overview
U.S. Equity Market The U.S. stock market, represented by the Wilshire 5000 Total Market IndexSM, was up 2.95% for the second quarter of 2017. The market has been quite strong during the past five years with only one negative quarter and an annualized five-year return of 14.6%. Economic releases during the second quarter were solid with growth in both the economy and labor market. While wage growth has been quite modest it has generally outpaced inflation. Corporate earnings reports during the quarter were stronger than many expected with Financials leading the way but weakness in the Energy sector. The Federal Open Market Committee raised the Fed Funds rate in June by 0.25%, the second such increase this year.
Large capitalization stocks outperformed smaller shares with the Wilshire Large-Cap IndexSM up 3.08% versus a gain of 1.65% for the Wilshire US Small-Cap IndexSM. Small cap performed better, however, for the one-year period although both segments have been quite strong. The Wilshire US Micro-Cap IndexSM was up 3.53% for the quarter and 28.34% for the one-year. Growth stocks led value during the second quarter in both large- and small-cap spaces and lead for the past twelve months.
Sector performance was varied during the quarter. The best performing sector was Health Care (+7.3%) with IT (+4.3%) and Industrials (+4.2%) close behind. Two sectors were in negative territory; Energy (-7.3%) and Telecom Services (-6.7%).
The U.S. equity market has produced an outstanding 14.6% annualized return during the past five years by producing very few (one) negative quarters. The five-year risk (as defined by standard deviation) of 7.8% as-of June 30 is approaching a historic low for the Wilshire 5000 Index. The observed risk last hit this level just as the U.S. was entering the “dot com” bubble in 1997. What makes the current five-year window so intriguing is that it encompasses the period after the market completely recovered from the global debt crisis sell-off. While this is no indication that a correction is imminent, the path of future returns is not likely to be as smooth.
Fixed Income Market The U.S. Treasury yield curve continued to flatten during the quarter with the one-year yield up 21 basis points and the thirty-year down 18 basis points. The bellwether 10-year Treasury yield ended the quarter at 2.31%, down slightly but much higher than a year ago (1.49%). The Federal Open Market Committee decided to increase their overnight rate by 0.25% at their June meeting, their fourth increase since 2008. Credit spreads continued lower during the quarter in both investment grade and high yield bonds. High yield spreads, which have averaged 6% during the past decade, were below 4% during the quarter and stood at 3.6% as-of June 30.
Non-U.S. Markets Equity markets outside of the U.S. produced very strong returns during the second quarter of 2017, in both developed and emerging markets. The U.S. dollar continued to weaken during the quarter, providing an additional boost for U.S. investors holding foreign currencies. While economic releases out of Europe continue to improve, Britain is showing signs of struggling with Brexit; although stocks in the U.K. are still producing positive returns. Japanese equities lifted the Pacific index higher as the labor market in Japan improved during the quarter as did domestic demand and consumption. Emerging Markets are up the most in 2017 among the three major
Item 5b Attachment 2, Page 42 of 53
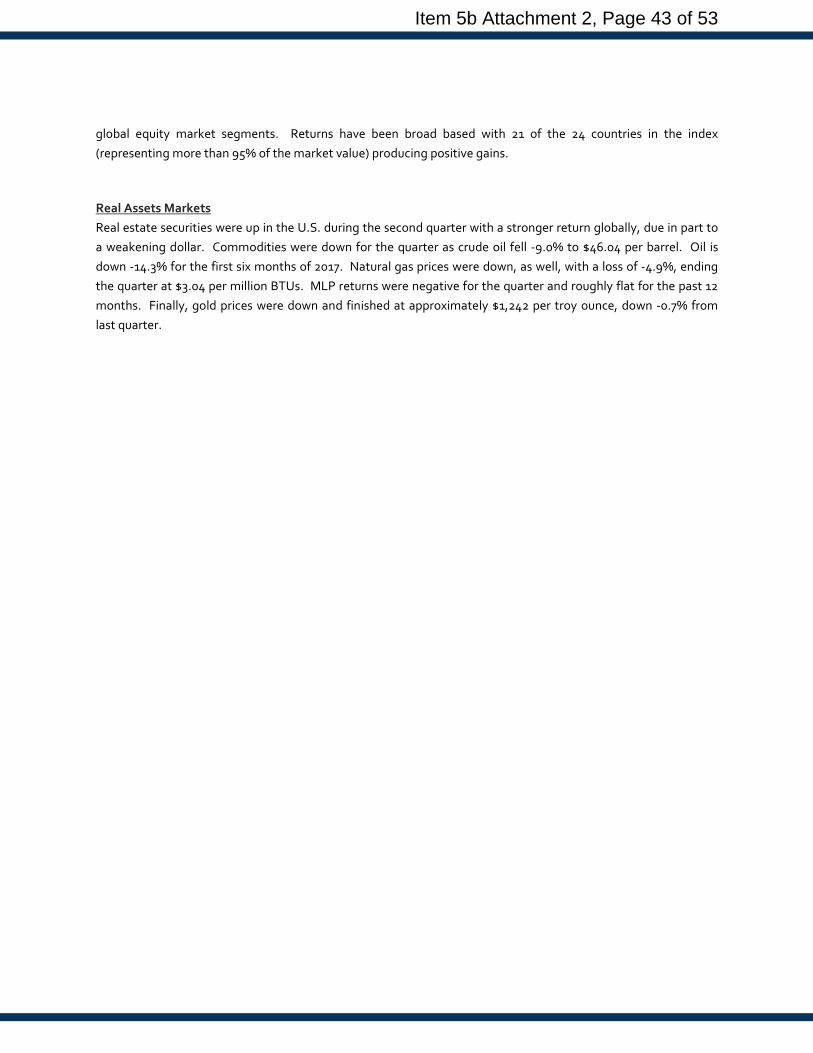
global equity market segments. Returns have been broad based with 21 of the 24 countries in the index (representing more than 95% of the market value) producing positive gains.
Real Assets Markets Real estate securities were up in the U.S. during the second quarter with a stronger return globally, due in part to a weakening dollar. Commodities were down for the quarter as crude oil fell -9.0% to $46.04 per barrel. Oil is down -14.3% for the first six months of 2017. Natural gas prices were down, as well, with a loss of -4.9%, ending the quarter at $3.04 per million BTUs. MLP returns were negative for the quarter and roughly flat for the past 12 months. Finally, gold prices were down and finished at approximately $1,242 per troy ounce, down -0.7% from last quarter.
Item 5b Attachment 2, Page 43 of 53
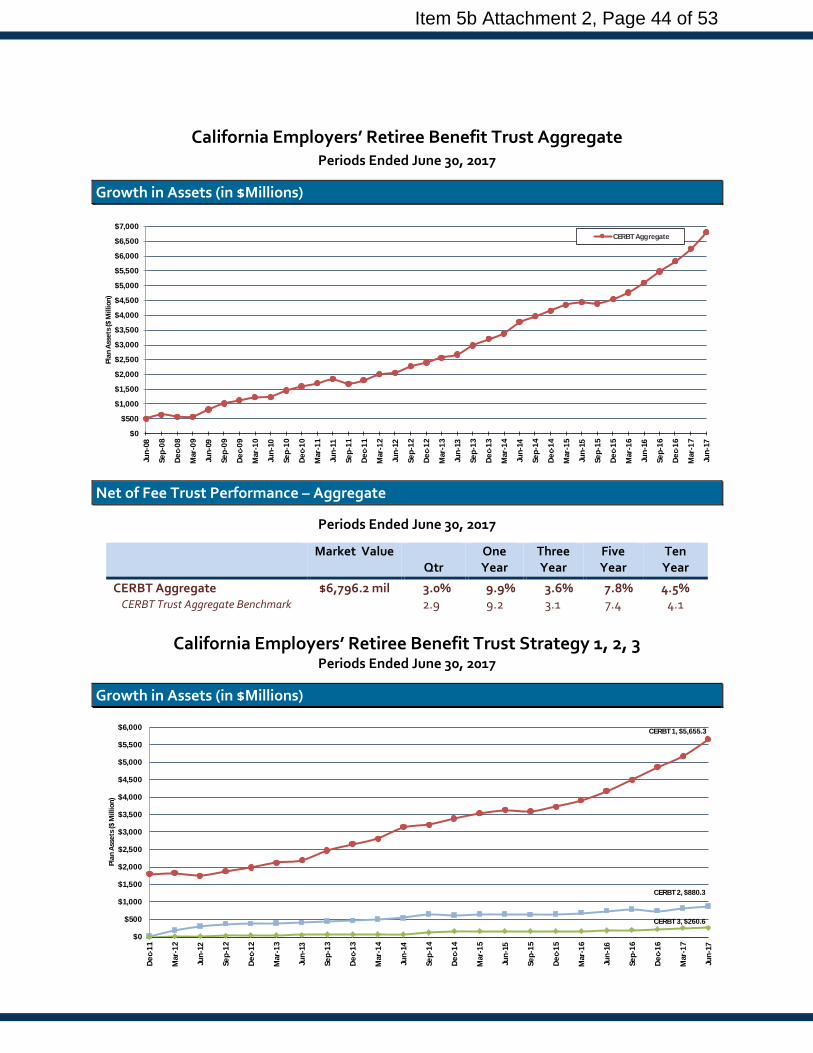
California Employers’ Retiree Benefit Trust Aggregate Periods Ended June 30, 2017
Growth in Assets (in $Millions)
$0
$500
$1,000
$1,500
$2,000
$2,500
$3,000
$3,500
$4,000
$4,500
$5,000
$5,500
$6,000
$6,500
$7,000
Jun-
08
Sep-
08
Dec-
08
Mar
-09
Jun-
09
Sep-
09
Dec-
09
Mar
-10
Jun-
10
Sep-
10
Dec-
10
Mar
-11
Jun-
11
Sep-
11
Dec-
11
Mar
-12
Jun-
12
Sep-
12
Dec-
12
Mar
-13
Jun-
13
Sep-
13
Dec-
13
Mar
-14
Jun-
14
Sep-
14
Dec-
14
Mar
-15
Jun-
15
Sep-
15
Dec-
15
Mar
-16
Jun-
16
Sep-
16
Dec-
16
Mar
-17
Jun-
17
Plan
Ass
ets (
$ M
illio
n)
CERBT Aggregate
Net of Fee Trust Performance – Aggregate
Periods Ended June 30, 2017
Market Value Qtr
One Year
Three Year
Five Year
Ten Year
CERBT Aggregate $6,796.2 mil 3.0% 9.9% 3.6% 7.8% 4.5% CERBT Trust Aggregate Benchmark 2.9 9.2 3.1 7.4 4.1
California Employers’ Retiree Benefit Trust Strategy 1, 2, 3
Periods Ended June 30, 2017
Growth in Assets (in $Millions)
CERBT 1, $5,655.3
CERBT 2, $880.3
CERBT 3, $260.6
$0
$500
$1,000
$1,500
$2,000
$2,500
$3,000
$3,500
$4,000
$4,500
$5,000
$5,500
$6,000
Dec-
11
Mar
-12
Jun-
12
Sep-
12
Dec-
12
Mar
-13
Jun-
13
Sep-
13
Dec-
13
Mar
-14
Jun-
14
Sep-
14
Dec-
14
Mar
-15
Jun-
15
Sep-
15
Dec-
15
Mar
-16
Jun-
16
Sep-
16
Dec-
16
Mar
-17
Jun-
17
Plan
Ass
ets (
$ M
illio
n)
Item 5b Attachment 2, Page 44 of 53

California Employers’ Retiree Benefit Trust Strategy 1
Asset Allocation
Asset Class Actual Policy Difference Global Equity 55.8% 57.0% -1.2% US Bonds 26.3 27.0 -0.7 TIPS 4.6 5.0 -0.4 REITS 7.8 8.0 -0.2 Commodities 3.0 3.0 0.0
Cash/Short-Term± 2.4 0.0 +2.4
Total CERBT 1 100.0 100.0 0.0
Net of Fee Trust Performance Results
Trust Performance Periods Ended June 30, 2017
Market Value Qtr
One Year
Three Year
Five Year
Ten Year
CERBT Strategy 1 $5,655.3 mil 3.1% 10.6% 3.7% 8.1% 4.6% Total CERBT Strat. 1 Benchmark 3.0 9.9 3.2 7.7 4.2
Global Equity 3,158.4 mil 4.3 19.4 5.2 11.1 4.1 CERBT Global Equity Benchmark 4.2 19.0 4.9 10.8 4.0 Domestic Fixed Income 1,487.6 mil 2.3 0.3 4.3 3.9 6.7 CalPERS Custom Long Liability 2.2 -0.9 3.5 2.9 6.1 TIPS 262.8 mil -0.4 -0.6 0.6 0.2 -.- CalPERS TIPS -0.4 -0.6 0.6 0.3 -.- REITs 439.9 mil 2.8 -0.1 3.9 7.6 2.2 PERS FTSE/EPRA NAREIT Dev. Li id
2.6 -0.9 3.1 7.0 1.4 Commodities 169.9 mil -5.5 -8.9 -24.8 -14.0 -.- GSCI Total Return -5.5 -9.0 -24.8 -13.7 -.- Cash/Short-Term± 136.7 mil 0.4 1.1 0.5 0.3 0.7 91-Day T-Bill 0.2 0.5 0.2 0.2 0.6
± Cash balances are inclusive of employer fund contributions that are in the process of being invested into asset classes. These contributions occur daily, but tend to be higher at the end of each quarter.
Item 5b Attachment 2, Page 45 of 53

California Employers’ Retiree Benefit Trust Strategy 2
Asset Allocation
Asset Class Actual Policy Difference Global Equity 40.0% 40.0% 0.0% US Bonds 38.7 39.0 -0.3 TIPS 9.4 10.0 -0.6 REITS 7.9 8.0 -0.1 Commodities 3.1 3.0 +0.1
Cash/Short-Term± 0.8 0.0 +0.8
Total CERBT 2 100.0 100.0 0.0
Net of Fee Trust Performance Results
Trust Performance Periods Ended June 30, 2017
Market Value Qtr
One Year
Three Year
Five Year
Ten Year
CERBT Strategy 2 $880.3 mil 2.7% 7.2% 3.2% 6.7% -.-% Total CERBT Strat. 2 Benchmark 2.6 6.5 2.8 6.3 -.-
Global Equity 352.1 mil 4.3 19.5 5.2 11.2 -.- CERBT Global Equity Benchmark 4.2 19.0 4.9 11.0 -.- Domestic Fixed Income 341.0 mil 2.3 0.3 4.3 3.9 -.- CalPERS Custom Long Liability 2.2 -0.9 3.5 2.9 -.- TIPS 82.6 mil -0.4 -0.6 0.5 0.2 -.- CalPERS TIPS -0.4 -0.6 0.6 0.3 -.- REITs 69.8 mil 2.8 -0.0 3.8 7.6 -.- PERS FTSE/EPRA NAREIT Dev Liquid 2.6 -0.9 3.1 7.0 -.- Commodities 27.6 mil -5.5 -8.9 -24.8 -14.0 -.- GSCI Total Return -5.5 -9.0 -24.8 -13.7 -.- Cash/Short-Term± 7.2 mil 0.6 1.8 0.8 0.5 -.- 91-Day T-Bill 0.2 0.5 0.2 0.2 -.-
± Cash balances are inclusive of employer fund contributions that are in the process of being invested into asset classes. These contributions occur daily, but tend to be higher at the end of each quarter.
Item 5b Attachment 2, Page 46 of 53
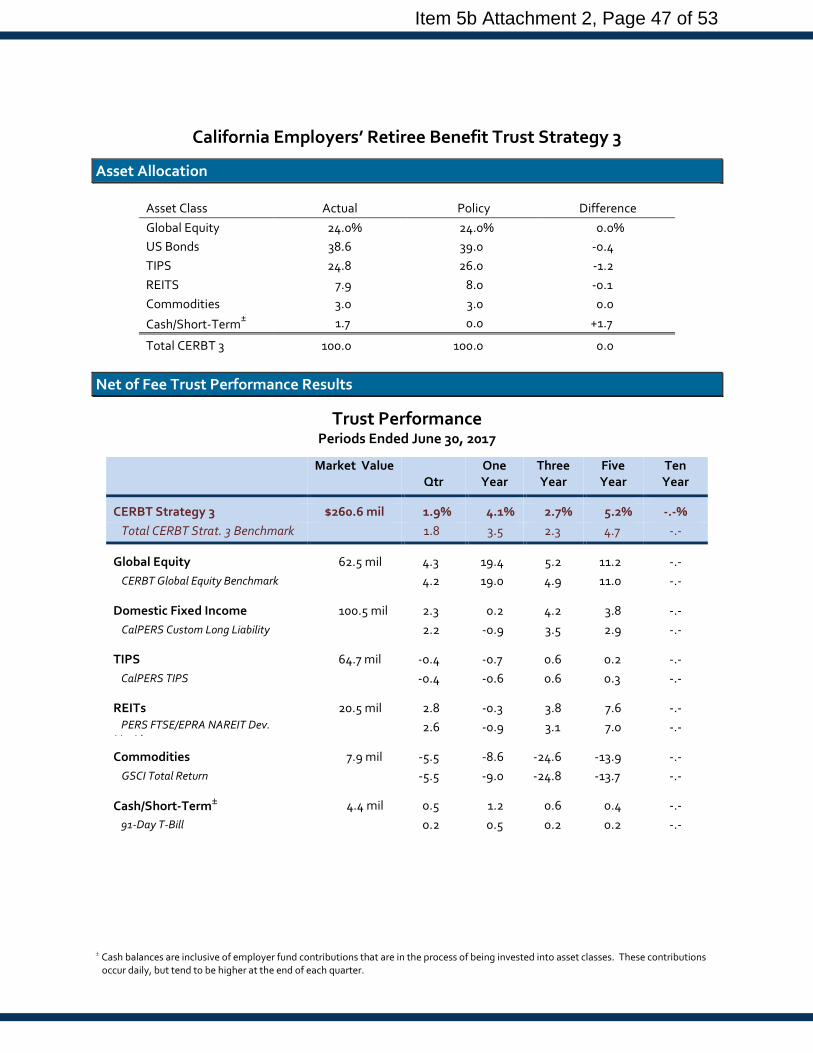
California Employers’ Retiree Benefit Trust Strategy 3
Asset Allocation
Asset Class Actual Policy Difference Global Equity 24.0% 24.0% 0.0% US Bonds 38.6 39.0 -0.4 TIPS 24.8 26.0 -1.2 REITS 7.9 8.0 -0.1 Commodities 3.0 3.0 0.0
Cash/Short-Term± 1.7 0.0 +1.7
Total CERBT 3 100.0 100.0 0.0
Net of Fee Trust Performance Results
Trust Performance Periods Ended June 30, 2017
Market Value Qtr
One Year
Three Year
Five Year
Ten Year
CERBT Strategy 3 $260.6 mil 1.9% 4.1% 2.7% 5.2% -.-% Total CERBT Strat. 3 Benchmark 1.8 3.5 2.3 4.7 -.-
Global Equity 62.5 mil 4.3 19.4 5.2 11.2 -.- CERBT Global Equity Benchmark 4.2 19.0 4.9 11.0 -.- Domestic Fixed Income 100.5 mil 2.3 0.2 4.2 3.8 -.- CalPERS Custom Long Liability 2.2 -0.9 3.5 2.9 -.- TIPS 64.7 mil -0.4 -0.7 0.6 0.2 -.- CalPERS TIPS -0.4 -0.6 0.6 0.3 -.- REITs 20.5 mil 2.8 -0.3 3.8 7.6 -.- PERS FTSE/EPRA NAREIT Dev. Li id
2.6 -0.9 3.1 7.0 -.- Commodities 7.9 mil -5.5 -8.6 -24.6 -13.9 -.- GSCI Total Return -5.5 -9.0 -24.8 -13.7 -.- Cash/Short-Term± 4.4 mil 0.5 1.2 0.6 0.4 -.- 91-Day T-Bill 0.2 0.5 0.2 0.2 -.-
± Cash balances are inclusive of employer fund contributions that are in the process of being invested into asset classes. These contributions occur daily, but tend to be higher at the end of each quarter.
Item 5b Attachment 2, Page 47 of 53

Health Care Fund
Item 5b Attachment 2, Page 48 of 53
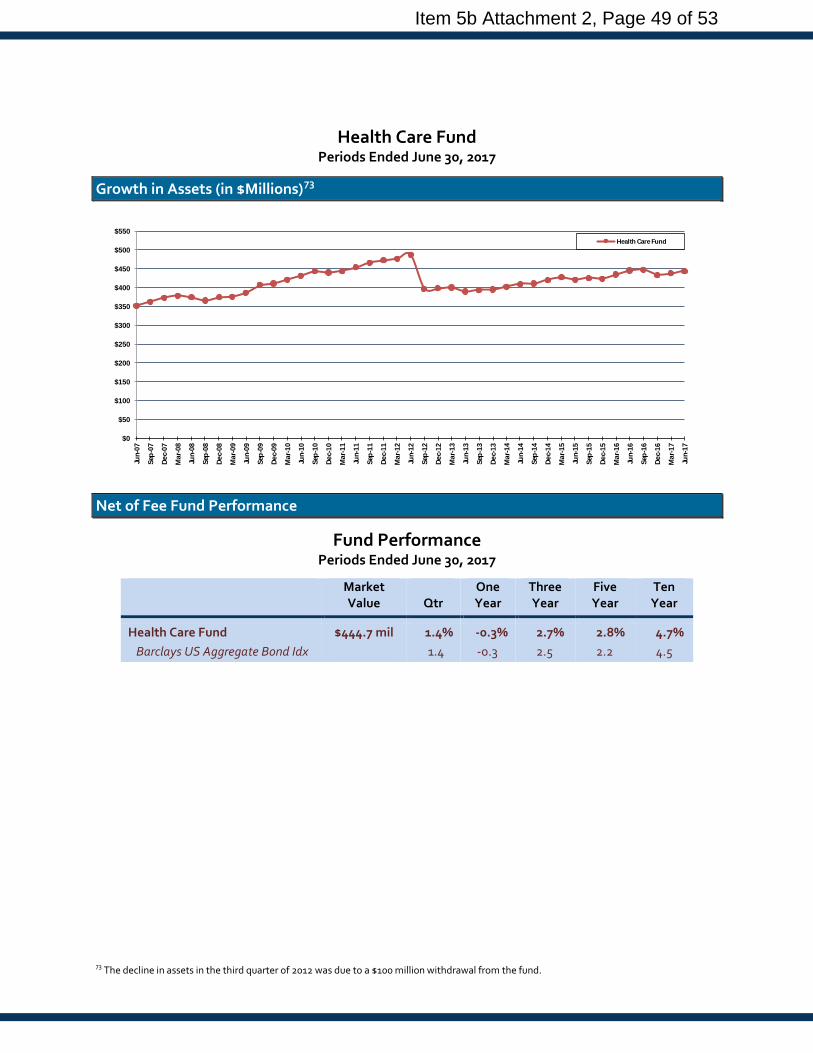
Health Care Fund Periods Ended June 30, 2017
Growth in Assets (in $Millions)73
$0
$50
$100
$150
$200
$250
$300
$350
$400
$450
$500
$550
Jun-
07
Sep-
07
Dec-
07
Mar
-08
Jun-
08
Sep-
08
Dec-
08
Mar
-09
Jun-
09
Sep-
09
Dec-
09
Mar
-10
Jun-
10
Sep-
10
Dec-
10
Mar
-11
Jun-
11
Sep-
11
Dec-
11
Mar
-12
Jun-
12
Sep-
12
Dec-
12
Mar
-13
Jun-
13
Sep-
13
Dec-
13
Mar
-14
Jun-
14
Sep-
14
Dec-
14
Mar
-15
Jun-
15
Sep-
15
Dec-
15
Mar
-16
Jun-
16
Sep-
16
Dec-
16
Mar
-17
Jun-
17
Health Care Fund
Net of Fee Fund Performance
Fund Performance Periods Ended June 30, 2017
Market Value
Qtr
One Year
Three Year
Five Year
Ten Year
Health Care Fund $444.7 mil 1.4% -0.3% 2.7% 2.8% 4.7% Barclays US Aggregate Bond Idx 1.4 -0.3 2.5 2.2 4.5
73 The decline in assets in the third quarter of 2012 was due to a $100 million withdrawal from the fund.
Item 5b Attachment 2, Page 49 of 53

Supplemental Income Plans
Item 5b Attachment 2, Page 50 of 53
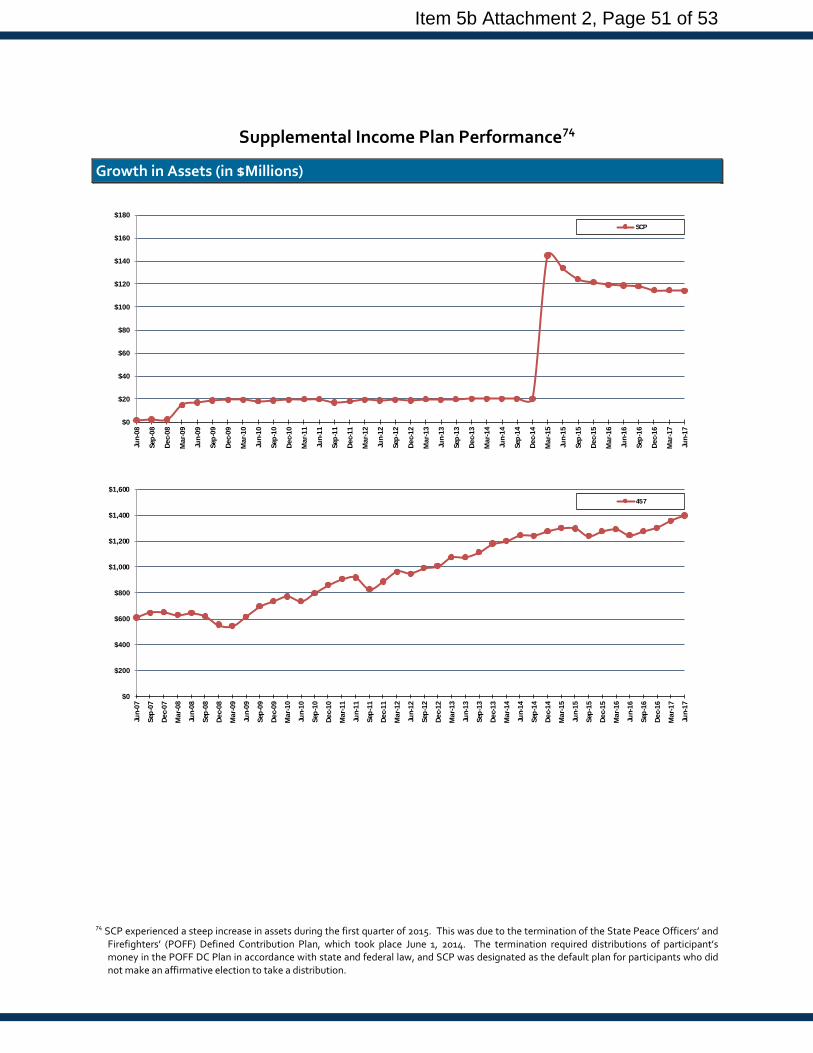
Supplemental Income Plan Performance74
Growth in Assets (in $Millions)
$0
$20
$40
$60
$80
$100
$120
$140
$160
$180
Jun-
08
Sep-
08
Dec-
08
Mar
-09
Jun-
09
Sep-
09
Dec-
09
Mar
-10
Jun-
10
Sep-
10
Dec-
10
Mar
-11
Jun-
11
Sep-
11
Dec-
11
Mar
-12
Jun-
12
Sep-
12
Dec-
12
Mar
-13
Jun-
13
Sep-
13
Dec-
13
Mar
-14
Jun-
14
Sep-
14
Dec-
14
Mar
-15
Jun-
15
Sep-
15
Dec-
15
Mar
-16
Jun-
16
Sep-
16
Dec-
16
Mar
-17
Jun-
17
SCP
$0
$200
$400
$600
$800
$1,000
$1,200
$1,400
$1,600
Jun-
07
Sep-
07
Dec-
07
Mar
-08
Jun-
08
Sep-
08
Dec-
08
Mar
-09
Jun-
09
Sep-
09
Dec-
09
Mar
-10
Jun-
10
Sep-
10
Dec-
10
Mar
-11
Jun-
11
Sep-
11
Dec-
11
Mar
-12
Jun-
12
Sep-
12
Dec-
12
Mar
-13
Jun-
13
Sep-
13
Dec-
13
Mar
-14
Jun-
14
Sep-
14
Dec-
14
Mar
-15
Jun-
15
Sep-
15
Dec-
15
Mar
-16
Jun-
16
Sep-
16
Dec-
16
Mar
-17
Jun-
17
457
74 SCP experienced a steep increase in assets during the first quarter of 2015. This was due to the termination of the State Peace Officers’ and Firefighters’ (POFF) Defined Contribution Plan, which took place June 1, 2014. The termination required distributions of participant’s money in the POFF DC Plan in accordance with state and federal law, and SCP was designated as the default plan for participants who did not make an affirmative election to take a distribution.
Item 5b Attachment 2, Page 51 of 53
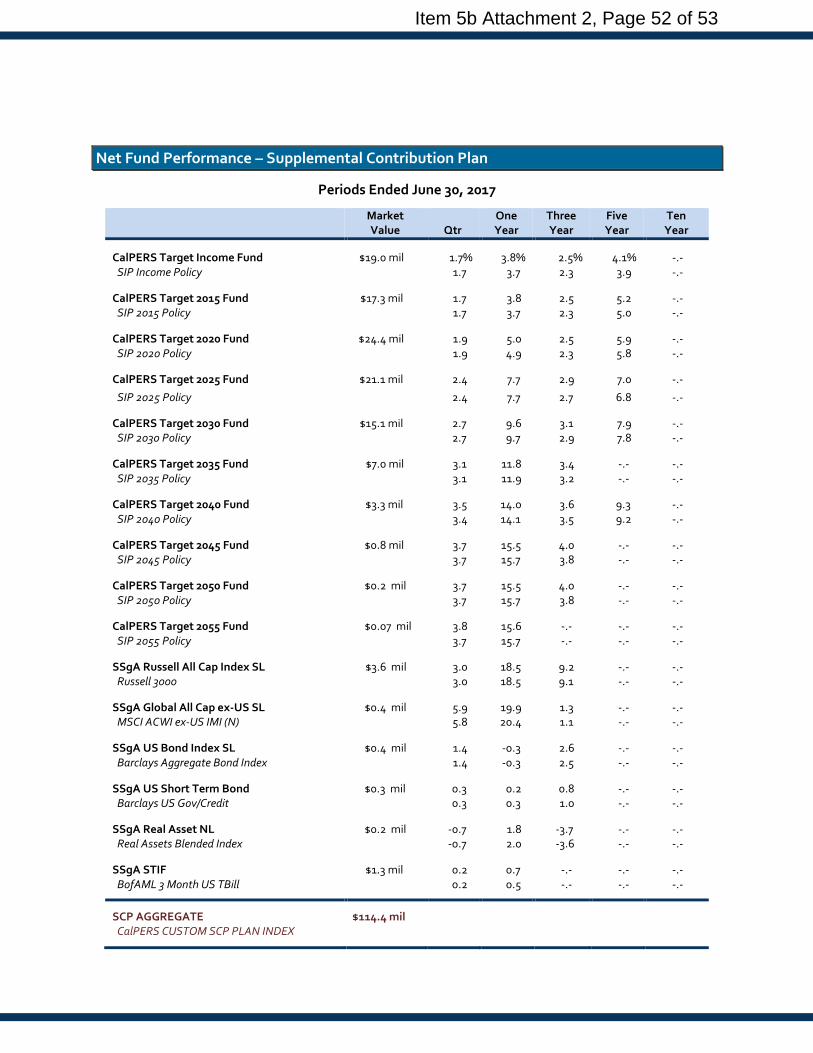
Net Fund Performance – Supplemental Contribution Plan
Periods Ended June 30, 2017
Market Value
Qtr
One Year
Three Year
Five Year
Ten Year
CalPERS Target Income Fund $19.0 mil 1.7% 3.8% 2.5% 4.1% -.- SIP Income Policy 1.7 3.7 2.3 3.9 -.-
CalPERS Target 2015 Fund $17.3 mil 1.7 3.8 2.5 5.2 -.- SIP 2015 Policy 1.7 3.7 2.3 5.0 -.-
CalPERS Target 2020 Fund $24.4 mil 1.9 5.0 2.5 5.9 -.- SIP 2020 Policy 1.9 4.9 2.3 5.8 -.-
CalPERS Target 2025 Fund $21.1 mil 2.4 7.7 2.9 7.0 -.-
SIP 2025 Policy 2.4 7.7 2.7 6.8 -.-
CalPERS Target 2030 Fund $15.1 mil 2.7 9.6 3.1 7.9 -.- SIP 2030 Policy 2.7 9.7 2.9 7.8 -.-
CalPERS Target 2035 Fund $7.0 mil 3.1 11.8 3.4 -.- -.- SIP 2035 Policy 3.1 11.9 3.2 -.- -.-
CalPERS Target 2040 Fund $3.3 mil 3.5 14.0 3.6 9.3 -.- SIP 2040 Policy 3.4 14.1 3.5 9.2 -.-
CalPERS Target 2045 Fund $0.8 mil 3.7 15.5 4.0 -.- -.- SIP 2045 Policy 3.7 15.7 3.8 -.- -.-
CalPERS Target 2050 Fund $0.2 mil 3.7 15.5 4.0 -.- -.- SIP 2050 Policy 3.7 15.7 3.8 -.- -.-
CalPERS Target 2055 Fund $0.07 mil 3.8 15.6 -.- -.- -.- SIP 2055 Policy 3.7 15.7 -.- -.- -.-
SSgA Russell All Cap Index SL $3.6 mil 3.0 18.5 9.2 -.- -.- Russell 3000 3.0 18.5 9.1 -.- -.-
SSgA Global All Cap ex-US SL $0.4 mil 5.9 19.9 1.3 -.- -.- MSCI ACWI ex-US IMI (N) 5.8 20.4 1.1 -.- -.-
SSgA US Bond Index SL $0.4 mil 1.4 -0.3 2.6 -.- -.- Barclays Aggregate Bond Index 1.4 -0.3 2.5 -.- -.-
SSgA US Short Term Bond $0.3 mil 0.3 0.2 0.8 -.- -.- Barclays US Gov/Credit 0.3 0.3 1.0 -.- -.-
SSgA Real Asset NL $0.2 mil -0.7 1.8 -3.7 -.- -.- Real Assets Blended Index -0.7 2.0 -3.6 -.- -.-
SSgA STIF $1.3 mil 0.2 0.7 -.- -.- -.- BofAML 3 Month US TBill 0.2 0.5 -.- -.- -.-
SCP AGGREGATE $114.4 mil CalPERS CUSTOM SCP PLAN INDEX
Item 5b Attachment 2, Page 52 of 53
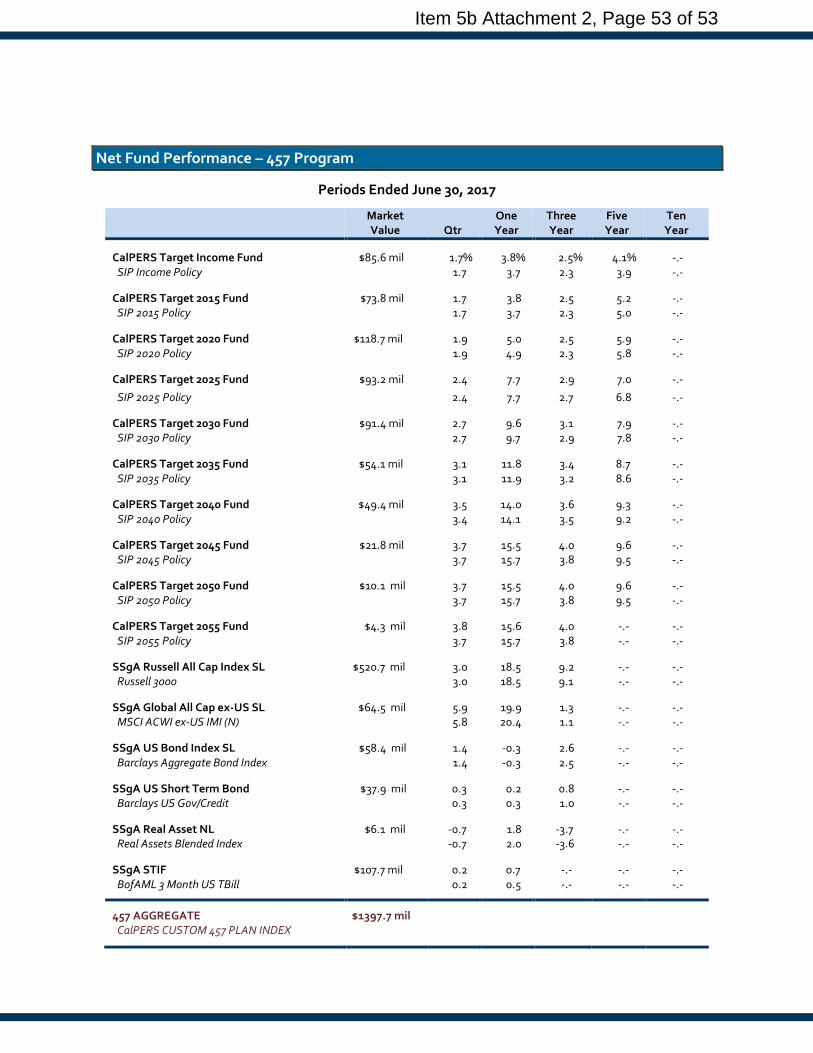
Net Fund Performance – 457 Program
Periods Ended June 30, 2017
Market Value
Qtr
One Year
Three Year
Five Year
Ten Year
CalPERS Target Income Fund $85.6 mil 1.7% 3.8% 2.5% 4.1% -.- SIP Income Policy 1.7 3.7 2.3 3.9 -.-
CalPERS Target 2015 Fund $73.8 mil 1.7 3.8 2.5 5.2 -.- SIP 2015 Policy 1.7 3.7 2.3 5.0 -.-
CalPERS Target 2020 Fund $118.7 mil 1.9 5.0 2.5 5.9 -.- SIP 2020 Policy 1.9 4.9 2.3 5.8 -.-
CalPERS Target 2025 Fund $93.2 mil 2.4 7.7 2.9 7.0 -.-
SIP 2025 Policy 2.4 7.7 2.7 6.8 -.-
CalPERS Target 2030 Fund $91.4 mil 2.7 9.6 3.1 7.9 -.- SIP 2030 Policy 2.7 9.7 2.9 7.8 -.-
CalPERS Target 2035 Fund $54.1 mil 3.1 11.8 3.4 8.7 -.- SIP 2035 Policy 3.1 11.9 3.2 8.6 -.-
CalPERS Target 2040 Fund $49.4 mil 3.5 14.0 3.6 9.3 -.- SIP 2040 Policy 3.4 14.1 3.5 9.2 -.-
CalPERS Target 2045 Fund $21.8 mil 3.7 15.5 4.0 9.6 -.- SIP 2045 Policy 3.7 15.7 3.8 9.5 -.-
CalPERS Target 2050 Fund $10.1 mil 3.7 15.5 4.0 9.6 -.- SIP 2050 Policy 3.7 15.7 3.8 9.5 -.-
CalPERS Target 2055 Fund $4.3 mil 3.8 15.6 4.0 -.- -.- SIP 2055 Policy 3.7 15.7 3.8 -.- -.-
SSgA Russell All Cap Index SL $520.7 mil 3.0 18.5 9.2 -.- -.- Russell 3000 3.0 18.5 9.1 -.- -.-
SSgA Global All Cap ex-US SL $64.5 mil 5.9 19.9 1.3 -.- -.- MSCI ACWI ex-US IMI (N) 5.8 20.4 1.1 -.- -.-
SSgA US Bond Index SL $58.4 mil 1.4 -0.3 2.6 -.- -.- Barclays Aggregate Bond Index 1.4 -0.3 2.5 -.- -.-
SSgA US Short Term Bond $37.9 mil 0.3 0.2 0.8 -.- -.- Barclays US Gov/Credit 0.3 0.3 1.0 -.- -.-
SSgA Real Asset NL $6.1 mil -0.7 1.8 -3.7 -.- -.- Real Assets Blended Index -0.7 2.0 -3.6 -.- -.-
SSgA STIF $107.7 mil 0.2 0.7 -.- -.- -.- BofAML 3 Month US TBill 0.2 0.5 -.- -.- -.-
457 AGGREGATE $1397.7 mil CalPERS CUSTOM 457 PLAN INDEX
Item 5b Attachment 2, Page 53 of 53