Embed Size (px)
Citation preview
PLP 2016-17
Nalbari District
1
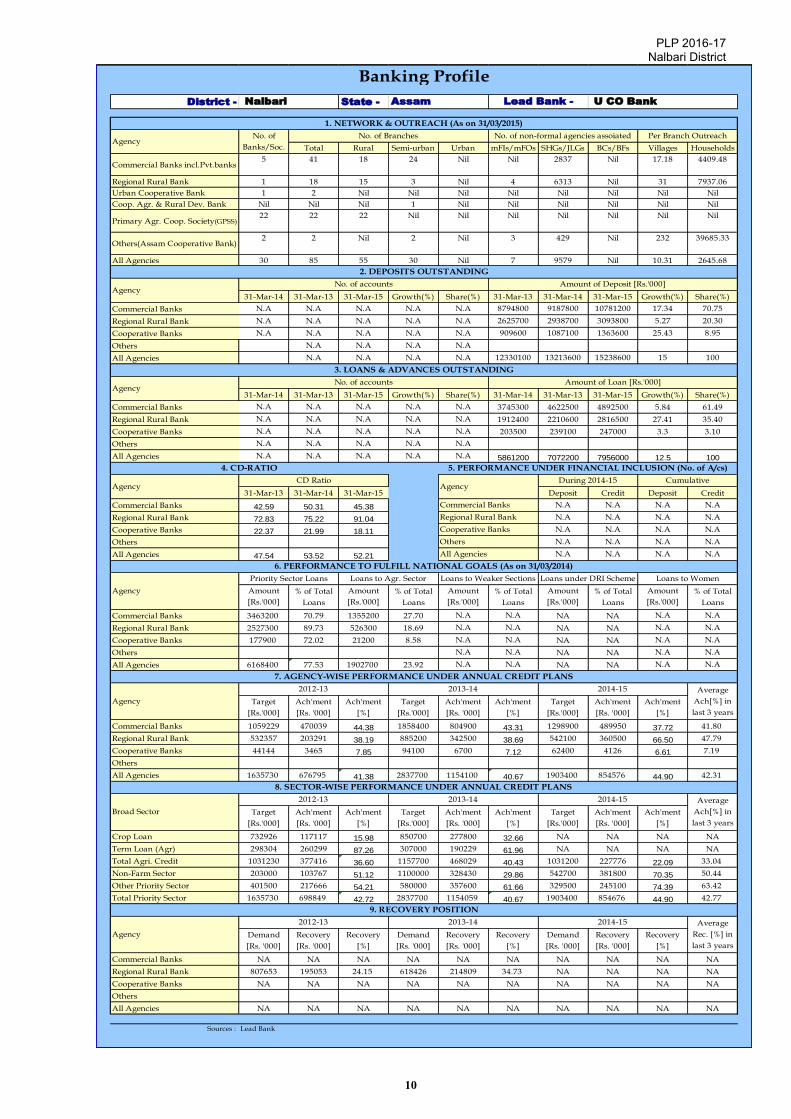
EXECUTIVE SUMMARY Around 89.0% of the total population of the district live in villages and agriculture is the main occupation of the people engaging about 70% of the working population. No major industrial unit exists in the district. Paddy is the major agricultural crop and mustard, potato and pulses are other major crops. Fruits and vegetables are cultivated on a moderate scale. Poultry, piggery, fishery, dairy and goat rearing are the major allied agricultural activities. Sericulture, especially eri and muga rearing, is gaining popularity among villagers in some pockets in the district. The criticality of capital formation ‘in’ and ‘for’ agriculture need not be overemphasized. However, the recent declining trend in investment credit vis-à-vis crop loan has serious implications for sustaining capital formation. The theme selected for the PLP 2016-17 is “Accelerating the pace of capital formation in agriculture and allied sector”. The PLP maps the potential in priority sectors which could be exploited with institutional credit within a specified time frame. PLP are intended to provide a meaningful direction to the flow of credit to different sectors at the ground level taking into account all relevant factors. The various linkages and other support required to be provided by line departments to facilitate credit flow as planned are also listed in the PLP. Agriulture is the main economic activity in the district. About 70% of the working population in the district is engaged in agriculture. There is no major industrial unit exists in the district. Weaving is widely done by the women in the district to generate additional income for the family. Fish production is also an important activity in the district. The strength of the district lies in its conducive soil & climatic conditions, good communication network, high literacy rate and accessibility to markets. But the district suffers from inherent weakness such as fragmentation of land holdings, poor irrigation facilities, non-availability of quality inputs, etc. The district is affected by flood every year, caused by the Brahmaputra and its tributaries. Sub-sectoral trends and credit flow for the district could not be assessed since LBR-I is not stabilised. Achievement against Annual Creidt Plan for the year 2012-13, 2013-14 and 2014-15 were 42.71%, 40.67% and 45% respectively. District has 38 branches of Commercial banks including Private Banks, 18 branches of Assam Gramin Vikash Bank, 2 branches of Assam State Cooperative Apex Bank Ltd, 2 branches of Urban Cooperative Bank and 22 PACs provide agriculture credit to their members. The CD ratio of the district during last three years 2012-13, 2013-14 and 2014-15 were 47.54%, 53.52% and 52.21% respectively. Highlights of Policy initiatives in the field of Agriculture and Rural Development by GoI/RBI/NABARD/State Government is given in Chapter I. Ongoing Government Sponsored Programmes / schemes are given in Chapter 2. It is expected that this will serve as ready reckoner for the PLP users. Brief sectoral review and projections for 2016-17 The Potential Linked Credit Plan (PLP) of Nalbari District is intended to provide insight on the potential for development of different sectors of the rural economy of the district. It is a road map for extending credit to important sectors/sub sectors/activities. The potential of each sector/sub sector that could be tapped with institutional credit have been assessed and projection of credit need for Nalbari district has been estimated at `23760.34 lakh for the year 2016-17. Block-wise
details of estimates for 2016-17 are given in Annexure- I. The Base PLP projection (2012-17) for the year 2016-17 was estimated at 20498.14 lakh However, it is expecting that there will be increase in cost of various agriculture inputs and labour cost, fuel price hikes and certain factors like forecast of normal rainfall. Accordingly, the revised PLP projections for 2016-17 is estimated at Rs.23760.34 lakh, comprising of Rs.17918.47 lakh for Agriculture (Rs.11268.46 lakh for Crop Loans, Rs.6099.26 lakh for Agri Term Loans, Rs.326.35 for

PLP 2016-17
Nalbari District
2
Agriculture Infrastucture and Rs.224.40 lakh for Anciliary Activities), Rs. 1991.56 lakh for SME Sector and Rs.3850.31 lakh for Other Priority Sector. The sub-sectoral projections for the year 2016-17 is given as under: FARM CREDIT Production of Seasonal Crops - Short term Crop loan Subsistence agriculture is prevalent in most parts of the district. Besides, regular kharif (Sali) crops, farmers are now growing rabi and pre-kharif season crops. The net sown area of Nalbari district constitutes about 70% of the geographical area. The most important crop of the district is paddy which covers over 77% of the gross cropped area. With the promotional and financial interventions from District Agriculture Department under various ongoing schemes, there has been a perceptible change in the cropping pattern from the traditionally cultivated paddy to other crops like oil seeds and pulses. Cultivation of vegetables is also being increasingly taken up by farmers as a result of improvement in irrigation facilities with the construction of STWs/LLPs by Agriculture Department. The potential of bank loan has been assessed at ` 11268.46 lakh for production of short duration crops in the year 2016-17.
Water Resources
Development of irrigation in the district is very slow. All the blocks in the district are categorised as 'Safe' blocks. Further, there is immense potential for development of surface irrigation. However, lift irrigation projects sanctioned by State Govt. in the district have not taken off well due to paucity of funds. The percentage of net sown area having assured irrigation is estimated at 28% (19780 ha) and of this, major area i.e. 77% (15210 ha) is irrigated through STW. The irrigation potential will definitely increase after implementation of AACP-World Bank Scheme or other Government schemes. A potential of `745.99 lakh is projected for minor irrigation activities for the year 2016-
17.
Land Development Land Development sector is a broad area encompassing activities like land levelling and on-farm development works for preparing the land for irrigation, soil conservation, bunding and interbund, land grading in rainfed areas, reclamation of saline and alkaline soils, soil improvement and water management and improved rainfed farming practices etc. ` 36.97 lakh is projected as potential for
issue of bank loan for the year 2016-17. Farm Mechanisation Farm Mechanisation helps in minimising the cost of cultivation, reducing drudgery in operations and increasing cropping intensity. Many subsidy linked programmes like AACP, Assam Vikas Yojna, etc. are going on in the district to facilitate farm mechanisation. The potential for credit under this sector for the year 2016-17 estimated at ` 853.50 lakh Plantation and Horticulture The total area under plantation and horticulture crops in Nalbari district is at around 6% of the gross cropped area. Arecanut, Banana, Coconut, Betel Vine and Assam Lemon are the major plantation and horticulture crops in the district. The potential for credit under this sector is estimated at `488.77 lakh for the year 2016-17. Dairy The production of milk in the district accounts for 3% of state’s production. The per capita daily availability of milk is estimated at 90 ml. In the district farmers have already adopted stall-fed crossbreed cattle rearing, but the number is very less. With support like induction of high yielding cattle, massive AI programme, feed and fodder development programme, this sector can grow in a massive way. The potential for credit under the sector for the year 2016-17 is estimated at ` 1275.12 lakh.
PLP 2016-17
Nalbari District
3
Poultry
As per the Livestock census (2007), the poultry population of the district is 4,49,548. Commercial farming is very popular in the district and many farmers rear birds in small numbers under free range system. Supply of day old chicks to the farmers is facilitated by private parties/suppliers and a few NGOs from outside the district. The potential for credit for the sector is estimated at `1101.43 lakh for the year 2016-17.
Sheep / Goat / Piggery Sheep rearing activity has not picked up in the district when compared with goat rearing. There is good demand for pork and mutton in the district and this sector has immense potential for exploitation. The exploitable potential for bank credit has been projected `791.84 lakh for the year
2016-17.
Fisheries
The fisheries resources of Nalbari district account for 3.7% of the total resources of the state. The district is self sufficient in fish production and is in a position to supply local fish and seed to other districts. The potential for bank credit has been projected at `660.38 for the year 2016-17.
MSME
Development of agro-based industries will provide a boost to productivity and profitability of agriculture in the district. The development of rural non-farm sector activities, comprising village/cottage/de-centralised, household/tiny and small scale industries has been accepted as a major component of economic policy to tackle growing unemployment and underemployment, besides providing an avenue for supplementing farm income thereby helping in prevention of migration of rural population to urban areas. The potential for credit for the year 2016-17 is estimated at `1991.56 lakh for 2015-16.
Renewable Sources of Energy To encourage replacement of non-renewable energy sources like fossil fuels, kerosene and diesel with solar energy to meet energy requirements in rural areas there is a need for promotion of Solar energy. There is potential for solar lighting system in villages especially in Char areas which are not yet electrified. The potential for credit for the period 2016-17 is estimated at `15.91 lakh.
II . Major Constraints and action points. Lower growth in agriculture was observed due to farmers’ ignorance, low level of capital formation and poor quality of physical infrastructure. Bank credit can act as catalyst for capital formation in rural economy. III. INFRASTRUCTURE SUPPORT Infrastructure directly supports the process of production and also facilitates to sustain the growth in production and increase in income generation. Investment in rural infrastructure creates new economic opportunities and activities, generates additional employment and income, facilitates and improves delivery of other rural services and enhances democratic process and skills among the rural poor. Irrigation facilities in the district is not encouraging, to tap the agriculture potential there is an urgent need to develop irrigation facilities. There is also a need for Rural Godown and Marketing infrastructure projects in the district. These projects can be taken up in PPP mode also. Internal Crefir Delivery System - Micro Finance In order to ensure a focussed approach to rural poverty eradication in a time bound manner the SGSY has been redesigned into National Livelihood Mission (NRLM) under the aegis of the Union Ministry and Panchayati raj. The main objective of bring BPL household under SHG net. In Nalbari district Barkhetri Development Block has been taken as intensive block by NRLM and another block Paschim Nalbari is likely to be identified as intensive block. The State Govt. is also promoting formation of groups through DRDA in other blocks. There are about 53,856 rural poor households

PLP 2016-17
Nalbari District
4
and 90,721 unemployed people including 12,982 women. So, there is scope for forming more SHGs targeting BPL families and unemployed people in the district. The number of SHGs formed so far in the district is around 10412 out of which 8247 are credit linked. Area Development Plan / Scheme Considering the huge potential and demand in Dairy Sector, an area based scheme on dairy has been incorporated the Chapter. All the seven blocks have been identified for development of dairy sector in a mission mode. The project will be implemented through Women SHG/SHG Federation, FC, PO, NGO. Thrust areas for 2016-17 Infrastructure directly supports the process of production and also facilitates to sustain the growth in production and increase in income generation. Investment in rural infrastructure creates new economic opportunities and activities, generates additional employment and income, facilitates and improves delivery of other rural services and enhances democratic process and skills among the rural poor. Irrigation facilities in the district is not encouraging, to tap the agriculture potential there is an urgent need to develop irrigation facilities. There is also a need for Rural Godown and Marketing infrastructure projects in the district. These projects can be taken up in PPP mode also. There is a need for coordinated approach for enhancing capital formation, strengthening of SAMIS reporting system, better monitoring and review at BLBC, DCC meetings, effective implementation of Financial Inclusion plans including coverage of oral Lessees, Tenant Farmers into Joint Liability Groups, etc.
PLP 2016-17
Nalbari District
5
Appendix A to Annexure 1
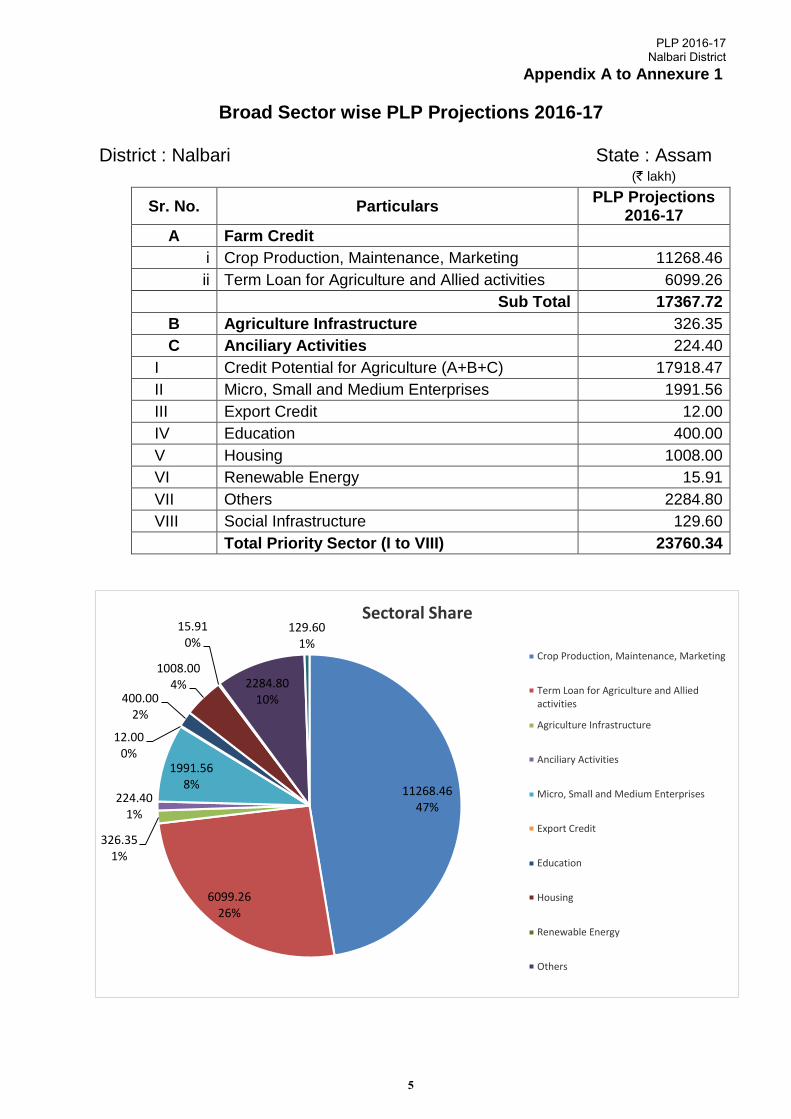
Broad Sector wise PLP Projections 2016-17
District : Nalbari State : Assam (` lakh)
Sr. No. Particulars PLP Projections
2016-17
A Farm Credit
i Crop Production, Maintenance, Marketing 11268.46
ii Term Loan for Agriculture and Allied activities 6099.26
Sub Total 17367.72
B Agriculture Infrastructure 326.35
C Anciliary Activities 224.40
I Credit Potential for Agriculture (A+B+C) 17918.47
II Micro, Small and Medium Enterprises 1991.56
III Export Credit 12.00
IV Education 400.00
V Housing 1008.00
VI Renewable Energy 15.91
VII Others 2284.80
VIII Social Infrastructure 129.60
Total Priority Sector (I to VIII) 23760.34
11268.4647%
6099.2626%
326.351%
224.401%
1991.568%
12.000%
400.002%
1008.004%
15.910%
2284.8010%
129.601%
Sectoral Share
Crop Production, Maintenance, Marketing
Term Loan for Agriculture and Alliedactivities
Agriculture Infrastructure
Anciliary Activities
Micro, Small and Medium Enterprises
Export Credit
Education
Housing
Renewable Energy
Others

PLP 2016-17
Nalbari District
6
Appendix B to
Annexure I
SUMMARY OF SECTOR / SUB-SECTOR WISE PLP PROJECTIONS 2016-17
District : Nalbari State : Assam
Sr. No. Particulars PLP Projections
2016-17
I Credit Poteltial for Agriculture
A Farm Credit
i Crop Production, Maintenance, Marketing 11268.46
ii Water Resources 745.99
iii Farm Mechanization 853.50
iv Plantation & Horticulture 488.77
v Forestry and Wasteland Development 123.35
vi Animal Husbandry - Dairy 1275.12
vii Animal Husbandry - Poultry 1101.43
viii Animal Husbandry -Sheep/Goat/Piggery 791.84
ix Fishery 660.38
x Others 58.88
Sub Total 17367.72
B Agriculture Infrastructure
i Storage Facilities 271.90
ii Land Development, Soil Conservation, Watershed Development
36.97
iii Others 17.48
Sub Total 326.35
C Anciliary Activities
i Agro & Food Processing Sector 196.40
ii Others 28.00
Sub Total 224.40
D Total Agriculture 17918.47
II Micro, Small and Medium Enterprises
MSME - Investment Credit 1569.00
MSME - Working Capital 422.56
Total MSME 1991.56
III Export Credit 12.00
IV Education 400.00
V Housing 1008.00
VI Renewable Energy 15.91
VII Others 2284.80
VIII Social Infrastructure 129.60
Total Priority Sector 23760.34

PLP 2016-17
Nalbari District
7
MAP OF NALBARI DISTRICT WITH DEVELOPMENT BLOCKS

PLP 2016-17
Nalbari District
8
District - Division -
1009.57
1
7
456
65
100483 Normal 2011-12 2012-13 2013-14
2127 1947 2444.68 1313.76
12336 -180 317.68 -813.24
1338 Balance
582 NA
2252
723
3302 Nos. % to Total Ha. % to Total
71070 37290 63.7 21487 31.72
113916 19267 32.28 31128 45.96
42846 1468 4.04 15115 22.32
2 58025 100 67730 100
58025 Total Male Female Rural Urban
56557 769.91 395.8 374.11 687.39 82.55
63000 49.86 NA NA NA NA
18000 22.8 NA NA NA NA
4286 79.89% 85.58% 73.85% NA NA
105723 269.28 NA NA NA NA
119056 NA NA
113712 NA NA
53856 69764 NA
434 1055 19
Nil 38 1
241 121 200
456
456 225 7276
38 24630 Nil
346 NA 12
380 NA Nil
330 5
21758 455 84
17394 2 1
18760
Nil 13 2
15210 921 1
Nil 38 2000
3550 286 Nil
19780 729
No of units Cap.[MT]
60 8845 Area (Ha) Prod. (MT) Area (Ha) Prod. (MT)
Nil NA 5200 4790 4930 9828 NA
4 NA 65000 143672 62000 178202 NA
26 NA 6950 18529 11000 50919 NA
Nil NA 575 705 NA NA NA
Nil NA 5000 2960 8650 6029 NA
Nil NA 2891 1564 NA NA NA
Nil NA 2150 17667 4300 27617 NA
1 NA
Category of animal Total Male Female 1 (19) 4
Cattle - Cross bred 24.00 NA NA Nil Nil
Cattle - Indigenous 235.50 NA NA 3(38) NA
Buffaloes 4.55 NA NA Nil 18
Sheep - Cross bred 14.06 NA NA Nil 4
Sheep - Indigenous NA NA Nil 1
Goat 188.99 NA NA 2 Nil
Pig - Cross bred 17.84 NA NA
Pig - Indigenous NA NA NA Fish 11340 32
Horse/Donkey/Camel 213.25 NA NA Egg 343.52 24
Poultry - Cross bred NA NA NA Milk 26.339 94
Poultry - Indigenous NA NA NA Meat 1037 4Production [MT](2011-12) Per cap avail. [gm/day]
Sources (if not mentioned against the
respective item):
Item Nos. 1, 6, 7, 9 & 10 - Census 2011; Item Nos. 2, 3, 5, 12, 13 & 14 - Dept. of Agr/Dir. of Eco. & Stat.; Item No. 4 - Dept. of Agr./Water Resources; Item No. 8 - BPL
Survey 2002; Item No. 15 - District Ind Centre/Dir. of Eco. & Stat.; Item No. 16 - DACNET; Item No. 17 - AH Census 2012; Item Nos. 18 & 19 - Dir. of Animal
Hus./Dir. of Eco. & Stat. and Vety. Deptt.
19. MILK, FISH, EGG PRODUCTION & THEIR PER CAPITA AVAILABILITY
Production [MT](2014-15) Per cap avail. [gm/day]
Production [Lakh Nos](2011-12) Per cap avail. [nos/p.a.]
Production ['000 MT](2007-08) Per cap avail. [gm/day]
Animal Husbandry Tng Centres [Nos] Fish Markets [Nos]
Dairy Cooperative Societies [Nos] Poultry hatcheries [Nos]
Improved Fodder Farms [Nos] Slaughter houses [Nos]
Disease Diagnostic Centres [Nos]Milk Collection Centres
[Nos]Artificial Insemination Centers [Nos] Fishermen Societies [Nos]
Animal Breeding Farms [Nos] Fish seed farms [Nos]
Animal feed (Cattle/Poultry/Fishmeal) Production of Cotton(lint), Jute, Mesta & Sanhemp are in Bales(177.8 kg per bale in India)
17. ANIMAL POPULATION AS PER CENSUS 2012 [in '000] 18. INFRASTRUCTURE FOR DEVELOPMENT OF ALLIED ACTIVITIESVeterinary Hospitals/Dispensaries
[Nos]Animal Markets [Nos]
Cotton (Ginnining/Spinning/Weaving) Mustard
Milk (Chilling/Cooling/Processing) Pulses
Meat (Chicken/Motton/Pork/Dryfish) Potato
Fruit (Pulp/Juice/Fruit drink) Sali Paddy
Spices (Masala Powders/Pastes) Bodo Paddy
Dry-fruit (Cashew/Almond/Raisins) Wheat
15. AGRO-PROCESSING UNITS 16. AREA, PRODUCTION & YIELD OF MAJOR CROPS
Avg. Yield
[Kg/Ha]Food (Rice/Flour/Dal/Oil/Tea/Coffee)
Sugarcane (Gur/Khandsari/Sugar) Ahu Paddy
Type of Processing ActivityCrop
2013-14 2014-15
Area irrigated by Other Sources Public Transport Vehicle [Nos] Cold Storage [Nos]
Irrigation Potential Utilized (Gross Irrigated Area) Goods Transport Vehicle [Nos] Cold Store Capacity[MT]
Area irrigated by Wells Length of Pucca Road [Km] Godown [Nos]
Area irrigated by Tanks Length of Railway Line [Km] Godown Capacity[MT]
Irrigation Potential Created Threshers/Cutters [Nos]Krishi Vigyan
Kendras[Nos]Net Irrigated Area(Total area irrigated at least once) 14. INFRASTRUCTURE FOR STORAGE, TRANSPORT & MARKETING
Area irrigated by Canals / Channels Rural/Urban Mandi/Haat [Nos] Wholesale Market [Nos]
13. IRRIGATION COVERAGE [Ha] Agriculture Tractors [Nos] Plantation nurseries [Nos]
Total Area Available for Irrigation (NIA + Fallow) Power Tillers [Nos] Farmers' Clubs [Nos]
Villages having Potable Water Supply Certified Seeds Supplied [MT] Agro Service Centres [Nos]
Villages connected with Paved Approach Roads Pesticides Consumed [MT] Soil Testing Centres [Nos]
Villages having Banking Facilities 12. INFRASTRUCTURE & SUPPORT SERVICES FOR AGRICULTURE
Villages having Primary Schools Fertiliser/Seed/Pesticide Outlets [Nos] Agriculture Pumpsets[Nos]
Villages having Primary Health Centres Total N/P/K Consumption [MT] Pumpsets Energised [Nos]
Villages having Agriculture Power Supply Primary Health Centres Hospitals
Villages having Post Offices/Sub Post Offices Primary Health Sub-Centres Hospital Beds
BPL Households Having access to banking services Having radio/tv sets
10. VILLAGE-LEVEL INFRASTRUCTURE [Nos] 11. INFRASTRUCTURE RELATING TO HEALTH & SANITATION [Nos]
Villages Electrified Anganwadis Dispensaries
Total Households Having brick/stone/concrete houses Having electricity supply
Rural Households Having source of drinking water Having independent toilets
Workers engaged in Allied Agro-activities Literate
Other workers BPL
8. HOUSEHOLDS [in '000] 9. HOUSEHOLD AMENITIES [Nos. in '000 Households]
Of the above, Small/Marginal Farmers Population
Agricultural Labourers Scheduled Caste
Workers engaged in Household Industries Scheduled Tribe
Cropping Inensity [GCA/NSA] Total
6. WORKERS PROFILE [in '000] 7. DEMOGRAPHIC PROFILE [in '000]
Cultivators Category
Net Sown Area <= 1 Ha
Total or Gross Cropped Area >1 to <=2 Ha
Area Cultivated More than Once >2 Ha
Cultivable Wasteland 5. DISTRIBUTION OF LAND HOLDING
Current FallowClassification of Holding
Holding Area
Other Fallow
Permanent Pasture and Grazing Land Availability of Ground
Water [Ham]
Net annual recharge Net annual draft
Land under Miscellaneous Tree Crops NA NA
Total Area Reported
Rainfall [in mm]Actual
Forest Land
Area Not Available for Cultivation Variation from Normal
3. LAND UTILISATION [Ha] 4. RAINFALL & GROUND WATER
Total Geographical Area (Sq.km)Agro-climatic Zone Lower Brahmaputra Valley Zone
No. of Sub Divisions
No. of Blocks Climate Subtropical in nature with warm-humid summer followed by cool and dry winter
District Profile
Nalbari State - Assam Lower Assam Division
1. PHYSICAL & ADMINISTRATIVE FEATURES 2. SOIL & CLIMATE
No. of Villages (Inhabited)Soil Type
Northern part of the district is clay loam soil , middle part sandy loam
soil and southern part alluvial soilNo. of Panchayats
PLP 2016-17
Nalbari District
10
District - State -
Total Rural Semi-urban Urban mFIs/mFOs SHGs/JLGs BCs/BFs Villages Households
Commercial Banks incl.Pvt.banks5 41 18 24 Nil Nil 2837 Nil 17.18 4409.48
Regional Rural Bank 1 18 15 3 Nil 4 6313 Nil 31 7937.06
Urban Cooperative Bank 1 2 Nil Nil Nil Nil Nil Nil Nil Nil
Coop. Agr. & Rural Dev. Bank Nil Nil Nil 1 Nil Nil Nil Nil Nil Nil
Primary Agr. Coop. Society(GPSS)22 22 22 Nil Nil Nil Nil Nil Nil Nil
Others(Assam Cooperative Bank)2 2 Nil 2 Nil 3 429 Nil 232 39685.33
All Agencies 30 85 55 30 Nil 7 9579 Nil 10.31 2645.68
31-Mar-14 31-Mar-13 31-Mar-15 Growth(%) Share(%) 31-Mar-13 31-Mar-14 31-Mar-15 Growth(%) Share(%)
Commercial Banks N.A N.A N.A N.A N.A 8794800 9187800 10781200 17.34 70.75
Regional Rural Bank N.A N.A N.A N.A N.A 2625700 2938700 3093800 5.27 20.30
Cooperative Banks N.A N.A N.A N.A N.A 909600 1087100 1363600 25.43 8.95
Others N.A N.A N.A N.A
All Agencies N.A N.A N.A N.A 12330100 13213600 15238600 15 100
31-Mar-14 31-Mar-13 31-Mar-15 Growth(%) Share(%) 31-Mar-14 31-Mar-13 31-Mar-15 Growth(%) Share(%)
Commercial Banks N.A N.A N.A N.A N.A 3745300 4622500 4892500 5.84 61.49
Regional Rural Bank N.A N.A N.A N.A N.A 1912400 2210600 2816500 27.41 35.40
Cooperative Banks N.A N.A N.A N.A N.A 203500 239100 247000 3.3 3.10
Others N.A N.A N.A N.A N.A
All Agencies N.A N.A N.A N.A N.A 5861200 7072200 7956000 12.5 100
31-Mar-13 31-Mar-14 31-Mar-15 Deposit Credit Deposit Credit
Commercial Banks 42.59 50.31 45.38 N.A N.A N.A N.A
Regional Rural Bank 72.83 75.22 91.04 N.A N.A N.A N.A
Cooperative Banks 22.37 21.99 18.11 N.A N.A N.A N.A
Others N.A N.A N.A N.A
All Agencies 47.54 53.52 52.21 N.A N.A N.A N.A
Commercial Banks 3463200 70.79 1355200 27.70 N.A N.A NA NA N.A N.A
Regional Rural Bank 2527300 89.73 526300 18.69 N.A N.A NA NA N.A N.A
Cooperative Banks 177900 72.02 21200 8.58 N.A N.A NA NA N.A N.A
Others N.A N.A NA NA N.A N.A
All Agencies 6168400 77.53 1902700 23.92 N.A N.A NA NA N.A N.A
Commercial Banks 1059229 470039 44.38 1858400 804900 43.31 1298900 489950 37.72 41.80
Regional Rural Bank 532357 203291 38.19 885200 342500 38.69 542100 360500 66.50 47.79
Cooperative Banks 44144 3465 7.85 94100 6700 7.12 62400 4126 6.61 7.19
Others
All Agencies 1635730 676795 41.38 2837700 1154100 40.67 1903400 854576 44.90 42.31
Crop Loan 732926 117117 15.98 850700 277800 32.66 NA NA NA NA
Term Loan (Agr) 298304 260299 87.26 307000 190229 61.96 NA NA NA NA
Total Agri. Credit 1031230 377416 36.60 1157700 468029 40.43 1031200 227776 22.09 33.04
Non-Farm Sector 203000 103767 51.12 1100000 328430 29.86 542700 381800 70.35 50.44
Other Priority Sector 401500 217666 54.21 580000 357600 61.66 329500 245100 74.39 63.42
Total Priority Sector 1635730 698849 42.72 2837700 1154059 40.67 1903400 854676 44.90 42.77
Commercial Banks NA NA NA NA NA NA NA NA NA NA
Regional Rural Bank 807653 195053 24.15 618426 214809 34.73 NA NA NA NA
Cooperative Banks NA NA NA NA NA NA NA NA NA NA
Others
All Agencies NA NA NA NA NA NA NA NA NA NA
Sources : Lead Bank
Recovery
[%]
Demand
[Rs. '000]
Recovery
[Rs. '000]
Recovery
[%]
Agency
2012-13 2013-14 2014-15 Average
Rec. [%] in
last 3 years
Demand
[Rs. '000]
Recovery
[Rs. '000]
Demand
[Rs. '000]
Recovery
[Rs. '000]
Recovery
[%]
Ach'ment
[%]
Target
[Rs.'000]
Ach'ment
[Rs. '000]
Ach'ment
[%]
9. RECOVERY POSITION
Broad Sector
2012-13 2013-14 2014-15 Average
Ach[%] in
last 3 years
Target
[Rs.'000]
Ach'ment
[Rs. '000]
Ach'ment
[%]
Target
[Rs.'000]
Ach'ment
[Rs. '000]
8. SECTOR-WISE PERFORMANCE UNDER ANNUAL CREDIT PLANS
7. AGENCY-WISE PERFORMANCE UNDER ANNUAL CREDIT PLANS
Agency
2012-13 2013-14 2014-15 Average
Ach[%] in
last 3 years
Target
[Rs.'000]
Ach'ment
[Rs. '000]
Ach'ment
[%]
Target
[Rs.'000]
Ach'ment
[Rs. '000]
Ach'ment
[%]
Target
[Rs.'000]
Ach'ment
[Rs. '000]
Ach'ment
[%]
% of Total
Loans
Agency
Priority Sector Loans Loans to Agr. Sector Loans to Weaker Sections Loans under DRI Scheme Loans to Women
Amount
[Rs.'000]
% of Total
Loans
Amount
[Rs.'000]
% of Total
Loans
Amount
[Rs.'000]
% of Total
Loans
Amount
[Rs.'000]
% of Total
Loans
Amount
[Rs.'000]
6. PERFORMANCE TO FULFILL NATIONAL GOALS (As on 31/03/2014)
4. CD-RATIO 5. PERFORMANCE UNDER FINANCIAL INCLUSION (No. of A/cs)
AgencyCD Ratio
AgencyDuring 2014-15 Cumulative
Commercial Banks
Regional Rural Bank
Cooperative Banks
Others
All Agencies
AgencyNo. of accounts Amount of Deposit [Rs.'000]
3. LOANS & ADVANCES OUTSTANDING
AgencyNo. of accounts Amount of Loan [Rs.'000]
2. DEPOSITS OUTSTANDING
Banking Profile
Nalbari Assam Lead Bank - U CO Bank
1. NETWORK & OUTREACH (As on 31/03/2015)
AgencyNo. of
Banks/Soc.
No. of Branches No. of non-formal agencies assoiated Per Branch Outreach