Embed Size (px)
DESCRIPTION
Read the highlights from the Government of Alberta's annual financial report for the last fiscal year.
Citation preview
Government of Alberta
2013 –14 Annual Report
■ Consolidated Financial Statements■ Measuring Up
This is the report to Albertans on Budget 2013: Responsible Change. It is a permanent public record of the dollars spent and the results achieved by the Government of Alberta for the 2013 –14 fiscal year.
The Government of Alberta Annual Report consists of two parts:• Consolidated Financial Statements, which provide an overall accounting
of the government’s revenue and spending, and assets and liabilities.
• Measuring Up, which reports on the progress that has been made towards achieving the government’s goals.
Annual reports for each ministry have also been published, providing additional detailed information on performance and financial results.
Copyright © 2014
Government of Alberta 2013 –14 Annual Report Consolidated Financial Statements and Measuring Up
ISBN 978-1-4601-1721-7 (Print) ISBN 978-1-4601-1722-4 (Online PDF) ISSN 2291-6423 (Print) ISSN 2291-6431 (Online PDF)
b°a
www.alberta.ca #buildingAlberta
ExEcutivE summary i#buildingAlberta
AccountAbility StAtement
The government’s Annual Report for the year ended March 31, 2014 was
prepared under my direction on behalf of the government in accordance
with the Fiscal Management Act and the government’s accounting policies.
All of the government’s policy decisions as at June 18, 2014 with material
economic or fiscal implications have been considered in the preparation of
the Annual Report.
Doug HornerPresident of Treasury Board and Minister of Finance
Original signed by

ii GovErnmEnt of albErta 2013–14 annual rEport#buildingAlberta
blank paGE
GovErnmEnt of albErta 2013–14 annual rEport iii#buildingAlberta
A meSSAge from the PreSident of treASury boArd And miniSter of finAnce
As we reflect on the past year, I hope Albertans are as proud as I am of the province’s accomplishments, and of how we overcame some extraordinary challenges together. Our strong economic growth was only outpaced by our rapid population growth—all at a time when government was turning the corner financially by holding the line on spending, building needed infrastructure, and investing in core services such as health, education, and support for vulnerable Albertans.
In the midst of these efforts, we also faced head-on the devastating floods in southern Alberta. With a total estimated event cost of $6 billion, this is the most expensive natural disaster in Canadian history. I’m proud of the fact government responded immediately by supporting those in harm’s way, providing the necessities of life to those who suddenly found themselves homeless, and laying the groundwork for recovery over the longer term. In 2013-14, government allocated close to $3 billion in flood support to help Albertans, small business owners and communities rebuild.
We accomplished all this and still ended the year with an operational surplus of $2.5 billion and an overall Fiscal Plan surplus of $755 million.
Last year saw significant growth for our province. We welcomed more than 100,000 new Albertans, averaged 5,700 new jobs each month, and our economy outperformed both Canada and the U.S. with GDP growth of 3.9%. This was good news for our provincial revenues, which reached more than $45 billion at year end. The bitumen differential widened at times, but sustained higher oil prices and the lower Canadian dollar saw an increase in non-renewable resource revenue by $2.3 billion from the budget forecast.
The 2013-14 fiscal year also brought good news for our provincial savings. We introduced government’s first legislated savings plan in decades, and investment income was higher than expected. The Heritage Fund performed extremely well with returns of 16%, ending the year at $15 billion. The Contingency Account grew to $4.7 billion, and our overall savings grew to $23.2 billion.
At $41.9 billion, expense was higher than expected, up by $3.8 billion to pay for disasters, and to address population growth challenges such as education enrollment pressures and higher demands in health and human services. Capital Plan investments were maintained at $5 billion as we responded to Albertans’ calls to keep building the schools, roads and hospitals we need today.
In 2013-14 we completed our review of close to 220 programs and services through the results-based budgeting process, bringing the total number reviewed to 370, to ensure we are delivering the outcomes Albertans expect as effectively and efficiently as possible. The Measuring Up section of this report is now aligned with Results-based Budgeting to more closely integrate this initiative with the government’s strategic planning and reporting frameworks.
The bottom line for Alberta is that by sticking to a responsible spending plan, we laid the foundation for a positive Budget 2014. We have strong and stable finances that are set to keep the province in a surplus position. Over the course of this past year, Albertans and this government tackled challenges and seized opportunities necessary in order to continue building our province together, ensuring it remains one of Canada’s leading jurisdictions and a great place to call home today, and long into the future.
Doug HornerPresident of Treasury Board and Minister of Finance
Original signed by
iv Government of alberta 2013–14 annual report#buildingAlberta
Table of ConTenTs
preface . . . . . . . . . . . . . . . . . . . . . . . . . . . . . . . . . . . . . . . . . . . . vi
executive Summary Table of Contents . . . . . . . . . . . . . . . . . . . . . . . . . . . . . . . . . . . . . . . . . 2 Budget 2013: Responsible Change . . . . . . . . . . . . . . . . . . . . . . . . . . . . . 3 Fiscal Plan Highlights . . . . . . . . . . . . . . . . . . . . . . . . . . . . . . . . . . . . . . 5 Operational Plan Highlights . . . . . . . . . . . . . . . . . . . . . . . . . . . . . . . . . 5 Operational Plan Expense Highlights . . . . . . . . . . . . . . . . . . . . . . . . . . 7 Capital Plan . . . . . . . . . . . . . . . . . . . . . . . . . . . . . . . . . . . . . . . . . . . . . . 12 Revenue Highlights . . . . . . . . . . . . . . . . . . . . . . . . . . . . . . . . . . . . . . . . 15 Economic and Tax Highlights . . . . . . . . . . . . . . . . . . . . . . . . . . . . . . . . 17 Net Financial and Capital Assets . . . . . . . . . . . . . . . . . . . . . . . . . . . . . . 18 Fiscal Plan to Consolidated Financial Statements Reporting Reconciliation . . . . . . . . . . . . . . . . . . . . . . . . . . . . . . . . . 19 Historical Fiscal Summary, 1995-96 to 2013-14 . . . . . . . . . . . . . . . . . . 22
conSolidated financial StatementS Table of Contents . . . . . . . . . . . . . . . . . . . . . . . . . . . . . . . . . . . . . . . . . 25 Introduction . . . . . . . . . . . . . . . . . . . . . . . . . . . . . . . . . . . . . . . . . . . . . 26 Management’s Responsibility for the Consolidated Financial Statements 27 Independent Auditor’s Report . . . . . . . . . . . . . . . . . . . . . . . . . . . . . . . . 28 Consolidated Statement of Operations . . . . . . . . . . . . . . . . . . . . . . . . . 29 Consolidated Statement of Financial Position . . . . . . . . . . . . . . . . . . . . 30 Consolidated Statement of Change in Net Financial Assets . . . . . . . . . . 31 Consolidated Statement of Cash Flows . . . . . . . . . . . . . . . . . . . . . . . . . 32 Notes to the Consolidated Financial Statements . . . . . . . . . . . . . . . . . . 33 Schedules to the Consolidated Financial Statements . . . . . . . . . . . . . . . 51 1 Revenues . . . . . . . . . . . . . . . . . . . . . . . . . . . . . . . . . . . . . . . . . . . . 51 2 Expenses by Ministry . . . . . . . . . . . . . . . . . . . . . . . . . . . . . . . . . . . 52 3 Expenses by Object . . . . . . . . . . . . . . . . . . . . . . . . . . . . . . . . . . . . 53 4 Cash and Cash Equivalents . . . . . . . . . . . . . . . . . . . . . . . . . . . . . . 53 5 Portfolio Investments . . . . . . . . . . . . . . . . . . . . . . . . . . . . . . . . . . . 54 6 Equity in Government Business Enterprises . . . . . . . . . . . . . . . . . . 55 7 Loans and Advances . . . . . . . . . . . . . . . . . . . . . . . . . . . . . . . . . . . . 58 8 Unmatured Debt . . . . . . . . . . . . . . . . . . . . . . . . . . . . . . . . . . . . . . 58 9 Debt of Alberta Capital Finance Authority . . . . . . . . . . . . . . . . . . 59 10 Pension Plans and Other Defined Benefit Plans . . . . . . . . . . . . . . . 60 11 Tangible Capital Assets . . . . . . . . . . . . . . . . . . . . . . . . . . . . . . . . . . 66 12 Deferred Capital Contributions . . . . . . . . . . . . . . . . . . . . . . . . . . . 67 13 Guarantees . . . . . . . . . . . . . . . . . . . . . . . . . . . . . . . . . . . . . . . . . . . 67 14 Listing of Organizations . . . . . . . . . . . . . . . . . . . . . . . . . . . . . . . . 68 Glossary . . . . . . . . . . . . . . . . . . . . . . . . . . . . . . . . . . . . . . . . . . . . . . . . . . . 74
Government of alberta 2013–14 annual report v#buildingAlberta
meaSurinG upTable of Contents . . . . . . . . . . . . . . . . . . . . . . . . . . . . . . . . . . . . . . . . . . . . . 78Management’s Responsibility for Reporting . . . . . . . . . . . . . . . . . . . . . . . . . 79Readers’ Guide . . . . . . . . . . . . . . . . . . . . . . . . . . . . . . . . . . . . . . . . . . . . . . . 80Government of Alberta Strategic Planning and Results-Based Budgeting (RBB) Framework . . . . . . . . . . . . . . . . . . . . . 82Government’s Focused Agenda . . . . . . . . . . . . . . . . . . . . . . . . . . . . . . . . . . . 83Key Accomplishments . . . . . . . . . . . . . . . . . . . . . . . . . . . . . . . . . . . . . . . . . 94Independent Auditor’s Report . . . . . . . . . . . . . . . . . . . . . . . . . . . . . . . . . . . 124Performance Measures by Goal . . . . . . . . . . . . . . . . . . . . . . . . . . . . . . . . . . . 125Sources and Notes . . . . . . . . . . . . . . . . . . . . . . . . . . . . . . . . . . . . . . . . . . . . 132
Note: amounTs presenTed in some Tables may noT add To ToTals due To rounding.
vi GovErnmEnt of albErta 2013–14 annual rEport#buildingAlberta
PrefAce
The Public Accounts of Alberta are prepared in accordance with the Financial Administration
Act and the Fiscal Management Act. The Public Accounts consist of the Annual Report of the
Government of Alberta and the annual reports of each of the 19 ministries.
This Annual Report of the Government of Alberta contains the Minister’s Accountability
Statement, an Executive Summary, the audited Consolidated Financial Statements of the
Province and the Measuring Up report, which compares actual performance results to
desired results set out in the government’s strategic plan.
The annual reports of ministries are released concurrently with the Annual Report of the
Government of Alberta. The ministry annual reports contain Ministers’ accountability
statements, the audited consolidated financial statements of the ministries and a comparison
of actual performance results to desired results set out in the ministries’ business plans. Each
ministry annual report also includes:
■■ Financial statements of entities making up the ministry including departments (all
departments combined form the General Revenue Fund), regulated funds, provincial
agencies and Crown-controlled corporations;
■■ Other financial information as required by the Financial Administration Act and the Fiscal
Management Act, either as separate reports or as a part of financial statements, to the extent
that the ministry has anything to report;
■■ Financial information relating to accountable organizations and trust funds.
ExEcutivE summary 1#buildingAlberta
executive SummAry
2 Government of alberta 2013–14 annual report#buildingAlberta
executive Summary Budget 2013: Responsible Change . . . . . . . . . . . . . . . . . . . . . . . . . . . . . 3 Fiscal Plan Highlights . . . . . . . . . . . . . . . . . . . . . . . . . . . . . . . . . . . . . . 5 Operational Plan Highlights . . . . . . . . . . . . . . . . . . . . . . . . . . . . . . . . . 5 Operational Plan Expense Highlights . . . . . . . . . . . . . . . . . . . . . . . . . . 7 Capital Plan . . . . . . . . . . . . . . . . . . . . . . . . . . . . . . . . . . . . . . . . . . . . . . 12 Revenue Highlights . . . . . . . . . . . . . . . . . . . . . . . . . . . . . . . . . . . . . . . . 15 Economic and Tax Highlights . . . . . . . . . . . . . . . . . . . . . . . . . . . . . . . . 17 Net Financial and Capital Assets . . . . . . . . . . . . . . . . . . . . . . . . . . . . . . 18 Fiscal Plan to Consolidated Financial Statements Reporting Reconciliation . . . . . . . . . . . . . . . . . . . . . . . . . . . . . . . . . 19 Historical Fiscal Summary, 1995-96 to 2013-14 . . . . . . . . . . . . . . . . . . 22
Table of ConTenTs
ExEcutivE summary 3#buildingAlberta
ExEcutivE Summary
budget 2013: reSPonSible chAnge
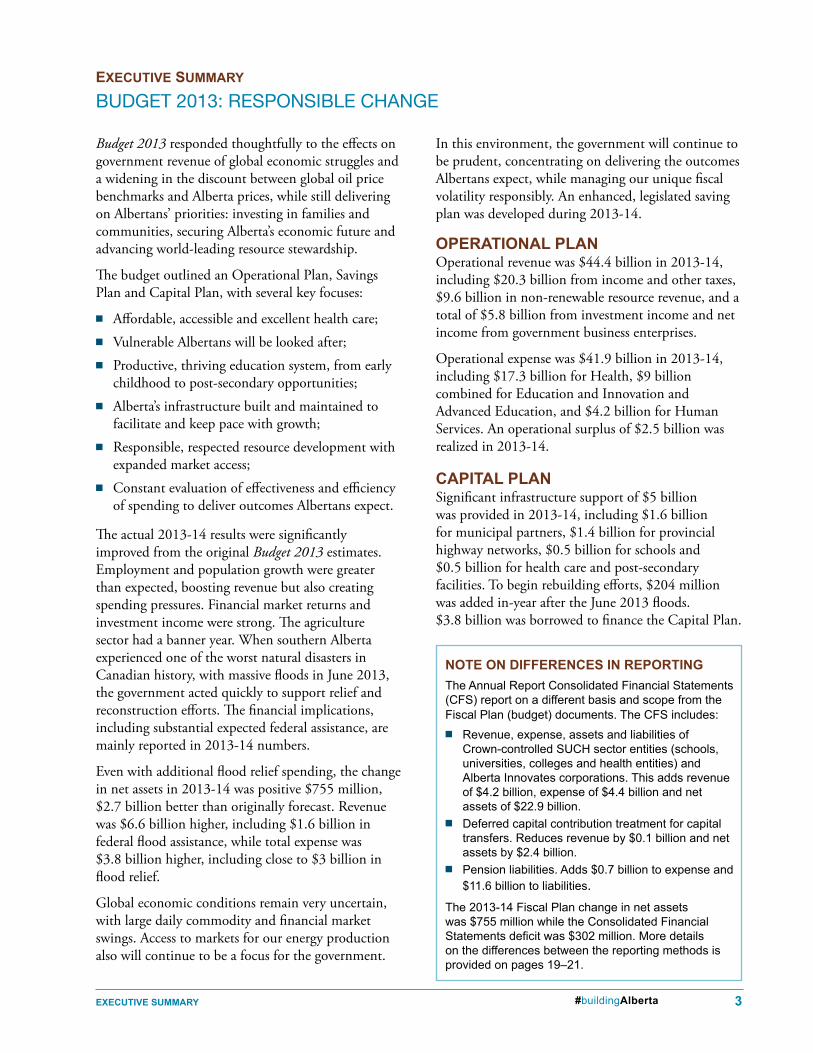
Budget 2013 responded thoughtfully to the effects on government revenue of global economic struggles and a widening in the discount between global oil price benchmarks and Alberta prices, while still delivering on Albertans’ priorities: investing in families and communities, securing Alberta’s economic future and advancing world-leading resource stewardship.
The budget outlined an Operational Plan, Savings Plan and Capital Plan, with several key focuses:
■■ Affordable, accessible and excellent health care;■■ Vulnerable Albertans will be looked after;■■ Productive, thriving education system, from early
childhood to post-secondary opportunities; ■■ Alberta’s infrastructure built and maintained to
facilitate and keep pace with growth;■■ Responsible, respected resource development with
expanded market access;■■ Constant evaluation of effectiveness and efficiency
of spending to deliver outcomes Albertans expect.
The actual 2013-14 results were significantly improved from the original Budget 2013 estimates. Employment and population growth were greater than expected, boosting revenue but also creating spending pressures. Financial market returns and investment income were strong. The agriculture sector had a banner year. When southern Alberta experienced one of the worst natural disasters in Canadian history, with massive floods in June 2013, the government acted quickly to support relief and reconstruction efforts. The financial implications, including substantial expected federal assistance, are mainly reported in 2013-14 numbers.
Even with additional flood relief spending, the change in net assets in 2013-14 was positive $755 million, $2.7 billion better than originally forecast. Revenue was $6.6 billion higher, including $1.6 billion in federal flood assistance, while total expense was $3.8 billion higher, including close to $3 billion in flood relief.
Global economic conditions remain very uncertain, with large daily commodity and financial market swings. Access to markets for our energy production also will continue to be a focus for the government.
In this environment, the government will continue to be prudent, concentrating on delivering the outcomes Albertans expect, while managing our unique fiscal volatility responsibly. An enhanced, legislated saving plan was developed during 2013-14.
opErational planOperational revenue was $44.4 billion in 2013-14, including $20.3 billion from income and other taxes, $9.6 billion in non-renewable resource revenue, and a total of $5.8 billion from investment income and net income from government business enterprises.
Operational expense was $41.9 billion in 2013-14, including $17.3 billion for Health, $9 billion combined for Education and Innovation and Advanced Education, and $4.2 billion for Human Services. An operational surplus of $2.5 billion was realized in 2013-14.
capital planSignificant infrastructure support of $5 billion was provided in 2013-14, including $1.6 billion for municipal partners, $1.4 billion for provincial highway networks, $0.5 billion for schools and $0.5 billion for health care and post-secondary facilities. To begin rebuilding efforts, $204 million was added in-year after the June 2013 floods. $3.8 billion was borrowed to finance the Capital Plan.
notE on diffErEncEs in rEportinGThe Annual Report Consolidated Financial Statements (CFS) report on a different basis and scope from the Fiscal Plan (budget) documents. The CFS includes:
■■ Revenue, expense, assets and liabilities of Crown-controlled SUCH sector entities (schools, universities, colleges and health entities) and Alberta Innovates corporations. This adds revenue of $4.2 billion, expense of $4.4 billion and net assets of $22.9 billion.
■■ Deferred capital contribution treatment for capital transfers. Reduces revenue by $0.1 billion and net assets by $2.4 billion.
■■ Pension liabilities. Adds $0.7 billion to expense and $11.6 billion to liabilities.
The 2013-14 Fiscal Plan change in net assets was $755 million while the Consolidated Financial Statements deficit was $302 million. More details on the differences between the reporting methods is provided on pages 19–21.
4 GovErnmEnt of albErta 2013–14 annual rEport#buildingAlberta
operational cash adjustments / contingency account (at march 31, 2014)(millions of dollars)
2013-14_AR-Summ_T02_ocaca.pdf 2013-14 GOA Annual ReportExecutive Summary
Operational Cash Adjustments / Contingency Account (millions of dollars)
2012-13Operational Cash Adjustments – Sources / (Requirements) Budget Actual Actual Budget Actual
Retained income of funds and agencies (796) (1,151) (586) (355) (565) Energy royalties (1,137) (279) (294) 858 15 Student loans / inventory acquisition / other cash adjustments (577) (454) (570) 123 116 Current principal repayments (P3s / direct borrowing) (34) (33) (30) 1 (3) Allocation for future principal repayments (direct borrowing) (40) (34) - 6 (34) 2013 Alberta flood assistance revenue / expense - 903 - 903 903 Amortization / inventory consumption 982 912 890 (70) 22
Net Operational Cash Adjustments (1,602) (136) (590) 1,466 454 Plus: Operational Surplus / (Deficit) (451) 2,499 (435) 2,950 2,934 Net Operational Cash Sources / (Requirements) (2,053) 2,363 (1,025) 4,416 3,388
Contingency Account Assets at Start of Year 2,744 3,326 7,497
Transfer of / (to offset) net operational cash sources / (requirements) (2,053) 2,363 (1,025) 4,416 3,388 Cash transferred from prior-year fourth quarter results - 256 1,308 256 (1,052) Cash from fourth quarter results to be transferred in subsequent year - (1,287) (256) (1,287) (1,031) Transfer to Capital Plan - - (4,198) - 4,198
Assets at End of Year 691 4,658 3,326 3,967 1,332
2013-14_AR-Summ_T02_ocaca.pdf
2013-14Change from
At March 31
W:\Obm.publns\OBM.PUBLNS-2014-15\2013-14_GoA_AnnReport\13-14_GoA-AR_Summary\source_documents\2013-14_Executive Summary Tables.xlsxT2. Conting Acct & Cash Adjust 6/12/2014
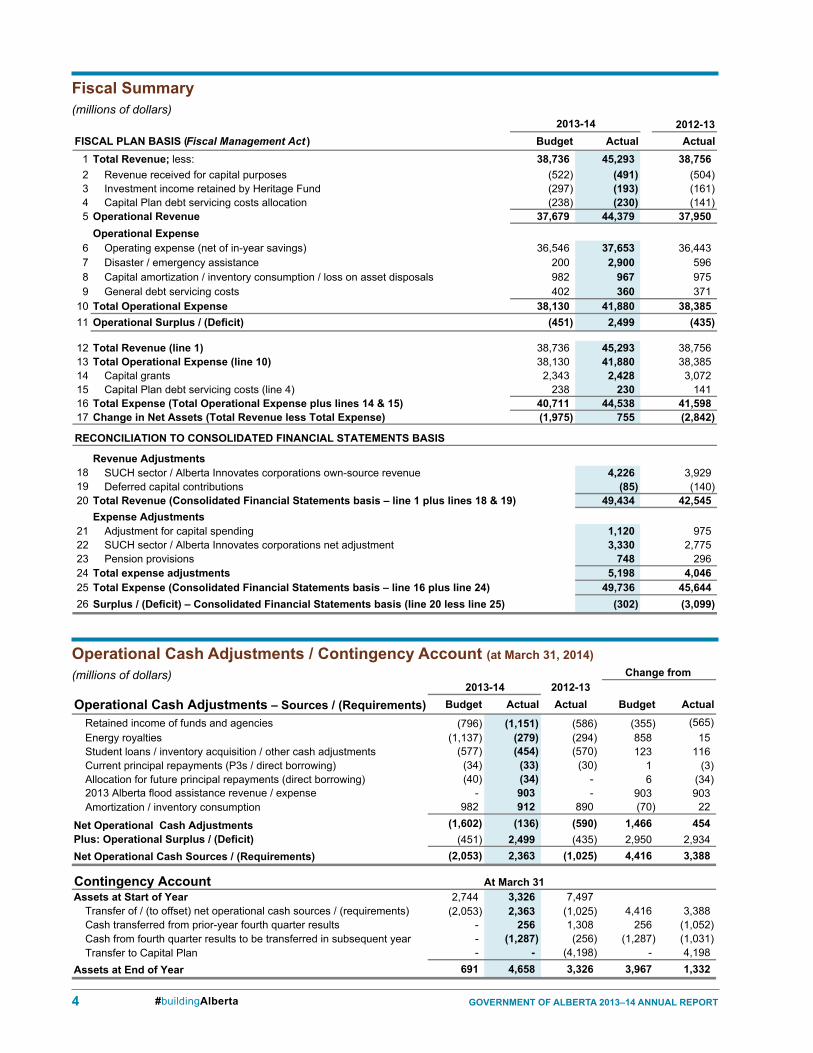
fiscal summary (millions of dollars)
2013-14_AR-Summ_T01_fs.pdf 2013-14 GOA Annual ReportExecutive Summary
Fiscal Summary(millions of dollars)
2012-13FISCAL PLAN BASIS (Fiscal Management Act ) Budget Actual Actual
1 Total Revenue; less: 38,736 45,293 38,756 2 Revenue received for capital purposes (522) (491) (504) 3 Investment income retained by Heritage Fund (297) (193) (161) 4 Capital Plan debt servicing costs allocation (238) (230) (141) 5 Operational Revenue 37,679 44,379 37,950
Operational Expense6 Operating expense (net of in-year savings) 36,546 37,653 36,443 7 Disaster / emergency assistance 200 2,900 596 8 Capital amortization / inventory consumption / loss on asset disposals 982 967 975 9 General debt servicing costs 402 360 371
10 Total Operational Expense 38,130 41,880 38,385 11 Operational Surplus / (Deficit) (451) 2,499 (435)
12 Total Revenue (line 1) 38,736 45,293 38,756 13 Total Operational Expense (line 10) 38,130 41,880 38,385 14 Capital grants 2,343 2,428 3,072 15 Capital Plan debt servicing costs (line 4) 238 230 141 16 Total Expense (Total Operational Expense plus lines 14 & 15) 40,711 44,538 41,598 17 Change in Net Assets (Total Revenue less Total Expense) (1,975) 755 (2,842)
RECONCILIATION TO CONSOLIDATED FINANCIAL STATEMENTS BASIS
Revenue Adjustments18 SUCH sector / Alberta Innovates corporations own-source revenue 4,226 3,929 19 Deferred capital contributions (85) (140) 20 Total Revenue (Consolidated Financial Statements basis – line 1 plus lines 18 & 19) 49,434 42,545
Expense Adjustments21 Adjustment for capital spending 1,120 975 22 SUCH sector / Alberta Innovates corporations net adjustment 3,330 2,775 23 Pension provisions 748 296 24 Total expense adjustments 5,198 4,046 25 Total Expense (Consolidated Financial Statements basis – line 16 plus line 24) 49,736 45,644 26 Surplus / (Deficit) – Consolidated Financial Statements basis (line 20 less line 25) (302) (3,099)
2013-14_AR-Summ_T01_fs.pdf
2013-14
W:\Obm.publns\OBM.PUBLNS-2014-15\2013-14_GoA_AnnReport\13-14_GoA-AR_Summary\source_documents\2013-14_Executive Summary_Tables.xlsxT1. Fiscal Summary 6/18/2014
ExEcutivE summary 5#buildingAlberta
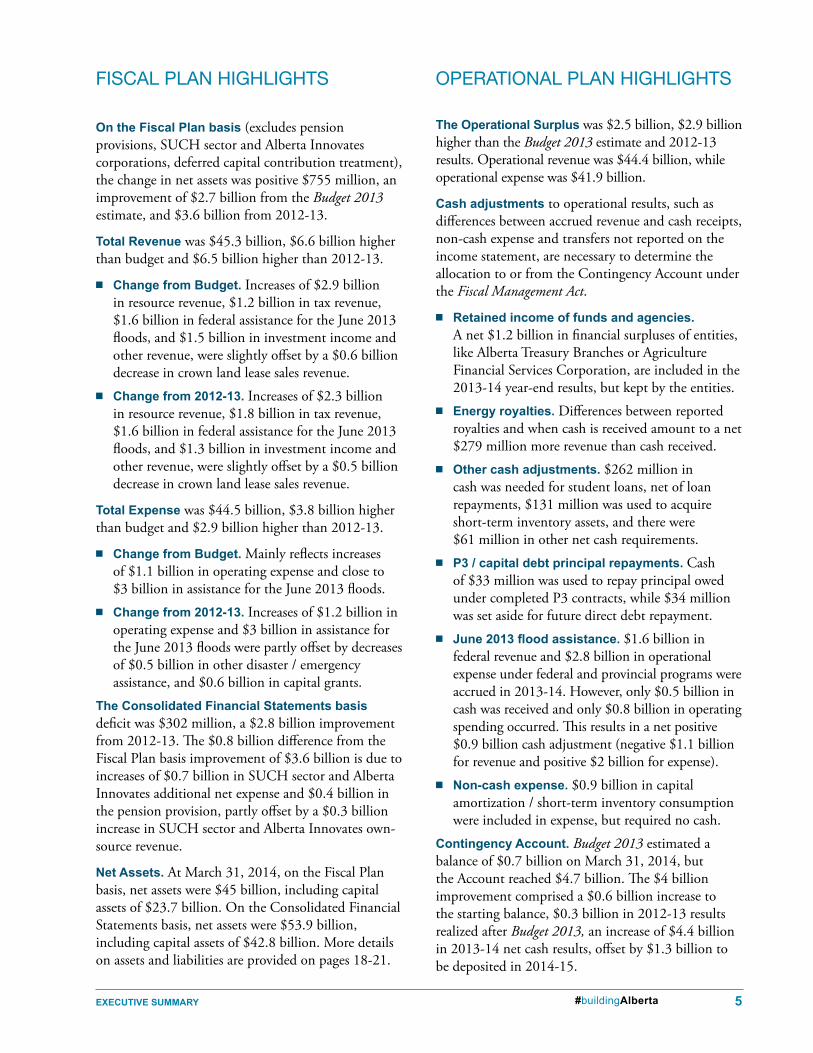
on the fiscal plan basis (excludes pension provisions, SUCH sector and Alberta Innovates corporations, deferred capital contribution treatment), the change in net assets was positive $755 million, an improvement of $2.7 billion from the Budget 2013 estimate, and $3.6 billion from 2012-13.
total revenue was $45.3 billion, $6.6 billion higher than budget and $6.5 billion higher than 2012-13.
■■ change from budget. Increases of $2.9 billion in resource revenue, $1.2 billion in tax revenue, $1.6 billion in federal assistance for the June 2013 floods, and $1.5 billion in investment income and other revenue, were slightly offset by a $0.6 billion decrease in crown land lease sales revenue.
■■ change from 2012-13. Increases of $2.3 billion in resource revenue, $1.8 billion in tax revenue, $1.6 billion in federal assistance for the June 2013 floods, and $1.3 billion in investment income and other revenue, were slightly offset by a $0.5 billion decrease in crown land lease sales revenue.
total Expense was $44.5 billion, $3.8 billion higher than budget and $2.9 billion higher than 2012-13.
■■ change from budget. Mainly reflects increases of $1.1 billion in operating expense and close to $3 billion in assistance for the June 2013 floods.
■■ change from 2012-13. Increases of $1.2 billion in operating expense and $3 billion in assistance for the June 2013 floods were partly offset by decreases of $0.5 billion in other disaster / emergency assistance, and $0.6 billion in capital grants.
the consolidated financial statements basis deficit was $302 million, a $2.8 billion improvement from 2012-13. The $0.8 billion difference from the Fiscal Plan basis improvement of $3.6 billion is due to increases of $0.7 billion in SUCH sector and Alberta Innovates additional net expense and $0.4 billion in the pension provision, partly offset by a $0.3 billion increase in SUCH sector and Alberta Innovates own-source revenue.
net assets. At March 31, 2014, on the Fiscal Plan basis, net assets were $45 billion, including capital assets of $23.7 billion. On the Consolidated Financial Statements basis, net assets were $53.9 billion, including capital assets of $42.8 billion. More details on assets and liabilities are provided on pages 18-21.
the operational surplus was $2.5 billion, $2.9 billion higher than the Budget 2013 estimate and 2012-13 results. Operational revenue was $44.4 billion, while operational expense was $41.9 billion.
cash adjustments to operational results, such as differences between accrued revenue and cash receipts, non-cash expense and transfers not reported on the income statement, are necessary to determine the allocation to or from the Contingency Account under the Fiscal Management Act.
■■ retained income of funds and agencies. A net $1.2 billion in financial surpluses of entities, like Alberta Treasury Branches or Agriculture Financial Services Corporation, are included in the 2013-14 year-end results, but kept by the entities.
■■ Energy royalties. Differences between reported royalties and when cash is received amount to a net $279 million more revenue than cash received.
■■ other cash adjustments. $262 million in cash was needed for student loans, net of loan repayments, $131 million was used to acquire short-term inventory assets, and there were $61 million in other net cash requirements.
■■ p3 / capital debt principal repayments. Cash of $33 million was used to repay principal owed under completed P3 contracts, while $34 million was set aside for future direct debt repayment.
■■ June 2013 flood assistance. $1.6 billion in federal revenue and $2.8 billion in operational expense under federal and provincial programs were accrued in 2013-14. However, only $0.5 billion in cash was received and only $0.8 billion in operating spending occurred. This results in a net positive $0.9 billion cash adjustment (negative $1.1 billion for revenue and positive $2 billion for expense).
■■ non-cash expense. $0.9 billion in capital amortization / short-term inventory consumption were included in expense, but required no cash.
contingency account. Budget 2013 estimated a balance of $0.7 billion on March 31, 2014, but the Account reached $4.7 billion. The $4 billion improvement comprised a $0.6 billion increase to the starting balance, $0.3 billion in 2012-13 results realized after Budget 2013, an increase of $4.4 billion in 2013-14 net cash results, offset by $1.3 billion to be deposited in 2014-15.
fiScAl PlAn highlightS oPerAtionAl PlAn highlightS
6 GovErnmEnt of albErta 2013–14 annual rEport#buildingAlberta
operational Expense(millions of dollars)
pdf named: 2013-14_AR-Summ_T03_oe.pdf 2013-14 GOA Annual ReportExecutive Summary
Operational Expense(millions of dollars)
2012-13 2012-13Operating Expense by Ministry Budget Actual Actual Budget ActualInvesting in Families and Communities
Culture 162 156 175 (6) (19) Health 17,048 17,240 16,449 192 791 Human Services 4,155 4,226 4,123 71 103 Justice and Solicitor General 1,253 1,269 1,271 16 (2) Municipal Affairs 433 413 392 (20) 21 Tourism, Parks and Recreation 162 162 164 - (2)
Securing Alberta's Economic FutureEducation 6,210 6,301 6,154 91 147 Infrastructure 504 505 477 1 28 Innovation and Advanced Education 2,635 2,679 2,726 44 (47) Jobs, Skills, Training and Labour 140 134 142 (6) (8) Service Alberta 243 236 242 (7) (6) Transportation 478 514 471 36 43 Treasury Board and Finance 1,381 1,556 1,430 175 126
Advancing World-leading Resource StewardshipAboriginal Relations 169 163 155 (6) 8 Agriculture and Rural Development 845 752 850 (93) (98) Energy 439 664 555 225 109 Environment and Sustainable Resource Development 478 494 476 16 18 International and Intergovernmental Relations 37 33 28 (4) 5
OtherExecutive Council 51 44 43 (7) 1 Legislative Assembly 122 113 119 (9) (6)
In-year savings (400) - - 400 - Total Operating Expense 36,546 37,653 36,443 1,109 1,212
Disaster / Emergency AssistanceAgriculture and Rural Development 2 2 266 - (264) Environment and Sustainable Resource Development - 102 285 102 (183) Municipal Affairs 27 38 45 11 (7) Unallocated 171 - - (171) -
Total 200 142 596 (58) (454) 2013 Alberta flood assistance:
Aboriginal Relations - 193 - 193 193 Human Services - 65 - 65 65 Infrastructure - 72 - 72 72 Municipal Affairs - 2,416 - 2,416 2,416 Other - 12 - 12 12
Total 2013 Alberta flood assistance - 2,758 - 2,758 2,758 Total Disaster / Emergency Assistance 200 2,900 596 2,700 2,304
Amortization / Inventory Consumption / Loss on Asset DisposalsInfrastructure amortization / inventory consumption 179 124 119 (55) 5 Transportation amortization / inventory consumption 475 480 465 5 15 Other amortization / inventory consumption / loss on disposals 328 363 391 35 (28)
Total Amortization / Invent. Consump. / Loss on Disposals 982 967 975 (15) (8)
General Debt Servicing CostsAgriculture and Rural Development (Ag. Financial Services Corp.) 75 68 67 (7) 1 Municipal Affairs (Alberta Social Housing Corporation) 12 12 14 - (2) Treasury Board and Finance 315 280 290 (35) (10)
Total General Debt Servicing Costs 402 360 371 (42) (11) Total Operational Expense 38,130 41,880 38,385 3,752 3,497
Change from
2013-14
W:\Obm.publns\OBM.PUBLNS-2014-15\2013-14_GoA_AnnReport\13-14_GoA-AR_Summary\source_documents\2013-14_Executive Summary Tables.xlsxT3. Operational Expense 6/16/2014
ExEcutivE summary 7#buildingAlberta
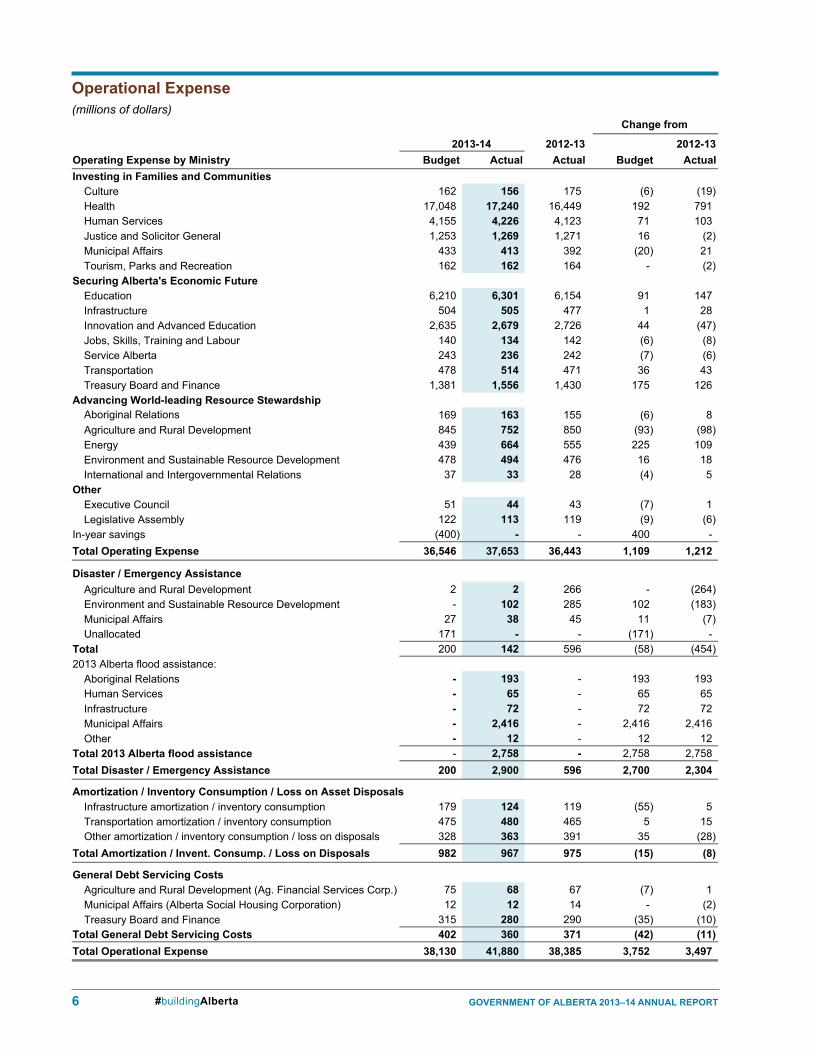
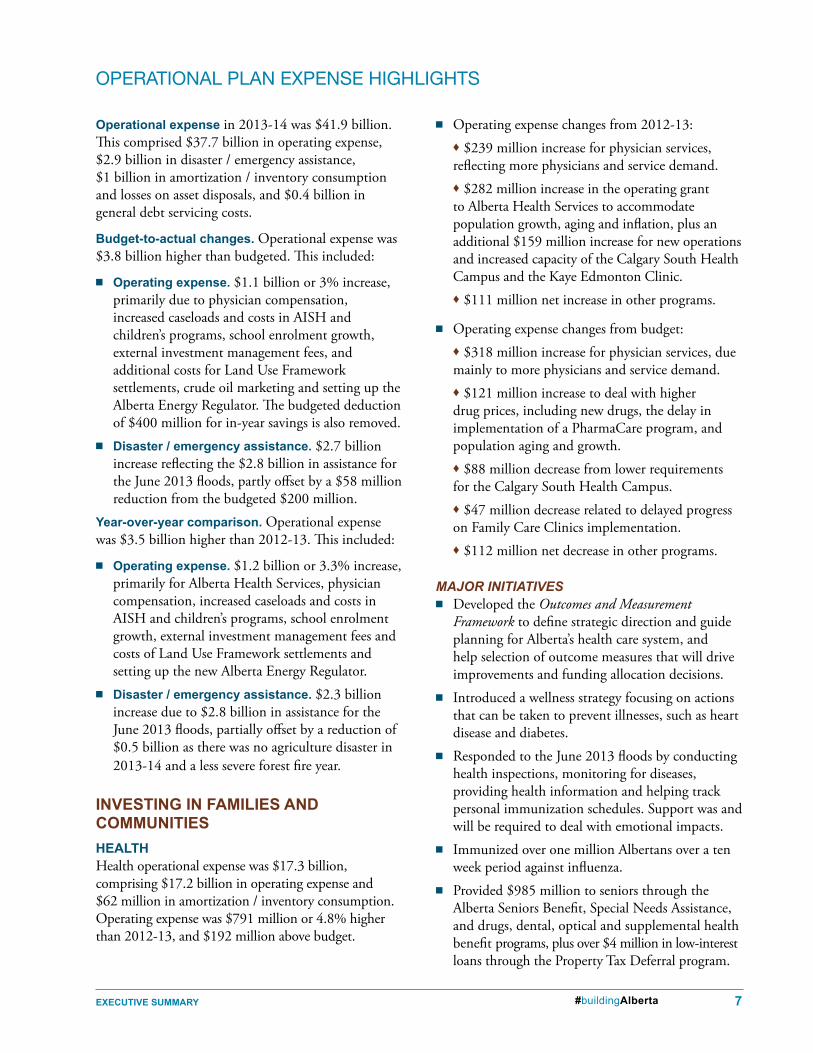
operational expense in 2013-14 was $41.9 billion. This comprised $37.7 billion in operating expense, $2.9 billion in disaster / emergency assistance, $1 billion in amortization / inventory consumption and losses on asset disposals, and $0.4 billion in general debt servicing costs.
budget-to-actual changes. Operational expense was $3.8 billion higher than budgeted. This included:
■■ operating expense. $1.1 billion or 3% increase, primarily due to physician compensation, increased caseloads and costs in AISH and children’s programs, school enrolment growth, external investment management fees, and additional costs for Land Use Framework settlements, crude oil marketing and setting up the Alberta Energy Regulator. The budgeted deduction of $400 million for in-year savings is also removed.
■■ disaster / emergency assistance. $2.7 billion increase reflecting the $2.8 billion in assistance for the June 2013 floods, partly offset by a $58 million reduction from the budgeted $200 million.
year-over-year comparison. Operational expense was $3.5 billion higher than 2012-13. This included:
■■ operating expense. $1.2 billion or 3.3% increase, primarily for Alberta Health Services, physician compensation, increased caseloads and costs in AISH and children’s programs, school enrolment growth, external investment management fees and costs of Land Use Framework settlements and setting up the new Alberta Energy Regulator.
■■ disaster / emergency assistance. $2.3 billion increase due to $2.8 billion in assistance for the June 2013 floods, partially offset by a reduction of $0.5 billion as there was no agriculture disaster in 2013-14 and a less severe forest fire year.
invEstinG in familiEs and communitiEsHEaltHHealth operational expense was $17.3 billion, comprising $17.2 billion in operating expense and $62 million in amortization / inventory consumption. Operating expense was $791 million or 4.8% higher than 2012-13, and $192 million above budget.
■■ Operating expense changes from 2012-13:■♦ $239 million increase for physician services,
reflecting more physicians and service demand.■♦ $282 million increase in the operating grant
to Alberta Health Services to accommodate population growth, aging and inflation, plus an additional $159 million increase for new operations and increased capacity of the Calgary South Health Campus and the Kaye Edmonton Clinic.
■♦ $111 million net increase in other programs.
■■ Operating expense changes from budget:■♦ $318 million increase for physician services, due
mainly to more physicians and service demand.■♦ $121 million increase to deal with higher
drug prices, including new drugs, the delay in implementation of a PharmaCare program, and population aging and growth.
■♦ $88 million decrease from lower requirements for the Calgary South Health Campus.
■♦ $47 million decrease related to delayed progress on Family Care Clinics implementation.
■♦ $112 million net decrease in other programs.
Major initiatives■■ Developed the Outcomes and Measurement
Framework to define strategic direction and guide planning for Alberta’s health care system, and help selection of outcome measures that will drive improvements and funding allocation decisions.
■■ Introduced a wellness strategy focusing on actions that can be taken to prevent illnesses, such as heart disease and diabetes.
■■ Responded to the June 2013 floods by conducting health inspections, monitoring for diseases, providing health information and helping track personal immunization schedules. Support was and will be required to deal with emotional impacts.
■■ Immunized over one million Albertans over a ten week period against influenza.
■■ Provided $985 million to seniors through the Alberta Seniors Benefit, Special Needs Assistance, and drugs, dental, optical and supplemental health benefit programs, plus over $4 million in low-interest loans through the Property Tax Deferral program.
oPerAtionAl PlAn exPenSe highlightS
8 GovErnmEnt of albErta 2013–14 annual rEport#buildingAlberta
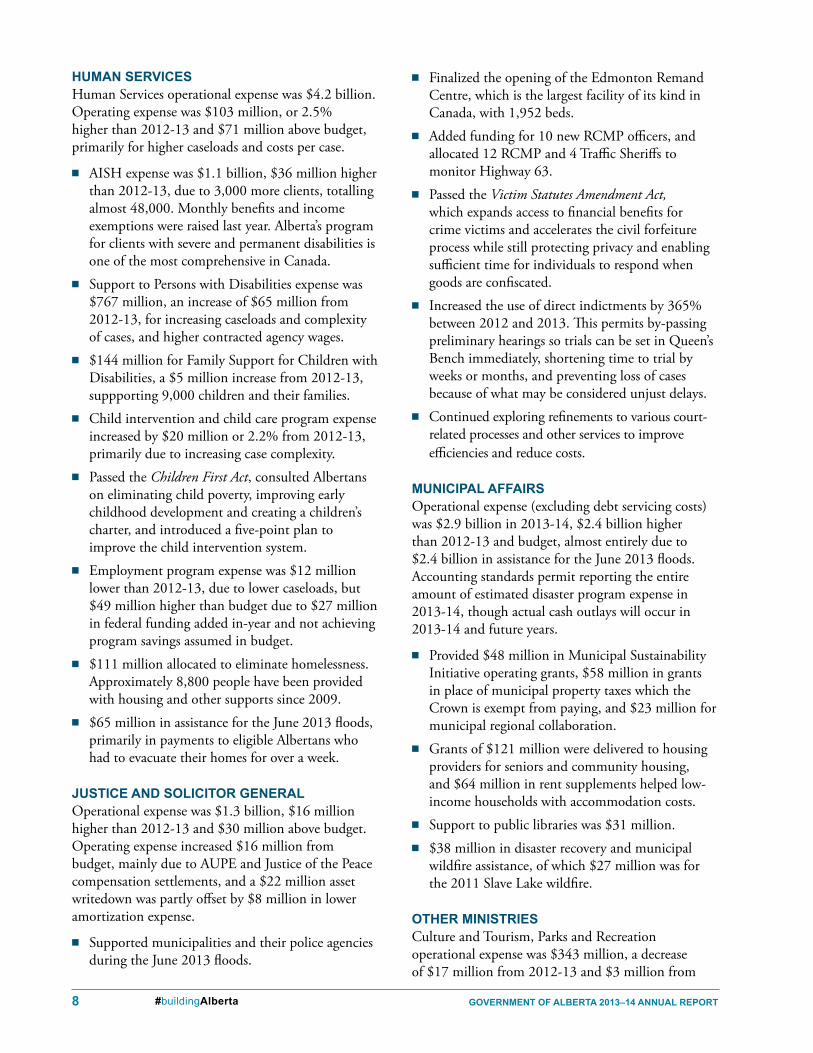
Human sErvicEsHuman Services operational expense was $4.2 billion. Operating expense was $103 million, or 2.5% higher than 2012-13 and $71 million above budget, primarily for higher caseloads and costs per case.
■■ AISH expense was $1.1 billion, $36 million higher than 2012-13, due to 3,000 more clients, totalling almost 48,000. Monthly benefits and income exemptions were raised last year. Alberta’s program for clients with severe and permanent disabilities is one of the most comprehensive in Canada.
■■ Support to Persons with Disabilities expense was $767 million, an increase of $65 million from 2012-13, for increasing caseloads and complexity of cases, and higher contracted agency wages.
■■ $144 million for Family Support for Children with Disabilities, a $5 million increase from 2012-13, suppporting 9,000 children and their families.
■■ Child intervention and child care program expense increased by $20 million or 2.2% from 2012-13, primarily due to increasing case complexity.
■■ Passed the Children First Act, consulted Albertans on eliminating child poverty, improving early childhood development and creating a children’s charter, and introduced a five-point plan to improve the child intervention system.
■■ Employment program expense was $12 million lower than 2012-13, due to lower caseloads, but $49 million higher than budget due to $27 million in federal funding added in-year and not achieving program savings assumed in budget.
■■ $111 million allocated to eliminate homelessness. Approximately 8,800 people have been provided with housing and other supports since 2009.
■■ $65 million in assistance for the June 2013 floods, primarily in payments to eligible Albertans who had to evacuate their homes for over a week.
JusticE and solicitor GEnEral Operational expense was $1.3 billion, $16 million higher than 2012-13 and $30 million above budget. Operating expense increased $16 million from budget, mainly due to AUPE and Justice of the Peace compensation settlements, and a $22 million asset writedown was partly offset by $8 million in lower amortization expense.
■■ Supported municipalities and their police agencies during the June 2013 floods.
■■ Finalized the opening of the Edmonton Remand Centre, which is the largest facility of its kind in Canada, with 1,952 beds.
■■ Added funding for 10 new RCMP officers, and allocated 12 RCMP and 4 Traffic Sheriffs to monitor Highway 63.
■■ Passed the Victim Statutes Amendment Act, which expands access to financial benefits for crime victims and accelerates the civil forfeiture process while still protecting privacy and enabling sufficient time for individuals to respond when goods are confiscated.
■■ Increased the use of direct indictments by 365% between 2012 and 2013. This permits by-passing preliminary hearings so trials can be set in Queen’s Bench immediately, shortening time to trial by weeks or months, and preventing loss of cases because of what may be considered unjust delays.
■■ Continued exploring refinements to various court-related processes and other services to improve efficiencies and reduce costs.
municipal affairsOperational expense (excluding debt servicing costs) was $2.9 billion in 2013-14, $2.4 billion higher than 2012-13 and budget, almost entirely due to $2.4 billion in assistance for the June 2013 floods. Accounting standards permit reporting the entire amount of estimated disaster program expense in 2013-14, though actual cash outlays will occur in 2013-14 and future years.
■■ Provided $48 million in Municipal Sustainability Initiative operating grants, $58 million in grants in place of municipal property taxes which the Crown is exempt from paying, and $23 million for municipal regional collaboration.
■■ Grants of $121 million were delivered to housing providers for seniors and community housing, and $64 million in rent supplements helped low-income households with accommodation costs.
■■ Support to public libraries was $31 million.■■ $38 million in disaster recovery and municipal
wildfire assistance, of which $27 million was for the 2011 Slave Lake wildfire.
otHEr ministriEsCulture and Tourism, Parks and Recreation operational expense was $343 million, a decrease of $17 million from 2012-13 and $3 million from
ExEcutivE summary 9#buildingAlberta
budget, due mainly to lower Culture operating expense. The ministries provided:
■■ 828 grants to organizations totalling $19 million under the Community Initiatives Program.
■■ 173 grants totalling $26 million under the Alberta Media Fund for screen-based productions, book and magazine publishing and sound recording.
■■ $52 million to support Alberta historic sites, museums and heritage preservation and conservation programs.
■■ $23 million to the Alberta Foundation for the Arts for grants to support artists and arts promotion.
■■ $54 million for provincial park operations and implementing the Land Use Framework.
■■ $75 million in Alberta tourism promotion.■■ Support for the sixth annual Alberta Culture
Days celebration with thousands of Albertans participating in 1,455 events in 94 communities.
■■ $25 million to promote recreation, sport and active, healthy lifestyles, and Active Alberta.
■■ $4 million in June 2013 flood assistance to heritage, arts and non-profit organizations for restoration and rebuilding efforts, and $1 million to the tourism industry.
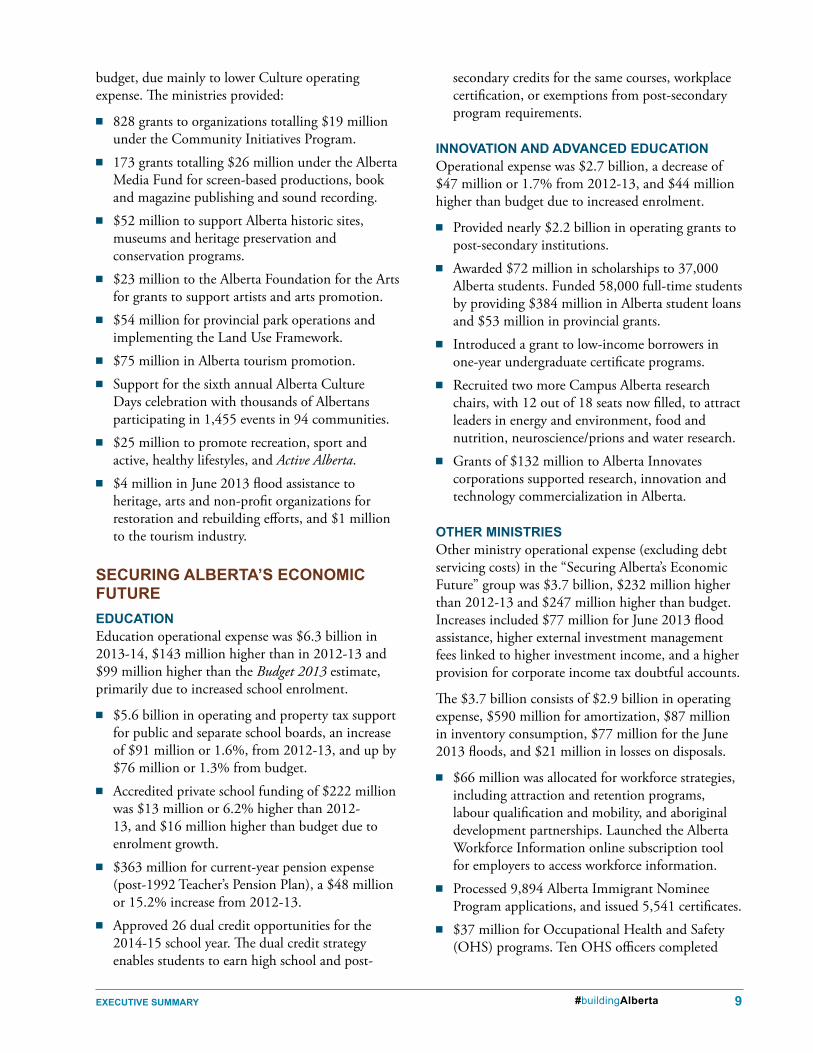
sEcurinG albErta’s Economic futurEEducationEducation operational expense was $6.3 billion in 2013-14, $143 million higher than in 2012-13 and $99 million higher than the Budget 2013 estimate, primarily due to increased school enrolment.
■■ $5.6 billion in operating and property tax support for public and separate school boards, an increase of $91 million or 1.6%, from 2012-13, and up by $76 million or 1.3% from budget.
■■ Accredited private school funding of $222 million was $13 million or 6.2% higher than 2012-13, and $16 million higher than budget due to enrolment growth.
■■ $363 million for current-year pension expense (post-1992 Teacher’s Pension Plan), a $48 million or 15.2% increase from 2012-13.
■■ Approved 26 dual credit opportunities for the 2014-15 school year. The dual credit strategy enables students to earn high school and post-
secondary credits for the same courses, workplace certification, or exemptions from post-secondary program requirements.
innovation and advancEd EducationOperational expense was $2.7 billion, a decrease of $47 million or 1.7% from 2012-13, and $44 million higher than budget due to increased enrolment.
■■ Provided nearly $2.2 billion in operating grants to post-secondary institutions.
■■ Awarded $72 million in scholarships to 37,000 Alberta students. Funded 58,000 full-time students by providing $384 million in Alberta student loans and $53 million in provincial grants.
■■ Introduced a grant to low-income borrowers in one-year undergraduate certificate programs.
■■ Recruited two more Campus Alberta research chairs, with 12 out of 18 seats now filled, to attract leaders in energy and environment, food and nutrition, neuroscience/prions and water research.
■■ Grants of $132 million to Alberta Innovates corporations supported research, innovation and technology commercialization in Alberta.
otHEr ministriEsOther ministry operational expense (excluding debt servicing costs) in the “Securing Alberta’s Economic Future” group was $3.7 billion, $232 million higher than 2012-13 and $247 million higher than budget. Increases included $77 million for June 2013 flood assistance, higher external investment management fees linked to higher investment income, and a higher provision for corporate income tax doubtful accounts.
The $3.7 billion consists of $2.9 billion in operating expense, $590 million for amortization, $87 million in inventory consumption, $77 million for the June 2013 floods, and $21 million in losses on disposals.
■■ $66 million was allocated for workforce strategies, including attraction and retention programs, labour qualification and mobility, and aboriginal development partnerships. Launched the Alberta Workforce Information online subscription tool for employers to access workforce information.
■■ Processed 9,894 Alberta Immigrant Nominee Program applications, and issued 5,541 certificates.
■■ $37 million for Occupational Health and Safety (OHS) programs. Ten OHS officers completed
10 GovErnmEnt of albErta 2013–14 annual rEport#buildingAlberta
a newly designed peace officer training program, allowing them to issue tickets directly.
■■ Adjusted the minimum wage from $9.75 per hour to $9.95, based on Alberta Consumer Price Index and average weekly earnings increases.
■■ The Final Mile Rural Connectivity Initiative has enabled access to high-speed internet for over 98% of Alberta households.
■■ $426 million was spent on provincial highway maintenance and preservation.
■■ Passed the Enhancing Safety on Alberta Roads Act, providing more flexibility on highway lane use and for municipalities on timing of playground speed restrictions.
■■ Continued development and implementation of traffic safety plans aimed at improving safety of vehicles, roads and drivers.
■■ Alberta 5-1-1, which gives reliable traveler information instantly, has received over 200 million hits from 1.2 million unique viewers since it was created last year.
■■ The Alberta Family Employment Tax Credit provided $117 million to low and middle-income families with children and employment income.
■■ Held an economic and revenue forecasting conference, consulted with Albertans on the budget, fiscal framework and savings policy, and consulted directly with major bank economists on the Budget 2014 forecast. An expanded savings policy was introduced with Budget 2014 through approval of the Savings Management Act.
advancinG world-lEadinG rEsourcE stEwardsHipaGriculturE and rural dEvElopmEntOperational expense (excluding debt servicing costs) was $771 million, a decrease of $360 million from 2012-13 and $92 million from budget, primarily from an overall exceptional year for the agriculture sector and the termination of the Farm Fuel Distribution Allowance for 2013-14.
■■ In 2012-13, $266 million in disaster assistance was provided in-year, while only $2 million was budgeted and spent in 2013-14 (related to the 2011 Slave Lake wildfire).
■■ Indemnity payments of $350 million for crop, hail and livestock insurance were incurred in 2013-14.
■■ The Alberta Livestock and Meat Agency allocated $18 million to help agri-food businesses develop new markets, products and technologies.
■■ $40 million through Growing Forward 2 to support innovation in the agri-food sector.
■■ Continued development of a comprehensive irrigation strategy and the Rural Economic Development Action Plan.
■■ Considered possible enhancements to the grain transportation system, with producers, the federal and other provincial governments, after record crop production in Western Canada caused delays.
EnErGyEnergy operational expense was $685 million, an increase of $108 million from 2012-13, and an increase of $223 million from Budget 2013.
■■ The increase from 2012-13 was mainly due to $73 million in Land Use Framework settlements, primarily for the Fort McMurray Urban Development Sub-Region, and $36 million in set-up costs for the new Alberta Energy Regulator.
■■ In addition to these, the increase from budget is exaggerated as budget numbers are not restated consistently with 2012-13 and 2013-14 actuals. An accounting policy change that requires reporting gross crude oil royalties in revenue, and transportation and marketing costs in expense, instead of netting the costs from revenue, was implemented in Budget 2013, but some costs were omitted. Budget 2013 revenue and expense for 2012-13 have been increased by $120 million.
■■ $68 million was provided under the Bioenergy Producer Credit program to encourage a variety of bioenergy products, such as renewable fuels, liquid biofuels, electricity, heat and biomass pellets and gas products. This was $24 million more than in 2012-13. No new grants are being issued, and existing agreements will be completed in 2015-16.
EnvironmEnt and sustainablE rEsourcE dEvElopmEntOperational expense was $633 million, $157 million lower than 2012-13, but an increase of $116 million from Budget 2013. The increase from budget was mainly due to the provision of in-year disaster assistance for forest fire-fighting of $102 million, which was $183 million lower than 2012-13 disaster costs.
ExEcutivE summary 11#buildingAlberta
■■ Provided $40 million to combat mountain pine beetle infestations.
■■ Spent $213 million, including $102 million of in-year disaster assistance, to fight 1,193 forest fires, which consumed about 19,572 hectares.
■■ Accepted the 21 Flat Top Complex Wildfire Review Committee recommendations, implemented 13, and began work on the final eight. $18 million was provided in 2013-14.
otHEr ministriEsAboriginal Relations and International and Intergovernmental Relations operational expense was $389 million, $206 million higher than 2012-13 and $183 million higher than budget, due primarily to $193 million for June 2013 flood assistance.
■■ Trade and investment missions to Asia and the US promoted Alberta as an environmentally-responsible, stable, global energy supplier, and articulated Alberta’s case for expanded market access.
■■ Filled 16 post-graduate externship positions with 13 host organizations in the US, China, Japan and Europe through the Alberta Abroad program.
■■ Over $121 million in casino revenue was provided to First Nations through the First Nations Development Fund.
■■ Updated the Policy on Consultation with First Nations on Land and Natural Resource Management, established the Aboriginal Consultation Office and provided $6 million through the First Nations Consultation Capacity Investment program.
■■ Allocated $10 million, as part of an $85 million ten-year commitment, to help achieve self-sustainability of Metis Settlements.
GEnEral dEbt sErvicinG costs■■ General debt servicing costs primarily represent
interest paid on: unmatured debt, borrowing undertaken to repay the Teachers’ Pension Plan debt, and lending operations of Alberta Capital Finance Authority (ACFA) and Agriculture Financial Services Corporation (AFSC).
■■ 2013-14 general debt servicing costs were $360 million, a decrease of $11 million from 2012-13 and $42 million from budget.The decrease from 2012-13 primarily reflects repayment in 2012-13 of maturing GRF debt,
partly offset by increased ACFA borrowing in 2013-14, to facilitate higher lending to municipalities which generates offsetting interest revenue. The decrease from budget is due primarily to lower-than-expected interest rates and borrowing by AFSC, partly due to higher-than-expected loan repayments.
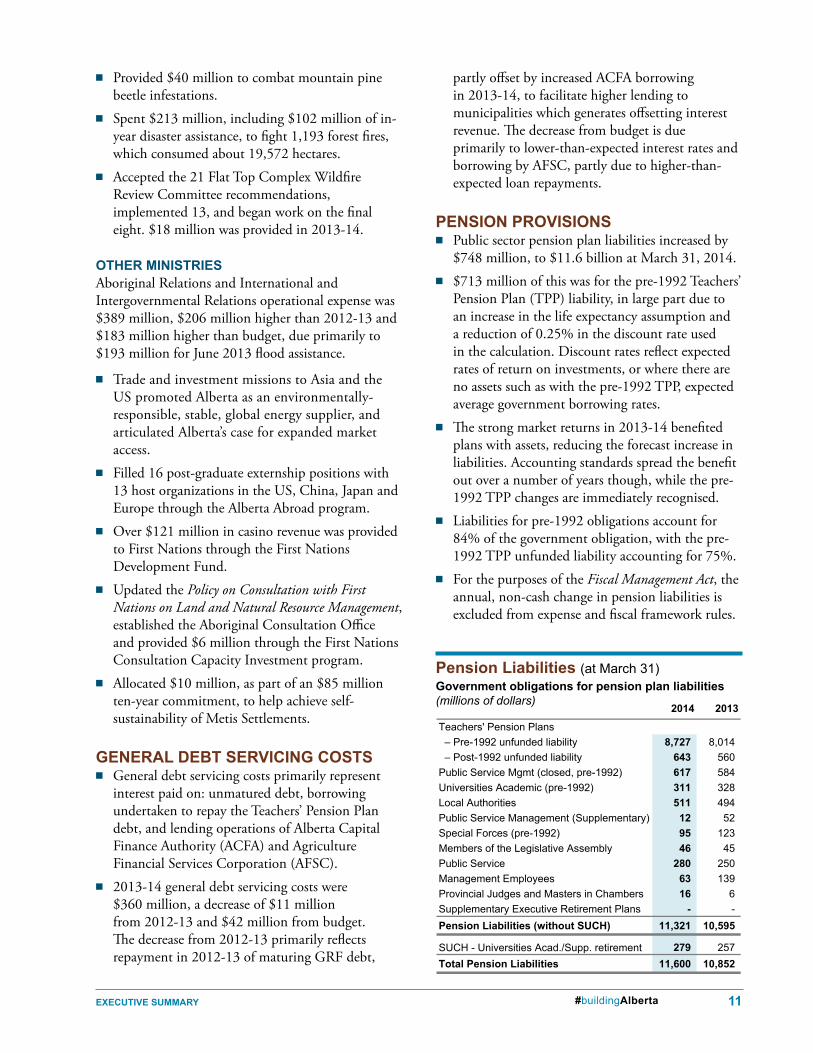
pEnsion provisions■■ Public sector pension plan liabilities increased by
$748 million, to $11.6 billion at March 31, 2014.■■ $713 million of this was for the pre-1992 Teachers’
Pension Plan (TPP) liability, in large part due to an increase in the life expectancy assumption and a reduction of 0.25% in the discount rate used in the calculation. Discount rates reflect expected rates of return on investments, or where there are no assets such as with the pre-1992 TPP, expected average government borrowing rates.
■■ The strong market returns in 2013-14 benefited plans with assets, reducing the forecast increase in liabilities. Accounting standards spread the benefit out over a number of years though, while the pre-1992 TPP changes are immediately recognised.
■■ Liabilities for pre-1992 obligations account for 84% of the government obligation, with the pre-1992 TPP unfunded liability accounting for 75%.
■■ For the purposes of the Fiscal Management Act, the annual, non-cash change in pension liabilities is excluded from expense and fiscal framework rules.
pension liabilities (at March 31)Government obligations for pension plan liabilities(millions of dollars)
2013-14_AR-Summ_T04_pl.pdf 2013-14 GOA Annual ReportExecutive Summary
Pension Liabilities (at March 31, 2014)Government obligations for pension plan liabilities(millions of dollars)
2014 2013
Teachers' Pension Plans – Pre-1992 unfunded liability 8,727 8,014 – Post-1992 unfunded liability 643 560 Public Service Mgmt (closed, pre-1992) 617 584 Universities Academic (pre-1992) 311 328 Local Authorities 511 494 Public Service Management (Supplementary) 12 52 Special Forces (pre-1992) 95 123 Members of the Legislative Assembly 46 45 Public Service 280 250 Management Employees 63 139 Provincial Judges and Masters in Chambers 16 6 Supplementary Executive Retirement Plans - - Pension Liabilities (without SUCH) 11,321 10,595
SUCH - Universities Acad./Supp. retirement 279 257 Total Pension Liabilities 11,600 10,852
2013-14_AR-Summ_T04_pl.pdf
W:\Obm.publns\OBM.PUBLNS-2014-15\2013-14_GoA_AnnReport\13-14_GoA-AR_Summary\source_documents\2013-14_Executive Summary TablesT4. Pension 6/10/2014
12 GovErnmEnt of albErta 2013–14 annual rEport#buildingAlberta
2013-14_AR-Summ_T05_cp.pdf 2013-14 GOA Annual ReportExecutive Summary
Capital Plana
(millions of dollars)
2012-13 2012-13BY MINISTRY Budget Actual Actual Budget ActualInvesting in Families and Communities
Culture 54 54 73 - (19) Health 104 80 90 (24) (10) Human Services 9 5 8 (4) (3) Infrastructure (health facilities) 576 373 431 (203) (58) Justice and Solicitor General 87 56 112 (31) (56) Municipal Affairs 921 920 892 (1) 28 Tourism, Parks and Recreation 19 18 15 (1) 3 Transportation (municipal support) 751 691 749 (60) (58)
Securing Alberta's Economic FutureEducation 564 504 313 (60) 191 Infrastructure 214 232 241 18 (9) Innovation and Advanced Education 68 70 82 2 (12) Jobs, Skills, Training and Labour 1 1 - - 1 Service Alberta 41 38 28 (3) 10 Transportation 1,409 1,389 1,680 (20) (291) Treasury Board and Finance 29 38 44 9 (6)
Advancing World-leading Resource StewardshipAgriculture and Rural Development 34 37 48 3 (11) Energy 197 139 130 (58) 9 Environment and Sustainable Resource Development 126 148 148 22 -
Other - Legislative Assembly 5 5 3 - 2 2013 Alberta flood assistance
Education - 13 - 13 13 Environment and Sustainable Resource Development - 174 - 174 174 Municipal Affairs - 12 - 12 12 Other - 5 - 5 5
Total Capital Plan 5,209 5,002 5,087 (207) (85)
Capital Plan FinancingRevenue received for capital purposes 522 491 504 (31) (13) Retained income of funds and agencies for capital purposes 84 50 24 (34) 26 Book value of capital asset disposals 2 76 84 74 (8) Alternative financing (P3s) 344 332 255 (12) 77 Direct borrowing 3,190 3,824 925 634 2,899 Net (deposit) / withdrawal from Capital Plan financing account 1,067 229 (902) (838) 1,131 Transfer from Contingency Account - - 4,197 - (4,197)
Total Capital Plan Financing 5,209 5,002 5,087 (207) (85)
Capital Plan Debt Servicing CostsEducation (Alberta Schools Alternative Procurement P3s) 27 27 26 - 1 Transportation (ring road P3s) 67 65 62 (2) 3 Treasury Board and Finance (direct borrowing) 144 138 53 (6) 85
Total Capital Plan Debt Servicing Costs 238 230 141 (8) 89
Change from 2013-14
W:\Obm.publns\OBM.PUBLNS-2014-15\2013-14_GoA_AnnReport\13-14_GoA-AR_Summary\source_documents\2013-14_Executive Summary TablesT5. Capital Plan 6/12/2014
capital plan(millions of dollars)
cAPitAl PlAn
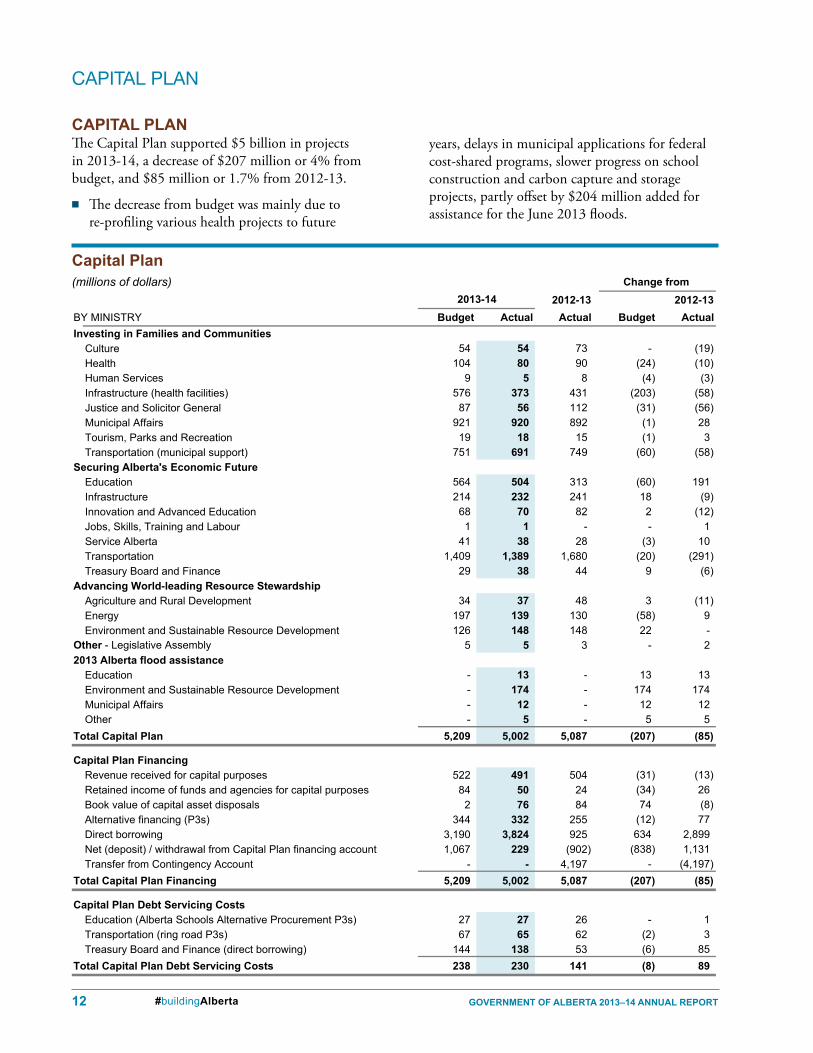
capital planThe Capital Plan supported $5 billion in projects in 2013-14, a decrease of $207 million or 4% from budget, and $85 million or 1.7% from 2012-13.
■■ The decrease from budget was mainly due to re-profiling various health projects to future
years, delays in municipal applications for federal cost-shared programs, slower progress on school construction and carbon capture and storage projects, partly offset by $204 million added for assistance for the June 2013 floods.
ExEcutivE summary 13#buildingAlberta
■■ The decrease from 2012-13 was mainly due to Budget 2013 restraint measures particularly for transportation projects, partly offset by the planned increase for school construction under the third P3 arrangement, and the $204 million added for assistance for the June 2013 floods.
■■ Opened a new cancer centre in Red Deer. Finished construction of a Neonatal Intensive Care Unit in Calgary, endoscopy suite in Edmonton, health facilities in Bow Island and Sherwood Park, and emergency department and ambulance bay renovations in Fort McMurray. Continued work on projects in Edson, Grande Prairie, High Prairie, Lethbridge, Medicine Hat and Calgary.
■■ $1.6 billion in municipal support:■♦ $848 million Municipal Sustainability Initiative
grants and $36 million for disaster recovery assistance for the 2011 Slave Lake wildfire.
■♦ $216 million through GreenTRIP for transit systems, $249 million in Basic Municipal Transportation Grants and $195 million under the Building Canada – Gas Tax Fund.
■♦ $79 million for water and wastewater systems.
■■ $498 million for schools, down $65 million from budget, due to slower-than-expected progress, but $192 million more than 2012-13 due to ramping up of the third P3 contract. 35 new schools and modernizations will open September 2014, and contracts for 50 new and 70 modernization projects are to be in place by the end of 2014.
■■ Provided $48 million for maintenance and renewal, and $15 million for expansion and upgrading, of post-secondary facilities.
■■ $1.4 billion for the highway network, including:■♦ $639 million for the Edmonton and Calgary
ring roads. Reached agreement with the Tsuu T’ina Nation on land acquisition for the final portion of the Calgary ring road.
■♦ $397 million for twinning, interchanges and other construction work.
■♦ $234 million for Highway 63, with more than 48 kilometres twinned in 2013-14.
■♦ $42 million for bridge projects, and $69 million for rehabilitation of 438 kilometres of roads.
■■ $107 million of industry charges allocated for climate change and emissions reduction technology
development, $14 million in federal ecoTrust initiatives and $7 million for land conservation.
■■ Provided $115 million in carbon capture and storage grants. Total support so far is $250 million.
■■ Added 335 continuing care spaces, for a total of 3,369 since 2010.
■■ $16 million for maintenance and renewal of parks.■■ $16 million for cultural and recreational projects
including Calgary’s National Music Centre and facilities in Lethbridge and Medicine Hat.
■■ Lottery funding of $34 million for 450 Community Facility Enhancement projects.
■■ Work continued on Edmonton Federal Building and Centennial Plaza, Evan Thomas water treatment facility and Royal Alberta Museum.
■■ $204 million for June 2013 flood assistance.
capital plan financinG ■■ $491 million in revenue received for capital
projects comprised $317 million in federal funding, $106 million for climate change and $68 million from Lottery Fund and other sources.
■■ $50 million of retained income of entities like Alberta Social Housing Corporation, regulatory and other agencies funded their capital spending.
■■ Capital assets recorded as $76 million on the balance sheet were disposed of, requiring a non-cash impact on the surplus / deficit that creates a cash source of $76 million for the Capital Plan.
■■ Public-private partnerships primarily for schools and ring roads provided $332 million.
■■ $3.8 billion in direct borrowing. Any difference between cash requirements and borrowed amounts is deposited or withdrawn from the Capital Plan financing account. It had $902 million to start the year, of which a net $229 million was used.
capital dEbt sErvicinG costs■■ Capital Plan debt servicing costs represent interest
paid on direct borrowing, set by markets at time of issuance, and alternatively-financed public-private partnerships, set out in contracts.
■■ 2013-14 debt servicing costs were $230 million, $89 million higher than in 2012-13, due to the increase in the amount of direct debt.
14 GovErnmEnt of albErta 2013–14 annual rEport#buildingAlberta
2013-14_AR-Summ_T06_rev.pdf 2013-14 GOA Annual ReportExecutive Summary
Revenuea
(millions of dollars)
2012-13 2012-13Budget Actual Actual Budget Actual
Income TaxesPersonal income tax 10,001 10,537 9,621 536 916 Corporate income tax 4,943 5,488 4,756 545 732
14,944 16,025 14,377 1,081 1,648 Other Taxes
Education property tax 1,835 1,860 1,776 25 84 Tobacco tax 920 922 912 2 10 Fuel tax 900 925 897 25 28 Insurance taxes 333 359 334 26 25 Freehold mineral rights tax 152 146 119 (6) 27 Tourism levy 85 87 82 2 5
4,225 4,299 4,121 74 178 Non-Renewable Resource Revenue
Bitumen royalty 3,367 5,222 3,560 1,855 1,662 Crude oil royalty 1,615 2,476 2,038 861 438 Natural gas and by-products royalty 965 1,103 954 138 149 Bonuses and sales of Crown leases 1,148 588 1,053 (560) (465) Rentals and fees 145 173 176 28 (3) Coal royalty 10 16 (3) 6 19
7,250 9,578 7,779 2,328 1,799 Transfers from Government of Canada
Canada Health Transfer 2,597 2,612 2,364 15 248 Canada Social Transfer 1,374 1,410 1,315 36 95 Agriculture support programs 319 272 279 (47) (7) Labour market agreements 174 186 177 12 9 Infrastructure support 371 317 372 (54) (55) 2013 Alberta flood assistance - 1,582 - 1,582 1,582 Other 285 350 297 65 53
5,120 6,729 4,804 1,609 1,925 Investment Income
Alberta Heritage Savings Trust Fund 1,368 2,272 1,464 904 808 Endowment funds 234 393 261 159 132 Alberta Capital Finance Authority 279 278 258 (1) 20 Contingency Account 63 80 307 17 (227) Agriculture Financial Services Corporation 124 118 111 (6) 7 Other 77 84 89 7 (5)
2,145 3,225 2,490 1,080 735 Net Income from Government Business Enterprises
AGLC – Gaming / lottery 1,484 1,484 1,485 - (1) AGLC – Liquor 718 747 729 29 18 Alberta Treasury Branches 250 280 245 30 35 Other 26 30 26 4 4
2,478 2,541 2,485 63 56 Premiums, Fees and Licences
Motor vehicle licences 485 492 467 7 25 Crop, hail and livestock insurance premiums 313 379 314 66 65 Energy industry levies 203 215 159 12 56 Land titles 85 86 82 1 4 Land and grazing 69 75 76 6 (1) Supplementary health benefits premiums 53 50 53 (3) (3) Other 364 412 379 48 33
1,572 1,709 1,530 137 179 Other
AIMCo investment management charges 167 248 222 81 26 Fines and penalties 126 137 136 11 1 Refunds of expense 122 205 246 83 (41) Climate change and emissions management 60 106 94 46 12 Miscellaneous 528 491 472 (37) 19
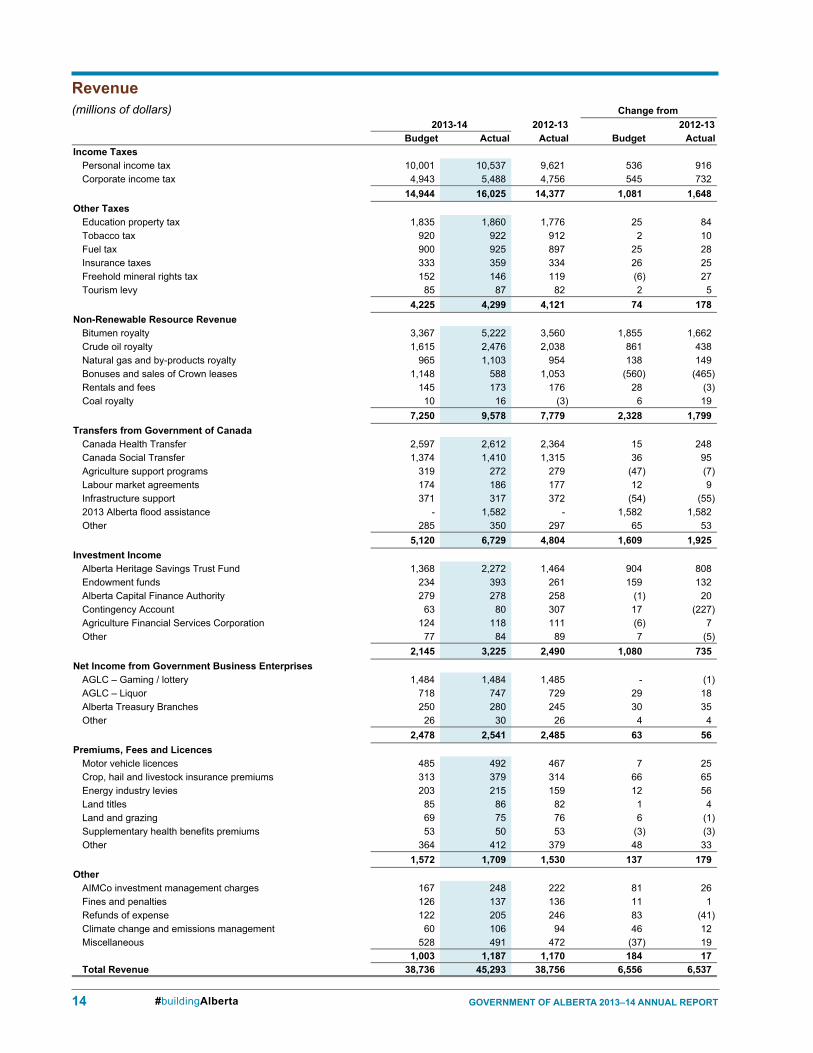
1,003 1,187 1,170 184 17 Total Revenue 38,736 45,293 38,756 6,556 6,537
Change from 2013-14
W:\Obm.publns\OBM.PUBLNS-2014-15\2013-14_GoA_AnnReport\13-14_GoA-AR_Summary\source_documents\2013-14_Executive Summary_Tables.xlsxT6. Revenue 6/16/2014
revenue(millions of dollars)
ExEcutivE summary 15#buildingAlberta
total rEvEnuE■■ Total 2013-14 revenue on the Fiscal Plan basis was
$45.3 billion. This was $6.6 billion higher than budget and $6.5 billion higher than 2012-13.
■■ The increases from budget and from 2012-13 were due mainly to higher income tax revenue, bitumen, crude oil and natural gas royalties, investment income, and federal assistance for the June 2013 floods, partially offset by lower Crown land lease sales.
non-rEnEwablE rEsourcE rEvEnuE■■ Non-renewable resource revenue was $9.6 billion.
This was $2.3 billion higher than estimated in Budget 2013 and $1.8 billion higher than in 2012-13.
■■ Global economic growth prospects continued to be uncertain and varied, but positive trends began to develop in 2013. Europe appears to have hit bottom and started to rebound, though struggles remain in several nations and with financial markets. The US economy strengthened in 2013. While developing nations’ growth continued decelerating last year, the slow-down was from very high rates, and is stabilizing. Most oil demand and price increases over the last decade were tied to the torrid pace these nations experienced. These developments supported oil demand and prices.
■■ Supply disruptions from political unrest in the Middle East essentially offset the impact of accelerating US and Canadian production. As a result of these demand and supply factors, oil prices were higher than expected in Budget 2013.
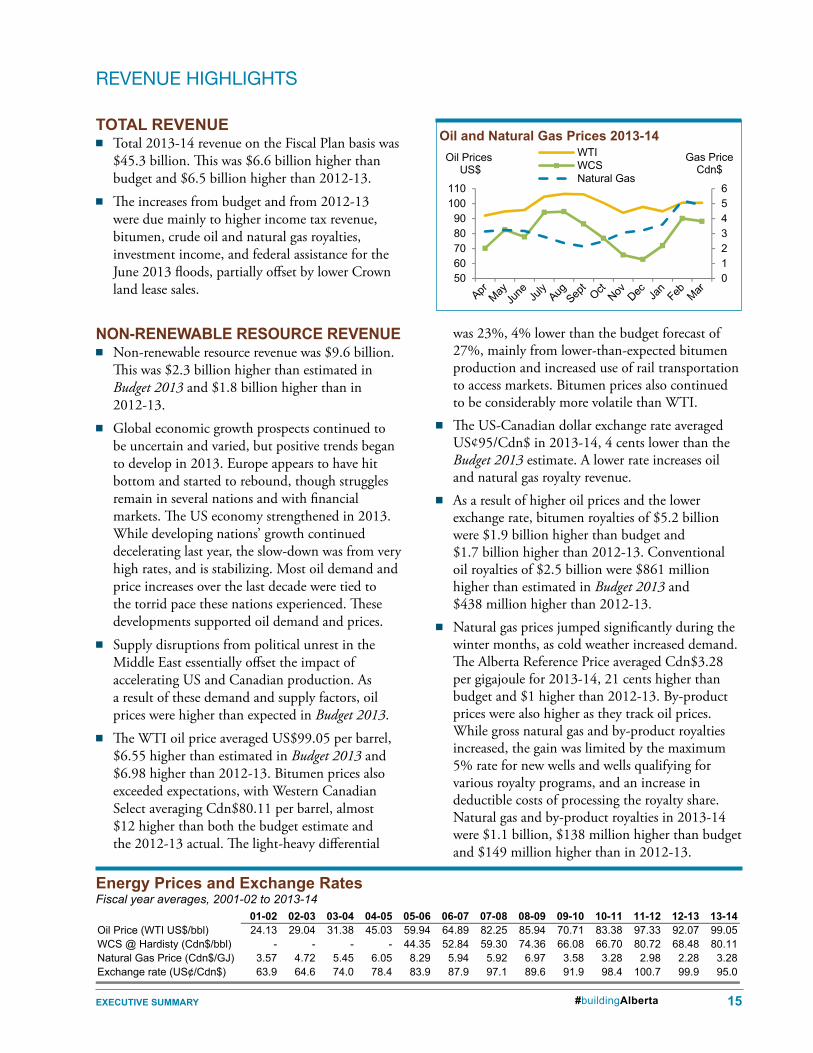
■■ The WTI oil price averaged US$99.05 per barrel, $6.55 higher than estimated in Budget 2013 and $6.98 higher than 2012-13. Bitumen prices also exceeded expectations, with Western Canadian Select averaging Cdn$80.11 per barrel, almost $12 higher than both the budget estimate and the 2012-13 actual. The light-heavy differential
revenue highlightS
2013-14_AR-Summ_T01_fs.pdf 2013-14 GOA Annual ReportExecutive Summary
Energy Prices and Exchange RatesFiscal year averages, 2001-02 to 2013-14
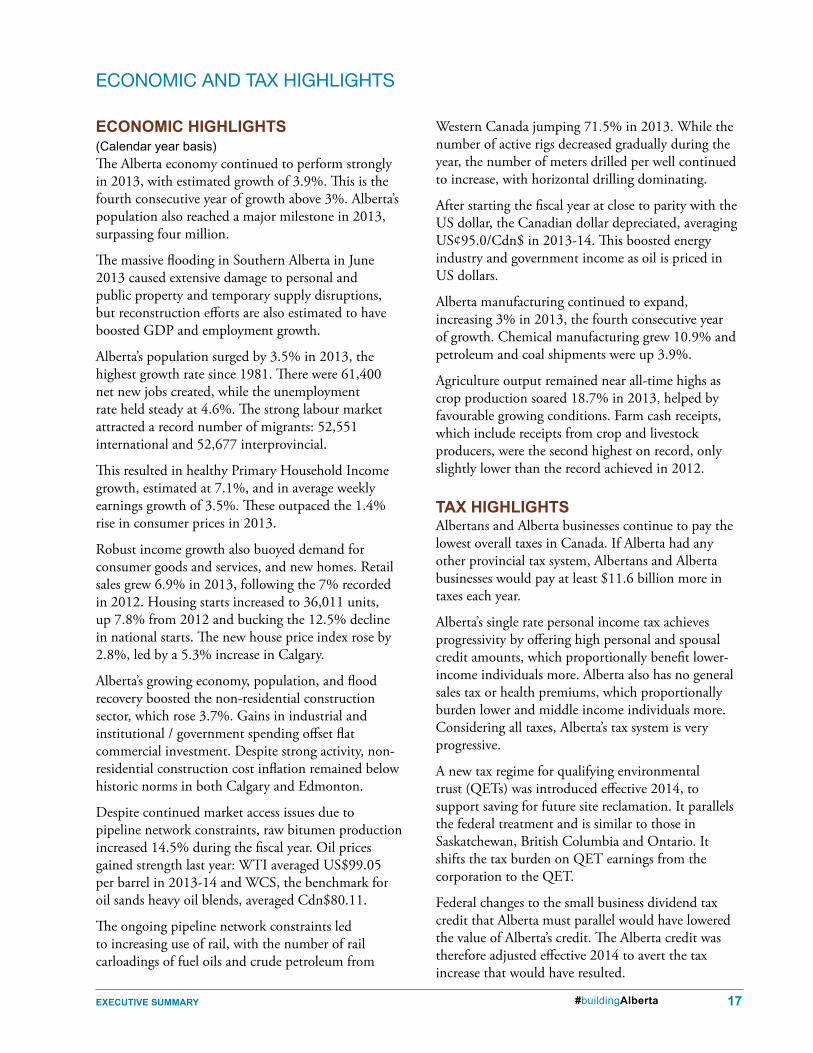
01-02 02-03 03-04 04-05 05-06 06-07 07-08 08-09 09-10 10-11 11-12 12-13 13-14Oil Price (WTI US$/bbl) 24.13 29.04 31.38 45.03 59.94 64.89 82.25 85.94 70.71 83.38 97.33 92.07 99.05WCS @ Hardisty (Cdn$/bbl) - - - - 44.35 52.84 59.30 74.36 66.08 66.70 80.72 68.48 80.11Natural Gas Price (Cdn$/GJ) 3.57 4.72 5.45 6.05 8.29 5.94 5.92 6.97 3.58 3.28 2.98 2.28 3.28Exchange rate (US¢/Cdn$) 63.9 64.6 74.0 78.4 83.9 87.9 97.1 89.6 91.9 98.4 100.7 99.9 95.0
W:\Obm.publns\OBM.PUBLNS-2014-15\2013-14_GoA_AnnReport\13-14_GoA-AR_Summary\source_documents\2013-14_Executive Summary TablesT9. ENGY_Prices 6/8/2014
Energy prices and Exchange ratesFiscal year averages, 2001-02 to 2013-14
oil and natural Gas prices 2013-14
PDF named: 2013-14_AR-Summ_C07_ongp.pdf Measuring UpOil chart
Oil and Natural Gas Prices 2013‐14
0123456
5060708090
100110
Gas PriceCdn$
Oil PricesUS$
WTIWCSNatural Gas
W:\Obm.publns\OBM.PUBLNS-2014-15\2013-14_GoA_AnnReport\13-14_GoA-AR_Summary\source_documents\2013-14_Executive Summary Tables.xlsx/C7. Energy pr chart Printed: 6/12/2014 / 10:42 AM
was 23%, 4% lower than the budget forecast of 27%, mainly from lower-than-expected bitumen production and increased use of rail transportation to access markets. Bitumen prices also continued to be considerably more volatile than WTI.
■■ The US-Canadian dollar exchange rate averaged US¢95/Cdn$ in 2013-14, 4 cents lower than the Budget 2013 estimate. A lower rate increases oil and natural gas royalty revenue.
■■ As a result of higher oil prices and the lower exchange rate, bitumen royalties of $5.2 billion were $1.9 billion higher than budget and $1.7 billion higher than 2012-13. Conventional oil royalties of $2.5 billion were $861 million higher than estimated in Budget 2013 and $438 million higher than 2012-13.
■■ Natural gas prices jumped significantly during the winter months, as cold weather increased demand. The Alberta Reference Price averaged Cdn$3.28 per gigajoule for 2013-14, 21 cents higher than budget and $1 higher than 2012-13. By-product prices were also higher as they track oil prices. While gross natural gas and by-product royalties increased, the gain was limited by the maximum 5% rate for new wells and wells qualifying for various royalty programs, and an increase in deductible costs of processing the royalty share. Natural gas and by-product royalties in 2013-14 were $1.1 billion, $138 million higher than budget and $149 million higher than in 2012-13.
16 GovErnmEnt of albErta 2013–14 annual rEport#buildingAlberta
■■ Crown land lease sales revenue was $588 million, down $560 million from budget and $465 million from 2012-13, due mainly to a lower number of hectares sold, and lower prices per hectare.
tax rEvEnuE■■ Total tax revenue was $20.3 billion, an increase of
$1.2 billion from the Budget 2013 estimate and $1.8 billion higher than in 2012-13.
■■ Personal income tax revenue was $10.5 billion, an increase of $536 million from the budget and $916 million from 2012-13, due mainly to strong employment, income and population growth, and to higher-than-expected 2012 tax year assessments. The higher assessments mean revenue reported in 2011-12 and 2012-13 was underestimated. This elevates the base for forecasting 2013-14 revenue and requires a positive prior years’ adjustment of $231 million.
■■ Corporate income tax revenue was $5.5 billion, an increase of $545 million from the budget and $732 million from 2012-13. Cash instalment payments from corporations were higher than expected given the uncertainty around pipeline decisions, market access and the resulting swings in prices Alberta energy producers receive. Solid consumer, residential construction and machinery export sectors, coupled with stable costs partly tied to an expanding population and labour force, buoyed corporate profitability.
■■ Other tax revenue was $4.3 billion, an increase of $178 million from 2012-13 and $74 million from budget, mainly from higher property, insurance and fuel taxes.
transfErs from GovErnmEnt of canada
■■ $6.7 billion, an increase of $1.6 billion from budget and $1.9 billion from 2012-13, almost entirely due to $1.6 billion in estimated assistance for the June 2013 floods. While Alberta received $500 million in March 2013, and will receive further payments in future years, the revenue (and associated expense) is all reported in 2013-14 per accounting standards. The additional increase from 2012-13 related primarily to higher health and social transfers.
otHEr rEvEnuE■■ Other revenue was $5.4 billion, an increase of
$384 million from the budget and $252 million from 2012-13, partly due to the impact of population growth on volume-driven revenue, strong investment returns and greater participation from agriculture producers.
■■ “Other” premiums, fees and licences increased mainly due to higher timber rentals and fees and payments-in-lieu-of-taxes from higher net income of Alberta Treasury Branches.
■■ “Miscellaneous” revenue was lower than budget primarily from delayed land sales in Fort McMurray.
Global Equity markets 2012-14
PDF saved as:2013-14_AR-Summ_C08_emp11-13.pdf
13-14 GoA Annual ReportSummary
Equity Market Performance, 2012–2014
2013-14_AR-Summ_C08_emp11-13.pdf
8,000
12,000
16,000
20,000DOW S&P TSXNIKKEI FTSE 250
W:\Obm.publns\OBM.PUBLNS-2014-15\2013-14_GoA_AnnReport\13-14_GoA-AR_Summary\source_documents\2013-14_Executive Summary Tables.xlsx/C8. Perform. of Major Stock PDF on: 6/12/2014 | 11:05 AM
■■ Transfers for agriculture and infrastructure programs were lower mainly due to the agriculture sector’s excellent year and project re-profiling. Other transfers were higher primarily due to reception of cash for prior-years’ disaster assistance.
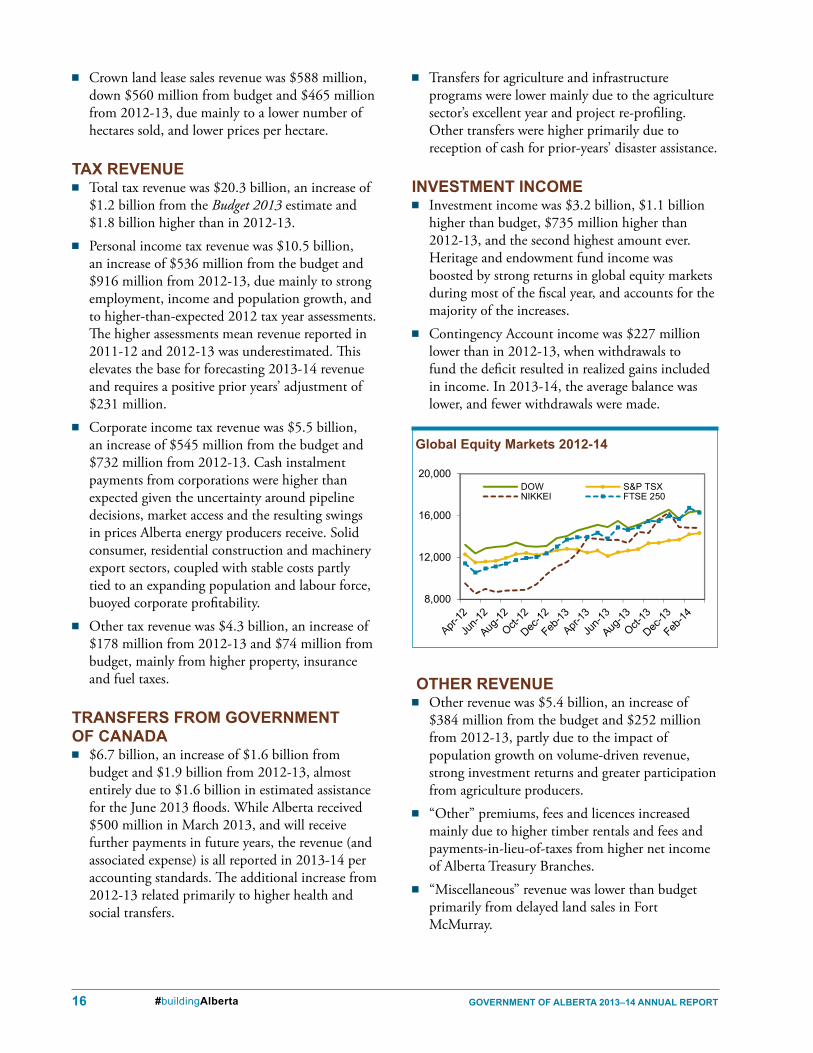
invEstmEnt incomE■■ Investment income was $3.2 billion, $1.1 billion
higher than budget, $735 million higher than 2012-13, and the second highest amount ever. Heritage and endowment fund income was boosted by strong returns in global equity markets during most of the fiscal year, and accounts for the majority of the increases.
■■ Contingency Account income was $227 million lower than in 2012-13, when withdrawals to fund the deficit resulted in realized gains included in income. In 2013-14, the average balance was lower, and fewer withdrawals were made.
ExEcutivE summary 17#buildingAlberta
Economic HiGHliGHts (Calendar year basis)The Alberta economy continued to perform strongly in 2013, with estimated growth of 3.9%. This is the fourth consecutive year of growth above 3%. Alberta’s population also reached a major milestone in 2013, surpassing four million.
The massive flooding in Southern Alberta in June 2013 caused extensive damage to personal and public property and temporary supply disruptions, but reconstruction efforts are also estimated to have boosted GDP and employment growth.
Alberta’s population surged by 3.5% in 2013, the highest growth rate since 1981. There were 61,400 net new jobs created, while the unemployment rate held steady at 4.6%. The strong labour market attracted a record number of migrants: 52,551 international and 52,677 interprovincial.
This resulted in healthy Primary Household Income growth, estimated at 7.1%, and in average weekly earnings growth of 3.5%. These outpaced the 1.4% rise in consumer prices in 2013.
Robust income growth also buoyed demand for consumer goods and services, and new homes. Retail sales grew 6.9% in 2013, following the 7% recorded in 2012. Housing starts increased to 36,011 units, up 7.8% from 2012 and bucking the 12.5% decline in national starts. The new house price index rose by 2.8%, led by a 5.3% increase in Calgary.
Alberta’s growing economy, population, and flood recovery boosted the non-residential construction sector, which rose 3.7%. Gains in industrial and institutional / government spending offset flat commercial investment. Despite strong activity, non-residential construction cost inflation remained below historic norms in both Calgary and Edmonton.
Despite continued market access issues due to pipeline network constraints, raw bitumen production increased 14.5% during the fiscal year. Oil prices gained strength last year: WTI averaged US$99.05 per barrel in 2013-14 and WCS, the benchmark for oil sands heavy oil blends, averaged Cdn$80.11.
The ongoing pipeline network constraints led to increasing use of rail, with the number of rail carloadings of fuel oils and crude petroleum from
Western Canada jumping 71.5% in 2013. While the number of active rigs decreased gradually during the year, the number of meters drilled per well continued to increase, with horizontal drilling dominating.
After starting the fiscal year at close to parity with the US dollar, the Canadian dollar depreciated, averaging US¢95.0/Cdn$ in 2013-14. This boosted energy industry and government income as oil is priced in US dollars.
Alberta manufacturing continued to expand, increasing 3% in 2013, the fourth consecutive year of growth. Chemical manufacturing grew 10.9% and petroleum and coal shipments were up 3.9%.
Agriculture output remained near all-time highs as crop production soared 18.7% in 2013, helped by favourable growing conditions. Farm cash receipts, which include receipts from crop and livestock producers, were the second highest on record, only slightly lower than the record achieved in 2012.
tax HiGHliGHtsAlbertans and Alberta businesses continue to pay the lowest overall taxes in Canada. If Alberta had any other provincial tax system, Albertans and Alberta businesses would pay at least $11.6 billion more in taxes each year.
Alberta’s single rate personal income tax achieves progressivity by offering high personal and spousal credit amounts, which proportionally benefit lower-income individuals more. Alberta also has no general sales tax or health premiums, which proportionally burden lower and middle income individuals more. Considering all taxes, Alberta’s tax system is very progressive.
A new tax regime for qualifying environmental trust (QETs) was introduced effective 2014, to support saving for future site reclamation. It parallels the federal treatment and is similar to those in Saskatchewan, British Columbia and Ontario. It shifts the tax burden on QET earnings from the corporation to the QET.
Federal changes to the small business dividend tax credit that Alberta must parallel would have lowered the value of Alberta’s credit. The Alberta credit was therefore adjusted effective 2014 to avert the tax increase that would have resulted.
economic And tAx highlightS
18 GovErnmEnt of albErta 2013–14 annual rEport#buildingAlberta
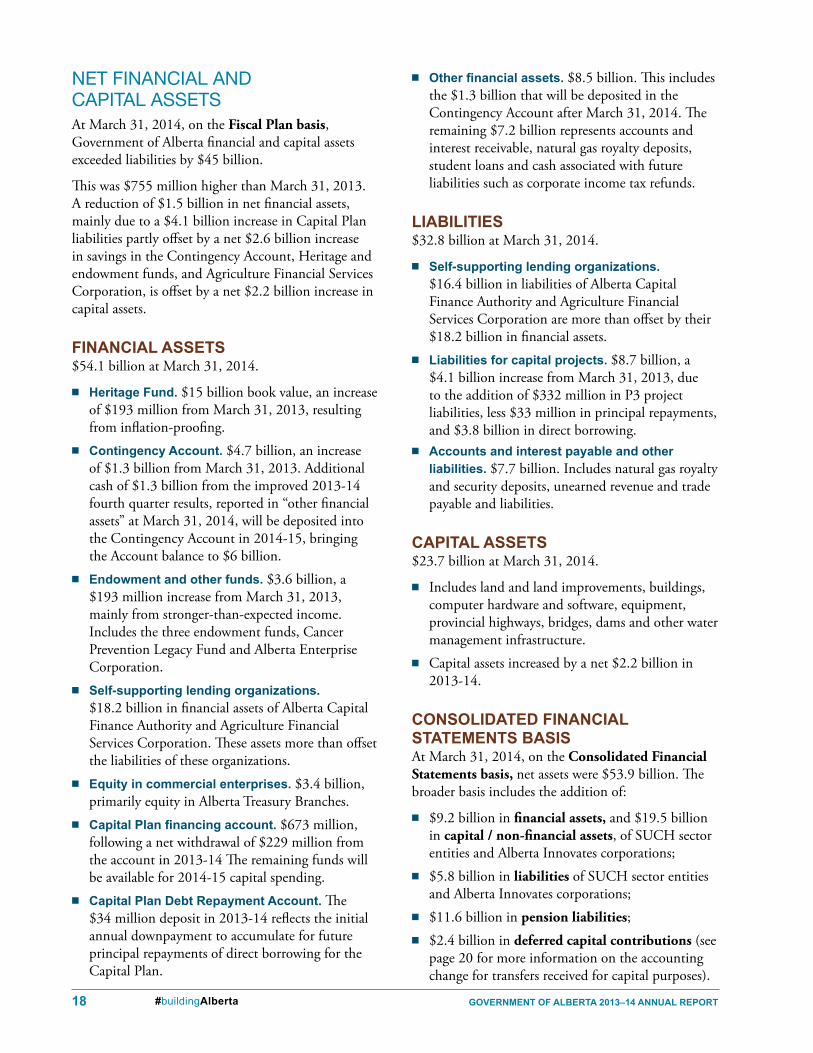
net finAnciAl And cAPitAl ASSetSAt March 31, 2014, on the Fiscal Plan basis, Government of Alberta financial and capital assets exceeded liabilities by $45 billion.
This was $755 million higher than March 31, 2013. A reduction of $1.5 billion in net financial assets, mainly due to a $4.1 billion increase in Capital Plan liabilities partly offset by a net $2.6 billion increase in savings in the Contingency Account, Heritage and endowment funds, and Agriculture Financial Services Corporation, is offset by a net $2.2 billion increase in capital assets.
financial assEts$54.1 billion at March 31, 2014.
■■ Heritage fund. $15 billion book value, an increase of $193 million from March 31, 2013, resulting from inflation-proofing.
■■ contingency account. $4.7 billion, an increase of $1.3 billion from March 31, 2013. Additional cash of $1.3 billion from the improved 2013-14 fourth quarter results, reported in “other financial assets” at March 31, 2014, will be deposited into the Contingency Account in 2014-15, bringing the Account balance to $6 billion.
■■ Endowment and other funds. $3.6 billion, a $193 million increase from March 31, 2013, mainly from stronger-than-expected income. Includes the three endowment funds, Cancer Prevention Legacy Fund and Alberta Enterprise Corporation.
■■ self-supporting lending organizations. $18.2 billion in financial assets of Alberta Capital Finance Authority and Agriculture Financial Services Corporation. These assets more than offset the liabilities of these organizations.
■■ Equity in commercial enterprises. $3.4 billion, primarily equity in Alberta Treasury Branches.
■■ Capital Plan financing account. $673 million, following a net withdrawal of $229 million from the account in 2013-14 The remaining funds will be available for 2014-15 capital spending.
■■ capital plan debt repayment account. The $34 million deposit in 2013-14 reflects the initial annual downpayment to accumulate for future principal repayments of direct borrowing for the Capital Plan.
■■ Other financial assets. $8.5 billion. This includes the $1.3 billion that will be deposited in the Contingency Account after March 31, 2014. The remaining $7.2 billion represents accounts and interest receivable, natural gas royalty deposits, student loans and cash associated with future liabilities such as corporate income tax refunds.
liabilitiEs$32.8 billion at March 31, 2014.
■■ self-supporting lending organizations. $16.4 billion in liabilities of Alberta Capital Finance Authority and Agriculture Financial Services Corporation are more than offset by their $18.2 billion in financial assets.
■■ liabilities for capital projects. $8.7 billion, a $4.1 billion increase from March 31, 2013, due to the addition of $332 million in P3 project liabilities, less $33 million in principal repayments, and $3.8 billion in direct borrowing.
■■ accounts and interest payable and other liabilities. $7.7 billion. Includes natural gas royalty and security deposits, unearned revenue and trade payable and liabilities.
capital assEts$23.7 billion at March 31, 2014.
■■ Includes land and land improvements, buildings, computer hardware and software, equipment, provincial highways, bridges, dams and other water management infrastructure.
■■ Capital assets increased by a net $2.2 billion in 2013-14.
consolidatEd financial statEmEnts basisAt March 31, 2014, on the Consolidated Financial Statements basis, net assets were $53.9 billion. The broader basis includes the addition of:
■■ $9.2 billion in financial assets, and $19.5 billion in capital / non-financial assets, of SUCH sector entities and Alberta Innovates corporations;
■■ $5.8 billion in liabilities of SUCH sector entities and Alberta Innovates corporations;
■■ $11.6 billion in pension liabilities; ■■ $2.4 billion in deferred capital contributions (see
page 20 for more information on the accounting change for transfers received for capital purposes).
ExEcutivE summary 19#buildingAlberta
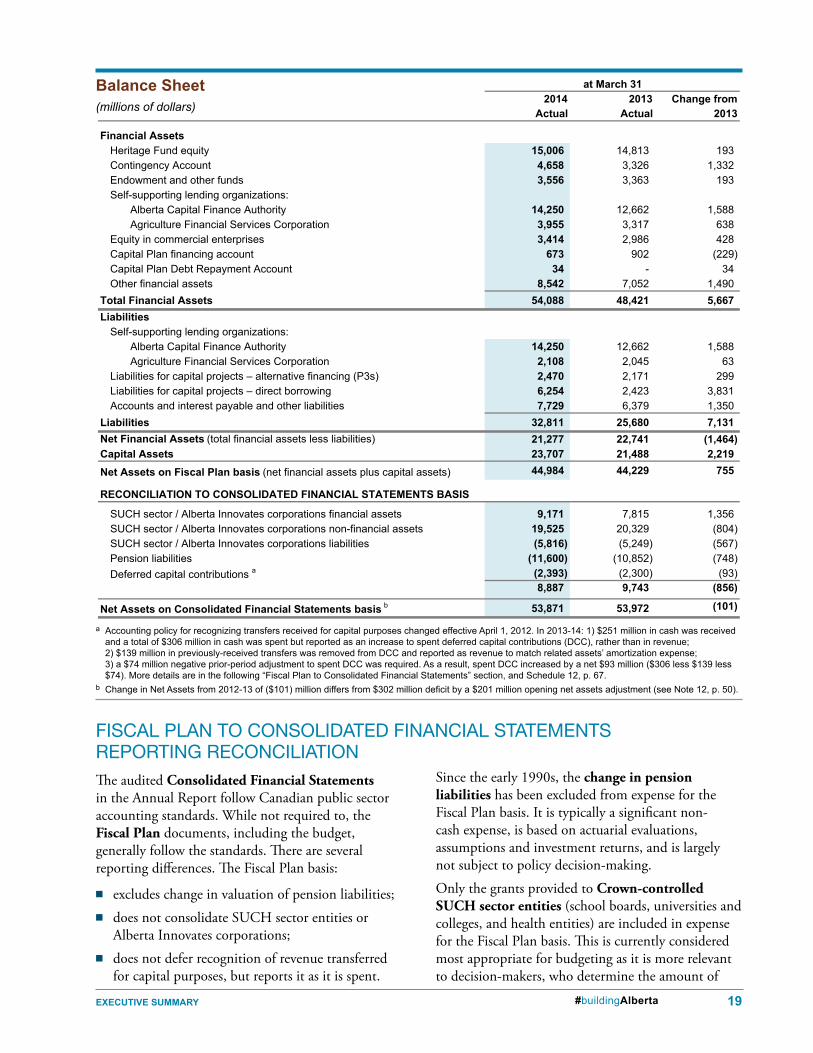
2013-14_AR-Summ_T10_bss.pdf 2013-14 GOA Annual ReportExecutive Summary
Balance Sheet Summary(millions of dollars)
2014 2013 Change fromActual Actual 2013
Financial AssetsHeritage Fund equity 15,006 14,813 193 Contingency Account 4,658 3,326 1,332 Endowment and other funds 3,556 3,363 193 Self-supporting lending organizations:
Alberta Capital Finance Authority 14,250 12,662 1,588 Agriculture Financial Services Corporation 3,955 3,317 638
Equity in commercial enterprises 3,414 2,986 428 Capital Plan financing account 673 902 (229) Capital Plan Debt Repayment Account 34 - 34 Other financial assets 8,542 7,052 1,490
Total Financial Assets 54,088 48,421 5,667 Liabilities
Self-supporting lending organizations:Alberta Capital Finance Authority 14,250 12,662 1,588 Agriculture Financial Services Corporation 2,108 2,045 63
Liabilities for capital projects – alternative financing (P3s) 2,470 2,171 299 Liabilities for capital projects – direct borrowing 6,254 2,423 3,831 Accounts and interest payable and other liabilities 7,729 6,379 1,350
Liabilities 32,811 25,680 7,131 Net Financial Assets (total financial assets less liabilities) 21,277 22,741 (1,464) Capital Assets 23,707 21,488 2,219 Net Assets on Fiscal Plan basis (net financial assets plus capital assets) 44,984 44,229 755
RECONCILIATION TO CONSOLIDATED FINANCIAL STATEMENTS BASIS
SUCH sector / Alberta Innovates corporations financial assets 9,171 7,815 1,356 SUCH sector / Alberta Innovates corporations non-financial assets 19,525 20,329 (804) SUCH sector / Alberta Innovates corporations liabilities (5,816) (5,249) (567) Pension liabilities (11,600) (10,852) (748) Deferred capital contributions a (2,393) (2,300) (93)
8,887 9,743 (856)
Net Assets on Consolidated Financial Statements basis b 53,871 53,972 (101)
at March 31
W:\Obm.publns\OBM.PUBLNS-2014-15\2013-14_GoA_AnnReport\13-14_GoA-AR_Summary\source_documents\2013-14_Executive Summary Tables T10. Balance Sheet 6/12/2014
balance sheet(millions of dollars)
fiScAl PlAn to conSolidAted finAnciAl StAtementS rePorting reconciliAtionThe audited Consolidated Financial Statements in the Annual Report follow Canadian public sector accounting standards. While not required to, the Fiscal Plan documents, including the budget, generally follow the standards. There are several reporting differences. The Fiscal Plan basis:
■■ excludes change in valuation of pension liabilities; ■■ does not consolidate SUCH sector entities or
Alberta Innovates corporations;■■ does not defer recognition of revenue transferred
for capital purposes, but reports it as it is spent.
Since the early 1990s, the change in pension liabilities has been excluded from expense for the Fiscal Plan basis. It is typically a significant non-cash expense, is based on actuarial evaluations, assumptions and investment returns, and is largely not subject to policy decision-making.
Only the grants provided to Crown-controlled SUCH sector entities (school boards, universities and colleges, and health entities) are included in expense for the Fiscal Plan basis. This is currently considered most appropriate for budgeting as it is more relevant to decision-makers, who determine the amount of
a Accounting policy for recognizing transfers received for capital purposes changed effective April 1, 2012. In 2013-14: 1) $251 million in cash was received and a total of $306 million in cash was spent but reported as an increase to spent deferred capital contributions (DCC), rather than in revenue; 2) $139 million in previously-received transfers was removed from DCC and reported as revenue to match related assets’ amortization expense; 3) a $74 million negative prior-period adjustment to spent DCC was required. As a result, spent DCC increased by a net $93 million ($306 less $139 less $74). More details are in the following “Fiscal Plan to Consolidated Financial Statements” section, and Schedule 12, p. 67.
b Change in Net Assets from 2012-13 of ($101) million differs from $302 million deficit by a $201 million opening net assets adjustment (see Note 12, p. 50).
20 GovErnmEnt of albErta 2013–14 annual rEport#buildingAlberta
fiscal summaryRevenue
■■ On the Fiscal Plan basis, total 2013-14 revenue was $45.3 billion. The SUCH sector and Alberta Innovates corporations had additional “own-source” revenue of $4.2 billion, including:
■♦ $1.1 billion in post-secondary tuition fees;■♦ $0.9 billion in sales, rentals and fees, consisting
of revenue from parking operations, book stores, food services, facility rentals, equipment sales, professional services and various other sources;
■♦ $0.6 billion in donations, gifts and fundraising;■♦ $0.6 billion in fees, mainly in the health sector,
such as from WCB, non-Alberta patients or Emergency Medical Services, and school boards;
■♦ $0.4 billion in direct federal government transfers for advanced education and First Nation education programs;
■♦ $0.2 billion of opted-out school board property tax revenue;
■♦ $0.2 billion of investment income;■♦ $0.2 billion of Alberta Innovates revenue.
■■ Adding this revenue, and adjusting Fiscal Plan revenue for “deferred capital contributions” (a net decrease of $0.1 billion), the Consolidated Financial Statements total revenue is $49.4 billion.
Expense■■ On the Fiscal Plan basis, total 2013-14 expense
was $44.5 billion.■■ This includes capital grants provided to the
SUCH sector, which ultimately become capital investment. As noted, this expense must be removed and instead amortization expense of SUCH capital assets added. Total 2013-14 SUCH amortization and inventory consumption expense exceeded capital grants by $1.1 billion.
■■ In 2013-14 the SUCH sector and Alberta Innovates corporations had additional net expense of $3.3 billion. This reflects the spending of their own-source revenue, for example, on education services, the costs of goods sold or services provided for fees.
■■ Pension provisions of $0.7 billion are added.■■ Adding these increases, Consolidated Financial
Statements total expense is $49.7 billion.
grants and are evaluated for balancing the budget on this basis. The SUCH sector entities have varying degrees of autonomy to manage their budgets, once they receive the grants, to manage their assets and liabilities, and to raise some revenue themselves.
For the Consolidated Financial Statements basis, the SUCH sector has been included in government reporting since 2005-06. The broader reporting scope is relevant for the Consolidated Financial Statements since these entities are determined to be “controlled,” and how they spend the grants provided, their results of operations and their overall net value are important for transparency and accountability purposes.
Beginning in 2009-10, the SUCH sector has been reported in the Consolidated Financial Statements on a “line-by-line” basis. This means:
■■ First, capital grants provided to the SUCH sector, included in expense on the Fiscal Plan basis, are removed from expense, and become capital investment in “government-owned assets.” The costs of acquisition are expensed over time as the assets age (amortization expense).
■■ Second, the SUCH sector amortization of capital assets expense is added to expense.
■■ Third, government revenue is adjusted to “deferred capital contributions” accounting treatment.
■■ Finally, revenue, non-amortization expense, assets and liabilities, including deferred capital contributions, are directly added to government revenue, expense, assets and liabilities.
Also starting in 2009-10, the four Alberta Innovates corporations were excluded from the government reporting entity for Fiscal Plan purposes, to improve flexibility for multi-year research-grant recipients. The financial results are included on the line-by-line basis in the Consolidated Financial Statements.
Effective April 1, 2012, the government changed its accounting policy for recording transfers received for capital purposes and donated capital assets. Rather than being recorded as revenue when the cash is used for capital asset acquisition or the asset donated, a “deferred capital contribution” is recorded, similar to a liability, when cash or asset is received, and revenue is recognized over the related asset’s useful life. The Fiscal Plan basis will continue to record these as revenue when cash is spent or the asset is donated.
An explanation of the differences between the Fiscal Plan and Consolidated Financial Statements follows.
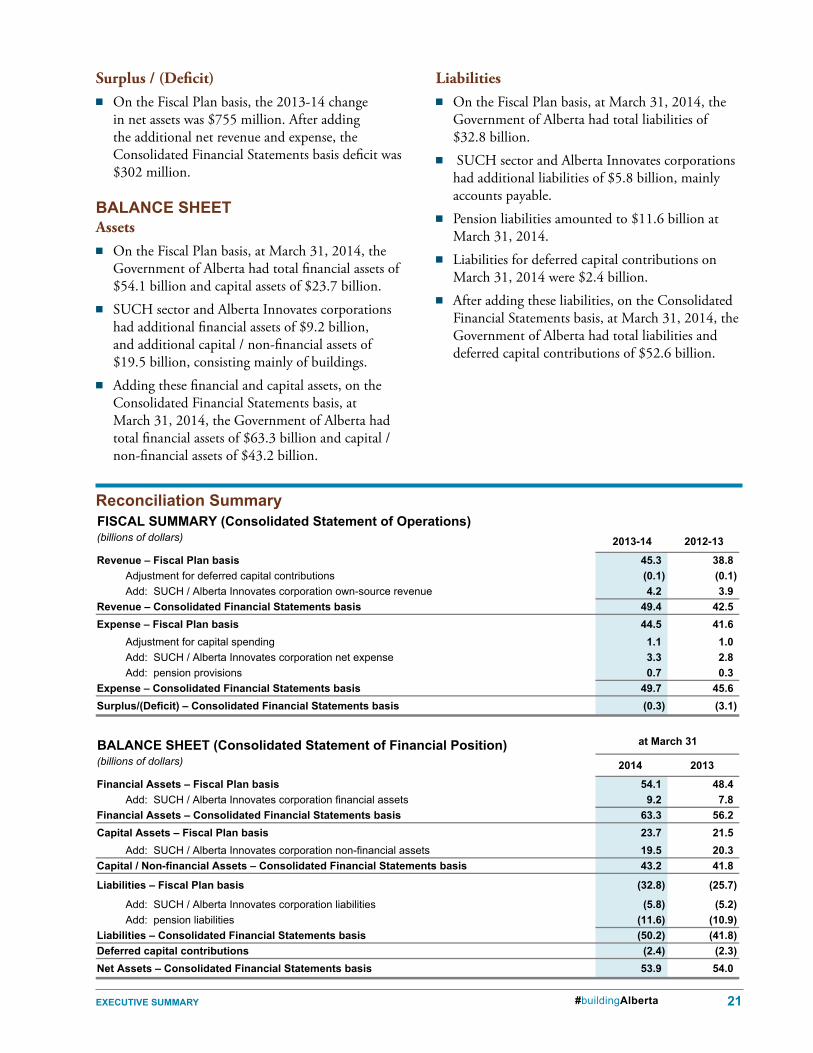
ExEcutivE summary 21#buildingAlberta
Liabilities■■ On the Fiscal Plan basis, at March 31, 2014, the
Government of Alberta had total liabilities of $32.8 billion.
■■ SUCH sector and Alberta Innovates corporations had additional liabilities of $5.8 billion, mainly accounts payable.
■■ Pension liabilities amounted to $11.6 billion at March 31, 2014.
■■ Liabilities for deferred capital contributions on March 31, 2014 were $2.4 billion.
■■ After adding these liabilities, on the Consolidated Financial Statements basis, at March 31, 2014, the Government of Alberta had total liabilities and deferred capital contributions of $52.6 billion.
reconciliation summary
2013-14_AR-Summ_T11_rs.pdf 2013-14 GoA Annual ReportExecutive Summary
Reconciliation Summary
FISCAL SUMMARY (Consolidated Statement of Operations)(billions of dollars) 2013-14 2012-13
Revenue – Fiscal Plan basis 45.3 38.8Adjustment for deferred capital contributions (0.1) (0.1)Add: SUCH / Alberta Innovates corporation own-source revenue 4.2 3.9
Revenue – Consolidated Financial Statements basis 49.4 42.5Expense – Fiscal Plan basis 44.5 41.6
Adjustment for capital spending 1.1 1.0Add: SUCH / Alberta Innovates corporation net expense 3.3 2.8Add: pension provisions 0.7 0.3
Expense – Consolidated Financial Statements basis 49.7 45.6Surplus/(Deficit) – Consolidated Financial Statements basis (0.3) (3.1)
BALANCE SHEET (Consolidated Statement of Financial Position)(billions of dollars) 2014 2013
Financial Assets – Fiscal Plan basis 54.1 48.4Add: SUCH / Alberta Innovates corporation financial assets 9.2 7.8
Financial Assets – Consolidated Financial Statements basis 63.3 56.2Capital Assets – Fiscal Plan basis 23.7 21.5
Add: SUCH / Alberta Innovates corporation non-financial assets 19.5 20.3Capital / Non-financial Assets – Consolidated Financial Statements basis 43.2 41.8
Liabilities – Fiscal Plan basis (32.8) (25.7)
Add: SUCH / Alberta Innovates corporation liabilities (5.8) (5.2)Add: pension liabilities (11.6) (10.9)
Liabilities – Consolidated Financial Statements basis (50.2) (41.8)Deferred capital contributions (2.4) (2.3)Net Assets – Consolidated Financial Statements basis 53.9 54.0
2013‐14_AR‐Summ_T11_rs.pdf
at March 31
W:\Obm.publns\OBM.PUBLNS-2014-15\2013-14_GoA_AnnReport\13-14_GoA-AR_Summary\source_documents\2013-14_Executive Summary_Tables.xlsx /T12. Addendum Table 6/18/2014 / 2:22 PM
Surplus / (Deficit)■■ On the Fiscal Plan basis, the 2013-14 change
in net assets was $755 million. After adding the additional net revenue and expense, the Consolidated Financial Statements basis deficit was $302 million.
balancE sHEEtAssets
■■ On the Fiscal Plan basis, at March 31, 2014, the Government of Alberta had total financial assets of $54.1 billion and capital assets of $23.7 billion.
■■ SUCH sector and Alberta Innovates corporations had additional financial assets of $9.2 billion, and additional capital / non-financial assets of $19.5 billion, consisting mainly of buildings.
■■ Adding these financial and capital assets, on the Consolidated Financial Statements basis, at March 31, 2014, the Government of Alberta had total financial assets of $63.3 billion and capital / non-financial assets of $43.2 billion.
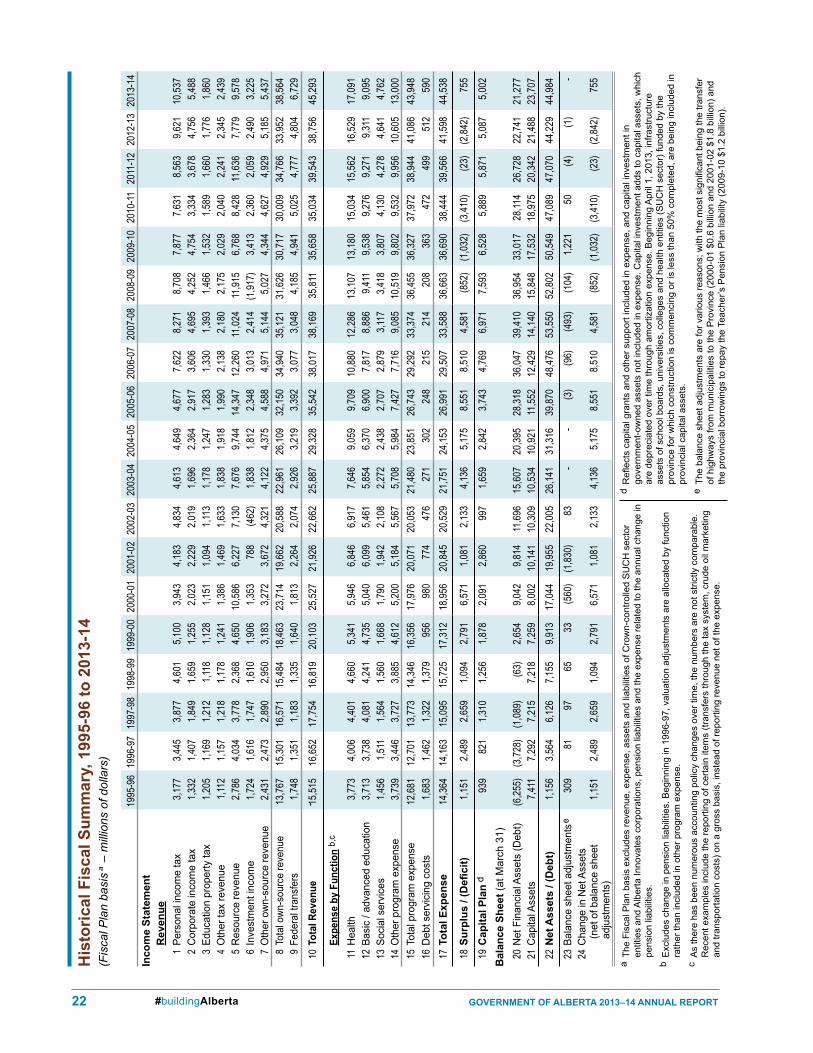
22 Government of alberta 2013–14 annual report#buildingAlberta
1995
-96
1996
-97
1997
-98
1998
-99
1999
-00
2000
-01
2001
-02
2002
-03
2003
-04
2004
-05
2005
-06
2006
-07
2007
-08
2008
-09
2009
-10
2010
-1120
11-1
220
12-1
320
13-1
4in
com
e St
atem
ent
rev
enue
1Pe
rson
al in
com
e ta
x3,1
77
3,445
3,8
77
4,601
5,1
00
3,943
4,1
83
4,834
4,6
13
4,649
4,6
77
7,622
8,2
71
8,708
7,8
77
7,631
8,5
63
9,621
10
,537
2C
orpo
rate
inco
me
tax
1,332
1,4
07
1,849
1,6
59
1,255
2,0
23
2,229
2,0
19
1,696
2,3
64
2,917
3,6
06
4,695
4,2
52
4,754
3,3
34
3,678
4,7
56
5,488
3
Educ
atio
n pr
oper
ty ta
x1,2
05
1,169
1,2
12
1,118
1,1
28
1,151
1,0
94
1,113
1,1
78
1,247
1,2
83
1,330
1,3
93
1,466
1,5
32
1,589
1,6
60
1,776
1,8
60
4O
ther
tax
reve
nue
1,112
1,1
57
1,218
1,1
78
1,241
1,3
86
1,469
1,6
33
1,838
1,9
18
1,990
2,1
38
2,180
2,1
75
2,029
2,0
40
2,241
2,3
45
2,439
5
Res
ourc
e re
venu
e2,7
86
4,034
3,7
78
2,368
4,6
50
10,58
6 6,2
27
7,130
7,6
76
9,744
14
,347
12,26
0 11
,024
11,91
5 6,7
68
8,428
11
,636
7,779
9,5
78
6In
vest
men
t inc
ome
1,724
1,6
16
1,747
1,6
10
1,906
1,3
53
788
(462
)1,8
38
1,812
2,3
48
3,013
2,4
14
(1,91
7)3,4
13
2,360
2,0
59
2,490
3,2
25
7O
ther
ow
n-so
urce
reve
nue
2,431
2,4
73
2,890
2,9
50
3,183
3,2
72
3,672
4,3
21
4,122
4,3
75
4,588
4,9
71
5,144
5,0
27
4,344
4,6
27
4,929
5,1
85
5,437
8
Tota
l own
-sou
rce
reve
nue
13,76
7 15
,301
16,57
1 15
,484
18,46
3 23
,714
19,66
2 20
,588
22,96
1 26
,109
32,15
0 34
,940
35,12
1 31
,626
30,71
7 30
,009
34,76
6 33
,952
38,56
4 9
Fede
ral t
rans
fers
1,748
1,3
51
1,183
1,3
35
1,640
1,8
13
2,264
2,0
74
2,926
3,2
19
3,392
3,0
77
3,048
4,1
85
4,941
5,0
25
4,777
4,8
04
6,729
10
tota
l rev
enue
15,51
5 16
,652
17,75
4 16
,819
20,10
3 25
,527
21,92
6 22
,662
25,88
7 29
,328
35,54
2 38
,017
38,16
9 35
,811
35,65
8 35
,034
39,54
3 38
,756
45,29
3
expe
nse
by f
unct
ion
b,c
11H
ealth
3,773
4,0
06
4,401
4,6
60
5,341
5,9
46
6,846
6,9
17
7,646
9,0
59
9,709
10
,880
12,28
6 13
,107
13,18
0 15
,034
15,56
2 16
,529
17,09
1 12
Basi
c / a
dvan
ced
educ
atio
n3,7
13
3,738
4,0
81
4,241
4,7
35
5,040
6,0
99
5,461
5,8
54
6,370
6,9
00
7,817
8,8
86
9,411
9,5
38
9,276
9,2
71
9,311
9,0
95
13So
cial
ser
vice
s1,4
56
1,511
1,5
64
1,560
1,6
68
1,790
1,9
42
2,108
2,2
72
2,438
2,7
07
2,879
3,1
17
3,418
3,8
07
4,130
4,2
78
4,641
4,7
62
14O
ther
pro
gram
exp
ense
3,739
3,4
46
3,727
3,8
85
4,612
5,2
00
5,184
5,5
67
5,708
5,9
84
7,427
7,7
16
9,085
10
,519
9,802
9,5
32
9,956
10
,605
13,00
0 15
Tota
l pro
gram
exp
ense
12,68
1 12
,701
13,77
3 14
,346
16,35
6 17
,976
20,07
1 20
,053
21,48
0 23
,851
26,74
3 29
,292
33,37
4 36
,455
36,32
7 37
,972
38,94
4 41
,086
43,94
8 16
Deb
t ser
vici
ng c
osts
1,6
83
1,462
1,3
22
1,379
95
6 98
0 77
4 47
6 27
1 30
2 24
8 21
5 21
4 20
8 36
3 47
2 49
9 51
2 59
0 17
tota
l exp
ense
14,36
4 14
,163
15,09
5 15
,725
17,31
2 18
,956
20,84
5 20
,529
21,75
1 24
,153
26,99
1 29
,507
33,58
8 36
,663
36,69
0 38
,444
39,56
6 41
,598
44,53
8
18Su
rplu
s / (
Defi
cit)
1,151
2,4
89
2,659
1,0
94
2,791
6,5
71
1,081
2,1
33
4,136
5,1
75
8,551
8,5
10
4,581
(8
52)
(1,03
2)(3
,410)
(23)
(2,84
2)75
5
19c
apita
l pla
n d
939
821
1,310
1,2
56
1,878
2,0
91
2,860
99
7 1,6
59
2,842
3,7
43
4,769
6,9
71
7,593
6,5
28
5,889
5,8
71
5,087
5,0
02
bal
ance
She
et (a
t Mar
ch 3
1)20
Net
Fin
anci
al A
sset
s (D
ebt)
(6,25
5)(3
,728)
(1,08
9)(6
3)2,6
54
9,042
9,8
14
11,69
6 15
,607
20,39
5 28
,318
36,04
7 39
,410
36,95
4 33
,017
28,11
4 26
,728
22,74
1 21
,277
21C
apita
l Ass
ets
7,411
7,2
92
7,215
7,2
18
7,259
8,0
02
10,14
1 10
,309
10,53
4 10
,921
11,55
2 12
,429
14,14
0 15
,848
17,53
2 18
,975
20,34
2 21
,488
23,70
7 22
Net
Ass
ets
/ (D
ebt)
1,156
3,5
64
6,126
7,1
55
9,913
17
,044
19,95
5 22
,005
26,14
1 31
,316
39,87
0 48
,476
53,55
0 52
,802
50,54
9 47
,089
47,07
0 44
,229
44,98
4 23
Bala
nce
shee
t adj
ustm
ents
e30
9 81
97
65
33
(5
60)
(1,83
0)83
-
- (3
)(9
6)(4
93)
(104
)1,2
21
50
(4)
(1)
- 24
Cha
nge
in N
et A
sset
s
(net
of b
alan
ce s
heet
ad
just
men
ts)
1,151
2,4
89
2,659
1,0
94
2,791
6,5
71
1,081
2,1
33
4,136
5,1
75
8,551
8,5
10
4,581
(8
52)
(1,03
2)(3
,410)
(23)
(2,84
2)75
5
His
toric
al f
isca
l Sum
mar
y, 1
995-
96 to
201
3-14
(F
isca
l Pla
n ba
sis a –
mill
ions
of d
olla
rs)
a T
he F
isca
l Pla
n ba
sis
excl
udes
reve
nue,
exp
ense
, ass
ets
and
liabi
litie
s of
Cro
wn-
cont
rolle
d S
UC
H s
ecto
r en
titie
s an
d A
lber
ta In
nova
tes
corp
orat
ions
, pen
sion
liab
ilitie
s an
d th
e ex
pens
e re
late
d to
the
annu
al c
hang
e in
pe
nsio
n lia
bilit
ies.
b E
xclu
des
chan
ge in
pen
sion
liab
ilitie
s. B
egin
ning
in 1
996-
97, v
alua
tion
adju
stm
ents
are
allo
cate
d by
func
tion
rath
er th
an in
clud
ed in
oth
er p
rogr
am e
xpen
se.
c A
s th
ere
has
been
num
erou
s ac
coun
ting
polic
y ch
ange
s ov
er ti
me,
the
num
bers
are
not
stri
ctly
com
para
ble.
R
ecen
t exa
mpl
es in
clud
e th
e re
porti
ng o
f cer
tain
item
s (tr
ansf
ers
thro
ugh
the
tax
syst
em, c
rude
oil
mar
ketin
g an
d tra
nspo
rtatio
n co
sts)
on
a gr
oss
basi
s, in
stea
d of
repo
rting
reve
nue
net o
f the
exp
ense
.
d R
eflec
ts c
apita
l gra
nts
and
othe
r sup
port
incl
uded
in e
xpen
se, a
nd c
apita
l inv
estm
ent i
n go
vern
men
t-ow
ned
asse
ts n
ot in
clud
ed in
exp
ense
. Cap
ital i
nves
tmen
t add
s to
cap
ital a
sset
s, w
hich
ar
e de
prec
iate
d ov
er ti
me
thro
ugh
amor
tizat
ion
expe
nse.
Beg
inni
ng A
pril
1, 2
013,
infra
stru
ctur
e as
sets
of s
choo
l boa
rds,
uni
vers
ities
, col
lege
s an
d he
alth
ent
ities
(SU
CH
sec
tor)
fund
ed b
y th
e pr
ovin
ce fo
r whi
ch c
onst
ruct
ion
is c
omm
enci
ng o
r is
less
than
50%
com
plet
ed, a
re b
eing
incl
uded
in
prov
inci
al c
apita
l ass
ets.
e T
he b
alan
ce s
heet
adj
ustm
ents
are
for v
ario
us re
ason
s; w
ith th
e m
ost s
igni
fican
t bei
ng th
e tra
nsfe
r of
hig
hway
s fro
m m
unic
ipal
ities
to th
e P
rovi
nce
(200
0-01
$0.
6 bi
llion
and
200
1-02
$1.
8 bi
llion
) and
th
e pr
ovin
cial
bor
row
ings
to re
pay
the
Teac
her’s
Pen
sion
Pla
n lia
bilit
y (2
009-
10 $
1.2
billi
on).