Embed Size (px)
Citation preview

EXECUTIVE SUMMARY
General NABARD has been preparing Potential Linked Credit Plan (PLP) for the district annually which forms the basis of the Annual Credit Plan for the banks operating in the district. The Potential Linked Credit Plan (PLP) of the district assesses in financial terms, taking into account the present and emerging potentials for various activities in Priority Sector, infrastructure facilities and other support services existing/ planned, both by Government and Non-Government agencies. Developments in the area of Credit Planning
PLP is a comprehensive documentation of the potential of economic activities in the district. It gives block-wise physical and financial estimates for the economic activities which can be taken up for development. The estimates are worked out for the total financial outlays and net bank credit. The exercise is based on the data about the resources endowments, ongoing Government schemes and the financial support from the banks for the identified activities. Along with the estimated potential and credit required for achieving the potential, the infrastructure available and gaps in infrastructure hampering utilisation of the potentials are also assessed to make it a holistic document. As per the instructions issued by Reserve Bank of India, the Annual Credit Plans (ACP) will be based on the PLP prepared by NABARD.
RBI vide its Circular No RPCD CO LBS BC No 12/02.01.001/2012-13 dated 11 May 2013 extended Lead Bank Scheme to Mumbai Suburban District with Bank of India as Lead Bank of the district. Accordingly, both Bank of India and NABARD has also posted a District Development Manager (R) for the Mumbai Suburban from 2014-15 and started the process of preparing PLP for the District from the year 2015-16. Since, there is no scope for agriculture and allied activity in Mumbai Suburban District the scope of PLP is limited to Planning, Reviewing and Monitoring of Fishery, MSME, and Housing, Education and other Priority Sector. As per latest RBI guidelines on priority sector, Export Credit and Social Infrastructure is also included in PLP. This PLP is prepared on the basis of Achievements of ACP 2014-15 and estimated ACP for 2015-16.
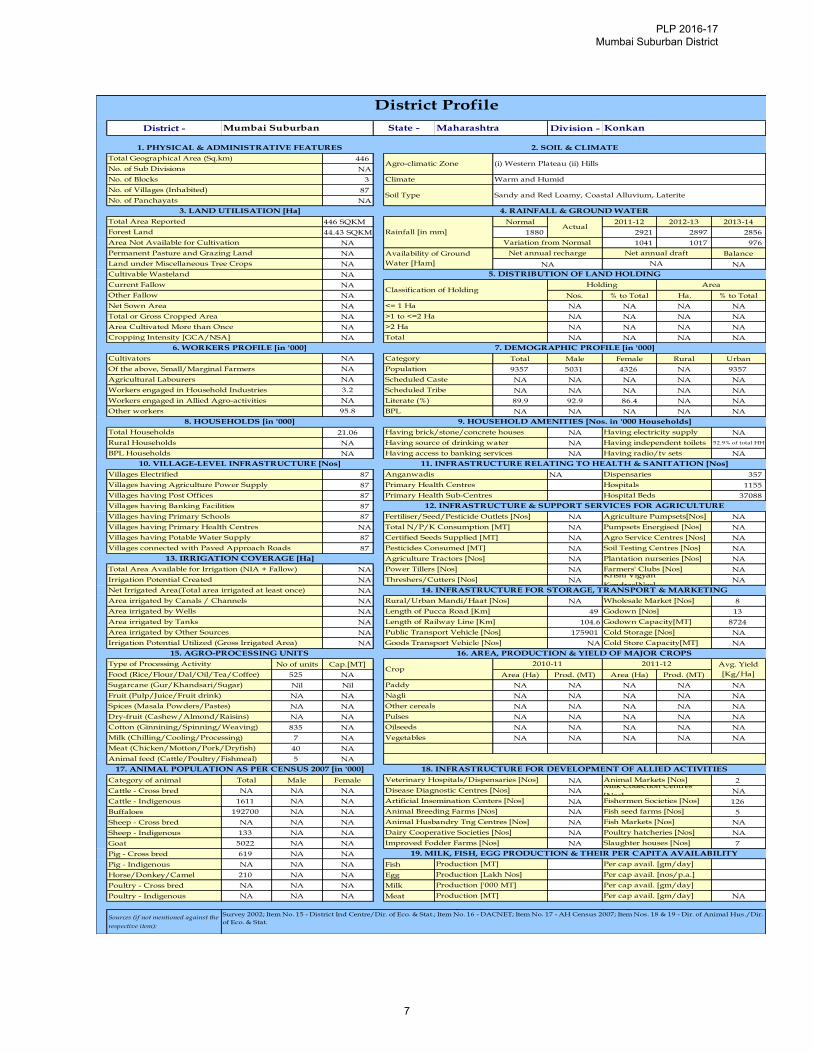
District Profile: Mumbai Suburban district is declared independent district w.e.f. 1 October 1990 as a consequent of the bifurcation of the Grater Mumbai into two revenue district namely Mumbai City and Mumbai Suburban. The district is spread over from Bandra to Dahisar, from Kurla (Chuna bhatti) to Mulund and from Kurla to Mankhurd /Trombay Creek including 87 villages in three talukas /blocks i.e. Bandra, Andheri and Borivali. The district is having 431.09 sqkm total geographical area, of which 44.43 sqkm is covered under forests. Mumbai is known as the Financial Capital of India and the predominant economic activities prevalent in the district are Service, Corporate Offices, Banking, Industries, Tourism, Hotels and Restaurants, Production of salt and Marine Fisheries etc. No crop cultivation is being undertaken in the district, however, the District is huge market for agriculture produce as well of Horticulture Crops.
PLP 2016-17 Mumbai Suburban District
1

Potential for bank credit
An aggregate potential of `8741280.00 lakh has been projected for Mumbai Suburban district for the year 2016-17, registering a growth of 60% over that of the previous year. The growth of 60% is mainly due to inclusion of Export Credit in Priority Sector by RBI. Financing of MSMEs, housing and Exports Credit are the main sectors identified in the PLP.
Banking Sector
Mumbai Suburban District is well banked with 1000+ branches of Commercial Banks, Private Sector Bank, Foreign Banks, State Coop Bank, Mumbai DCCB and Urban Coop Banks. Almost all CBs have their Head Offices in Mumbai. All branches are in Metro Area and cater to needs of urban population and Micro, Small, Medium and Large Industries, business, etc.
Potential under Major Sectors:
Fisheries
Fishery activities are prominent in Koliwadas at Marve, Oshiwara, Borivali and other coastal areas. NABARD has financed fish jetties under RIDF and mechanized and non-mechanized fisheries vessels can be financed in these areas after proper survey. Cold Storages, Refrigerated Vans, Ice Depots, Specialized Transport Vehicles are required for development of this sector. The projection for fishery for the year 2016-17 is estimated at `26617.00 lakh.
Micro Small Medium Enterprises (MSMEs)
The MSMES sector is the main employment provider and important sector in Mumbai Suburban District. Empowered Committee on MSMEs of RBI has expressed concern over sick and migrated units of MSMEs. Directorate of Industries needs to prepare comprehensive data base, separately for Mumbai City District and Mumbai Suburb Districts. As the Lead Bank Scheme has been recently extended to this District, there is need to improve reporting system by banks about this sector. The projections for the year 2016-17 are estimated at `4212438.00 lakh.
Export Credit
As per revised Priority Sector guidelines of Reserve Bank of India, Export Credit has been included in Priority Sector lending. Almost all major banks have their corporate branches in Mumbai, which caters to needs of export credit. Since, Mumbai is major hub and port, majority of commerce in diamonds, gold ornaments, drugs / chemicals, clothes, garments, auto-components, raw steel, agri produce engineering goods etc. take place. Export Credit Guarantee Corporation of India is providing guarantee to banks for export credit. The Mumbai Branch of ECGC has collected insurance premium to the
PLP 2016-17Mumbai Suburban District
2

tune of `225 crore as on 31.03.2015 @ 0.59% of credit extended by banks for export. Taking into consideration the premium collected from ECGC, opportunities and initiatives like ‘Make in India’, ‘Skill India’, etc., the export credit potential for all commodities together from Mumbai for the year 2016-17 is estimated at `1800000.00 lakh.
Education Mumbai being the financial capital provides lots of opportunities for education. It attracts students not only from India but from abroad also. Since, the district has a very high literacy rate and as there are abundant opportunities for acquiring higher/tech education, it provides good scope by education loans for banks. The potential for Education loan is estimated for the year 2016-17 at ` 33500.00 lakh.
Housing
The demand for housing is always on rise. With research and innovations in the sector, the rising demand can be met by re-development of old housing colonies, identifying vacant land for construction, redevelopment of slums, etc. Taking into account the status of infrastructure available for the development of the sector, the goals set under various schemes of the Government and the past trend in flow of ground level credit for this sector, the physical and financial projections assessed for the year 2016-17 is `19600.00 lakh.
Renewable Energy Due to increasing population of the city, demand for energy is always on the rise. There is scope for tapping renewable energy like solar, energy from waste material, etc. The roop tops of housing societies in the city provide scope for installation of solar photovoltaic panals for electricity generation and solar water heaters for domestic consumptions, BMCC is responsible for collection of garbage (about 600 MT per day) and can set up projects for energy generation from it. Taking into consideration forgoing, the potential is worked out at `1040.00 lakh
xxxxxxoooxxxxxx
PLP 2016-17 Mumbai Suburban District
3

Appendix A to Annexure 1
BROAD SECTOR-WISE PLP PROJECTIONS (2016-17) ` lakh
Sr. No Particulars PLP Projections 2016-17
A Farm Credit
i) Crop Production, Maintenance and Marketing 0.00
ii) Term Loan for agriculture and allied activities (fishery) 26617.50
Sub Total 26617.50
B Agriculture Infrastructure 0.00
C Ancillary activities 171000.00
I Credit Potential for Agriculture (A+B+C) 197617.50
II Micro Small and Medium Enterprises 4212438.00
III Export Credit 1800000.00
IV Education 33500.00
V Housing 19600.00
VI Renewable Energy 1040.00
VII Others 176250.00
VIII Social Infrastructure involving Bank Credit 14176.00
Total Priority Sector (I to VIII) 6454621.50
PLP 2016-17 Mumbai Suburban District
4

Appendix B to Annexure 1 Summary of Sector / Sub-sector wise PLP projections - 2016-17
(` lakh) Sr. No. Particulars PLP
Projections I Credit Potential for Agriculture
A Farm Credit
i Crop Production, Maintenance and Marketing 0.00 ii Water Resources 0.00
iii Farm Mechanisation 0.00
iv Plantation and Horticulture (including sericulture) 0.00
v Forestry and Waste Land Development 0.00
vi Animal Husbandry – Dairy 0.00 vii Animal Husbandry – Poultry 0.00
viii Animal Husbandry – Sheep, Goat, Piggery, etc. 0.00
ix Fisheries (Marine, Inland, Brackish water) 26617.50
x Others – Bullock, Bullock cart, etc. 0.00
Sub Total 26617.50
B Agriculture Infrastructure
i Construction of storage facilities (Warehouses, Market yards, Godowns, Silos, Cold storage units/ Cold storage chains)
0.00
ii Land development, Soil conservation, Watershed development 0.00
iii Others (Tissue culture, Agri bio-technology, Seed production, Bio pesticides/ fertilizers, Vermin composting)
0.00
Sub Total 0.00 C Ancillary activities
i Food and Agro processing 171000.00
ii Others (Loans to Cooperative Societies of farmers for disposing of their produce, Agri Clinics/ Agri Business Centres, Loans to PACS / FSS/ LAMPS, Loans to MFIs for on lending)
0.00
Sub Total 171000.00
Total Agriculture 197617.50 II Micro, Small and Medium Enterprises
i MSME – Working capital 702073.00
ii MSME – Investment credit 3510365.00
Total MSME 4212438.00
III Export Credit 1800000.00
IV Education 33500.00 V Housing 19600.00 VI Renewable Energy 1040.00
VII Others (Loans to SHGs/ JLGs, loans to distressed persons to prepay non-institutional lenders, PMJDY
176250.00
VIII Social Infrastructure involving bank credit 14176.00
Total Priority Sector 6454621.50
PLP 2016-17 Mumbai Suburban District
5

PLP 2016-17 Mumbai Suburban District
6
District - Division -
446
NA
3
87
NA
446 SQKM Normal 2011-12 2012-13 2013-14
44.43 SQKM 1880 2921 2897 2856
NA 1041 1017 976
NA Balance
NA NA
NA
NA
NA Nos. % to Total Ha. % to Total
NA NA NA NA NA
NA NA NA NA NA
NA NA NA NA NA
NA NA NA NA NA
NA Total Male Female Rural Urban
NA 9357 5031 4326 NA 9357
NA NA NA NA NA NA
3.2 NA NA NA NA NA
NA 89.9 92.9 86.4 NA NA
95.8 NA NA NA NA NA
21.06 NA NA
NA NA 52.9% of total HH
NA NA NA
87 NA 357
87 1155
87 37088
87
87 NA NA
NA NA NA
87 NA NA
87 NA NA
NA NA
NA NA NA
NA NA NA
NA
NA NA 8
NA 49 13
NA 104.6 8724
NA 175901 NA
NA NA NA
No of units Cap.[MT]
525 NA Area (Ha) Prod. (MT) Area (Ha) Prod. (MT)
Nil Nil NA NA NA NA NA
NA NA NA NA NA NA NA
NA NA NA NA NA NA NA
NA NA NA NA NA NA NA
835 NA NA NA NA NA NA
7 NA NA NA NA NA NA
40 NA
5 NA
Category of animal Total Male Female NA 2
Cattle - Cross bred NA NA NA NA NA
Cattle - Indigenous 1611 NA NA NA 126
Buffaloes 192700 NA NA NA 5
Sheep - Cross bred NA NA NA NA NA
Sheep - Indigenous 133 NA NA NA NA
Goat 5022 NA NA NA 7
Pig - Cross bred 619 NA NA
Pig - Indigenous NA NA NA Fish
Horse/Donkey/Camel 210 NA NA Egg
Poultry - Cross bred NA NA NA Milk
Poultry - Indigenous NA NA NA Meat NA
District Profile
Mumbai Suburban State - Maharashtra Konkan
1. PHYSICAL & ADMINISTRATIVE FEATURES 2. SOIL & CLIMATE
Total Geographical Area (Sq.km)Agro-climatic Zone (i) Western Plateau (ii) Hills
No. of Sub Divisions
No. of Blocks Climate Warm and Humid
No. of Villages (Inhabited)Soil Type Sandy and Red Loamy, Coastal Alluvium, Laterite
No. of Panchayats
3. LAND UTILISATION [Ha] 4. RAINFALL & GROUND WATER
Total Area Reported
Rainfall [in mm]Actual
Forest Land
Area Not Available for Cultivation Variation from Normal
Permanent Pasture and Grazing Land Availability of Ground
Water [Ham]
Net annual recharge Net annual draft
Land under Miscellaneous Tree Crops NA NA
Cultivable Wasteland 5. DISTRIBUTION OF LAND HOLDING
Current FallowClassification of Holding
Holding Area
Other Fallow
Net Sown Area <= 1 Ha
Total or Gross Cropped Area >1 to <=2 Ha
Area Cultivated More than Once >2 Ha
Cropping Intensity [GCA/NSA] Total
6. WORKERS PROFILE [in '000] 7. DEMOGRAPHIC PROFILE [in '000]
Cultivators Category
Of the above, Small/Marginal Farmers Population
Agricultural Labourers Scheduled Caste
Workers engaged in Household Industries Scheduled Tribe
Workers engaged in Allied Agro-activities Literate (%)
Other workers BPL
8. HOUSEHOLDS [in '000] 9. HOUSEHOLD AMENITIES [Nos. in '000 Households]
Total Households Having brick/stone/concrete houses Having electricity supply
Rural Households Having source of drinking water Having independent toilets
BPL Households Having access to banking services Having radio/tv sets
10. VILLAGE-LEVEL INFRASTRUCTURE [Nos] 11. INFRASTRUCTURE RELATING TO HEALTH & SANITATION [Nos]
Villages Electrified Anganwadis Dispensaries
Villages having Agriculture Power Supply Primary Health Centres Hospitals
Villages having Post Offices Primary Health Sub-Centres Hospital Beds
Villages having Banking Facilities 12. INFRASTRUCTURE & SUPPORT SERVICES FOR AGRICULTURE
Villages having Primary Schools Fertiliser/Seed/Pesticide Outlets [Nos] Agriculture Pumpsets[Nos]
Villages having Primary Health Centres Total N/P/K Consumption [MT] Pumpsets Energised [Nos]
Villages having Potable Water Supply Certified Seeds Supplied [MT] Agro Service Centres [Nos]
Villages connected with Paved Approach Roads Pesticides Consumed [MT] Soil Testing Centres [Nos]
13. IRRIGATION COVERAGE [Ha] Agriculture Tractors [Nos] Plantation nurseries [Nos]
Total Area Available for Irrigation (NIA + Fallow) Power Tillers [Nos] Farmers' Clubs [Nos]
Irrigation Potential Created Threshers/Cutters [Nos]Krishi Vigyan
Kendras[Nos]Net Irrigated Area(Total area irrigated at least once) 14. INFRASTRUCTURE FOR STORAGE, TRANSPORT & MARKETING
Area irrigated by Canals / Channels Rural/Urban Mandi/Haat [Nos] Wholesale Market [Nos]
Area irrigated by Wells Length of Pucca Road [Km] Godown [Nos]
Area irrigated by Tanks Length of Railway Line [Km] Godown Capacity[MT]
Area irrigated by Other Sources Public Transport Vehicle [Nos] Cold Storage [Nos]
Irrigation Potential Utilized (Gross Irrigated Area) Goods Transport Vehicle [Nos] Cold Store Capacity[MT]
15. AGRO-PROCESSING UNITS 16. AREA, PRODUCTION & YIELD OF MAJOR CROPS
Type of Processing ActivityCrop
2010-11 2011-12 Avg. Yield
[Kg/Ha]Food (Rice/Flour/Dal/Oil/Tea/Coffee)
Sugarcane (Gur/Khandsari/Sugar) Paddy
Fruit (Pulp/Juice/Fruit drink) Nagli
Spices (Masala Powders/Pastes) Other cereals
Dry-fruit (Cashew/Almond/Raisins) Pulses
Cotton (Ginnining/Spinning/Weaving) Oilseeds
Milk (Chilling/Cooling/Processing) Vegetables
Meat (Chicken/Motton/Pork/Dryfish)
Animal feed (Cattle/Poultry/Fishmeal)
17. ANIMAL POPULATION AS PER CENSUS 2007 [in '000] 18. INFRASTRUCTURE FOR DEVELOPMENT OF ALLIED ACTIVITIES
Veterinary Hospitals/Dispensaries [Nos] Animal Markets [Nos]
Disease Diagnostic Centres [Nos]Milk Collection Centres
[Nos]Artificial Insemination Centers [Nos] Fishermen Societies [Nos]
Animal Breeding Farms [Nos] Fish seed farms [Nos]
Animal Husbandry Tng Centres [Nos] Fish Markets [Nos]
Dairy Cooperative Societies [Nos] Poultry hatcheries [Nos]
Improved Fodder Farms [Nos] Slaughter houses [Nos]
19. MILK, FISH, EGG PRODUCTION & THEIR PER CAPITA AVAILABILITY
Production [MT] Per cap avail. [gm/day]
Production [Lakh Nos] Per cap avail. [nos/p.a.]
Production ['000 MT] Per cap avail. [gm/day]
Production [MT] Per cap avail. [gm/day]
Sources (if not mentioned against the
respective item):
Item Nos. 1, 6, 7, 9 & 10 - Census 2011; Item Nos. 2, 3, 5, 12, 13 & 14 - Dept. of Agr/Dir. of Eco. & Stat.; Item No. 4 - Dept. of Agr./Water Resources; Item No. 8 - BPL
Survey 2002; Item No. 15 - District Ind Centre/Dir. of Eco. & Stat.; Item No. 16 - DACNET; Item No. 17 - AH Census 2007; Item Nos. 18 & 19 - Dir. of Animal Hus./Dir.
of Eco. & Stat.
PLP 2016-17 Mumbai Suburban District
7

District - State -
Total Rural Semi-urban Urban mFIs/mFOs SHGs/JLGs BCs/BFs Villages Households
Commercial Banks 22 802 802 - - - 9 56
Regional Rural Bank - - -
District Central Coop. Bank - - - 21
Coop. Agr. & Rural Dev. Bank - - - - - - - - - -
Primary Agr. Coop. Society - - - - - - - 4 186
Others 15 378 - - 378 - - - - -
All Agencies 37 1180 1180 - - - 2 94
31-Mar-13 31-Mar-14 31-Mar-15 Growth(%) Share(%) 31-Mar-12 31-Mar-14 31-Mar-14 Growth(%) Share(%)
Commercial Banks NA NA NA NA NA NA 8669750 16104572 12.6 82.3
Regional Rural Bank NA NA NA NA NA NA
Cooperative Banks NA NA NA NA NA NA
Others - - - - - NA NA 11901870 NA 18
All Agencies - - - - - NA 28006442 100
31-Mar-13 31-Mar-14 31-Mar-15 Growth(%) Share(%) 31-Mar-13 31-Mar-14 31-Mar-15 Growth(%) Share(%)
Commercial Banks NA NA NA - - NA 10199691
Regional Rural Bank NA NA NA - NA
Cooperative Banks NA NA NA - NA
Others - - - - - 2183522
All Agencies - - - - - 12383213
31-Mar-13 31-Mar-14 31-Mar-15 Deposit Credit Deposit Credit
Commercial Banks 32 103 63 NA NA NA NA
Regional Rural Bank NA NA NA NA NA NA NA
Cooperative Banks NA NA NA NA NA NA NA
Others 39 73 51 NA NA NA NA
All Agencies 32 73 44 NA NA NA NA
Commercial Banks
Regional Rural Bank
Cooperative Banks
Others
All Agencies
2012-13
Commercial Banks
Regional Rural Bank
Cooperative Banks
Others
All Agencies
2012-13
Crop Loan NA NA
Term Loan (Agr)
Total Agri. Credit
Non-Farm Sector
Other Priority Sector
Total Priority Sector
Commercial Banks NA NA NA NA NA NA NA NA NA NA
Regional Rural Bank NA NA NA NA NA NA NA NA NA NA
Cooperative Banks NA NA NA NA NA NA NA NA NA NA
Others NA NA NA NA NA NA NA NA NA NA
All Agencies NA NA NA NA NA NA NA NA NA NA
Sources : Lead Bank & SLBC
Banking Profile
Mumbai Maharashtra Lead Bank - Bank of India
1. NETWORK & OUTREACH (As on 31/03/2015)
AgencyNo. of
Banks/Soc.
No. of Branches No. of non-formal agencies associated Per Branch Outreach
2. DEPOSITS OUTSTANDING
AgencyNo. of accounts Amount of Deposit [`'000]
3. LOANS & ADVANCES OUTSTANDING
AgencyNo. of accounts Amount of Loan [`.'000]
4. CD-RATIO 5. PERFORMANCE UNDER FINANCIAL INCLUSION (No. of A/cs)
AgencyCD Ratio
AgencyDuring 2014-15 Cumulative
Commercial Banks
Regional Rural Bank
Cooperative Banks
Others
All Agencies
6. PERFORMANCE TO FULFILL NATIONAL GOALS (As on 31/03/2015)
Agency
Priority Sector Loans Loans to Agr. Sector Loans to Weaker Sections Loans under DRI Scheme Loans to Women
Amount
[`'000]
% to Total
Loans
Amount
[`'000]
% to Total
Loans
Amount
[`'000]
% to Total
Loans
Amount
[`'000]
% to Total
Loans
Amount
[`'000]
% to Total
Loans
7. AGENCY-WISE PERFORMANCE UNDER ANNUAL CREDIT PLANS
Agency
2013-14 2014-15 Average
Ach[%] in
last 3 years
Target
[`'000]
Ach'ment
[` '000]
Ach'ment
[%]
Target
[`'000]
Ach'ment
[` '000]
Ach'ment
[%]
Target
[`'000]
Ach'ment
[` '000]
Ach'ment
[%]
8. SECTOR-WISE PERFORMANCE UNDER ANNUAL CREDIT PLANS
Broad Sector
2013-14 2014-15 Average
Ach[%] in
last 3 years
Target
[`'000]
Ach'ment
[` '000]
Ach'ment
[%]
Target
[`'000]
Ach'ment
[` '000]
Ach'ment
[%]
Target
[`'000]
Ach'ment
[` '000]
Ach'ment
[%]
9. RECOVERY POSITION
Agency
2012-13 2013-14 2014-15 Average
Rec. [%] in
last 3 years
Demand [`
'000]
Recovery [`
'000]
Recovery
[%]
Demand [`
'000]
Recovery [`
'000]
Recovery
[%]
Demand [`
'000]
Recovery [`
'000]
Recovery
[%]
PLP 2016-17 Mumbai Suburban District
9