Embed Size (px)
Citation preview
TIAX LLC1601 S. De Anza Blvd, Suite 100Cupertino, California95014-5363
Reference: D5197
SCR-Urea Infrastructure Implementation StudyFinal Report
Created for:Engine Manufacturers AssociationChicago, IllinoisJuly 30, 2003
Executive Summary for:
1D5197 7647
SCR-Urea Implementation Strategies Executive Summary
• Urea distribution will be focused at the medium- to large-throughput diesel retailers. Together, these public and private retailers provide 97 percent of the on-road diesel consumed by the Class 7 & 8 truck sector.
• The price of urea at the retail outlet depends on the urea throughput at each station
• The larger stations can obtain urea at lower cost, thus putting a downward pressure on sale price. If smaller stations cannot afford to provide urea at a price that truck operators are willing to pay, then those stations will lose their market share to other stations or be forced to operate at lower margins.
• SCR urea is cost-competitive with alternative technologies under full market penetration scenarios and is cost-competitive with NOx adsorbers even if SCR is introduced in MY2010. A more careful life-cycle comparison is needed to determine the viability of SCR in the MY2007+, 50% market penetration scenario.
• For SCR urea to be implemented successfully, all stakeholders must work in a concerted manner
Overview
2D5197 7647
Several project components were developed in order to determine if a viable business case exists for establishing an on-road SCR-urea infrastructure
• Market Structure– Determine the value-chain and market structure in which SCR-urea
infrastructure will be implemented
• Urea Cost Model– Develop framework of an on-road SCR-urea cost model
• Critical Path Analysis– Determine the critical paths within an on-road SCR-urea infrastructure,
including any “showstopper” segments
• Potential Business Cases– Based upon results from this and previous study components,
determine what business cases, if any, are viable
SCR-Urea Implementation Strategies Executive Summary
3D5197 7647
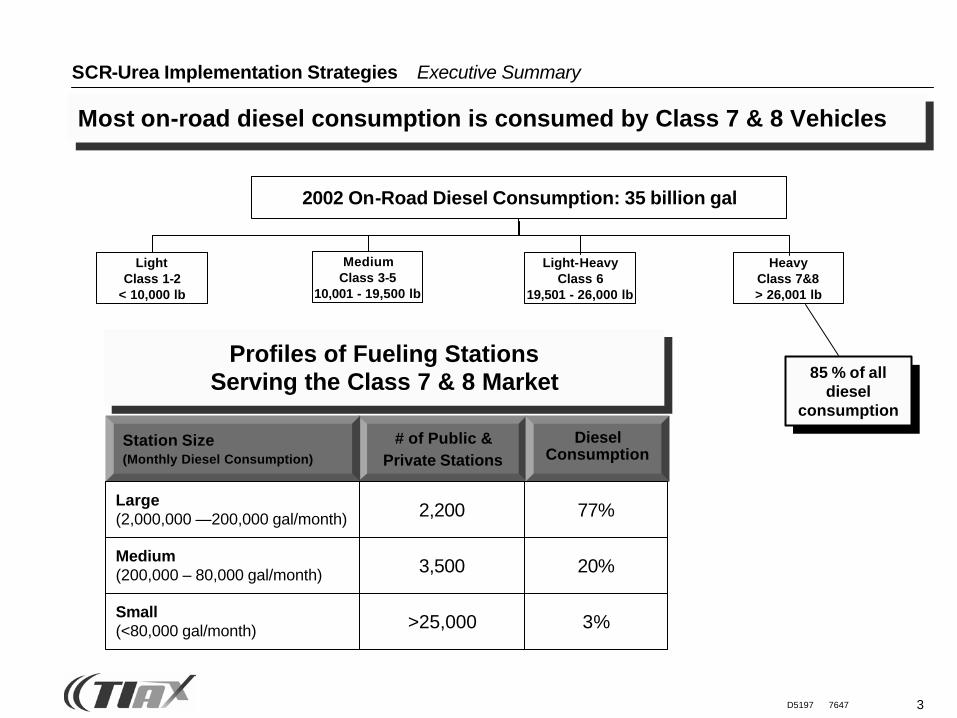
2002 On-Road Diesel Consumption: 35 billion gal
Light-HeavyClass 6
19,501 - 26,000 lb
MediumClass 3-5
10,001 - 19,500 lb
LightClass 1-2
< 10,000 lb
HeavyClass 7&8> 26,001 lb
85 % of alldiesel
consumption
SCR-Urea Implementation Strategies Executive Summary
Most on-road diesel consumption is consumed by Class 7 & 8 Vehicles
# of Public & Private Stations
Diesel Consumption
>25,000 3%
2,200 77%
3,500 20%
Station Size(Monthly Diesel Consumption)
Large(2,000,000 —200,000 gal/month)
Medium(200,000 – 80,000 gal/month)
Small(<80,000 gal/month)
Profiles of Fueling Stations Serving the Class 7 & 8 Market
4D5197 7647
SCR-Urea Implementation Strategies Executive Summary
0
200
400
600
800
1,000
1,200
2007 2008 2009 2010 2011 2012 2013 2014 2015Calendar Year
Ure
a C
onsu
mpt
ion
(mill
ion
gallo
ns o
f ur
ea 3
2.5%
wt s
olut
ion)
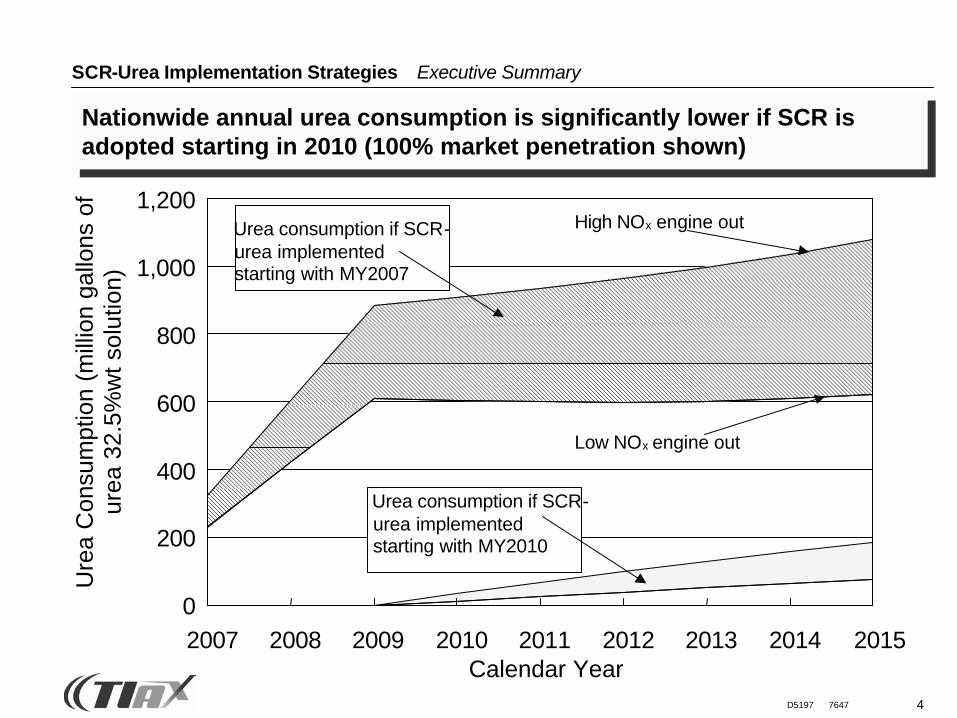
High NOx engine out
Low NOx engine out
Urea consumption if SCR-urea implemented starting with MY2010
Urea consumption if SCR-urea implemented starting with MY2007
Nationwide annual urea consumption is significantly lower if SCR is adopted starting in 2010 (100% market penetration shown)
5D5197 7647
Urea Availability and Cost
• Retail urea cost will depend on the urea throughput at each retail station. Urea throughput at a station will be determined primarily by:– the SCR technology that drives the urea/diesel consumption ratio, – the market penetration and year of introduction of SCR technology
• Under both the full and the 50% engine market penetration scenarios where SCR is introduced in MY2007, urea will cost less than $1.00/gallon to dispense at the largest throughput stations (>1 million gallons diesel/month). Ultimately, the low-cost urea dispensed by these large retail stations will force down prices at stations with a lower throughput.
• The medium to small stations (<200,000 gallons diesel/month) aresignificant providers of diesel. Yet, if they cannot afford to provide urea at a price truck operators are willing to pay, then the stations will either lose market share to other stations, or be forced to operate at lower margins.
• The stations with the smallest throughput (<80,000 gallons diesel/month) comprise only 3% of the Class 7 & 8 market and will provide urea at very small volumes but at much higher prices
SCR-Urea Implementation Strategies Executive Summary
6D5197 7647
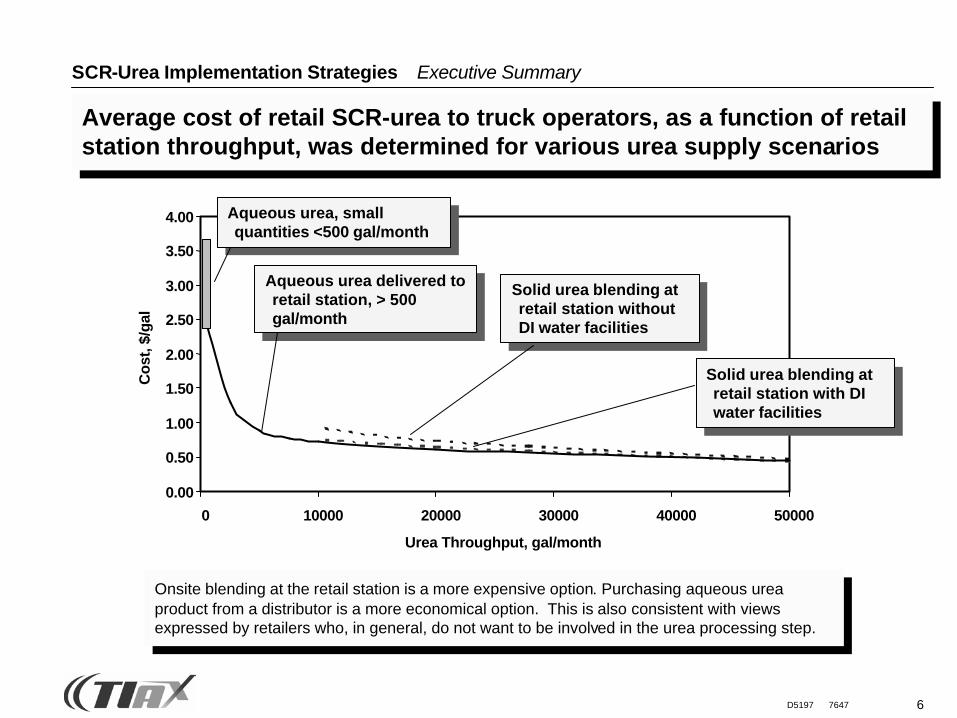
Average cost of retail SCR-urea to truck operators, as a function of retail station throughput, was determined for various urea supply scenarios
Onsite blending at the retail station is a more expensive option. Purchasing aqueous urea product from a distributor is a more economical option. This is also consistent with views expressed by retailers who, in general, do not want to be involved in the urea processing step.
Aqueous urea delivered to retail station, > 500 gal/month
Solid urea blending at retail station without DI water facilities
0.00
0.50
1.00
1.50
2.00
2.50
3.00
3.50
4.00
0 10000 20000 30000 40000 50000
Urea Throughput, gal/month
Cos
t, $/
gal
Solid urea blending at retail station with DI water facilities
Aqueous urea, small quantities <500 gal/month
SCR-Urea Implementation Strategies Executive Summary
7D5197 7647
SCR-Urea Implementation Strategies Executive Summary
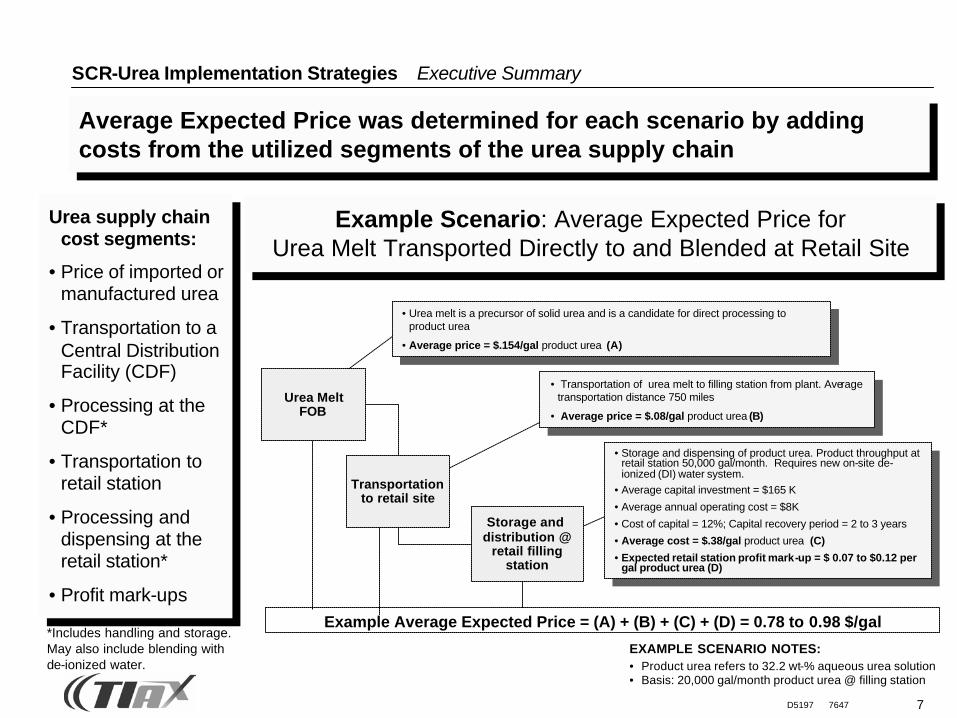
EXAMPLE SCENARIO NOTES:• Product urea refers to 32.2 wt-% aqueous urea solution• Basis: 20,000 gal/month product urea @ filling station
Urea Melt FOB
Transportationto retail site
Storage and distribution @
retail fillingstation
• Urea melt is a precursor of solid urea and is a candidate for direct processing to product urea
• Average price = $.154/gal product urea (A)
• Transportation of urea melt to filling station from plant. Average transportation distance 750 miles
• Average price = $.08/gal product urea (B)
• Storage and dispensing of product urea. Product throughput at retail station 50,000 gal/month. Requires new on-site de-ionized (DI) water system.
• Average capital investment = $165 K
• Average annual operating cost = $8K
• Cost of capital = 12%; Capital recovery period = 2 to 3 years
• Average cost = $.38/gal product urea (C)
• Expected retail station profit mark-up = $ 0.07 to $0.12 per gal product urea (D)
Example Average Expected Price = (A) + (B) + (C) + (D) = 0.78 to 0.98 $/gal
Average Expected Price was determined for each scenario by adding costs from the utilized segments of the urea supply chain
Example Scenario: Average Expected Price for Urea Melt Transported Directly to and Blended at Retail Site
Urea supply chain cost segments:
• Price of imported or manufactured urea
• Transportation to a Central Distribution Facility (CDF)
• Processing at the CDF*
• Transportation to retail station
• Processing and dispensing at the retail station*
• Profit mark-ups
*Includes handling and storage. May also include blending with de-ionized water.
8D5197 7647
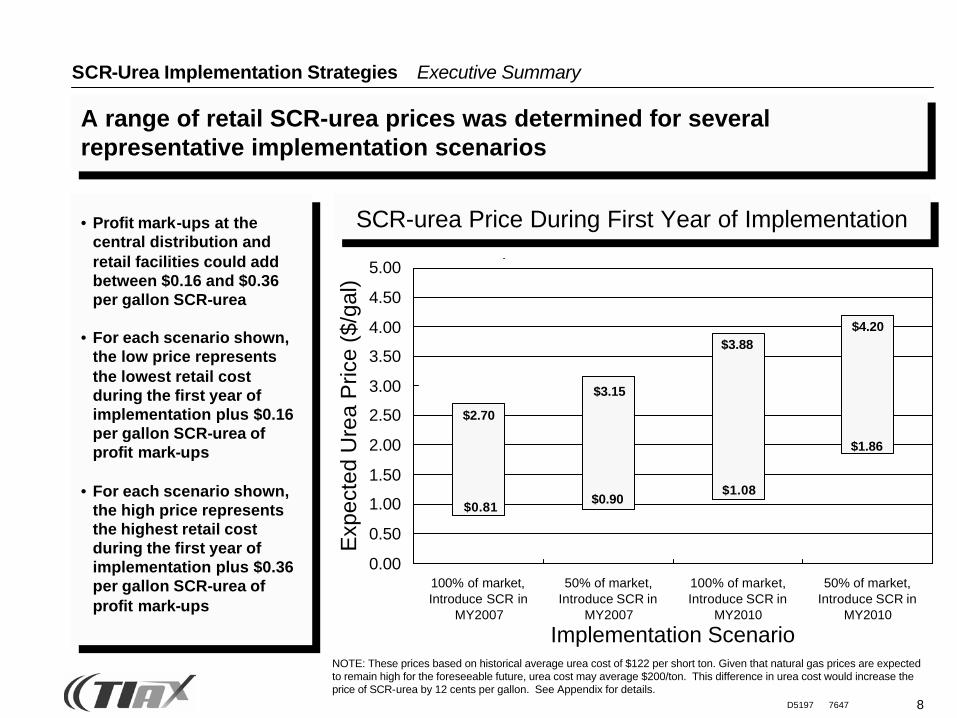
A range of retail SCR-urea prices was determined for several representative implementation scenarios
SCR-Urea Implementation Strategies Executive Summary
• Profit mark-ups at the central distribution and retail facilities could add between $0.16 and $0.36 per gallon SCR-urea
• For each scenario shown, the low price represents the lowest retail cost during the first year of implementation plus $0.16 per gallon SCR-urea of profit mark-ups
• For each scenario shown, the high price represents the highest retail cost during the first year of implementation plus $0.36 per gallon SCR-urea of profit mark-ups
Expected Price of On-road SCR-Urea
$0.81$0.90
$1.08
$1.86
0.00
0.50
1.00
1.50
2.00
2.50
3.00
3.50
4.00
4.50
5.00
100% of market,Introduce SCR in
MY2007
50% of market,Introduce SCR in
MY2007
100% of market,Introduce SCR in
MY2010
50% of market,Introduce SCR in
MY2010
Implementation Scenario
Exp
ecte
d U
rea
Pric
e ($
/gal
)
$2.70
$3.15
$4.20$3.88
SCR-urea Price During First Year of Implementation
NOTE: These prices based on historical average urea cost of $122 per short ton. Given that natural gas prices are expected to remain high for the foreseeable future, urea cost may average $200/ton. This difference in urea cost would increase the price of SCR-urea by 12 cents per gallon. See Appendix for details.
9D5197 7647
Trade-off with Alternative Emission Controls and Critical Paths
• Economics favor the SCR/urea technology over the alternative emission control technologies for most applications of long-haul and vocational trucks in the long-term (MY2010+)
• Economics also generally favor the SCR/urea technology over the alternative emission control technologies in the near-term (MY2007-09) if early engines have a high fuel penalty (~9%) relative to SCR
• Truck operators will incur increased operational cost due to urea consumption. In the early years (MY2007-09), this may be partly offset by increased fuel economy as afforded by higher engine out NOx levels. In later years, high diesel-to-urea consumption ratios will lower total urea consumption significantly.
• The critical path to implementation of the urea infrastructure requires that decisions to proceed with the SCR/urea technology must be made by the third-quarter of 2003
SCR-Urea Implementation Strategies Executive Summary
10D5197 7647
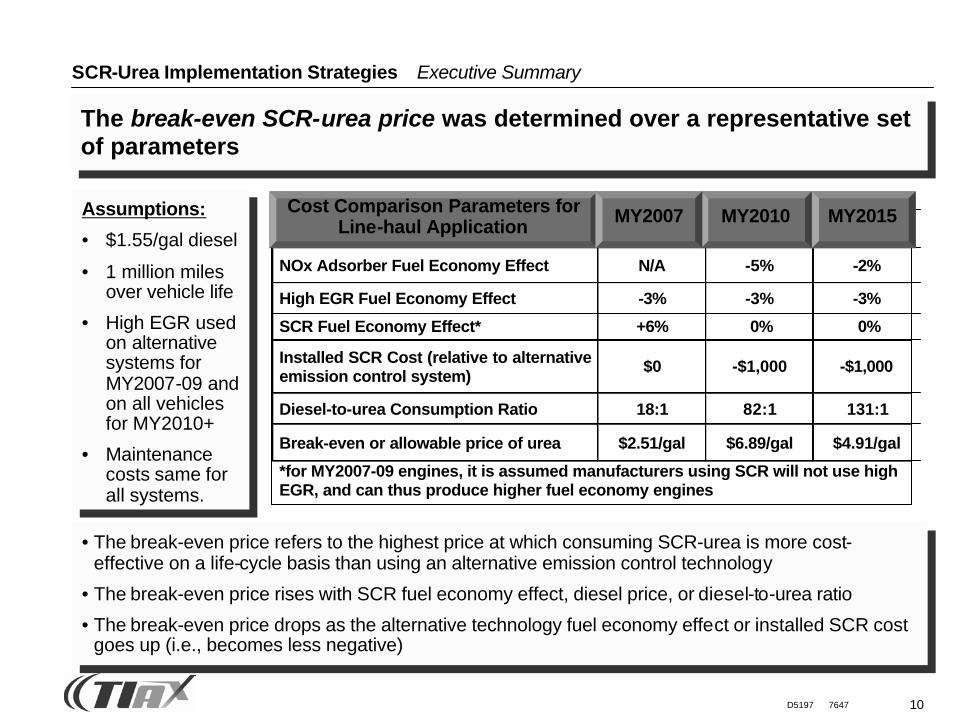
The break-even SCR-urea price was determined over a representative set of parameters
• The break-even price refers to the highest price at which consuming SCR-urea is more cost-effective on a life-cycle basis than using an alternative emission control technology
• The break-even price rises with SCR fuel economy effect, diesel price, or diesel-to-urea ratio
• The break-even price drops as the alternative technology fuel economy effect or installed SCR cost goes up (i.e., becomes less negative)
SCR-Urea Implementation Strategies Executive Summary
2007 2010 2015NOx Adsorber Fuel Economy Effect N/A -5% -2%
High EGR Fuel Economy Effect -3% -3% -3%
SCR Fuel Economy Effect* +6% 0% 0%
Installed SCR Cost (relative to alternativeemission control system)
$0 -$1,000 -$1,000
Diesel-to-urea Consumption Ratio 18:1 82:1 131:1
Break-even or allowable price of urea $2.51/gal $6.89/gal $4.91/gal
*for MY2007-09 engines, it is assumed manufacturers using SCR will not use highEGR, and can thus produce higher fuel economy engines
MY2010 MY2015Cost Comparison Parameters for Line-haul Application MY2007Assumptions:
• $1.55/gal diesel
• 1 million miles over vehicle life
• High EGR used on alternative systems for MY2007-09 and on all vehicles for MY2010+
• Maintenance costs same for all systems.
11D5197 7647
Participants and Milestone Timeline
• Major for-hire truck operators that fuel at both private and public fueling facilities should be involved in early adoption of the technology and the infrastructure
• These truck operators can implement the infrastructure at their private fueling facility and leverage their commercial fueling contractors (truck stops, cardlock stations) to implement the infrastructure
• Strong signals regarding manufacturer intentions to provide SCR-equipped trucks would need to be sent to truck operators and other stakeholders starting 3rd quarter 2003 and no later than mid-2004 in order to meet demand from MY2007 SCR implementation
SCR-Urea Implementation Strategies Executive Summary
12D5197 7647
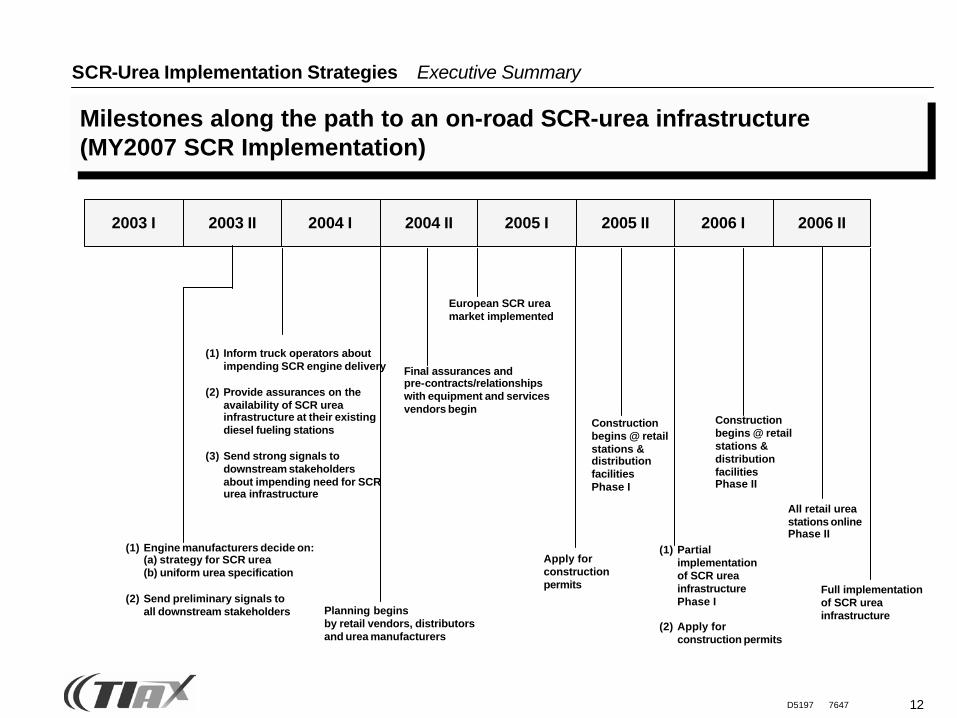
Milestones along the path to an on-road SCR-urea infrastructure(MY2007 SCR Implementation)
Full implementationof SCR urea infrastructure
2003 I 2003 II 2004 I 2004 II 2005 I 2005 II 2006 I 2006 II
All retail urea stations onlinePhase II
Construction begins @ retailstations &distributionfacilitiesPhase II
(1) Partialimplementationof SCR urea infrastructurePhase I
(2) Apply for construction permits
Construction begins @ retailstations &distributionfacilitiesPhase I
Apply for constructionpermits
Planning begins by retail vendors, distributorsand urea manufacturers
European SCR ureamarket implemented
Final assurances andpre-contracts/relationships with equipment and servicesvendors begin
(1) Inform truck operators aboutimpending SCR engine delivery
(2) Provide assurances on the availability of SCR urea infrastructure at their existingdiesel fueling stations
(3) Send strong signals to downstream stakeholdersabout impending need for SCRurea infrastructure
(1) Engine manufacturers decide on:(a) strategy for SCR urea(b) uniform urea specification
(2) Send preliminary signals to all downstream stakeholders
SCR-Urea Implementation Strategies Executive Summary
13D5197 7647
Next Steps
• For the successful implementation of the SCR/urea technology, the engine manufacturers should have a concerted strategy. Such an approach has been taken in Europe where SCR/urea technology is being implemented as the sole NOx control technology for heavy duty trucks.
• Once the SCR strategy is determined, truck operators who will become buyers of the urea and the technology must be involved in the infrastructure implementation strategy
• Key truck operators must be identified to become early adopters of the technology. Characteristics of these operators include major for-hire companies that fuel at their own large central diesel fueling stations as well as public truck stops.
• Also, the size of the urea market must be further refined to accurately convey the demand for SCR-urea to all downstream stakeholders such as the urea manufacturers, distributors, and retailers
SCR-Urea Implementation Strategies Executive Summary
TIAX LLC1601 S. De Anza Blvd, Suite 100Cupertino, California95014-5363
Reference: D5197
SCR-Urea Infrastructure Implementation StudyFinal Report
Created for:Engine Manufacturers AssociationChicago, IllinoisJuly 30, 2003
14
15D5197 7647
2 Task 1 — Determine Market Structure
3 Task 2 — Urea Cost Model Framework
1 Project Overview
4 Task 3 — SCR Urea Cost Model
SCR-Urea Implementation Strategies Agenda
5 Task 4 — Critical Path Analysis
7 Conclusions
8 Next Steps
6 Task 5 — Potential Business Cases
16D5197 7647
2 Task 1 — Determine Market Structure
3 Task 2 — Urea Cost Model Framework
1 Project Overview
4 Task 3 — SCR Urea Cost Model
5 Task 4 — Critical Path Analysis
7 Conclusions
8 Next Steps
6 Task 5 — Potential Business Cases
SCR-Urea Implementation Strategies Agenda
17D5197 7647
SCR-Urea Implementation Strategies Project Overview
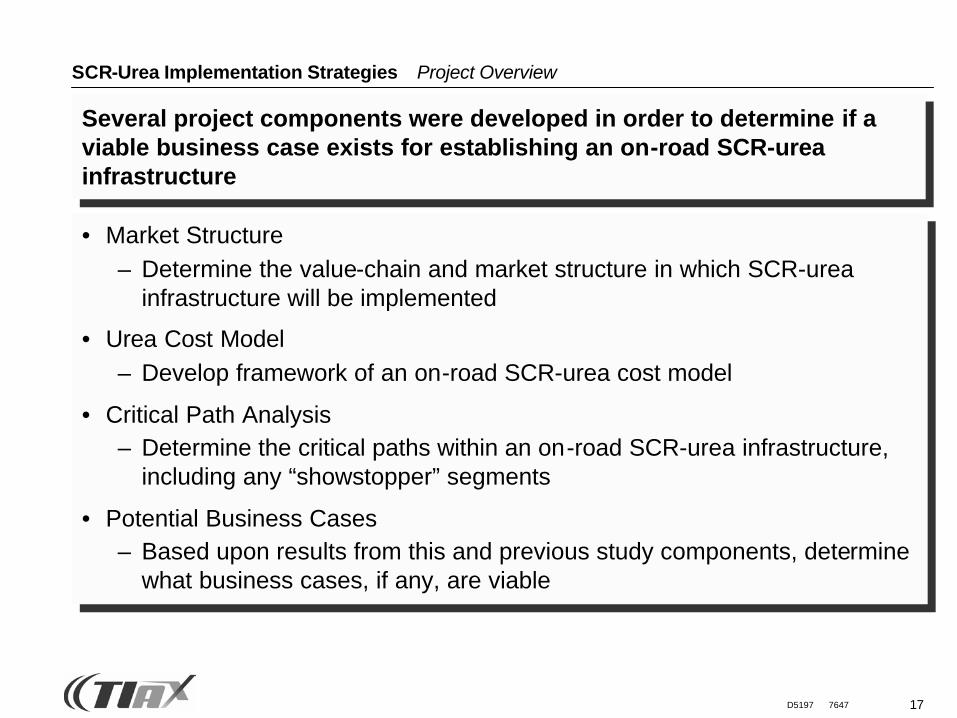
Several project components were developed in order to determine if a viable business case exists for establishing an on-road SCR-urea infrastructure
• Market Structure– Determine the value-chain and market structure in which SCR-urea
infrastructure will be implemented
• Urea Cost Model– Develop framework of an on-road SCR-urea cost model
• Critical Path Analysis– Determine the critical paths within an on-road SCR-urea infrastructure,
including any “showstopper” segments
• Potential Business Cases– Based upon results from this and previous study components, determine
what business cases, if any, are viable
18D5197 7647
Next StepsTask 5: Potential
Business Cases
Task 4:Critical Path
Analysis
Task 2 & 3:Urea Cost
Model
Task 1: Market
Structure
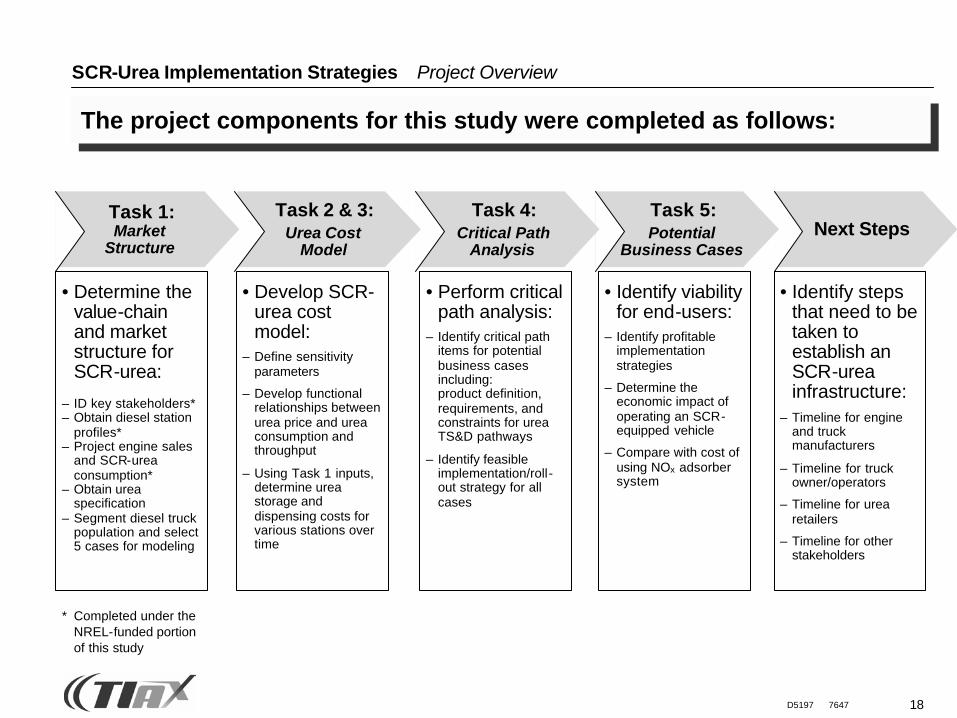
• Determine the value-chain and market structure for SCR-urea:
– ID key stakeholders*– Obtain diesel station
profiles*– Project engine sales
and SCR-urea consumption*
– Obtain urea specification
– Segment diesel truck population and select 5 cases for modeling
• Develop SCR-urea cost model:
– Define sensitivity parameters
– Develop functional relationships between urea price and urea consumption and throughput
– Using Task 1 inputs, determine urea storage and dispensing costs for various stations over time
• Perform critical path analysis:
– Identify critical path items for potential business cases including: product definition, requirements, and constraints for urea TS&D pathways
– Identify feasible implementation/roll-out strategy for all cases
• Identify viability for end-users:
– Identify profitable implementation strategies
– Determine the economic impact of operating an SCR-equipped vehicle
– Compare with cost of using NOx adsorber system
• Identify steps that need to be taken to establish an SCR-urea infrastructure:
– Timeline for engine and truck manufacturers
– Timeline for truck owner/operators
– Timeline for urea retailers
– Timeline for other stakeholders
SCR-Urea Implementation Strategies Project Overview
* Completed under the NREL-funded portion of this study
The project components for this study were completed as follows:
19D5197 7647
SCR-Urea Implementation Strategies Project Overview
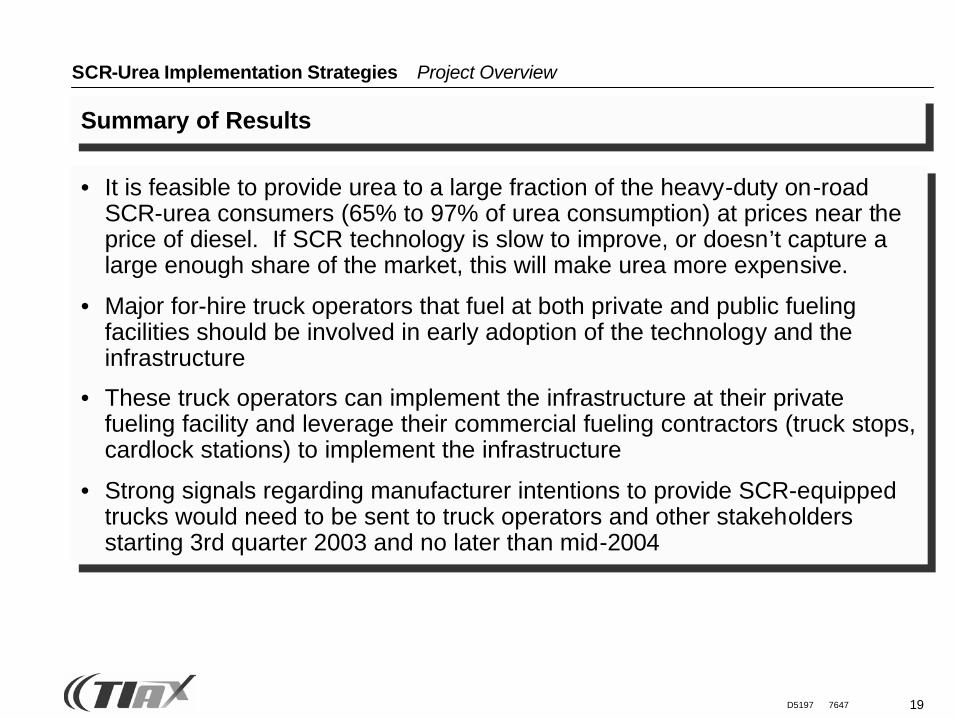
Summary of Results
• It is feasible to provide urea to a large fraction of the heavy-duty on-road SCR-urea consumers (65% to 97% of urea consumption) at prices near the price of diesel. If SCR technology is slow to improve, or doesn’t capture a large enough share of the market, this will make urea more expensive.
• Major for-hire truck operators that fuel at both private and public fueling facilities should be involved in early adoption of the technology and the infrastructure
• These truck operators can implement the infrastructure at their private fueling facility and leverage their commercial fueling contractors (truck stops, cardlock stations) to implement the infrastructure
• Strong signals regarding manufacturer intentions to provide SCR-equipped trucks would need to be sent to truck operators and other stakeholders starting 3rd quarter 2003 and no later than mid-2004
20D5197 7647
2 Task 1 — Determine Market Structure
3 Task 2 — Urea Cost Model Framework
1 Project Overview
4 Task 3 — SCR Urea Cost Model
5 Task 4 — Critical Path Analysis
7 Conclusions
8 Next Steps
6 Task 5 — Potential Business Cases
SCR-Urea Implementation Strategies Agenda
21D5197 7647
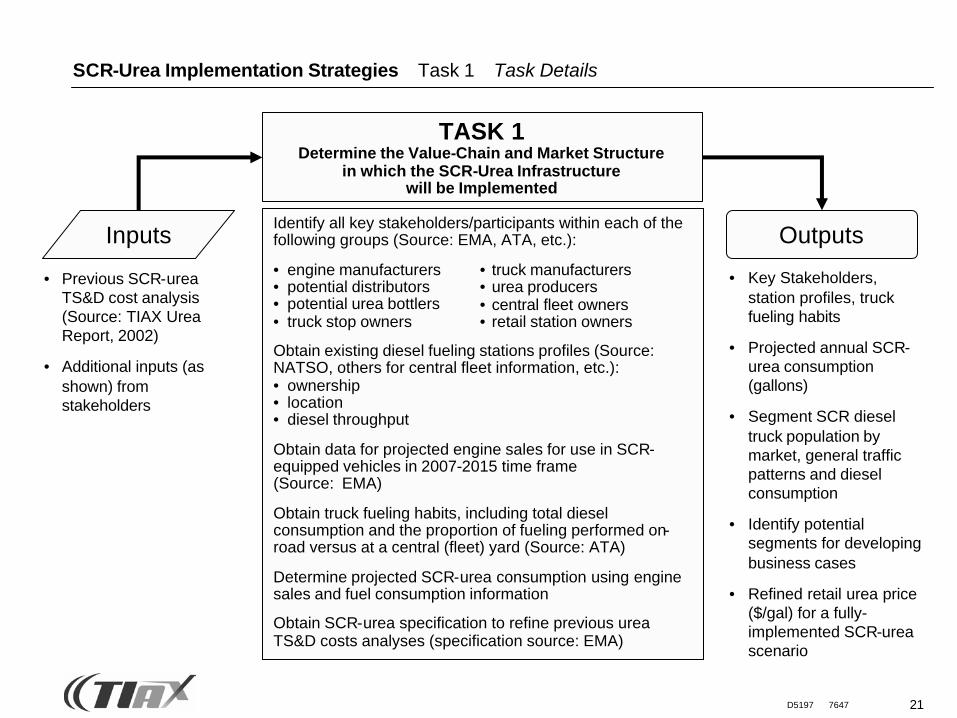
Identify all key stakeholders/participants within each of the following groups (Source: EMA, ATA, etc.):
• engine manufacturers• potential distributors• potential urea bottlers• truck stop owners
Obtain existing diesel fueling stations profiles (Source: NATSO, others for central fleet information, etc.):• ownership• location• diesel throughput
Obtain data for projected engine sales for use in SCR-equipped vehicles in 2007-2015 time frame (Source: EMA)
Obtain truck fueling habits, including total diesel consumption and the proportion of fueling performed on-road versus at a central (fleet) yard (Source: ATA)
Determine projected SCR-urea consumption using engine sales and fuel consumption information
Obtain SCR-urea specification to refine previous urea TS&D costs analyses (specification source: EMA)
TASK 1Determine the Value-Chain and Market Structure
in which the SCR-Urea Infrastructurewill be Implemented
• truck manufacturers• urea producers• central fleet owners• retail station owners
Outputs
• Key Stakeholders, station profiles, truck fueling habits
• Projected annual SCR-urea consumption (gallons)
• Segment SCR dieseltruck population by market, general traffic patterns and diesel consumption
• Identify potential segments for developing business cases
• Refined retail urea price ($/gal) for a fully-implemented SCR-urea scenario
Inputs
• Previous SCR-urea TS&D cost analysis (Source: TIAX Urea Report, 2002)
• Additional inputs (as shown) from stakeholders
SCR-Urea Implementation Strategies Task 1 Task Details
22D5197 7647
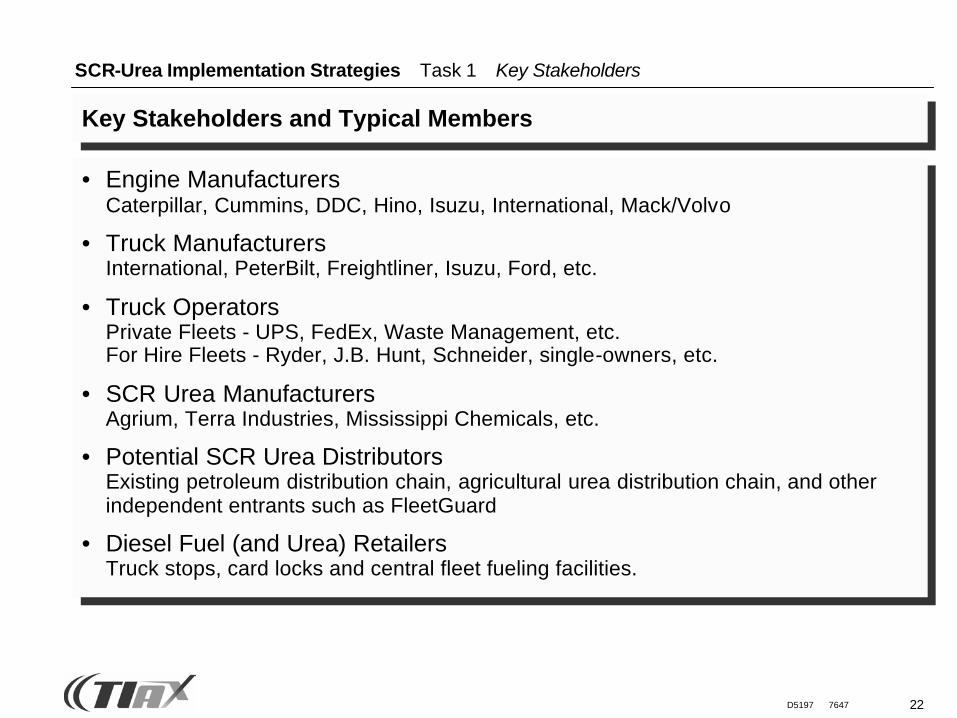
• Engine ManufacturersCaterpillar, Cummins, DDC, Hino, Isuzu, International, Mack/Volvo
• Truck ManufacturersInternational, PeterBilt, Freightliner, Isuzu, Ford, etc.
• Truck OperatorsPrivate Fleets - UPS, FedEx, Waste Management, etc.For Hire Fleets - Ryder, J.B. Hunt, Schneider, single-owners, etc.
• SCR Urea ManufacturersAgrium, Terra Industries, Mississippi Chemicals, etc.
• Potential SCR Urea DistributorsExisting petroleum distribution chain, agricultural urea distribution chain, and other independent entrants such as FleetGuard
• Diesel Fuel (and Urea) RetailersTruck stops, card locks and central fleet fueling facilities.
SCR-Urea Implementation Strategies Task 1 Key Stakeholders
Key Stakeholders and Typical Members
23D5197 7647
SCR-Urea Implementation Strategies Task 1 Urea Consumption Analysis
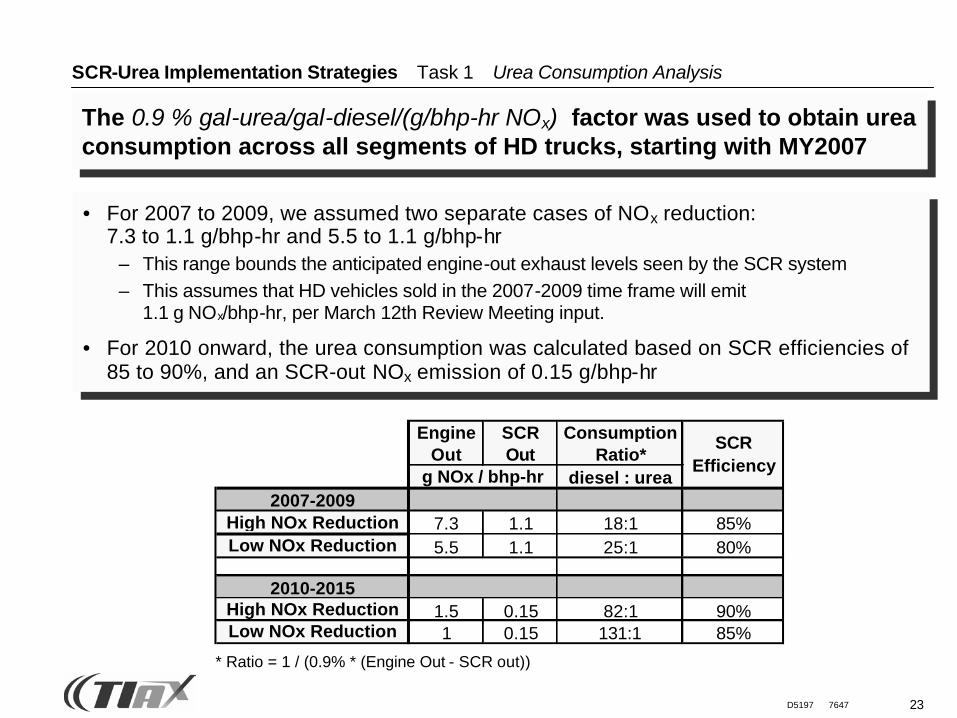
The 0.9 % gal-urea/gal-diesel/(g/bhp-hr NOx) factor was used to obtain urea consumption across all segments of HD trucks, starting with MY2007
• For 2007 to 2009, we assumed two separate cases of NOx reduction:7.3 to 1.1 g/bhp-hr and 5.5 to 1.1 g/bhp-hr
– This range bounds the anticipated engine-out exhaust levels seen by the SCR system– This assumes that HD vehicles sold in the 2007-2009 time frame will emit
1.1 g NOx/bhp-hr, per March 12th Review Meeting input.
• For 2010 onward, the urea consumption was calculated based on SCR efficiencies of 85 to 90%, and an SCR-out NOx emission of 0.15 g/bhp-hr
Engine Out
SCR Out
Consumption Ratio*
diesel : urea
7.3 1.1 18:1 85%5.5 1.1 25:1 80%
1.5 0.15 82:1 90%1 0.15 131:1 85%
2007-2009
High NOx ReductionLow NOx Reduction
2010-2015
High NOx ReductionLow NOx Reduction
g NOx / bhp-hr
SCR Efficiency
* Ratio = 1 / (0.9% * (Engine Out - SCR out))
24D5197 7647
SCR-Urea Implementation Strategies Task 1 Urea Consumption Analysis
Urea Consumption was calculated using EMA HD diesel data
• Given the consolidated diesel consumption data provided by EMA for HD SCR-equipped trucks, we calculated the urea consumption by MY through the 2007-2015 timeframe
• HD vehicle mileage deterioration factors were obtained from the EPA MOBILE on-road vehicle model. Fuel consumption was assumed to scale directly with mileage over timeframe of interest.
• In order to align MOBILE mileage deterioration factors with EMA data we made the following assumptions about the EMA data:– New Class 8 Line-haul trucks were assumed to be Class 8B– New Class 8 Mid-range and Vocational trucks were assumed to be Class
8A– New Class 6-7 Mid-range trucks were assumed to be Class 7– New Class 6-7 Vocational trucks were assumed to be Class 6
25D5197 7647
SCR-Urea Implementation Strategies Task 1 Urea Consumption Analysis
Assumptions for Urea Consumption Projections
• Again, annual miles traveled by a given vehicle decreased over time per MOBILE model estimates
• Fuel economy decreased over time due to deterioration and change in application:– Primary owner sells truck after 5 years to new owner that operates truck
on less efficient duty cycle– Secondary owner sells vehicle after 3 years to new owner that operates
vehicle on even less efficient duty cycle
• Future on-road SCR-urea consumption bounded by:– High NOx reduction/poorer average fuel economy scenario – Low NOx reduction/higher average fuel economy scenario
• The 50% on-road SCR market penetration case can be represented as achieving only 50% of the projected on-road SCR-urea consumption
• Considered scenarios where SCR first adopted in MY2007 and in MY2010
26D5197 7647
SCR-Urea Implementation Strategies Task 1 Urea Consumption Analysis
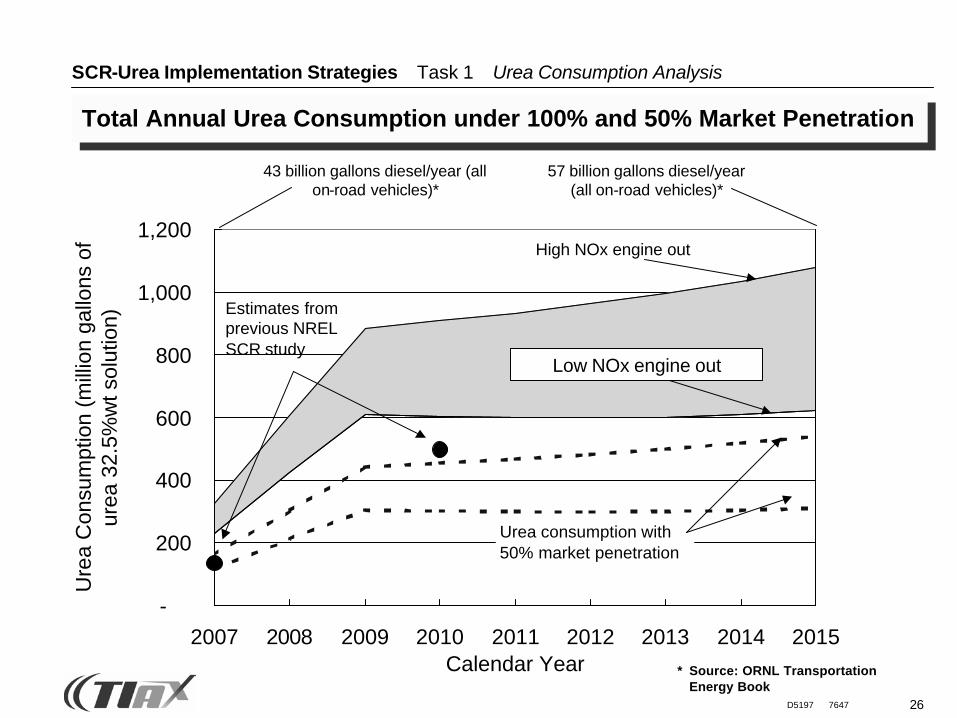
43 billion gallons diesel/year (all on-road vehicles)*
57 billion gallons diesel/year (all on-road vehicles)*
Total Annual Urea Consumption under 100% and 50% Market Penetration
-
200
400
600
800
1,000
1,200
2007 2008 2009 2010 2011 2012 2013 2014 2015Calendar Year
Ure
a C
onsu
mpt
ion
(mill
ion
gallo
ns o
f ur
ea 3
2.5%
wt s
olut
ion)
Estimates from previous NREL SCR study
High NOx engine out
Low NOx engine out
Urea consumption with50% market penetration
* Source: ORNL Transportation Energy Book
Low NOx engine out
27D5197 7647
SCR-Urea Implementation Strategies Task 1 Urea Consumption Analysis
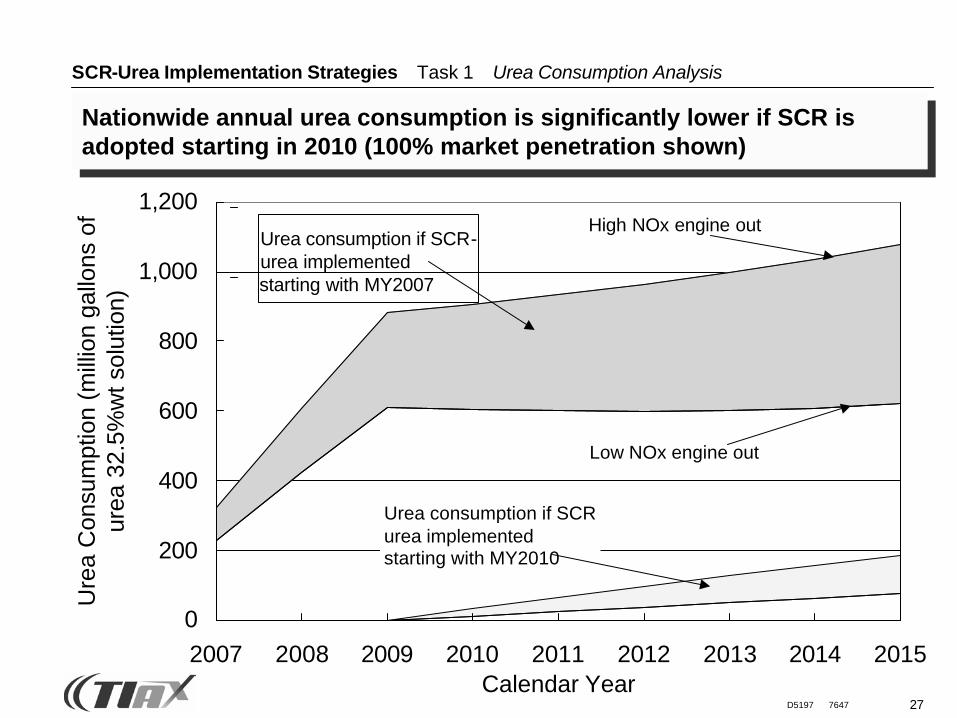
Nationwide annual urea consumption is significantly lower if SCR is adopted starting in 2010 (100% market penetration shown)
Urea consumption if SCR-urea implemented starting with MY2007
0
200
400
600
800
1,000
1,200
2007 2008 2009 2010 2011 2012 2013 2014 2015Calendar Year
Ure
a C
onsu
mpt
ion
(mill
ion
gallo
ns o
f ur
ea 3
2.5%
wt s
olut
ion)
High NOx engine out
Low NOx engine out
Urea consumption if SCR-urea implemented starting with MY2010
28D5197 7647
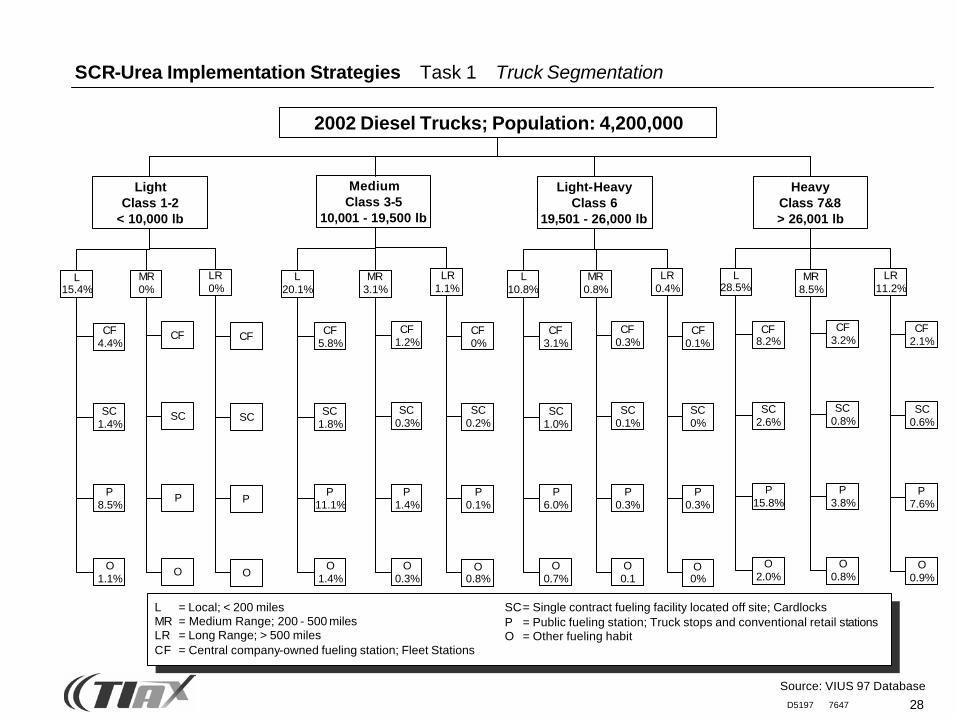
L = Local; < 200 milesMR = Medium Range; 200 - 500 milesLR = Long Range; > 500 milesCF = Central company-owned fueling station; Fleet Stations
2002 Diesel Trucks; Population: 4,200,000
Light-HeavyClass 6
19,501 - 26,000 lb
MR0%
LR0%
CF4.4%
SC1.4%
P8.5%
O1.1%
CF
SC
P
O
CF
SC
P
O
L20.1%
MR3.1%
LR1.1%
CF5.8%
SC1.8%
P11.1%
O1.4%
CF1.2%
SC0.3%
P1.4%
O0.3%
CF0%
SC0.2%
P0.1%
O0.8%
L10.8%
MR0.8%
LR0.4%
CF3.1%
SC1.0%
P6.0%
O0.7%
CF0.3%
SC0.1%
P0.3%
O0.1
CF0.1%
SC0%
P0.3%
O0%
L28.5%
MR8.5%
LR11.2%
CF8.2%
SC2.6%
P15.8%
O2.0%
CF3.2%
SC0.8%
P3.8%
O0.8%
CF2.1%
SC0.6%
P7.6%
O0.9%
MediumClass 3-5
10,001 - 19,500 lb
LightClass 1-2
< 10,000 lb
HeavyClass 7&8> 26,001 lb
L15.4%
SCR-Urea Implementation Strategies Task 1 Truck Segmentation
Source: VIUS 97 Database
SC= Single contract fueling facility located off site; CardlocksP = Public fueling station; Truck stops and conventional retail stationsO = Other fueling habit
29D5197 7647
SCR-Urea Implementation Strategies Task 1 Truck Segmentation
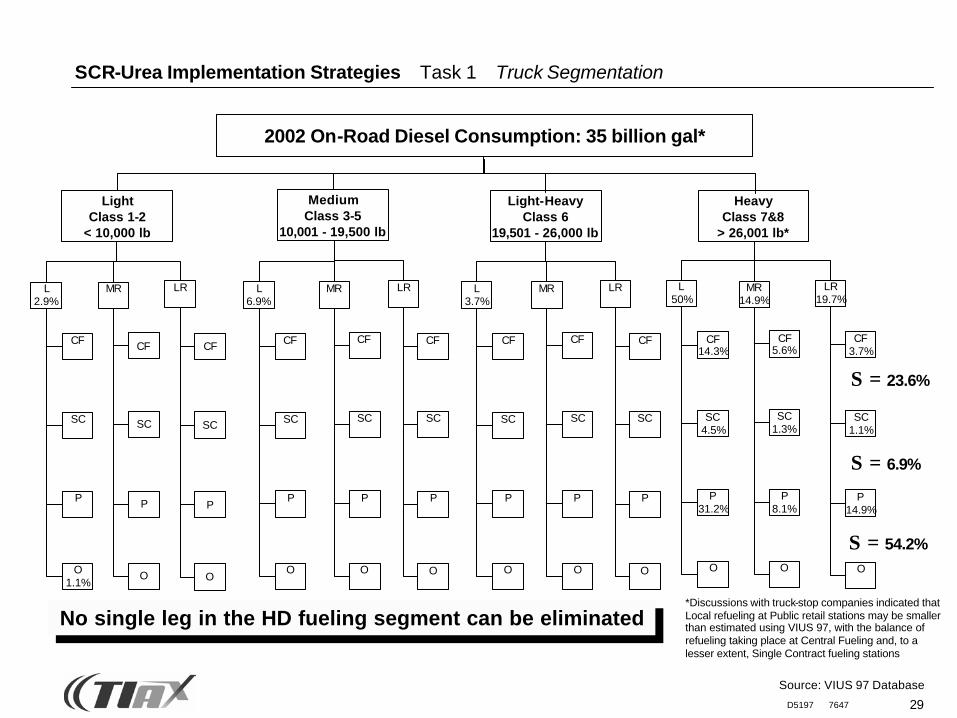
2002 On-Road Diesel Consumption: 35 billion gal*
Light-HeavyClass 6
19,501 - 26,000 lb
L2.9%
MR LR
CF
SC
P
O1.1%
CF
SC
P
O
CF
SC
P
O
L6.9%
MR LR
CF
SC
P
O
CF
SC
P
O
CF
SC
P
O
L3.7%
MR LR
CF
SC
P
O
CF
SC
P
O
CF
SC
P
O
L50%
MR14.9%
LR19.7%
CF14.3%
SC4.5%
P31.2%
O
CF5.6%
SC1.3%
P8.1%
O
CF3.7%
SC1.1%
P14.9%
O
MediumClass 3-5
10,001 - 19,500 lb
LightClass 1-2
< 10,000 lb
HeavyClass 7&8
> 26,001 lb*
Σ = 23.6%
Σ = 6.9%
Σ = 54.2%
Source: VIUS 97 Database
No single leg in the HD fueling segment can be eliminated*Discussions with truck-stop companies indicated that Local refueling at Public retail stations may be smaller than estimated using VIUS 97, with the balance of refueling taking place at Central Fueling and, to a lesser extent, Single Contract fueling stations
30D5197 7647
SCR-Urea Implementation Strategies Task 1 Fueling Station Profiles
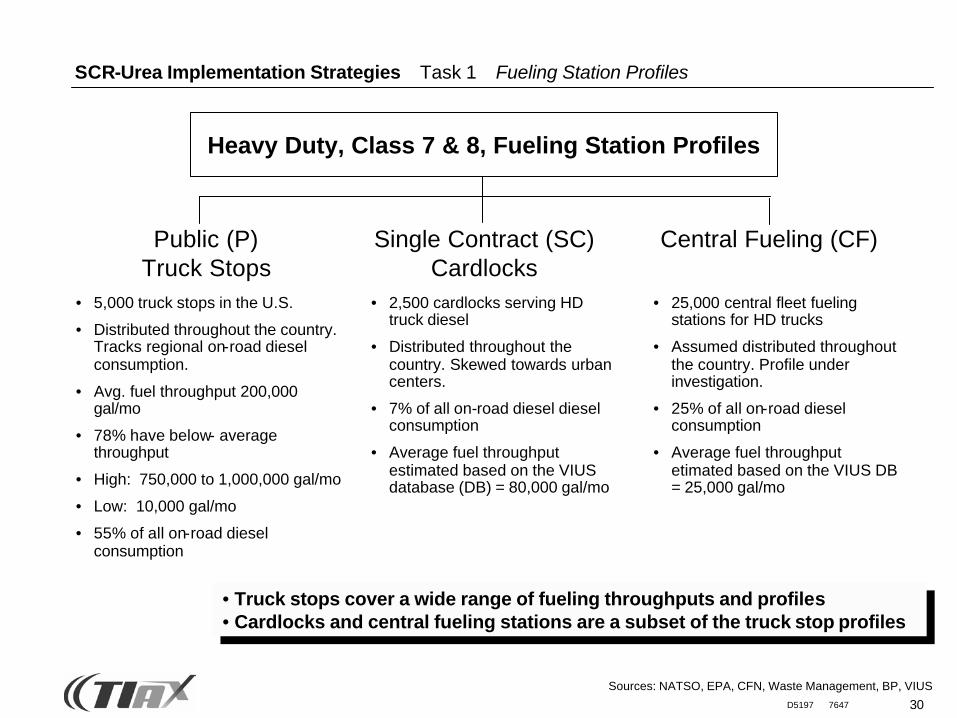
Heavy Duty, Class 7 & 8, Fueling Station Profiles
Sources: NATSO, EPA, CFN, Waste Management, BP, VIUS
• Truck stops cover a wide range of fueling throughputs and profiles• Cardlocks and central fueling stations are a subset of the truck stop profiles
Public (P)Truck Stops
Single Contract (SC)Cardlocks
Central Fueling (CF)
• 5,000 truck stops in the U.S.
• Distributed throughout the country. Tracks regional on-road diesel consumption.
• Avg. fuel throughput 200,000 gal/mo
• 78% have below- average throughput
• High: 750,000 to 1,000,000 gal/mo
• Low: 10,000 gal/mo
• 55% of all on-road diesel consumption
• 2,500 cardlocks serving HD truck diesel
• Distributed throughout the country. Skewed towards urban centers.
• 7% of all on-road diesel diesel consumption
• Average fuel throughput estimated based on the VIUS database (DB) = 80,000 gal/mo
• 25,000 central fleet fueling stations for HD trucks
• Assumed distributed throughout the country. Profile under investigation.
• 25% of all on-road diesel consumption
• Average fuel throughput etimated based on the VIUS DB = 25,000 gal/mo
31D5197 7647
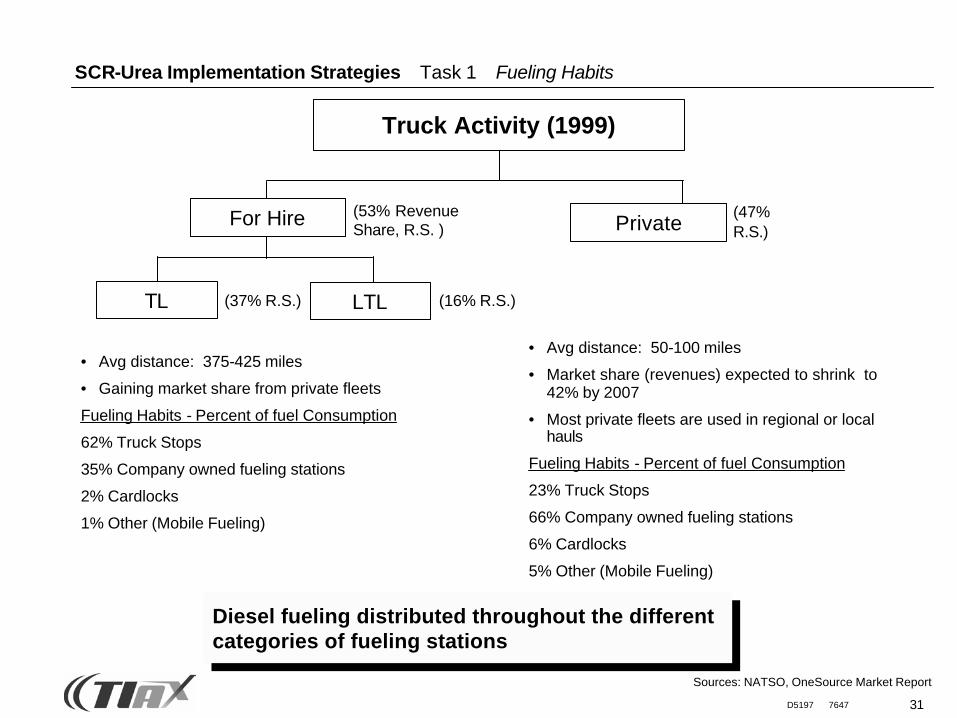
SCR-Urea Implementation Strategies Task 1 Fueling Habits
(53% Revenue Share, R.S. )
(47% R.S.)
(37% R.S.) (16% R.S.)
• Avg distance: 375-425 miles
• Gaining market share from private fleets
Fueling Habits - Percent of fuel Consumption
62% Truck Stops
35% Company owned fueling stations
2% Cardlocks
1% Other (Mobile Fueling)
• Avg distance: 50-100 miles
• Market share (revenues) expected to shrink to 42% by 2007
• Most private fleets are used in regional or local hauls
Fueling Habits - Percent of fuel Consumption
23% Truck Stops
66% Company owned fueling stations
6% Cardlocks
5% Other (Mobile Fueling)
For Hire
TL LTL
Private
Truck Activity (1999)
Sources: NATSO, OneSource Market Report
Diesel fueling distributed throughout the different categories of fueling stations
32D5197 7647
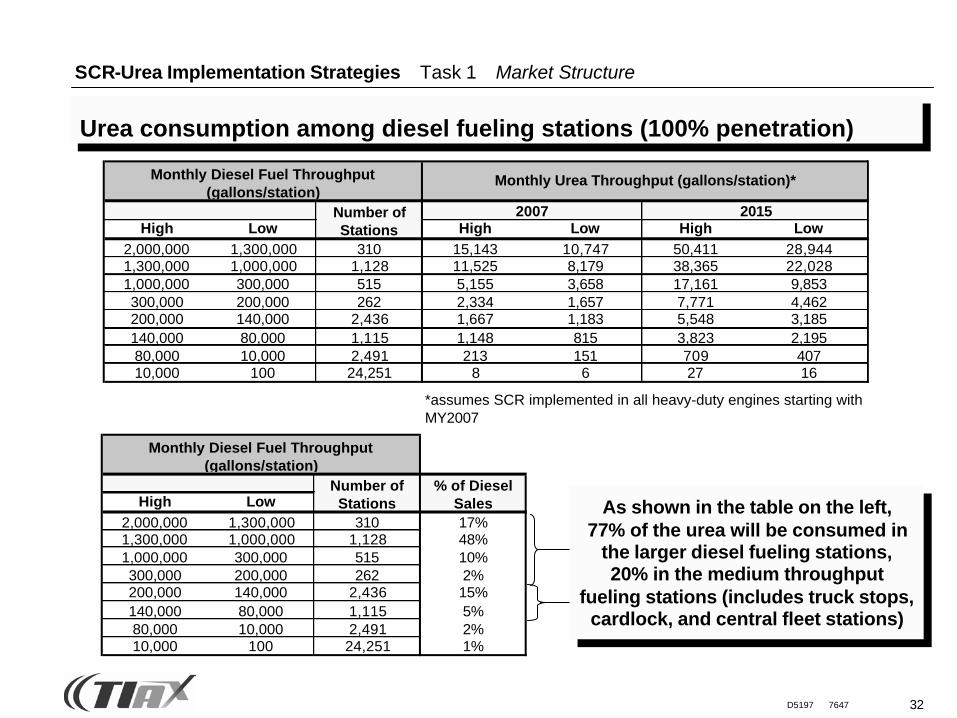
SCR-Urea Implementation Strategies Task 1 Market Structure
Urea consumption among diesel fueling stations (100% penetration)
High Low2,000,000 1,300,000 310 17%1,300,000 1,000,000 1,128 48%1,000,000 300,000 515 10%300,000 200,000 262 2%200,000 140,000 2,436 15%140,000 80,000 1,115 5%80,000 10,000 2,491 2%10,000 100 24,251 1%
Number of Stations
Monthly Diesel Fuel Throughput (gallons/station)
% of Diesel Sales
High Low High Low High Low2,000,000 1,300,000 310 15,143 10,747 50,411 28,9441,300,000 1,000,000 1,128 11,525 8,179 38,365 22,0281,000,000 300,000 515 5,155 3,658 17,161 9,853300,000 200,000 262 2,334 1,657 7,771 4,462200,000 140,000 2,436 1,667 1,183 5,548 3,185140,000 80,000 1,115 1,148 815 3,823 2,19580,000 10,000 2,491 213 151 709 40710,000 100 24,251 8 6 27 16
2007 2015Number of Stations
*assumes SCR implemented in all heavy-duty engines starting with MY2007
Monthly Diesel Fuel Throughput (gallons/station)
Monthly Urea Throughput (gallons/station)*
As shown in the table on the left, 77% of the urea will be consumed in
the larger diesel fueling stations, 20% in the medium throughput
fueling stations (includes truck stops, cardlock, and central fleet stations)
33D5197 7647
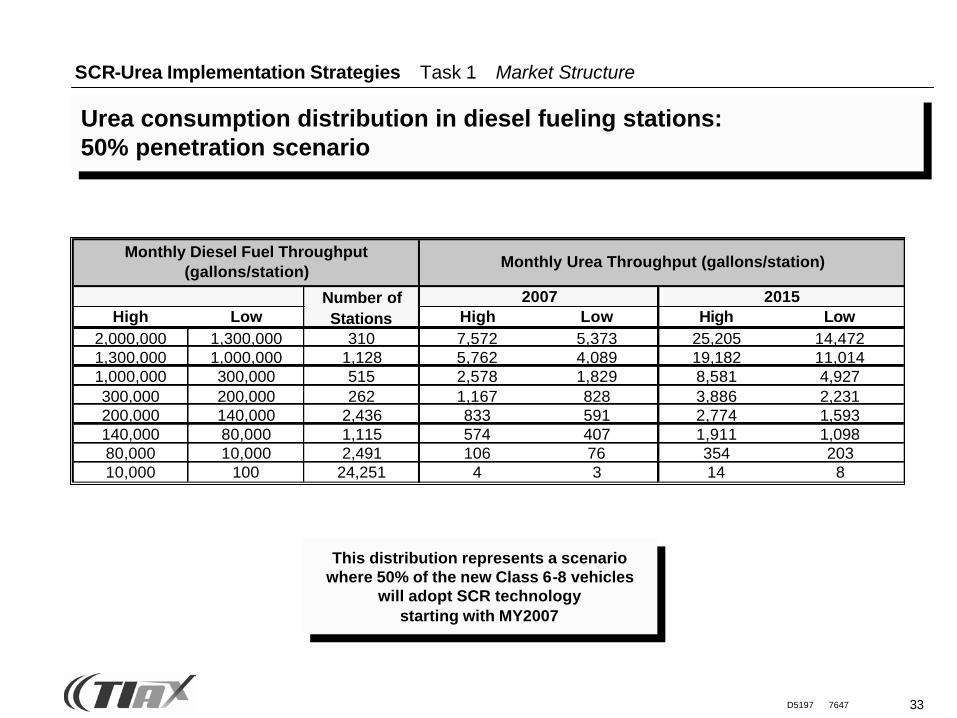
SCR-Urea Implementation Strategies Task 1 Market Structure
Urea consumption distribution in diesel fueling stations: 50% penetration scenario
This distribution represents a scenario where 50% of the new Class 6-8 vehicles
will adopt SCR technology starting with MY2007
High Low High Low High Low2,000,000 1,300,000 310 7,572 5,373 25,205 14,4721,300,000 1,000,000 1,128 5,762 4,089 19,182 11,0141,000,000 300,000 515 2,578 1,829 8,581 4,927300,000 200,000 262 1,167 828 3,886 2,231200,000 140,000 2,436 833 591 2,774 1,593140,000 80,000 1,115 574 407 1,911 1,09880,000 10,000 2,491 106 76 354 20310,000 100 24,251 4 3 14 8
2015
Monthly Diesel Fuel Throughput (gallons/station)
Monthly Urea Throughput (gallons/station)
Number of Stations
2007
34D5197 7647
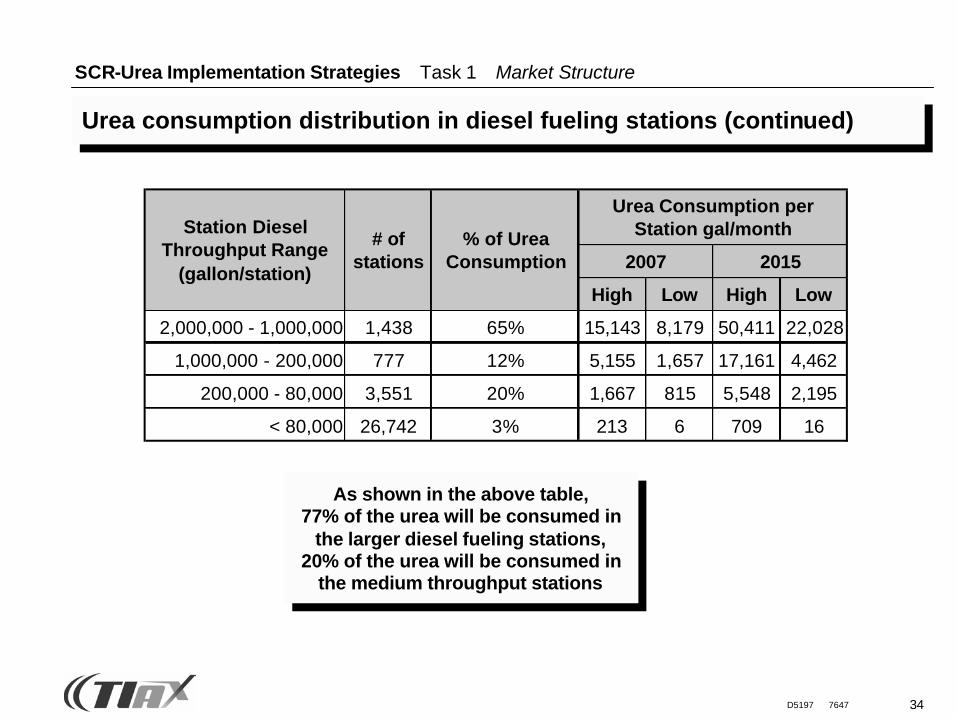
SCR-Urea Implementation Strategies Task 1 Market Structure
Urea consumption distribution in diesel fueling stations (continued)
As shown in the above table, 77% of the urea will be consumed in
the larger diesel fueling stations, 20% of the urea will be consumed in
the medium throughput stations
High Low High Low
2,000,000 - 1,000,000 1,438 65% 15,143 8,179 50,411 22,028
1,000,000 - 200,000 777 12% 5,155 1,657 17,161 4,462
200,000 - 80,000 3,551 20% 1,667 815 5,548 2,195
< 80,000 26,742 3% 213 6 709 16
Urea Consumption per Station gal/month
2007 2015
Station Diesel Throughput Range
(gallon/station)
# of stations
% of Urea Consumption
35D5197 7647
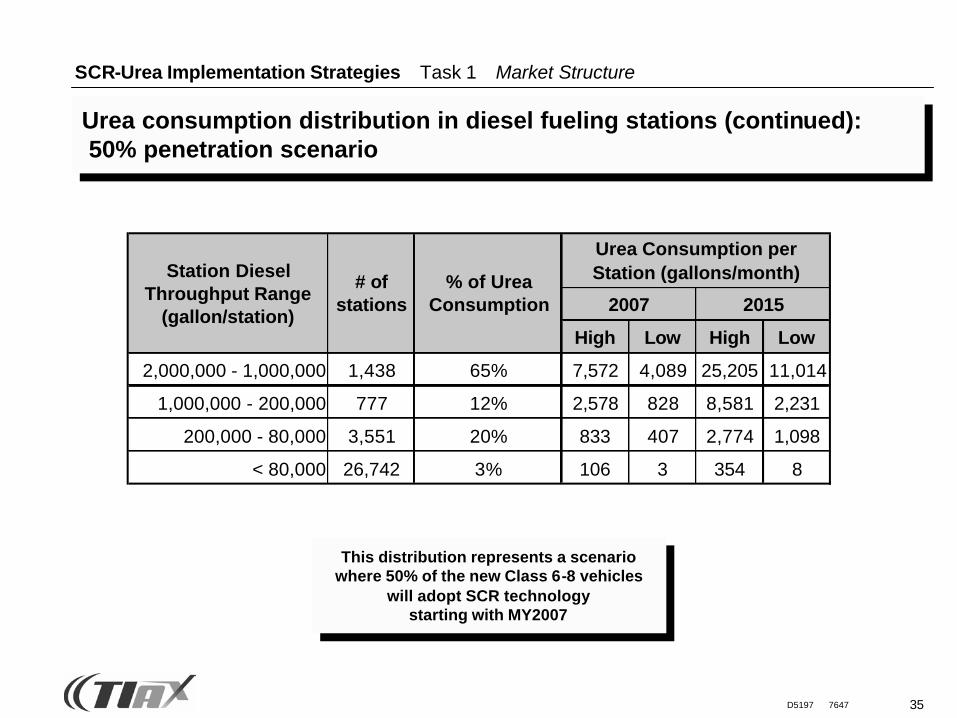
SCR-Urea Implementation Strategies Task 1 Market Structure
Urea consumption distribution in diesel fueling stations (continued):50% penetration scenario
This distribution represents a scenario where 50% of the new Class 6-8 vehicles
will adopt SCR technology starting with MY2007
High Low High Low
2,000,000 - 1,000,000 1,438 65% 7,572 4,089 25,205 11,014
1,000,000 - 200,000 777 12% 2,578 828 8,581 2,231
200,000 - 80,000 3,551 20% 833 407 2,774 1,098
< 80,000 26,742 3% 106 3 354 8
2007 2015
Station Diesel Throughput Range
(gallon/station)
# of stations
% of Urea Consumption
Urea Consumption per Station (gallons/month)
36D5197 7647
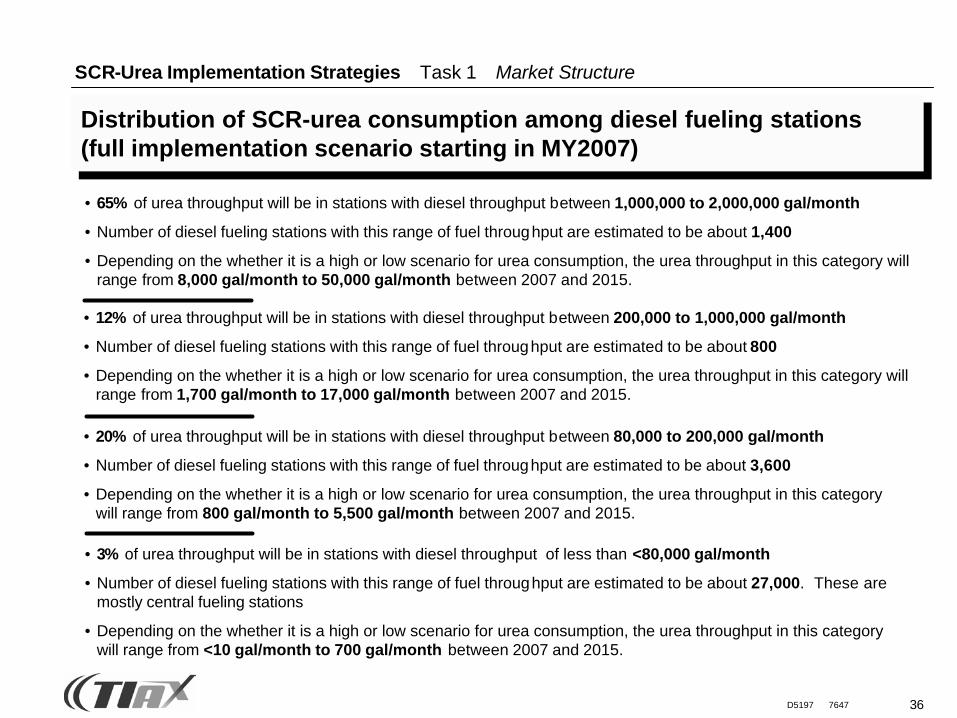
SCR-Urea Implementation Strategies Task 1 Market Structure
• 65% of urea throughput will be in stations with diesel throughput between 1,000,000 to 2,000,000 gal/month
• Number of diesel fueling stations with this range of fuel throughput are estimated to be about 1,400
• Depending on the whether it is a high or low scenario for urea consumption, the urea throughput in this category will range from 8,000 gal/month to 50,000 gal/month between 2007 and 2015.
• 12% of urea throughput will be in stations with diesel throughput between 200,000 to 1,000,000 gal/month
• Number of diesel fueling stations with this range of fuel throughput are estimated to be about 800
• Depending on the whether it is a high or low scenario for urea consumption, the urea throughput in this category will range from 1,700 gal/month to 17,000 gal/month between 2007 and 2015.
• 20% of urea throughput will be in stations with diesel throughput between 80,000 to 200,000 gal/month
• Number of diesel fueling stations with this range of fuel throughput are estimated to be about 3,600
• Depending on the whether it is a high or low scenario for urea consumption, the urea throughput in this category will range from 800 gal/month to 5,500 gal/month between 2007 and 2015.
• 3% of urea throughput will be in stations with diesel throughput of less than <80,000 gal/month
• Number of diesel fueling stations with this range of fuel throughput are estimated to be about 27,000. These are mostly central fueling stations
• Depending on the whether it is a high or low scenario for urea consumption, the urea throughput in this category will range from <10 gal/month to 700 gal/month between 2007 and 2015.
Distribution of SCR-urea consumption among diesel fueling stations(full implementation scenario starting in MY2007)
37D5197 7647
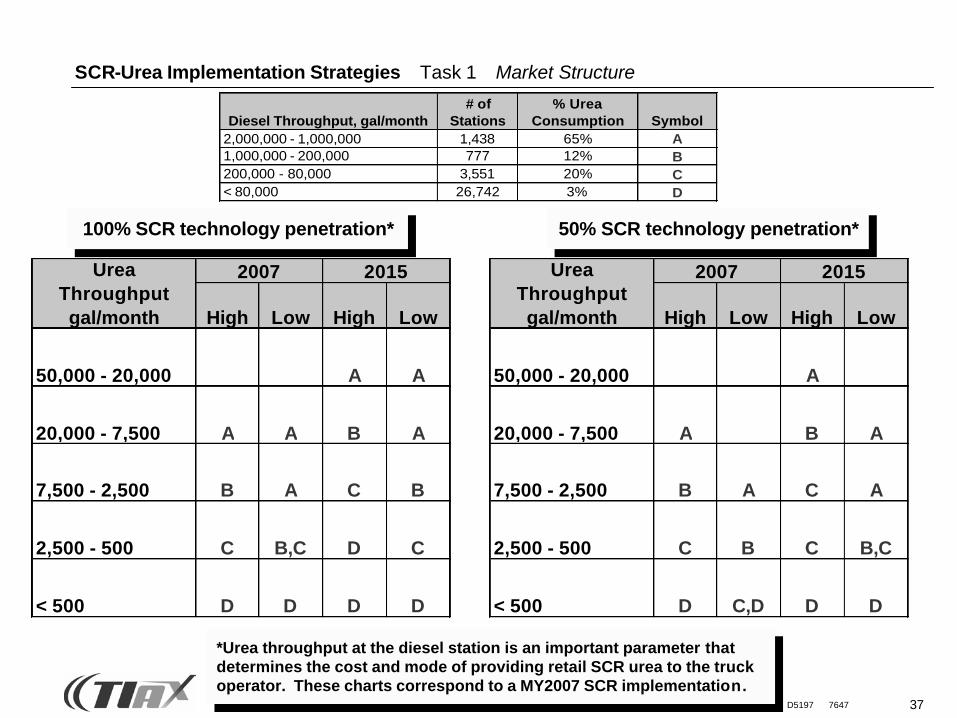
SCR-Urea Implementation Strategies Task 1 Market Structure
Diesel Throughput, gal/month# of
Stations% Urea
Consumption Symbol2,000,000 - 1,000,000 1,438 65% A1,000,000 - 200,000 777 12% B200,000 - 80,000 3,551 20% C< 80,000 26,742 3% D
100% SCR technology penetration* 50% SCR technology penetration*
High Low High Low
50,000 - 20,000 A A
20,000 - 7,500 A A B A
7,500 - 2,500 B A C B
2,500 - 500 C B,C D C
< 500 D D D D
Urea Throughput gal/month
2007 2015
High Low High Low
50,000 - 20,000 A
20,000 - 7,500 A B A
7,500 - 2,500 B A C A
2,500 - 500 C B C B,C
< 500 D C,D D D
Urea Throughput gal/month
2007 2015
*Urea throughput at the diesel station is an important parameter that determines the cost and mode of providing retail SCR urea to the truck operator. These charts correspond to a MY2007 SCR implementation.
38D5197 7647
2 Task 1 — Determine Market Structure
3 Task 2 — Urea Cost Model Framework
1 Project Overview
4 Task 3 — SCR Urea Cost Model
SCR-Urea Implementation Strategies Agenda
5 Task 4 — Critical Path Analysis
7 Conclusions
8 Next Steps
6 Task 5 — Potential Business Cases
39D5197 7647
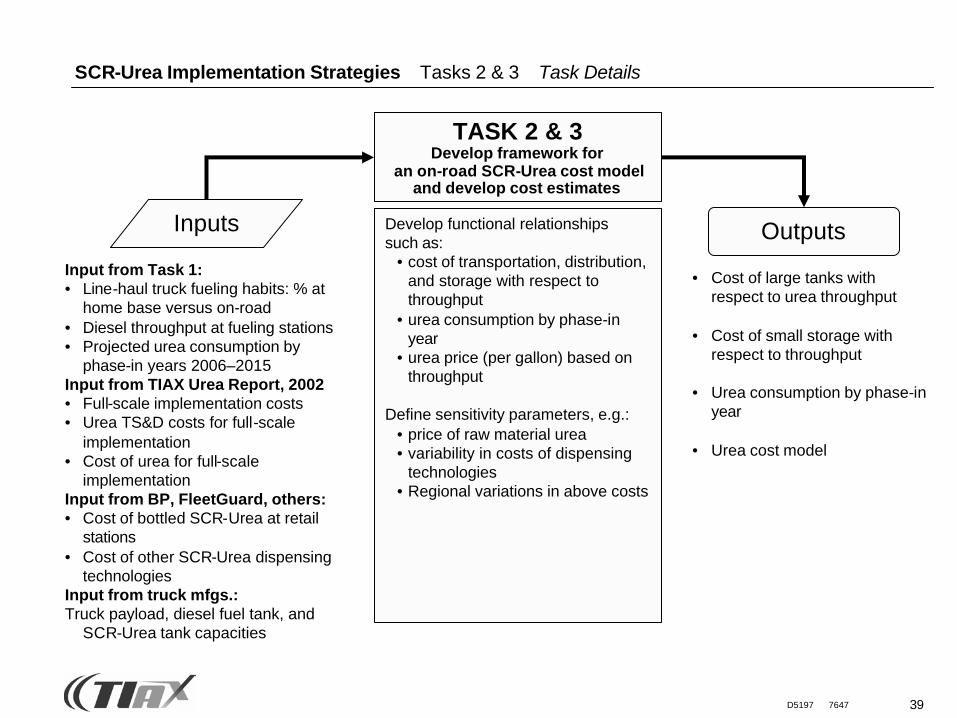
Develop functional relationshipssuch as:
• cost of transportation, distribution, and storage with respect to throughput
• urea consumption by phase-in year
• urea price (per gallon) based on throughput
Define sensitivity parameters, e.g.:• price of raw material urea• variability in costs of dispensing
technologies• Regional variations in above costs
TASK 2 & 3Develop framework for
an on-road SCR-Urea cost model and develop cost estimates
Outputs
• Cost of large tanks with respect to urea throughput
• Cost of small storage with respect to throughput
• Urea consumption by phase-in year
• Urea cost model
Inputs
Input from Task 1:• Line-haul truck fueling habits: % at
home base versus on-road• Diesel throughput at fueling stations• Projected urea consumption by
phase-in years 2006–2015Input from TIAX Urea Report, 2002• Full-scale implementation costs• Urea TS&D costs for full-scale
implementation• Cost of urea for full-scale
implementationInput from BP, FleetGuard, others:• Cost of bottled SCR-Urea at retail
stations• Cost of other SCR-Urea dispensing
technologiesInput from truck mfgs.:Truck payload, diesel fuel tank, and
SCR-Urea tank capacities
SCR-Urea Implementation Strategies Tasks 2 & 3 Task Details
40D5197 7647
SCR-Urea Implementation Strategies Tasks 2 & 3 Assumptions & Steps to Urea Cost Model
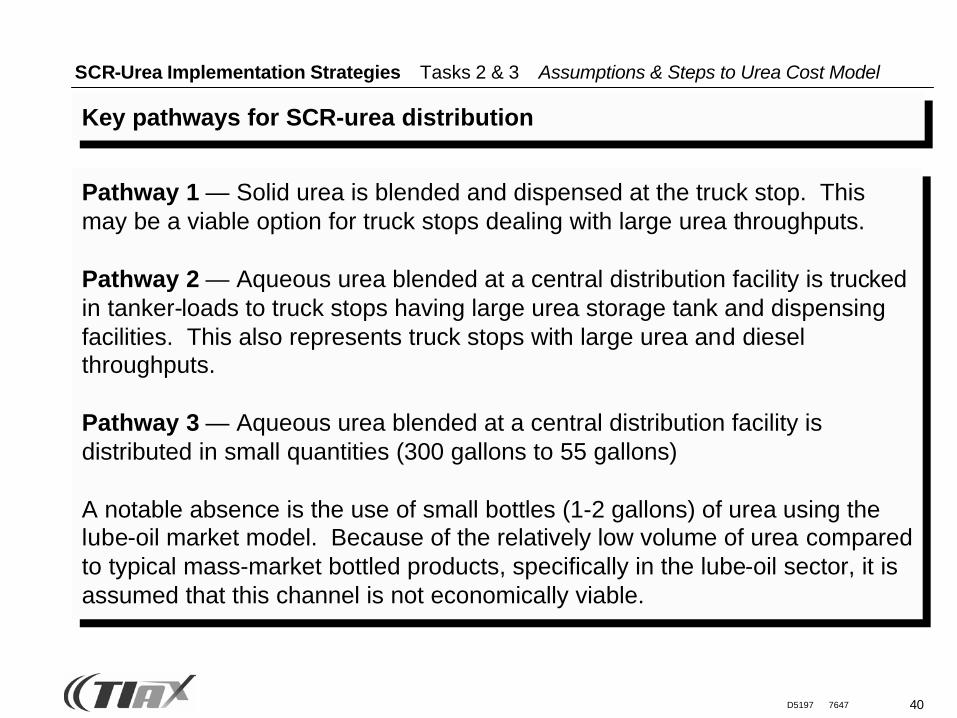
Pathway 1 — Solid urea is blended and dispensed at the truck stop. This may be a viable option for truck stops dealing with large urea throughputs.
Pathway 2 — Aqueous urea blended at a central distribution facility is trucked in tanker-loads to truck stops having large urea storage tank and dispensing facilities. This also represents truck stops with large urea and diesel throughputs.
Pathway 3 — Aqueous urea blended at a central distribution facility is distributed in small quantities (300 gallons to 55 gallons)
A notable absence is the use of small bottles (1-2 gallons) of urea using the lube-oil market model. Because of the relatively low volume of urea compared to typical mass-market bottled products, specifically in the lube-oil sector, it is assumed that this channel is not economically viable.
Key pathways for SCR-urea distribution
41D5197 7647
SCR-Urea Implementation Strategies Tasks 2 & 3 Cost Model Assumptions
Cost Model Assumptions
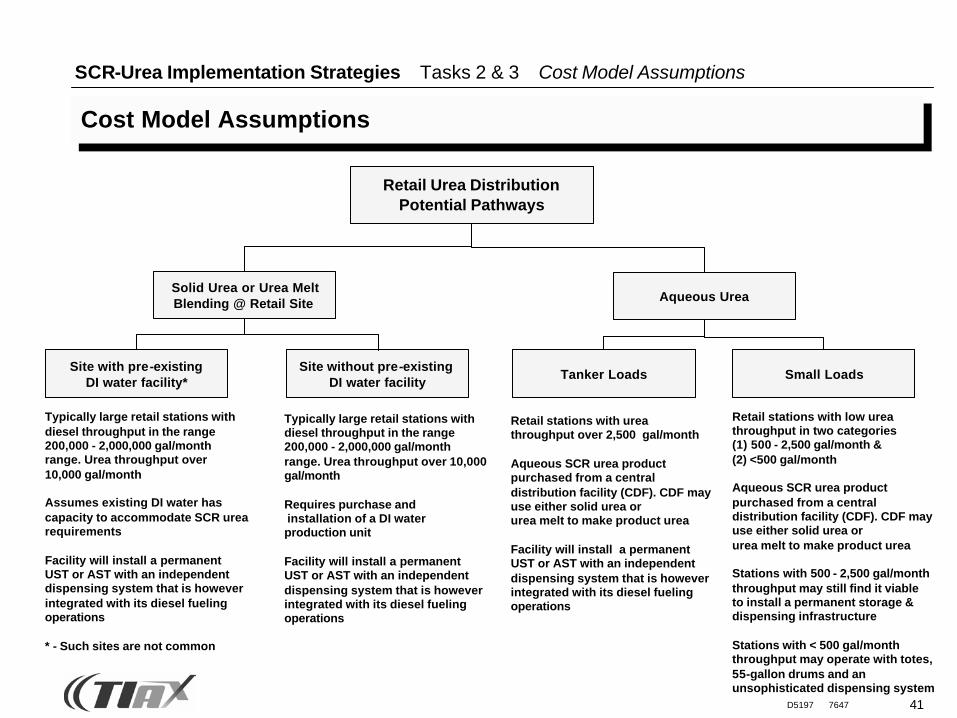
Retail Urea DistributionPotential Pathways
Aqueous Urea
Small LoadsTanker LoadsSite with pre-existing
DI water facility*Site without pre-existing
DI water facility
Typically large retail stations withdiesel throughput in the range200,000 - 2,000,000 gal/monthrange. Urea throughput over 10,000 gal/month
Assumes existing DI water has capacity to accommodate SCR urearequirements
Facility will install a permanentUST or AST with an independentdispensing system that is howeverintegrated with its diesel fuelingoperations
* - Such sites are not common
Typically large retail stations withdiesel throughput in the range200,000 - 2,000,000 gal/monthrange. Urea throughput over 10,000gal/month
Requires purchase and installation of a DI waterproduction unit
Facility will install a permanentUST or AST with an independentdispensing system that is howeverintegrated with its diesel fuelingoperations
Retail stations with ureathroughput over 2,500 gal/month
Aqueous SCR urea product purchased from a centraldistribution facility (CDF). CDF may use either solid urea orurea melt to make product urea
Facility will install a permanentUST or AST with an independentdispensing system that is howeverintegrated with its diesel fuelingoperations
Retail stations with low urea throughput in two categories(1) 500 - 2,500 gal/month &(2) <500 gal/month
Aqueous SCR urea product purchased from a centraldistribution facility (CDF). CDF may use either solid urea orurea melt to make product urea
Stations with 500 - 2,500 gal/monththroughput may still find it viableto install a permanent storage &dispensing infrastructure
Stations with < 500 gal/monththroughput may operate with totes,55-gallon drums and an unsophisticated dispensing system
Solid Urea or Urea MeltBlending @ Retail Site
42D5197 7647
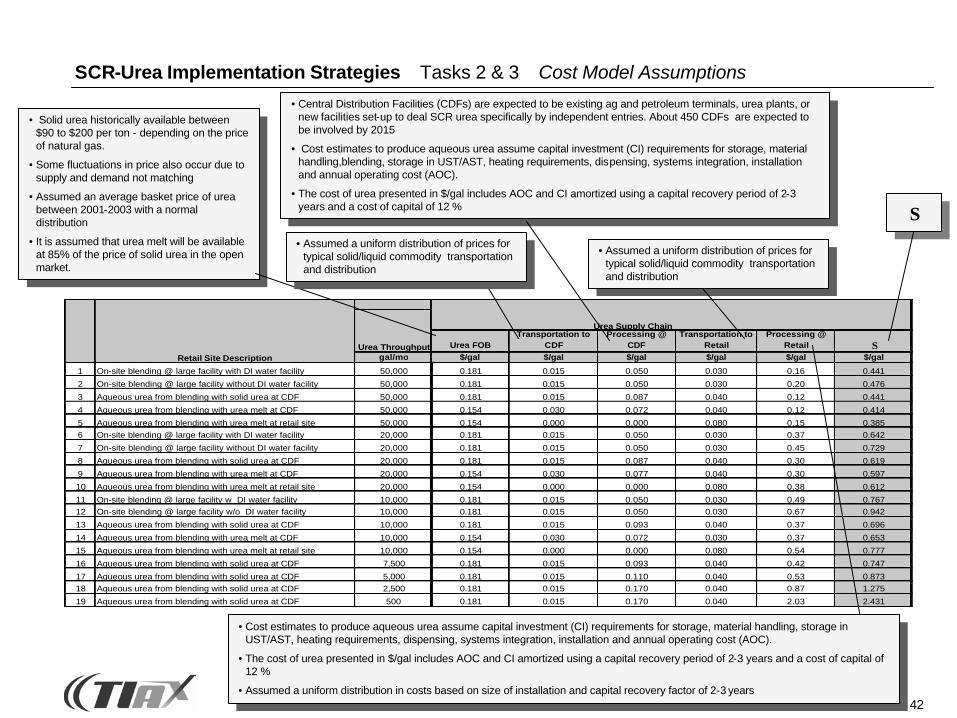
gal/mo
1 On-site blending @ large facility with DI water facility 50,000
2 On-site blending @ large facility without DI water facility 50,000
3 Aqueous urea from blending with solid urea at CDF 50,000
4 Aqueous urea from blending with urea melt at CDF 50,000
5 Aqueous urea from blending with urea melt at retail site 50,0006 On-site blending @ large facility with DI water facility 20,000
7 On-site blending @ large facility without DI water facility 20,000
8 Aqueous urea from blending with solid urea at CDF 20,000
9 Aqueous urea from blending with urea melt at CDF 20,000
10 Aqueous urea from blending with urea melt at retail site 20,000
11 On-site blending @ large facility w DI water facility 10,00012 On-site blending @ large facility w/o DI water facility 10,000
13 Aqueous urea from blending with solid urea at CDF 10,000
14 Aqueous urea from blending with urea melt at CDF 10,000
15 Aqueous urea from blending with urea melt at retail site 10,000
16 Aqueous urea from blending with solid urea at CDF 7,500
17 Aqueous urea from blending with solid urea at CDF 5,00018 Aqueous urea from blending with solid urea at CDF 2,500
19 Aqueous urea from blending with solid urea at CDF 500
Retail Site DescriptionUrea Throughput Urea FOB
Transportation to CDF
Processing @ CDF
Transportation to Retail
Processing @ Retail Σ
$/gal $/gal $/gal $/gal $/gal $/gal
0.181 0.015 0.050 0.030 0.16 0.441
0.181 0.015 0.050 0.030 0.20 0.476
0.181 0.015 0.087 0.040 0.12 0.441
0.154 0.030 0.072 0.040 0.12 0.414
0.154 0.000 0.000 0.080 0.15 0.3850.181 0.015 0.050 0.030 0.37 0.642
0.181 0.015 0.050 0.030 0.45 0.729
0.181 0.015 0.087 0.040 0.30 0.619
0.154 0.030 0.077 0.040 0.30 0.597
0.154 0.000 0.000 0.080 0.38 0.612
0.181 0.015 0.050 0.030 0.49 0.7670.181 0.015 0.050 0.030 0.67 0.942
0.181 0.015 0.093 0.040 0.37 0.696
0.154 0.030 0.072 0.030 0.37 0.653
0.154 0.000 0.000 0.080 0.54 0.777
0.181 0.015 0.093 0.040 0.42 0.747
0.181 0.015 0.110 0.040 0.53 0.8730.181 0.015 0.170 0.040 0.87 1.275
0.181 0.015 0.170 0.040 2.03 2.431
Urea Supply Chain
SCR-Urea Implementation Strategies Tasks 2 & 3 Cost Model Assumptions
• Central Distribution Facilities (CDFs) are expected to be existing ag and petroleum terminals, urea plants, or new facilities set-up to deal SCR urea specifically by independent entries. About 450 CDFs are expected to be involved by 2015
• Cost estimates to produce aqueous urea assume capital investment (CI) requirements for storage, material handling,blending, storage in UST/AST, heating requirements, dispensing, systems integration, installation and annual operating cost (AOC).
• The cost of urea presented in $/gal includes AOC and CI amortized using a capital recovery period of 2-3 years and a cost of capital of 12 % Σ
• Assumed a uniform distribution of prices for typical solid/liquid commodity transportation and distribution
• Solid urea historically available between $90 to $200 per ton - depending on the price of natural gas.
• Some fluctuations in price also occur due to supply and demand not matching
• Assumed an average basket price of urea between 2001-2003 with a normal distribution
• It is assumed that urea melt will be available at 85% of the price of solid urea in the open market.
• Cost estimates to produce aqueous urea assume capital investment (CI) requirements for storage, material handling, storage in UST/AST, heating requirements, dispensing, systems integration, installation and annual operating cost (AOC).
• The cost of urea presented in $/gal includes AOC and CI amortized using a capital recovery period of 2-3 years and a cost of capital of 12 %
• Assumed a uniform distribution in costs based on size of installation and capital recovery factor of 2-3 years
• Assumed a uniform distribution of prices for typical solid/liquid commodity transportation and distribution

43D5197 7647
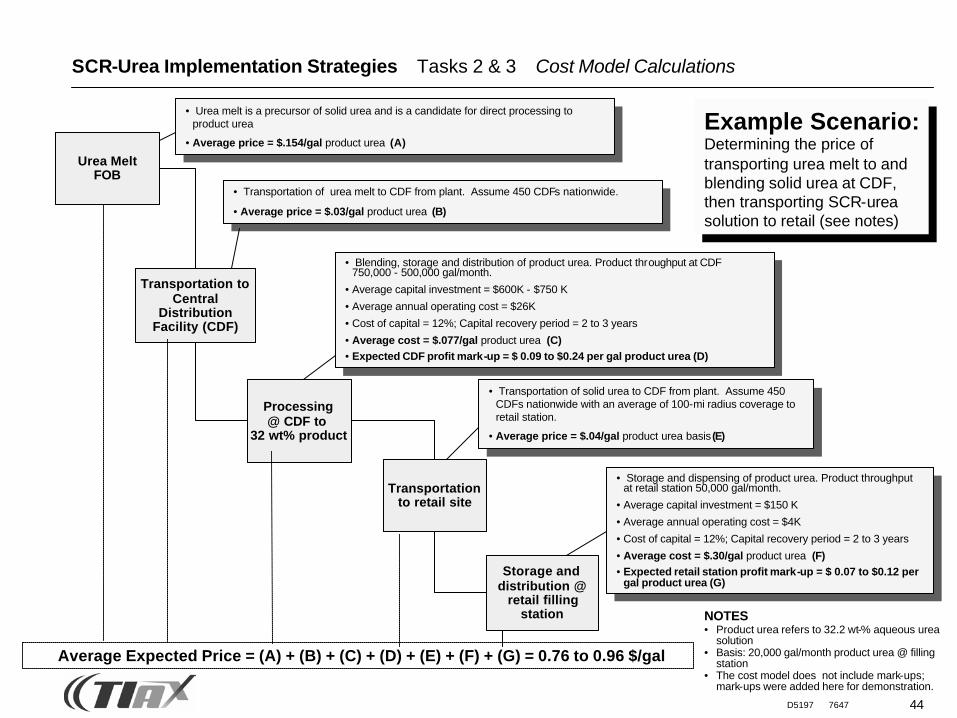
SCR-Urea Implementation Strategies Tasks 2 & 3 Cost Model Calculations
Solid Urea FOB
Transportation toCentral
DistributionFacility (CDF)
Processing@ CDF to
32 wt% product
Transportationto retail site
Storage and distribution @
retail fillingstation
• Solid urea historically available between $90 to $200 per ton - depending on the price of natural gas.
• Average price = $.181/gal product urea (A)
• Transportation of solid urea to CDF from plant. Assume 450 CDFs nationwide.
• Average price = $.015/gal product urea (B)
• Blending, storage and distribution of product urea. Product throughput at CDF 750,000 - 500,000 gal/month.
• Average capital investment = $900K - $1.2 MM
• Average annual operating cost = $31K
• Cost of capital = 12%; Capital recovery period = 2 to 3 years
• Average cost = $.087/gal product urea (C)• Expected CDF profit mark-up = $ 0.09 to $0.24 per gal product urea (D)
• Transportation of solid urea to CDF from plant. Assume 450 CDFs nationwide with an average of 100-mile radius coverage to retail station.
• Average price = $.04/gal product urea basis (E)
• Storage and dispensing of product urea. Product throughput at retail station 50,000 gal/month.
• Average capital investment = $150 K
• Average annual operating cost = $4K
• Cost of capital = 12%; Capital recovery period = 2 to 3 years
• Average cost = $.30/gal product urea (F)• Expected retail station profit mark-up = $ 0.07 to $0.12 per
gal product urea (G)
Average Expected Price = (A) + (B) + (C) + (D) + (E) + (F) + (G) = 0.78 to 0.98 $/gal
Example Scenario:Determining the price of transporting solid urea to and blending solid urea at CDF, then transporting SCR-urea solution to retail (see notes)
NOTES• Product urea refers to 32.2 wt-% aqueous urea
solution• Basis: 20,000 gal/month product urea @ filling
station• The cost model does not include mark-ups;
mark-ups were added here for demonstration.
44D5197 7647
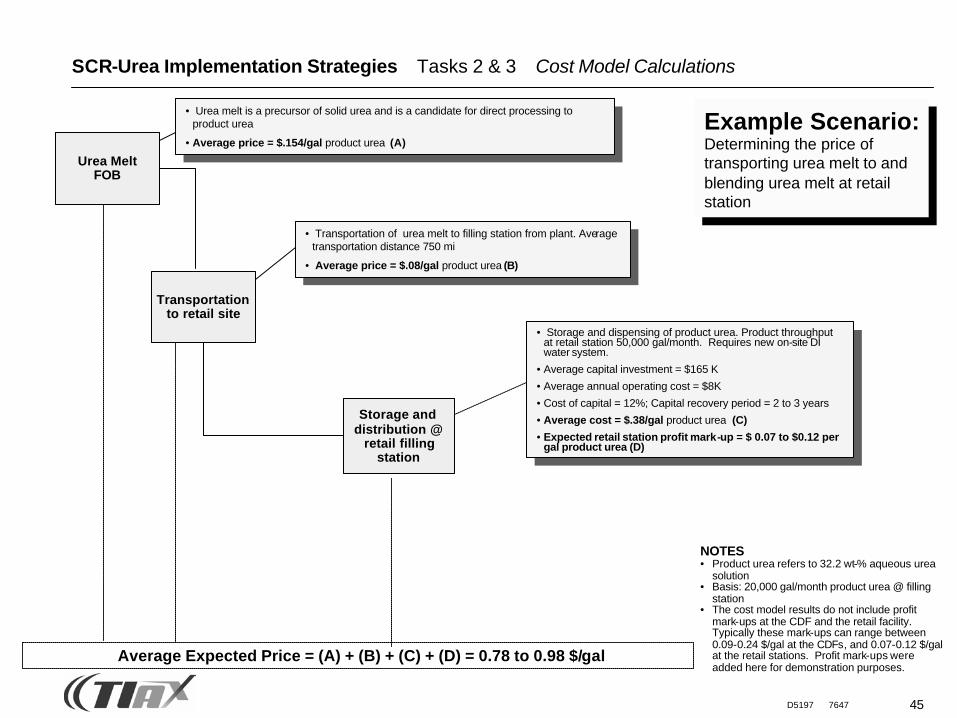
SCR-Urea Implementation Strategies Tasks 2 & 3 Cost Model Calculations
Urea Melt FOB
Transportation toCentral
DistributionFacility (CDF)
Processing@ CDF to
32 wt% product
Transportationto retail site
Storage and distribution @
retail fillingstation
• Urea melt is a precursor of solid urea and is a candidate for direct processing to product urea
• Average price = $.154/gal product urea (A)
• Transportation of urea melt to CDF from plant. Assume 450 CDFs nationwide.
• Average price = $.03/gal product urea (B)
• Blending, storage and distribution of product urea. Product throughput at CDF 750,000 - 500,000 gal/month.
• Average capital investment = $600K - $750 K
• Average annual operating cost = $26K
• Cost of capital = 12%; Capital recovery period = 2 to 3 years
• Average cost = $.077/gal product urea (C)• Expected CDF profit mark-up = $ 0.09 to $0.24 per gal product urea (D)
• Transportation of solid urea to CDF from plant. Assume 450 CDFs nationwide with an average of 100-mi radius coverage to retail station.
• Average price = $.04/gal product urea basis (E)
• Storage and dispensing of product urea. Product throughput at retail station 50,000 gal/month.
• Average capital investment = $150 K
• Average annual operating cost = $4K
• Cost of capital = 12%; Capital recovery period = 2 to 3 years
• Average cost = $.30/gal product urea (F)• Expected retail station profit mark-up = $ 0.07 to $0.12 per
gal product urea (G)
Average Expected Price = (A) + (B) + (C) + (D) + (E) + (F) + (G) = 0.76 to 0.96 $/gal
Example Scenario:Determining the price of transporting urea melt to and blending solid urea at CDF, then transporting SCR-urea solution to retail (see notes)
NOTES• Product urea refers to 32.2 wt-% aqueous urea
solution• Basis: 20,000 gal/month product urea @ filling
station• The cost model does not include mark-ups;
mark-ups were added here for demonstration.
45D5197 7647
SCR-Urea Implementation Strategies Tasks 2 & 3 Cost Model Calculations
Urea Melt FOB
Transportationto retail site
Storage and distribution @
retail fillingstation
• Urea melt is a precursor of solid urea and is a candidate for direct processing to product urea
• Average price = $.154/gal product urea (A)
• Transportation of urea melt to filling station from plant. Average transportation distance 750 mi
• Average price = $.08/gal product urea (B)
• Storage and dispensing of product urea. Product throughput at retail station 50,000 gal/month. Requires new on-site DI water system.
• Average capital investment = $165 K
• Average annual operating cost = $8K
• Cost of capital = 12%; Capital recovery period = 2 to 3 years
• Average cost = $.38/gal product urea (C)
• Expected retail station profit mark-up = $ 0.07 to $0.12 per gal product urea (D)
Average Expected Price = (A) + (B) + (C) + (D) = 0.78 to 0.98 $/gal
Example Scenario:Determining the price of transporting urea melt to and blending urea melt at retail station
NOTES• Product urea refers to 32.2 wt-% aqueous urea
solution• Basis: 20,000 gal/month product urea @ filling
station• The cost model results do not include profit
mark-ups at the CDF and the retail facility. Typically these mark-ups can range between 0.09-0.24 $/gal at the CDFs, and 0.07-0.12 $/gal at the retail stations. Profit mark-ups were added here for demonstration purposes.
46D5197 7647
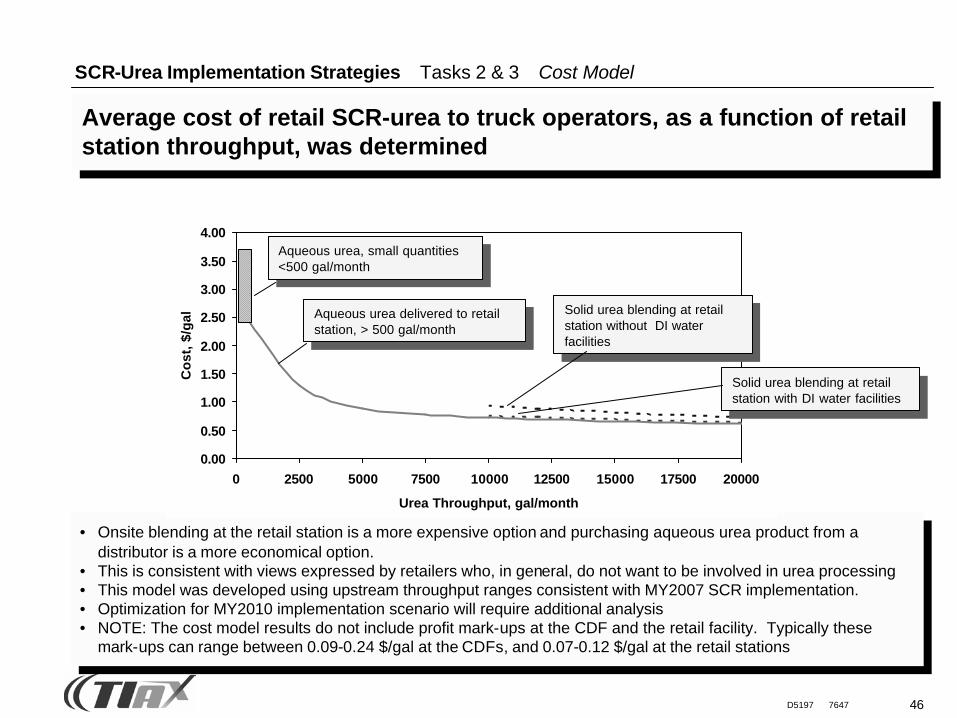
SCR-Urea Implementation Strategies Tasks 2 & 3 Cost Model
Average cost of retail SCR-urea to truck operators, as a function of retail station throughput, was determined
• Onsite blending at the retail station is a more expensive option and purchasing aqueous urea product from a distributor is a more economical option.
• This is consistent with views expressed by retailers who, in general, do not want to be involved in urea processing• This model was developed using upstream throughput ranges consistent with MY2007 SCR implementation.• Optimization for MY2010 implementation scenario will require additional analysis• NOTE: The cost model results do not include profit mark-ups at the CDF and the retail facility. Typically these
mark-ups can range between 0.09-0.24 $/gal at the CDFs, and 0.07-0.12 $/gal at the retail stations
0.00
0.50
1.00
1.50
2.00
2.50
3.00
3.50
4.00
0 2500 5000 7500 10000 12500 15000 17500 20000
Urea Throughput, gal/month
Co
st, $
/gal
Aqueous urea, small quantities <500 gal/month
Aqueous urea delivered to retail station, > 500 gal/month
Solid urea blending at retail station without DI water facilities
Solid urea blending at retail station with DI water facilities
47D5197 7647
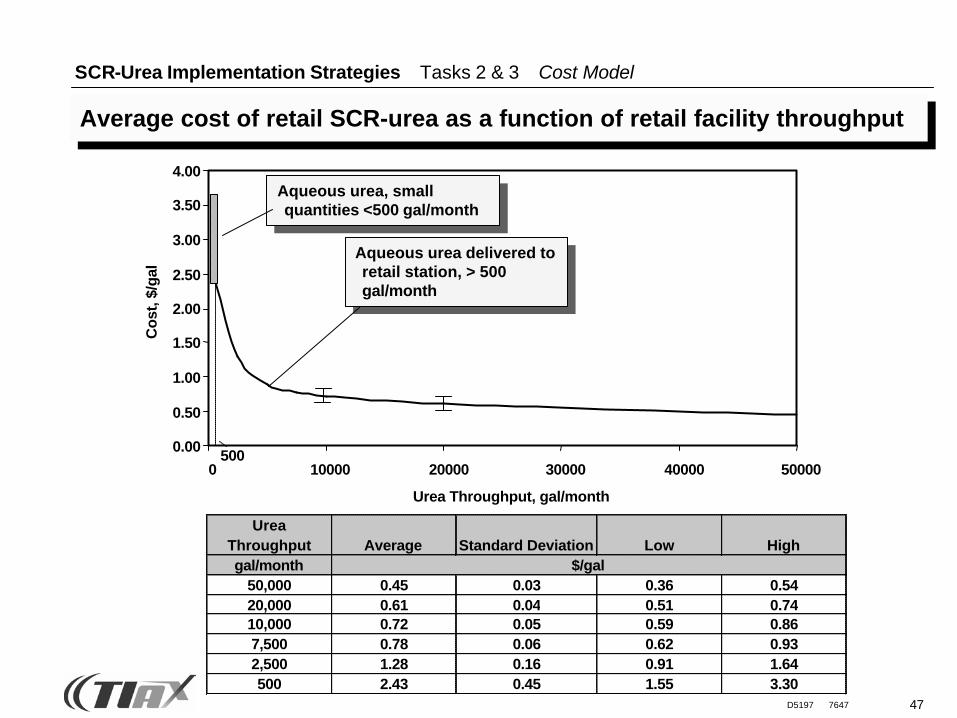
SCR-Urea Implementation Strategies Tasks 2 & 3 Cost Model
Average cost of retail SCR-urea as a function of retail facility throughput
Aqueous urea delivered to retail station, > 500 gal/month
0.00
0.50
1.00
1.50
2.00
2.50
3.00
3.50
4.00
0 10000 20000 30000 40000 50000
Urea Throughput, gal/month
Cos
t, $/
gal
Aqueous urea, small quantities <500 gal/month
500
Urea Throughput Average Standard Deviation Low Highgal/month
50,000 0.45 0.03 0.36 0.5420,000 0.61 0.04 0.51 0.7410,000 0.72 0.05 0.59 0.867,500 0.78 0.06 0.62 0.932,500 1.28 0.16 0.91 1.64500 2.43 0.45 1.55 3.30
$/gal
48D5197 7647
SCR-Urea Implementation Strategies Tasks 2 & 3 Cost Model
0.00
0.50
1.00
1.50
2.00
2.50
3.00
3.50
4.00
0 10000 20000 30000 40000 50000
Urea Throughput, gal/month
Co
st, $
/gal
500
High Low High Low
50,000 - 20,000 A A
20,000 - 7,500 A A B A
7,500 - 2,500 B A C B
2,500 - 500 C B,C D C
< 500 D D D D
Urea Throughput gal/month
2007 2015
High Low High Low
50,000 - 20,000 0.41-0.60 0.41-0.60
20,000 - 7,500 0.60-0.74 0.60-0.74 0.60-0.74 0.60-0.74
7,500 - 2,500 0.74-1.28 0.74-1.28 0.74-1.28 0.74-1.28
2,500 - 500 1.28-2.43 1.28-2.43 1.28-2.43 1.28-2.43
< 500 2.43-3.7 2.43-3.7 2.43-3.7 2.43-3.7
Urea Throughput gal/month
2007 2015
The cost model results do not include profitmark-ups at the CDF and the retail facility.Typically these mark-ups can range between 0.09-0.24 $/gal at the CDFs, and 0.07-0.12 $/gal at the retail stations
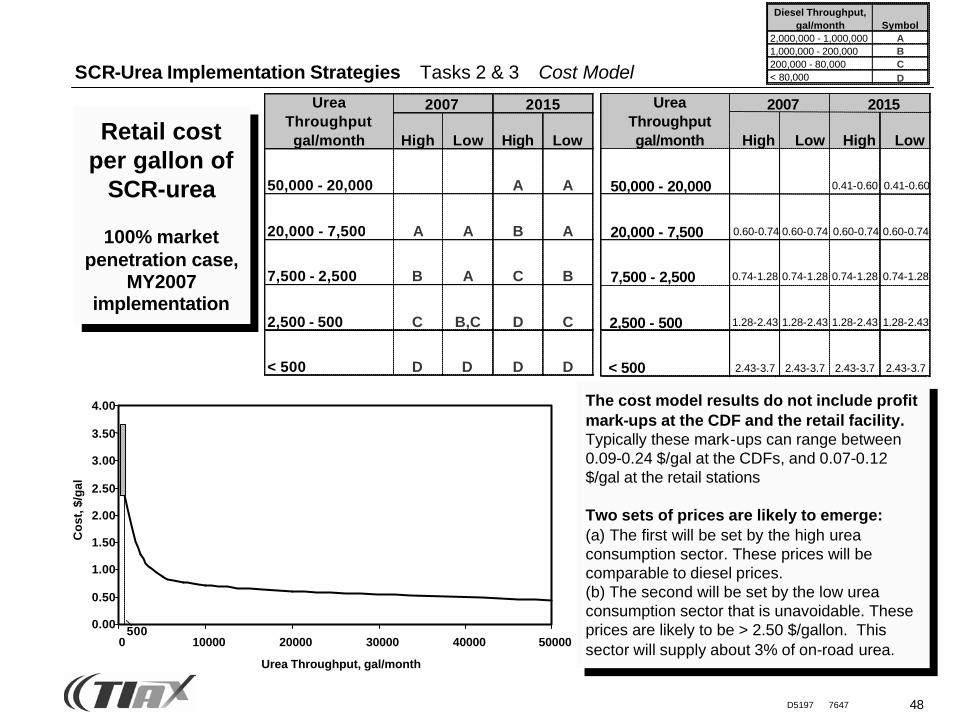
Two sets of prices are likely to emerge:(a) The first will be set by the high urea consumption sector. These prices will be comparable to diesel prices.(b) The second will be set by the low urea consumption sector that is unavoidable. These prices are likely to be > 2.50 $/gallon. This sector will supply about 3% of on-road urea.
Retail cost per gallon of
SCR-urea
100% market penetration case,
MY2007 implementation
Diesel Throughput, gal/month Symbol
2,000,000 - 1,000,000 A1,000,000 - 200,000 B200,000 - 80,000 C< 80,000 D
49D5197 7647
SCR-Urea Implementation Strategies Tasks 2 & 3 Cost Model
0.00
0.50
1.00
1.50
2.00
2.50
3.00
3.50
4.00
0 10000 20000 30000 40000 50000
Urea Throughput, gal/month
Co
st, $
/gal
500
High Low High Low
50,000 - 20,000 0.41-0.60
20,000 - 7,500 0.60-0.74 0.60-0.74 0.60-0.74
7,500 - 2,500 0.74-1.28 0.74-1.28 0.74-1.28 0.74-1.28
2,500 - 500 1.28-2.43 1.28-2.43 1.28-2.43 1.28-2.43
< 500 2.43-3.7 2.43-3.7 2.43-3.7 2.43-3.7
Urea Throughput gal/month
2007 2015
High Low High Low
50,000 - 20,000 A
20,000 - 7,500 A B A
7,500 - 2,500 B A C A
2,500 - 500 C B C B,C
< 500 D C,D D D
Urea Throughput gal/month
2007 2015
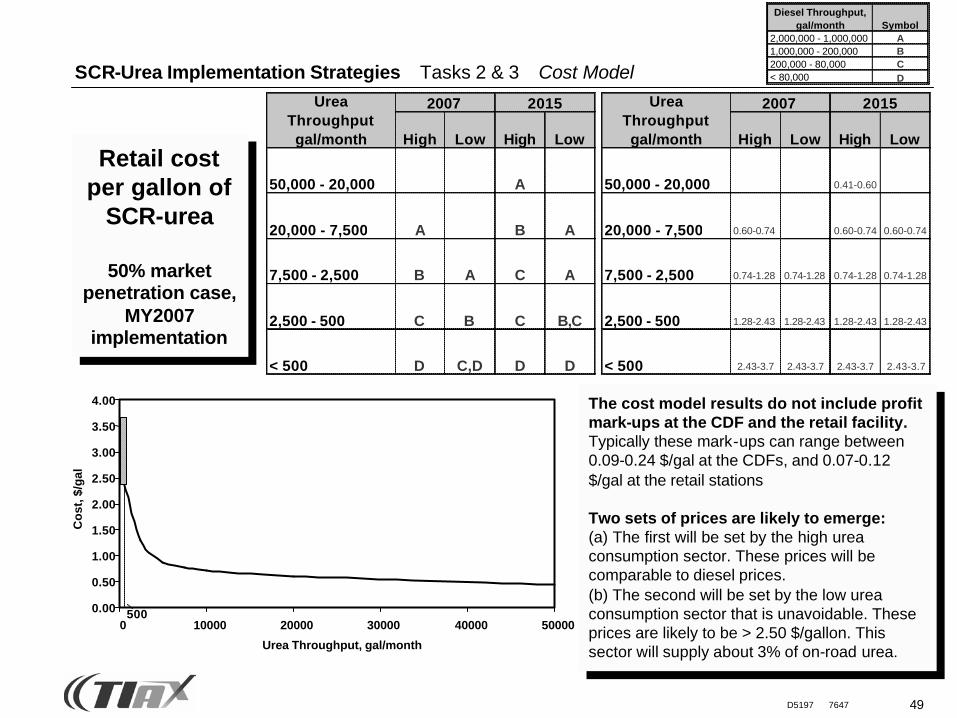
The cost model results do not include profit mark-ups at the CDF and the retail facility.Typically these mark-ups can range between 0.09-0.24 $/gal at the CDFs, and 0.07-0.12 $/gal at the retail stations
Two sets of prices are likely to emerge:(a) The first will be set by the high urea consumption sector. These prices will be comparable to diesel prices.(b) The second will be set by the low urea consumption sector that is unavoidable. These prices are likely to be > 2.50 $/gallon. This sector will supply about 3% of on-road urea.
Retail cost per gallon of
SCR-urea
50% market penetration case,
MY2007 implementation
Diesel Throughput, gal/month Symbol
2,000,000 - 1,000,000 A1,000,000 - 200,000 B200,000 - 80,000 C< 80,000 D
50D5197 7647
0.00
0.50
1.00
1.50
2.00
2.50
3.00
3.50
4.00
4.50
A B C D
Ure
a C
ost
($/
gal
lon
)
2007 (100% market penetration)
2015 (100% market penetration)
Current average diesel price in U.S.
Current Fleetguard price for 55 gallon drum
stations with greater than1 million gallons of diesel
per month
stations with 200,000 to1 million gallons of diesel
per month
stations with 80,000 to 200,000 gallons of diesel
per month
stations with less than 80,000 gallons of diesel
per month
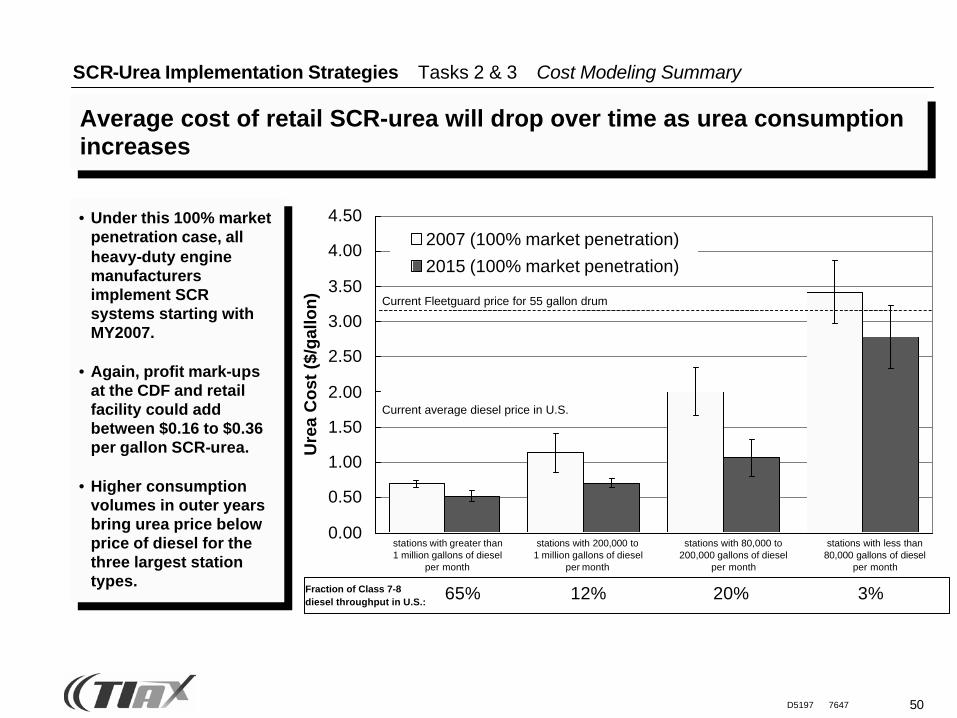
Fraction of Class 7-8 diesel throughput in U.S.:
65% 12% 20% 3%
SCR-Urea Implementation Strategies Tasks 2 & 3 Cost Modeling Summary
• Under this 100% market penetration case, all heavy-duty engine manufacturers implement SCR systems starting with MY2007.
• Again, profit mark-ups at the CDF and retail facility could add between $0.16 to $0.36 per gallon SCR-urea.
• Higher consumption volumes in outer years bring urea price below price of diesel for the three largest station types.
Average cost of retail SCR-urea will drop over time as urea consumption increases
51D5197 7647
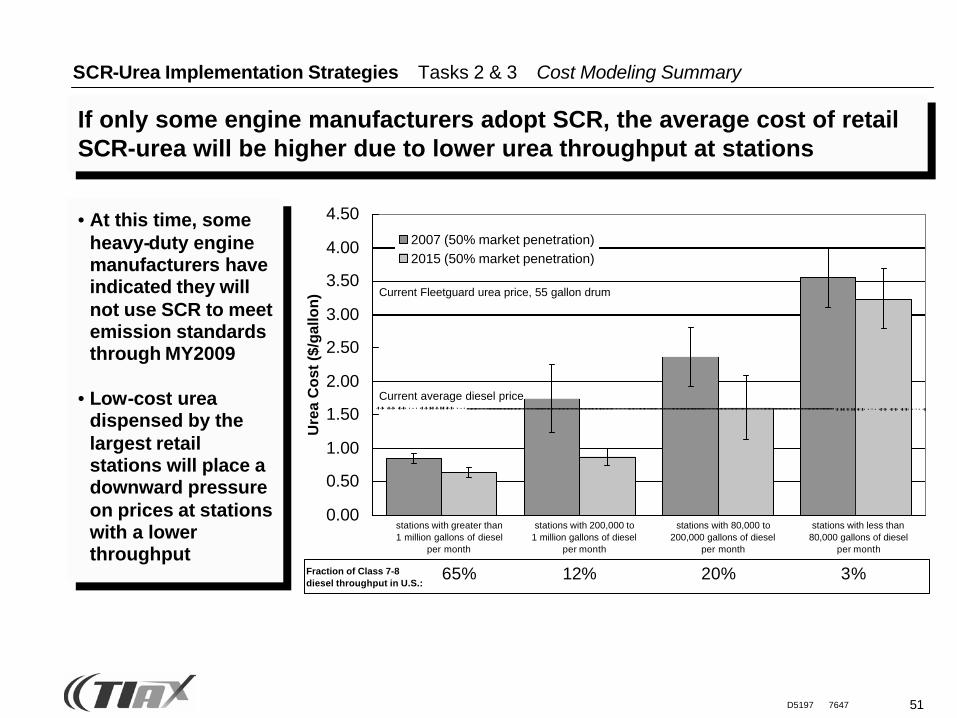
SCR-Urea Implementation Strategies Tasks 2 & 3 Cost Modeling Summary
• At this time, some heavy-duty engine manufacturers have indicated they will not use SCR to meet emission standards through MY2009
• Low-cost urea dispensed by the largest retail stations will place a downward pressure on prices at stations with a lower throughput
If only some engine manufacturers adopt SCR, the average cost of retail SCR-urea will be higher due to lower urea throughput at stations
0.00
0.50
1.00
1.50
2.00
2.50
3.00
3.50
4.00
4.50
A B C D
Ure
a C
ost
($/g
allo
n)
2007 (50% market penetration)2015 (50% market penetration)
Current average diesel price
Current Fleetguard urea price, 55 gallon drum
stations with greater than1 million gallons of diesel
per month
stations with 200,000 to1 million gallons of diesel
per month
stations with 80,000 to 200,000 gallons of diesel
per month
stations with less than 80,000 gallons of diesel
per month
Fraction of Class 7-8 diesel throughput in U.S.:
65% 12% 20% 3%
52D5197 7647
SCR-Urea Implementation Strategies Tasks 2 & 3 Cost Modeling Summary
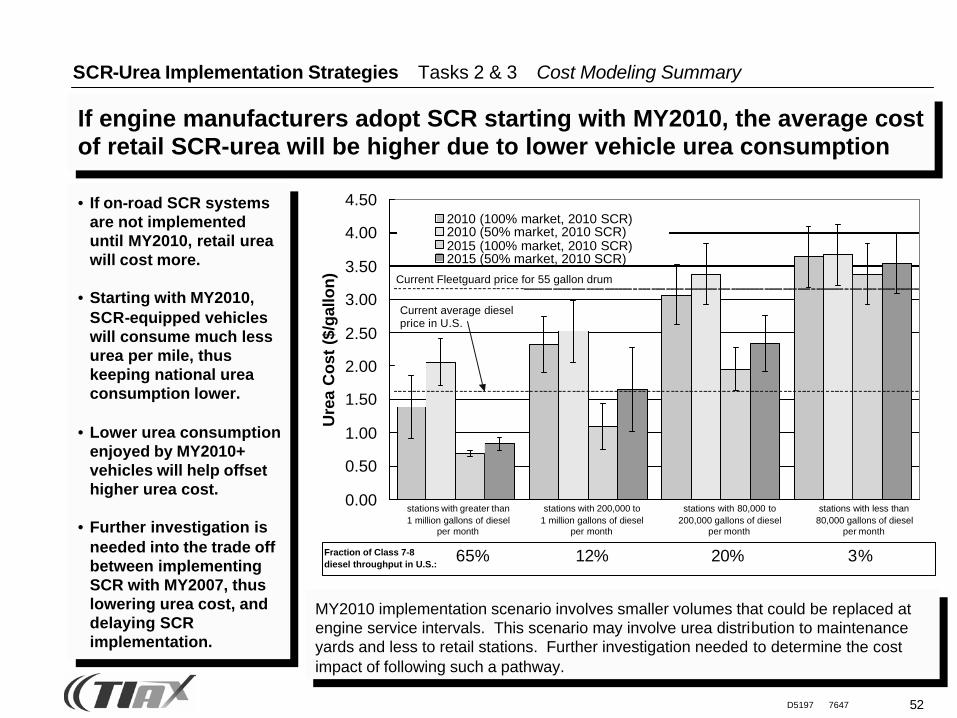
• If on-road SCR systems are not implemented until MY2010, retail urea will cost more.
• Starting with MY2010, SCR-equipped vehicles will consume much less urea per mile, thus keeping national urea consumption lower.
• Lower urea consumption enjoyed by MY2010+ vehicles will help offset higher urea cost.
• Further investigation is needed into the trade off between implementing SCR with MY2007, thus lowering urea cost, and delaying SCR implementation.
If engine manufacturers adopt SCR starting with MY2010, the average cost of retail SCR-urea will be higher due to lower vehicle urea consumption
0.00
0.50
1.00
1.50
2.00
2.50
3.00
3.50
4.00
4.50
0 0 0 0
Ure
a C
ost
($/
gal
lon
)
2010 (100% market, 2010 SCR)2010 (50% market, 2010 SCR)2015 (100% market, 2010 SCR)2015 (50% market, 2010 SCR)
Current average diesel price in U.S.
Current Fleetguard price for 55 gallon drum
stations with greater than1 million gallons of diesel
per month
stations with 200,000 to1 million gallons of diesel
per month
stations with 80,000 to 200,000 gallons of diesel
per month
stations with less than 80,000 gallons of diesel
per month
Fraction of Class 7-8 diesel throughput in U.S.:
65% 12% 20% 3%
MY2010 implementation scenario involves smaller volumes that could be replaced at engine service intervals. This scenario may involve urea distribution to maintenance yards and less to retail stations. Further investigation needed to determine the cost impact of following such a pathway.
53D5197 7647
SCR-Urea Implementation Strategies Tasks 2 & 3 Cost Modeling Summary
Cost Model Summary
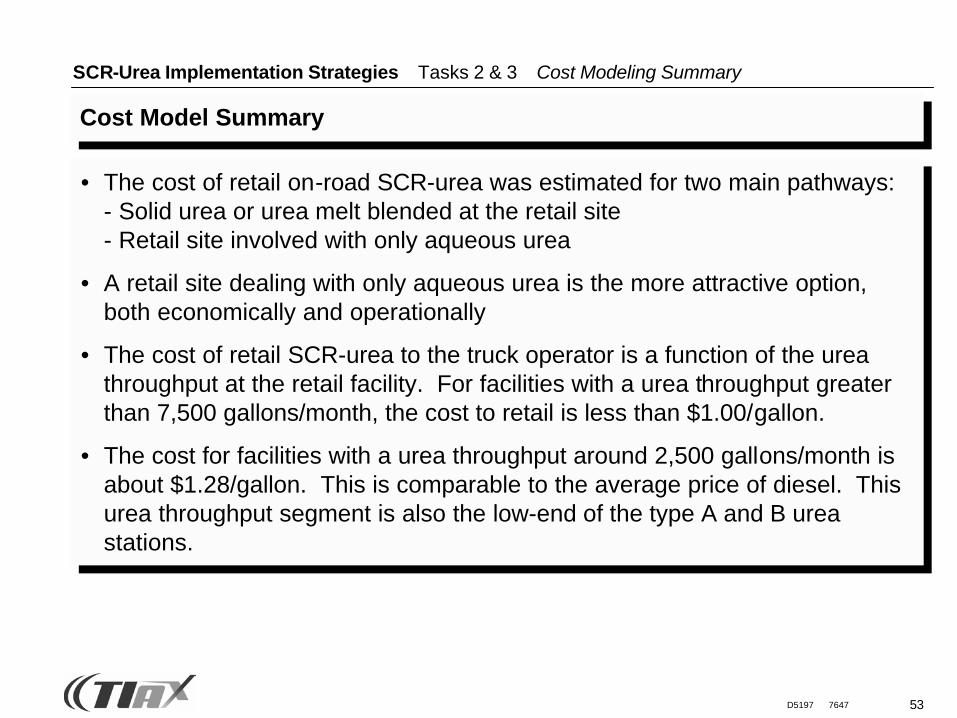
• The cost of retail on-road SCR-urea was estimated for two main pathways:- Solid urea or urea melt blended at the retail site - Retail site involved with only aqueous urea
• A retail site dealing with only aqueous urea is the more attractive option, both economically and operationally
• The cost of retail SCR-urea to the truck operator is a function of the urea throughput at the retail facility. For facilities with a urea throughput greater than 7,500 gallons/month, the cost to retail is less than $1.00/gallon.
• The cost for facilities with a urea throughput around 2,500 gallons/month is about $1.28/gallon. This is comparable to the average price of diesel. This urea throughput segment is also the low-end of the type A and B urea stations.
54D5197 7647
SCR-Urea Implementation Strategies Tasks 2 & 3 Cost Modeling Summary
Cost Model Summary
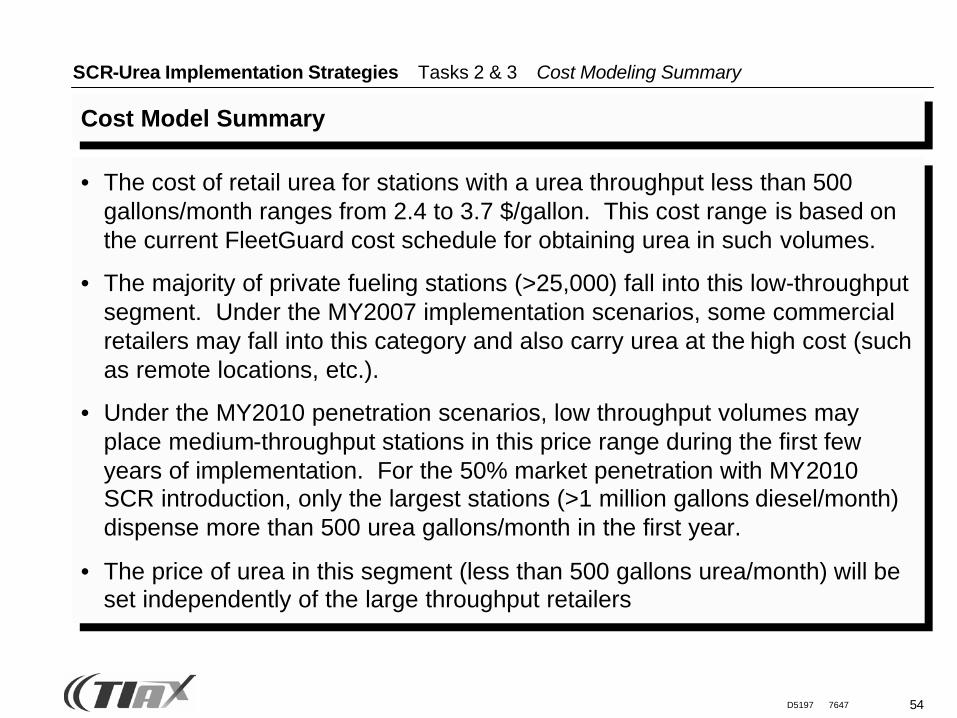
• The cost of retail urea for stations with a urea throughput less than 500 gallons/month ranges from 2.4 to 3.7 $/gallon. This cost range is based on the current FleetGuard cost schedule for obtaining urea in such volumes.
• The majority of private fueling stations (>25,000) fall into this low-throughput segment. Under the MY2007 implementation scenarios, some commercial retailers may fall into this category and also carry urea at the high cost (such as remote locations, etc.).
• Under the MY2010 penetration scenarios, low throughput volumes may place medium-throughput stations in this price range during the first few years of implementation. For the 50% market penetration with MY2010 SCR introduction, only the largest stations (>1 million gallons diesel/month) dispense more than 500 urea gallons/month in the first year.
• The price of urea in this segment (less than 500 gallons urea/month) will be set independently of the large throughput retailers
55D5197 7647
2 Task 1 — Determine Market Structure
3 Task 2 — Urea Cost Model Framework
1 Project Overview
4 Task 3 — SCR Urea Cost Model
SCR-Urea Implementation Strategies Agenda
5 Task 4 — Critical Path Analysis
7 Conclusions
8 Next Steps
6 Task 5 — Potential Business Cases
56D5197 7647
SCR-Urea Implementation Strategies Tasks 4 Critical Path Analysis
Critical Path Analysis Approach (for MY2007 implementation)
• Identify key requirements of implementing a urea infrastructure by 2007
• Identify availability of key requirements by 2007
• Identify key stakeholder issues with respect to requirements and availability
• Identify key milestones between now and 2007
• Identify critical path items
57D5197 7647
SCR-Urea Implementation Strategies Task 4 Critical Path Analysis: Key Infrastructure Issues
On-road SCR-urea production status, requirements, and availability
• Significant domestic and international urea production capacity exists
• Currently, world urea production capacity is under-utilized
• The expected on-road SCR-urea demand, between 0.5 and 1.7 MM tons per year under the full market MY2007 implementation scenario, can easily be met and most likely will be available through the existing commodity markets for urea
• It appears, based on limited European and U.S. experience, that commonly existing urea specifications can cover on-road SCR-urea specification requirements
• However, a common on-road SCR-urea standard specification must be communicated to urea-manufacturers immediately
58D5197 7647
SCR-Urea Implementation Strategies Task 4 Critical Path Analysis: Key Infrastructure Issues
On-road SCR-urea distribution status, requirements, and availability
• Currently, the main commercial distribution network for urea is in the agricultural sector, with over 1,200 petroleum and agricultural distribution terminals.
• Some urea is currently distributed in the U.S. for stationary SCR/SNCR applications; however, these volumes are low.
• Urea CDFs will be operated by some of the existing players, including urea manufacturers, petroleum companies, and jobbers.
• Some new entrants with stakes in the value chain, such as FleetGuard, will also appear.
59D5197 7647
SCR-Urea Implementation Strategies Task 4 Critical Path Analysis: Key Infrastructure Issues
On-road SCR-urea distribution status, requirements, and availability
• Between 250-500 CDFs are expected to develop for on-road SCR-urea*
– Distribution centers will range in function from plants that operate as CDFs to brokering facilities that are just resellers
– Infrastructure requirements will depend on the function of the facility
– The more complex facilities will have solids handling and liquidblending operations
– All CDFs will require storage and dispensing facilities
• Depending on the urea specification, a few hundred dedicated SCR-urea tanker-trucks will be required
– Some of these tankers will need heaters
– Our discussions with agricultural urea distributors did not reveal this to be a big hurdle
* Under the MY2010 implementation scenarios, lower volumes projected may lead to fewer CDFs
60D5197 7647
SCR-Urea Implementation Strategies Task 4 Critical Path Analysis: Key Infrastructure Issues
Tanks and auxiliary equipment status, requirements, and availability
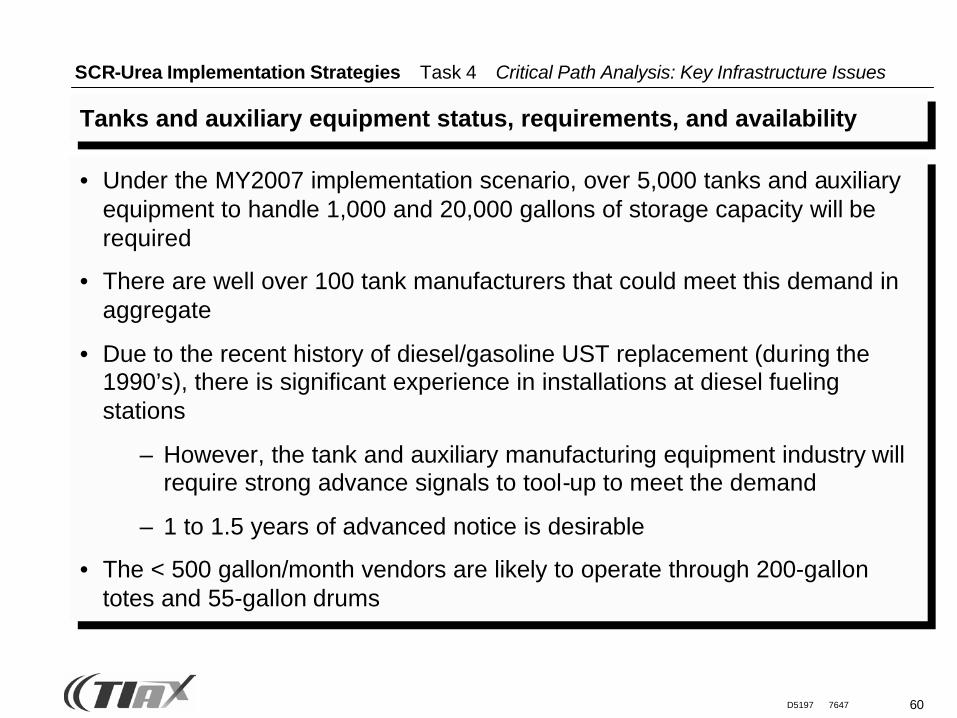
• Under the MY2007 implementation scenario, over 5,000 tanks and auxiliary equipment to handle 1,000 and 20,000 gallons of storage capacity will be required
• There are well over 100 tank manufacturers that could meet this demand in aggregate
• Due to the recent history of diesel/gasoline UST replacement (during the 1990’s), there is significant experience in installations at diesel fueling stations
– However, the tank and auxiliary manufacturing equipment industry will require strong advance signals to tool-up to meet the demand
– 1 to 1.5 years of advanced notice is desirable
• The < 500 gallon/month vendors are likely to operate through 200-gallon totes and 55-gallon drums
61D5197 7647
SCR-Urea Implementation Strategies Task 4 Critical Path Analysis: Key Infrastructure Issues
Dispensing equipment and systems status, requirements, and availability
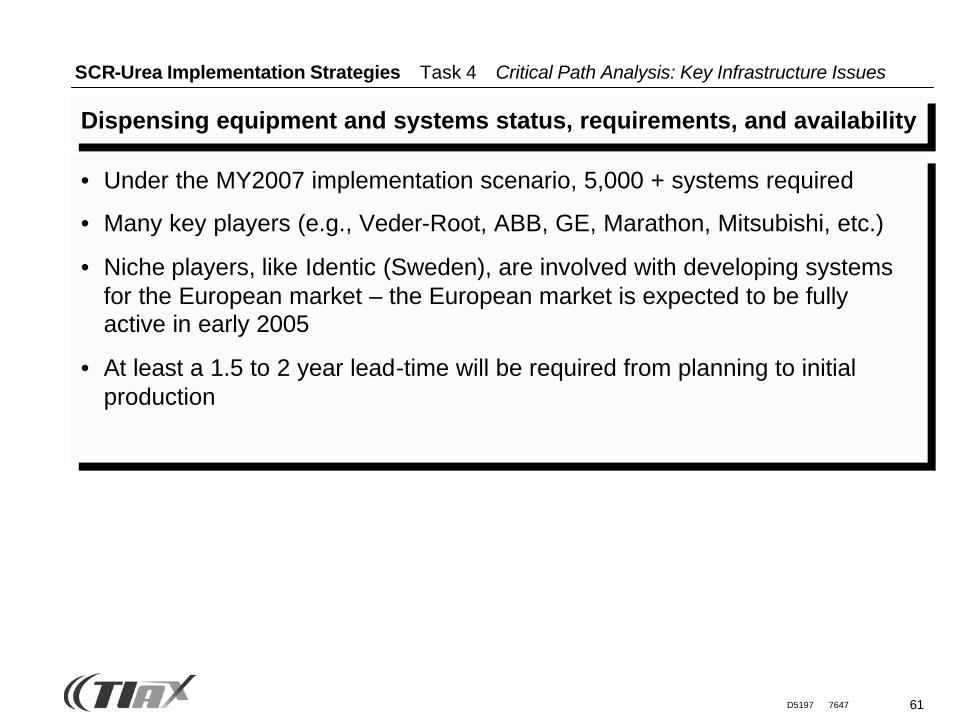
• Under the MY2007 implementation scenario, 5,000 + systems required
• Many key players (e.g., Veder-Root, ABB, GE, Marathon, Mitsubishi, etc.)
• Niche players, like Identic (Sweden), are involved with developing systems for the European market – the European market is expected to be fully active in early 2005
• At least a 1.5 to 2 year lead-time will be required from planning to initial production
62D5197 7647
SCR-Urea Implementation Strategies Task 4 Critical Path Analysis: Key Infrastructure Issues
Financing requirements
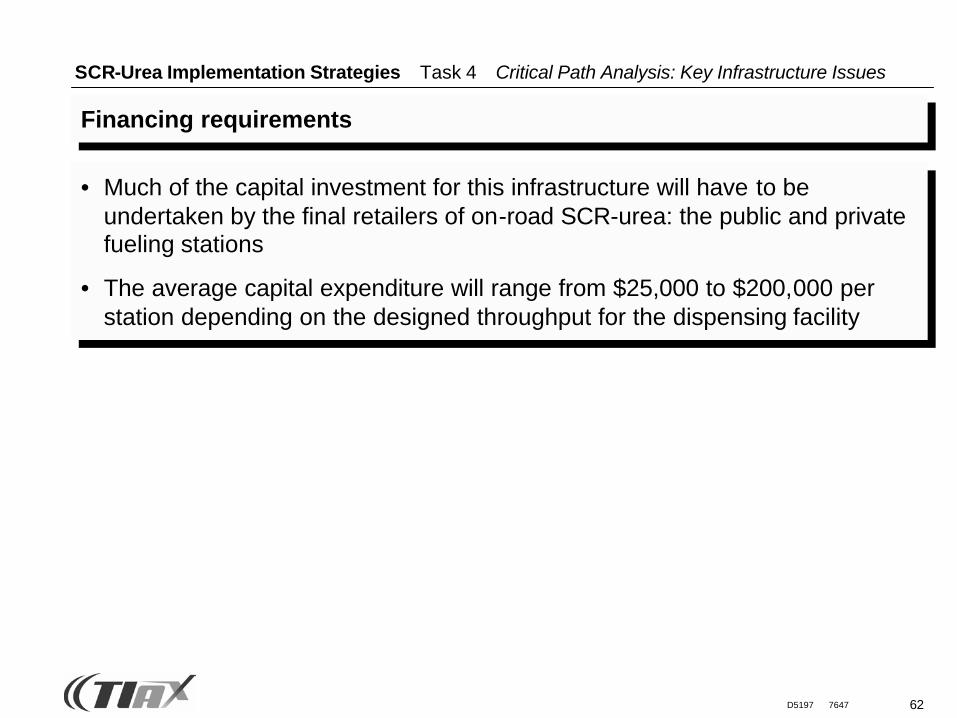
• Much of the capital investment for this infrastructure will have to be undertaken by the final retailers of on-road SCR-urea: the public and private fueling stations
• The average capital expenditure will range from $25,000 to $200,000 per station depending on the designed throughput for the dispensing facility
63D5197 7647
SCR-Urea Implementation Strategies Task 4 Critical Path Analysis: Key Issues Summary
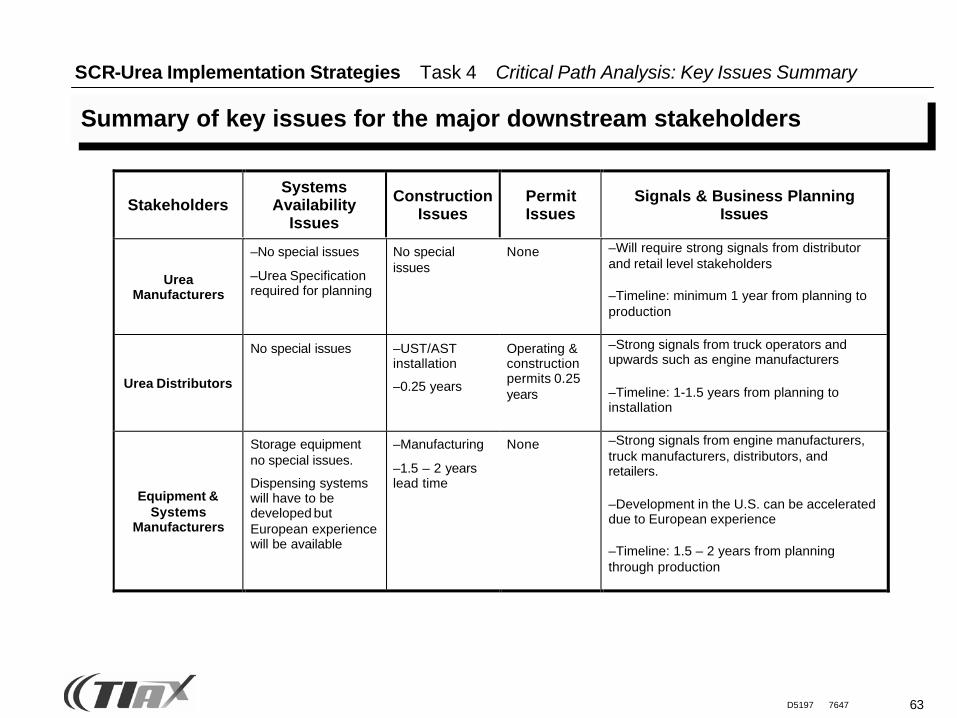
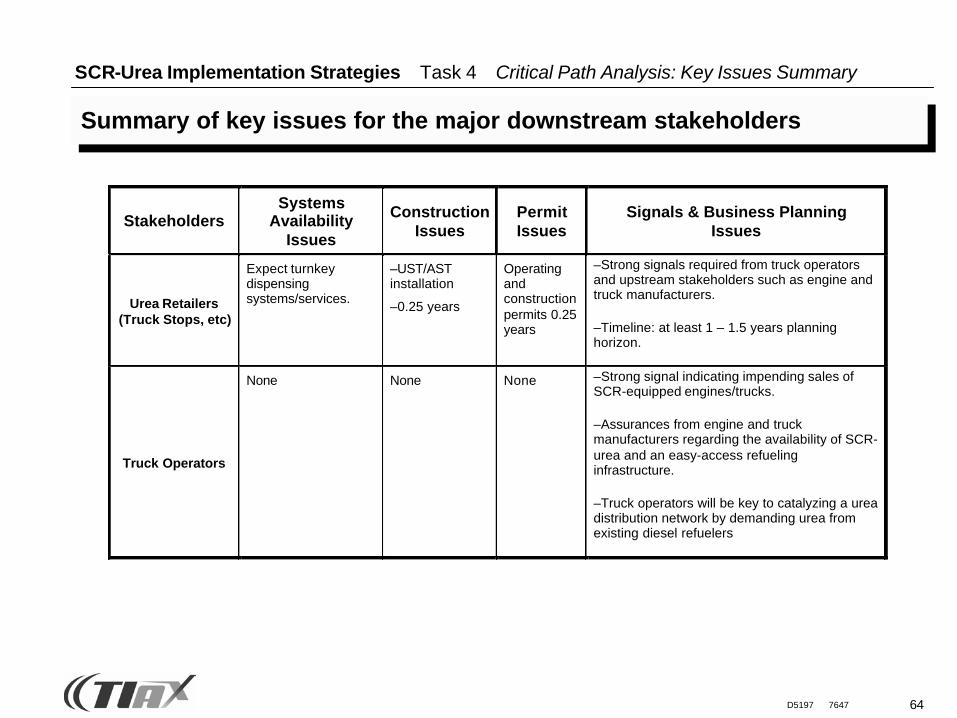
Summary of key issues for the major downstream stakeholders
StakeholdersSystems
AvailabilityIssues
ConstructionIssues
PermitIssues
Signals & Business PlanningIssues
UreaManufacturers
–No special issues
–Urea Specificationrequired for planning
No specialissues
None –Will require strong signals from distributorand retail level stakeholders
–Timeline: minimum 1 year from planning toproduction
Urea Distributors
No special issues –UST/ASTinstallation
–0.25 years
Operating &constructionpermits 0.25years
–Strong signals from truck operators andupwards such as engine manufacturers
–Timeline: 1-1.5 years from planning toinstallation
Equipment &Systems
Manufacturers
Storage equipmentno special issues.
Dispensing systemswill have to bedeveloped butEuropean experiencewill be available
–Manufacturing
–1.5 – 2 yearslead time
None –Strong signals from engine manufacturers,truck manufacturers, distributors, andretailers.
–Development in the U.S. can be accelerateddue to European experience
–Timeline: 1.5 – 2 years from planningthrough production
64D5197 7647
SCR-Urea Implementation Strategies Task 4 Critical Path Analysis: Key Issues Summary
Summary of key issues for the major downstream stakeholders
StakeholdersSystems
AvailabilityIssues
ConstructionIssues
PermitIssues
Signals & Business PlanningIssues
Urea Retailers(Truck Stops, etc)
Expect turnkeydispensingsystems/services.
–UST/ASTinstallation
–0.25 years
Operatingandconstructionpermits 0.25years
–Strong signals required from truck operatorsand upstream stakeholders such as engine andtruck manufacturers.
–Timeline: at least 1 – 1.5 years planninghorizon.
Truck Operators
None None None –Strong signal indicating impending sales ofSCR-equipped engines/trucks.
–Assurances from engine and truckmanufacturers regarding the availability of SCR-urea and an easy-access refuelinginfrastructure.
–Truck operators will be key to catalyzing a ureadistribution network by demanding urea fromexisting diesel refuelers
65D5197 7647
SCR-Urea Implementation Strategies Task 4 Critical Path Analysis
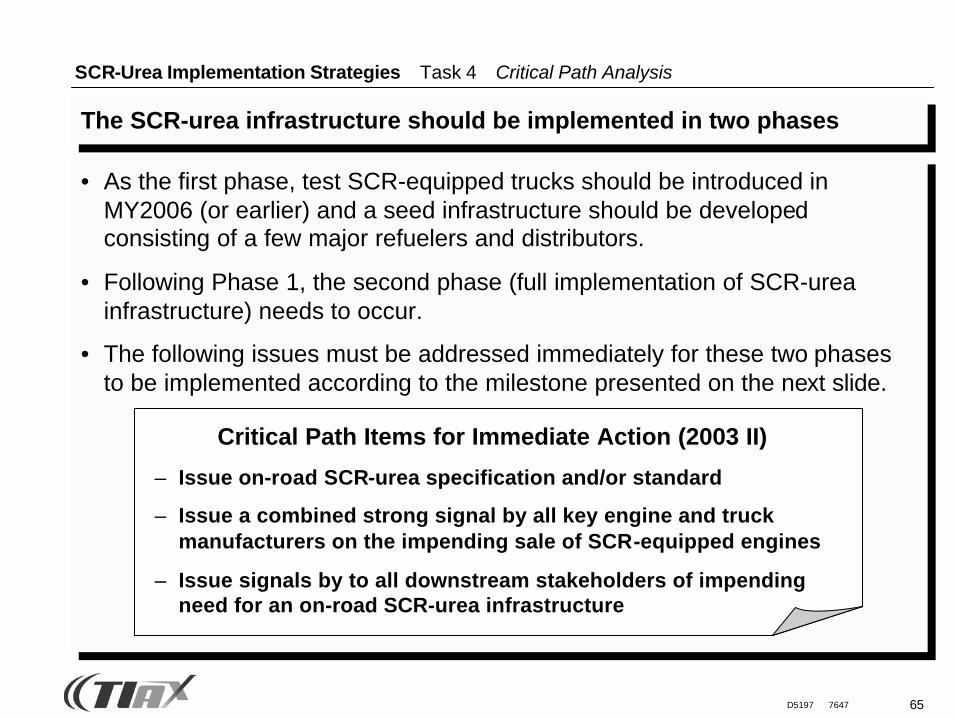
The SCR-urea infrastructure should be implemented in two phases
• As the first phase, test SCR-equipped trucks should be introduced in MY2006 (or earlier) and a seed infrastructure should be developed consisting of a few major refuelers and distributors.
• Following Phase 1, the second phase (full implementation of SCR-urea infrastructure) needs to occur.
• The following issues must be addressed immediately for these two phases to be implemented according to the milestone presented on the next slide.
Critical Path Items for Immediate Action (2003 II)
– Issue on-road SCR-urea specification and/or standard
– Issue a combined strong signal by all key engine and truck manufacturers on the impending sale of SCR-equipped engines
– Issue signals by to all downstream stakeholders of impending need for an on-road SCR-urea infrastructure
66D5197 7647
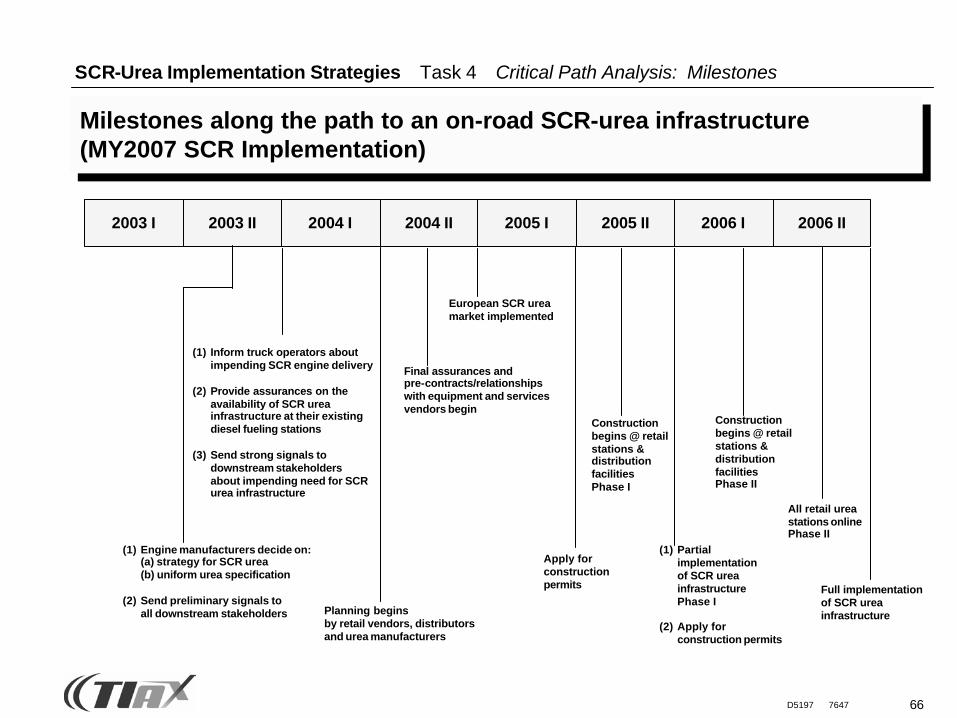
Milestones along the path to an on-road SCR-urea infrastructure (MY2007 SCR Implementation)
Full implementationof SCR urea infrastructure
2003 I 2003 II 2004 I 2004 II 2005 I 2005 II 2006 I 2006 II
All retail urea stations onlinePhase II
Construction begins @ retailstations &distributionfacilitiesPhase II
(1) Partialimplementationof SCR urea infrastructurePhase I
(2) Apply for construction permits
Construction begins @ retailstations &distributionfacilitiesPhase I
Apply for constructionpermits
Planning begins by retail vendors, distributorsand urea manufacturers
European SCR ureamarket implemented
Final assurances andpre-contracts/relationships with equipment and servicesvendors begin
(1) Inform truck operators aboutimpending SCR engine delivery
(2) Provide assurances on the availability of SCR urea infrastructure at their existingdiesel fueling stations
(3) Send strong signals to downstream stakeholdersabout impending need for SCRurea infrastructure
(1) Engine manufacturers decide on:(a) strategy for SCR urea(b) uniform urea specification
(2) Send preliminary signals to all downstream stakeholders
SCR-Urea Implementation Strategies Task 4 Critical Path Analysis: Milestones
67D5197 7647
2 Task 1 — Determine Market Structure
3 Task 2 — Urea Cost Model Framework
1 Project Overview
4 Task 3 — SCR Urea Cost Model
SCR-Urea Implementation Strategies Agenda
5 Task 4 — Critical Path Analysis
7 Conclusions
8 Next Steps
6 Task 5 — Potential Business Cases
68D5197 7647
SCR-Urea Implementation Strategies Task 5 Urea Implementation Strategies
Two key implementation strategies have been identified
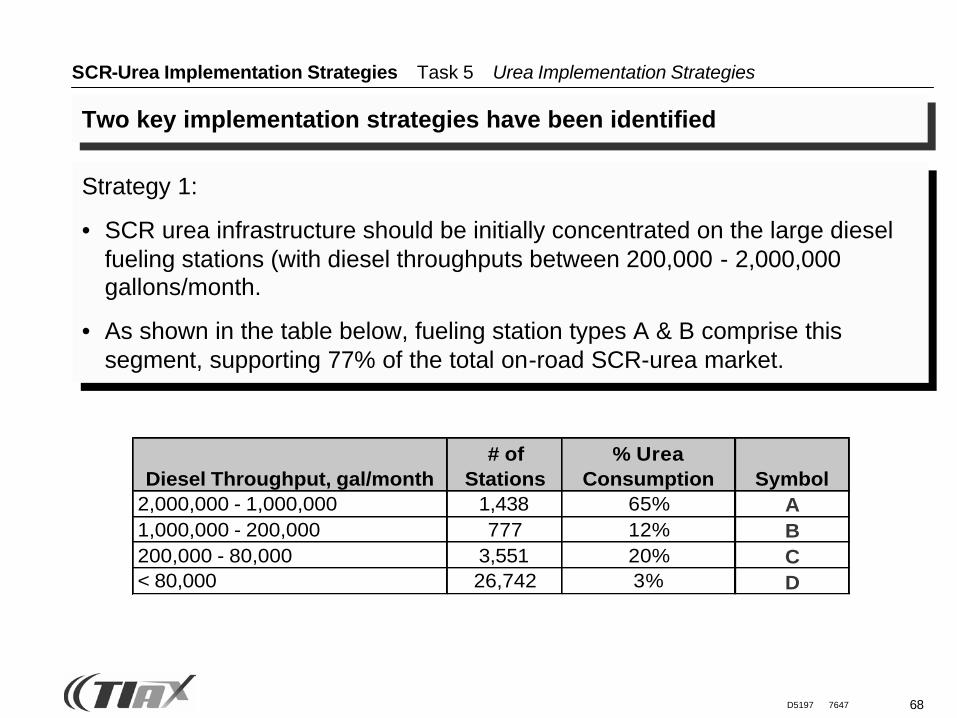
Diesel Throughput, gal/month# of
Stations% Urea
Consumption Symbol2,000,000 - 1,000,000 1,438 65% A1,000,000 - 200,000 777 12% B200,000 - 80,000 3,551 20% C< 80,000 26,742 3% D
Strategy 1:
• SCR urea infrastructure should be initially concentrated on the large diesel fueling stations (with diesel throughputs between 200,000 - 2,000,000 gallons/month.
• As shown in the table below, fueling station types A & B comprise this segment, supporting 77% of the total on-road SCR-urea market.
69D5197 7647
SCR-Urea Implementation Strategies Task 5 Urea Implementation Strategies
Two key implementation strategies have been identified
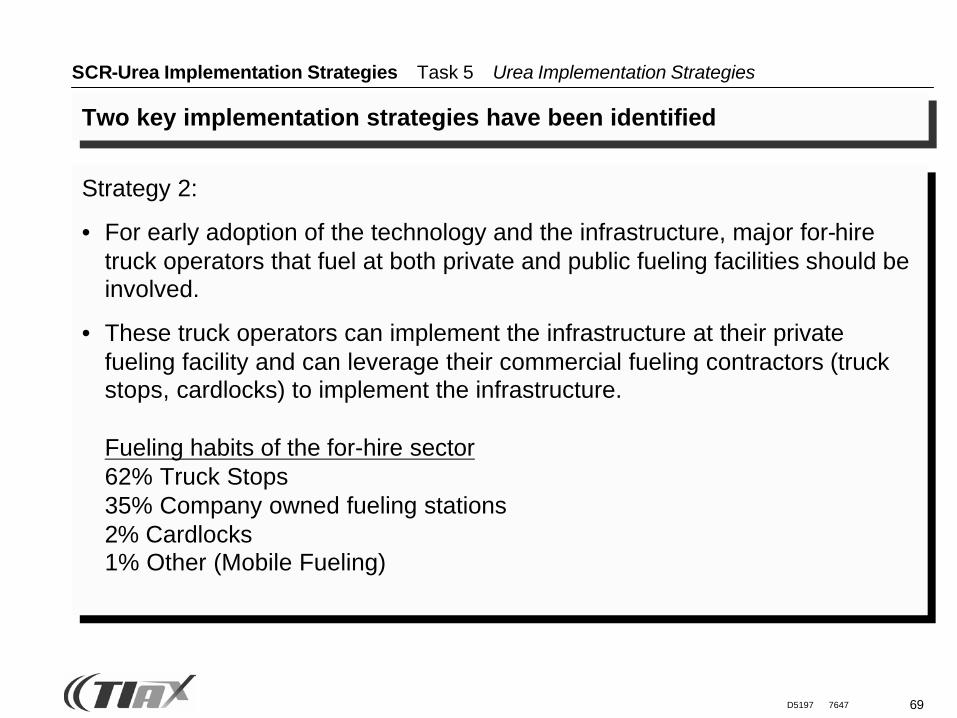
Strategy 2:
• For early adoption of the technology and the infrastructure, major for-hire truck operators that fuel at both private and public fueling facilities should be involved.
• These truck operators can implement the infrastructure at their private fueling facility and can leverage their commercial fueling contractors (truck stops, cardlocks) to implement the infrastructure.
Fueling habits of the for-hire sector62% Truck Stops35% Company owned fueling stations2% Cardlocks1% Other (Mobile Fueling)
70D5197 7647
SCR-Urea Implementation Strategies Task 5 Truck Economic Impact
Economic Impact on Truck Operations
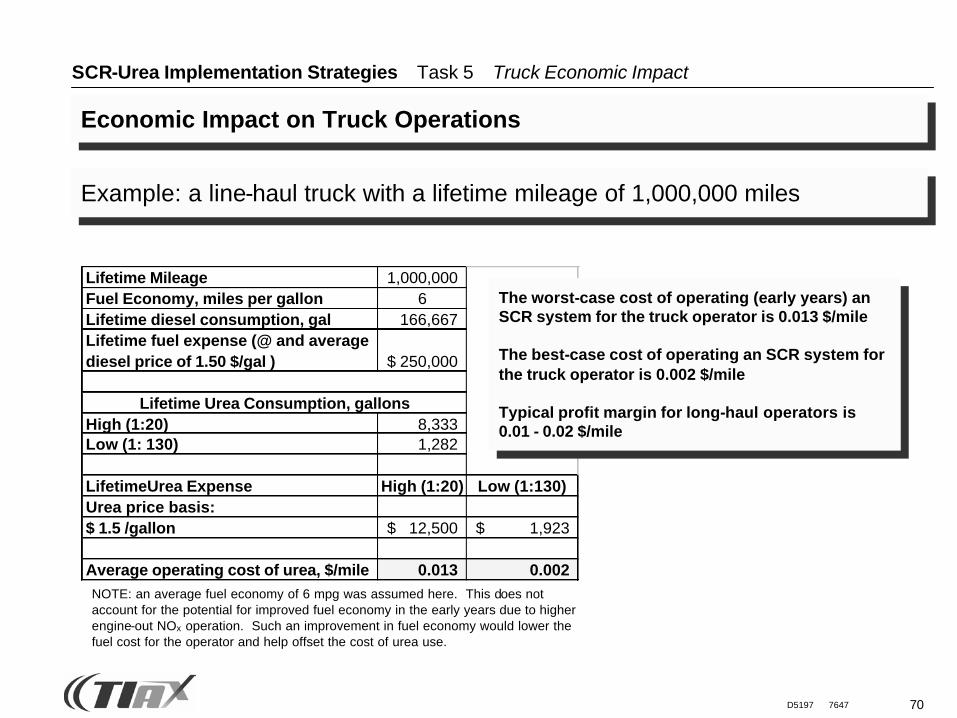
Lifetime Mileage 1,000,000Fuel Economy, miles per gallon 6Lifetime diesel consumption, gal 166,667 Lifetime fuel expense (@ and average diesel price of 1.50 $/gal ) 250,000$
High (1:20) 8,333 Low (1: 130) 1,282
LifetimeUrea Expense High (1:20) Low (1:130)Urea price basis: $ 1.5 /gallon 12,500$ 1,923$
Average operating cost of urea, $/mile 0.013 0.002
Lifetime Urea Consumption, gallons
Example: a line-haul truck with a lifetime mileage of 1,000,000 miles
The worst-case cost of operating (early years) an SCR system for the truck operator is 0.013 $/mile
The best-case cost of operating an SCR system for the truck operator is 0.002 $/mile
Typical profit margin for long-haul operators is 0.01 - 0.02 $/mile
NOTE: an average fuel economy of 6 mpg was assumed here. This does not account for the potential for improved fuel economy in the early years due to higher engine-out NOx operation. Such an improvement in fuel economy would lower thefuel cost for the operator and help offset the cost of urea use.
71D5197 7647
SCR-Urea Implementation Strategies Task 5 Competing Technology Trade-off Analysis
We compared the incremental lifetime cost of competing technology use with the lifetime cost of SCR use
• The incremental lifetime cost of competing technology use depends upon several parameters. These parameters and their assumed ranges are:– Lifetime mileage: 750,000 to 1,000,000 miles– Fuel economy: 4 mpg (vocational) to 8 mpg (line-haul and mid-range)– Diesel price per gallon: $1.45 to $2.00– Fuel penalty relative to SCR: 5% (later years) to 9% (early years)– Incremental initial competing technology cost: from $2,000 less than to
$2,000 more than the initial SCR cost
• The incremental lifetime cost of using the competing technology was then compared with the incremental lifetime cost of using SCR for various urea to diesel consumption ratios
• A break-even price was determined for on-road SCR-urea. The break-even price is the maximum SCR-urea price for which the incremental lifetime cost of using SCR is less than that of using another technology.
72D5197 7647
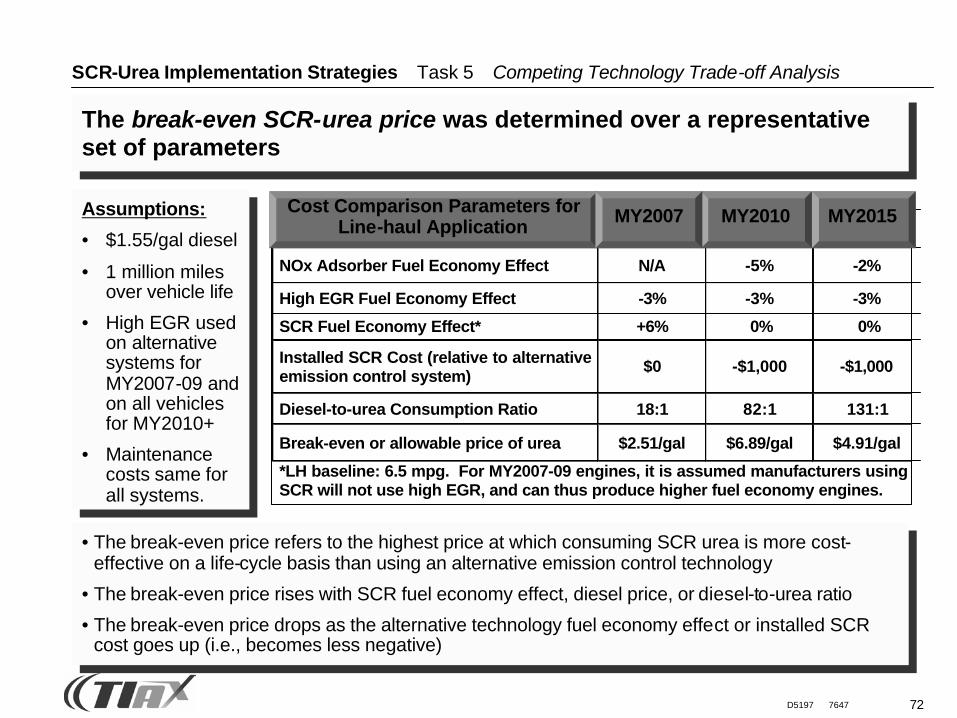
The break-even SCR-urea price was determined over a representative set of parameters
• The break-even price refers to the highest price at which consuming SCR urea is more cost-effective on a life-cycle basis than using an alternative emission control technology
• The break-even price rises with SCR fuel economy effect, diesel price, or diesel-to-urea ratio
• The break-even price drops as the alternative technology fuel economy effect or installed SCR cost goes up (i.e., becomes less negative)
SCR-Urea Implementation Strategies Task 5 Competing Technology Trade-off Analysis
2007 2010 2015NOx Adsorber Fuel Economy Effect N/A -5% -2%
High EGR Fuel Economy Effect -3% -3% -3%
SCR Fuel Economy Effect* +6% 0% 0%
Installed SCR Cost (relative to alternativeemission control system)
$0 -$1,000 -$1,000
Diesel-to-urea Consumption Ratio 18:1 82:1 131:1
Break-even or allowable price of urea $2.51/gal $6.89/gal $4.91/gal
*LH baseline: 6.5 mpg. For MY2007-09 engines, it is assumed manufacturers usingSCR will not use high EGR, and can thus produce higher fuel economy engines.
MY2010 MY2015Cost Comparison Parameters for Line-haul Application MY2007Assumptions:
• $1.55/gal diesel
• 1 million miles over vehicle life
• High EGR used on alternative systems for MY2007-09 and on all vehicles for MY2010+
• Maintenance costs same for all systems.
73D5197 7647
SCR-Urea Implementation Strategies Task 5 Competing Technology Trade-off Analysis
Break-even point rises with competing technology capital cost and diesel price
As shown, assumes aNear-term LH/MH scenario: 1 million miles,6.5 mpg,5% competing technology
fuel penalty, 20:1 urea to diesel ratio
For this set of assumptions, the break-even price is equal to diesel price when competing technology incremental capital cost is zero.
(2,000 (1,200) (400) 400 1,200 2,000$1.45
$1.60
$1.75
$1.90
Incremental Competing Technology Cost ($)
Diesel Price ($/gallon)
)$2.00 -$2.25 $1.75 -$2.00 $1.50 -$1.75 $1.25 -$1.50
Urea price ranges
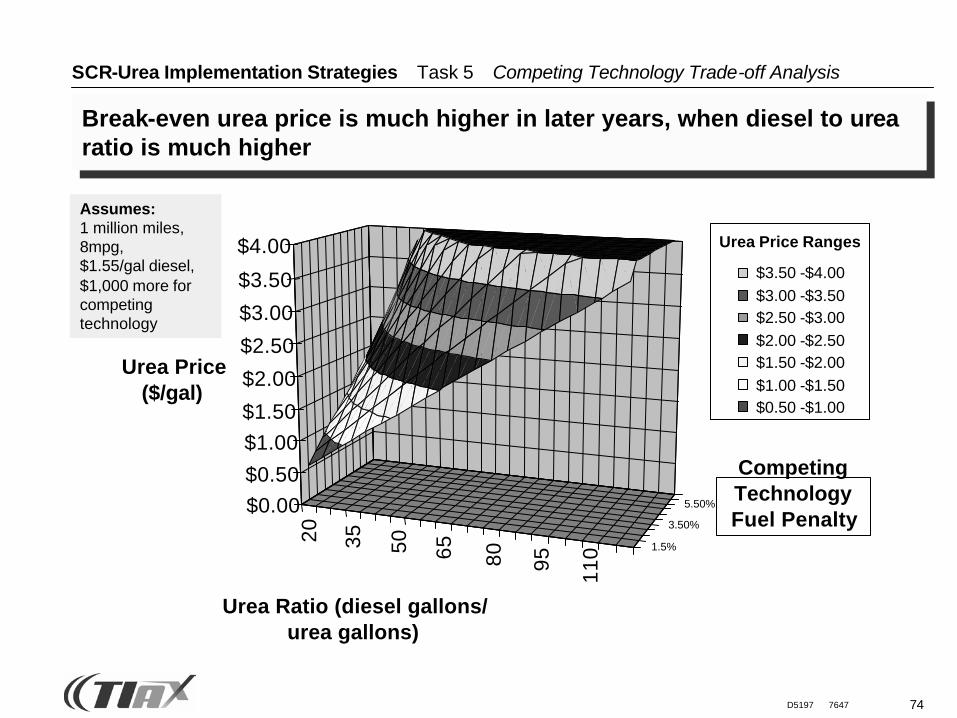
74D5197 7647
SCR-Urea Implementation Strategies Task 5 Competing Technology Trade-off Analysis
Break-even urea price is much higher in later years, when diesel to urea ratio is much higher
Assumes:1 million miles, 8mpg, $1.55/gal diesel, $1,000 more for competing technology
20 35 50 65 80 95 110 1.5%
3.50%
5.50%$0.00$0.50
$1.00$1.50
$2.00
$2.50
$3.00
$3.50
$4.00
Urea Price ($/gal)
Urea Ratio (diesel gallons/urea gallons)
NOx Adsorber
Competing Technology Fuel Penalty
$3.50 -$4.00 $3.00 -$3.50 $2.50 -$3.00 $2.00 -$2.50 $1.50 -$2.00 $1.00 -$1.50 $0.50 -$1.00
Urea Price Ranges
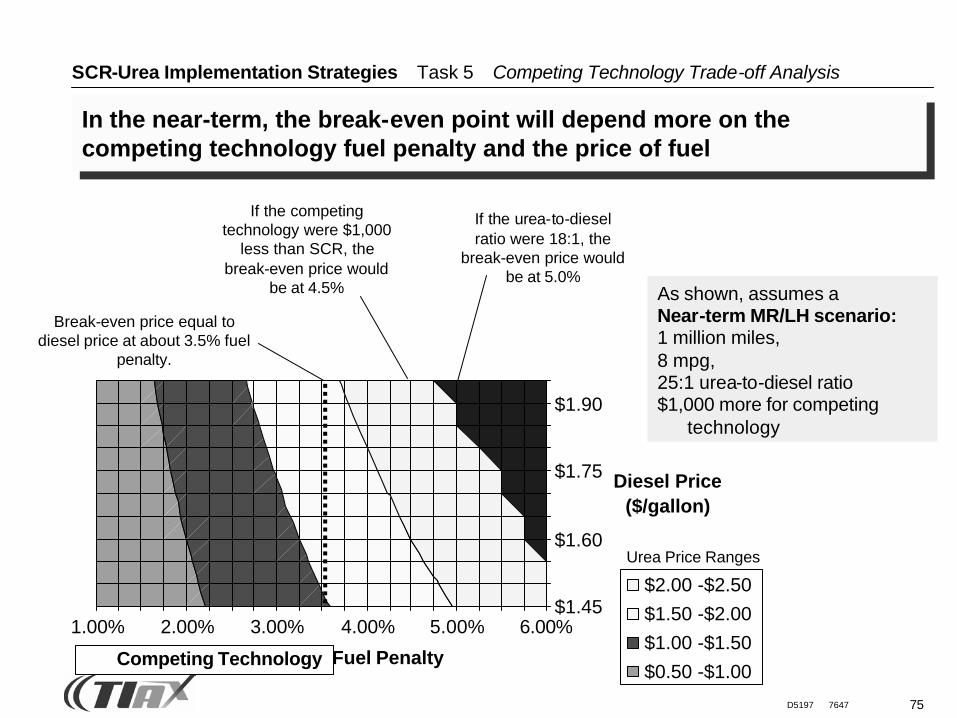
75D5197 7647
SCR-Urea Implementation Strategies Task 5 Competing Technology Trade-off Analysis
In the near-term, the break-even point will depend more on the competing technology fuel penalty and the price of fuel
As shown, assumes aNear-term MR/LH scenario:1 million miles, 8 mpg, 25:1 urea-to-diesel ratio$1,000 more for competing
technology
Break-even price equal to diesel price at about 3.5% fuel
penalty.
If the competing technology were $1,000
less than SCR, the break-even price would
be at 4.5%
If the urea-to-diesel ratio were 18:1, the
break-even price would be at 5.0%
1.00% 2.00% 3.00% 4.00% 5.00% 6.00%$1.45
$1.60
$1.75
$1.90
NOx Adsorber Fuel Penalty
Diesel Price ($/gallon)
$2.00 -$2.50 $1.50 -$2.00 $1.00 -$1.50 $0.50 -$1.00
Competing Technology
Urea Price Ranges
76D5197 7647
2 Task 1 — Determine Market Structure
3 Task 2 — Urea Cost Model Framework
1 Project Overview
4 Task 3 — SCR Urea Cost Model
SCR-Urea Implementation Strategies Agenda
5 Task 4 — Critical Path Analysis
7 Conclusions
8 Next Steps
6 Task 5 — Potential Business Cases
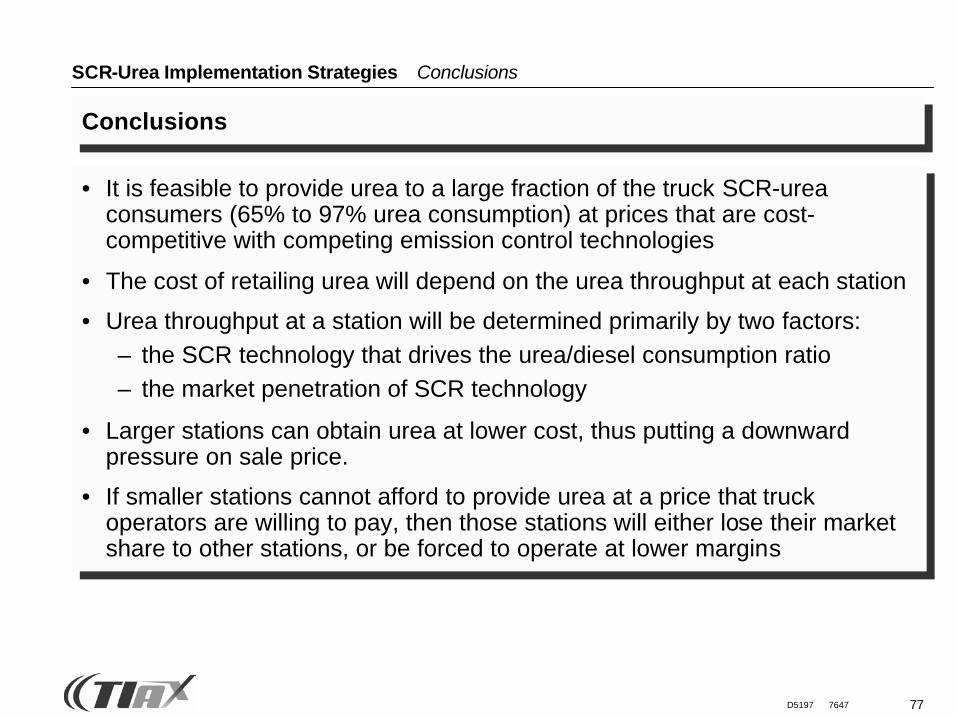
77D5197 7647
SCR-Urea Implementation Strategies Conclusions
Conclusions
• It is feasible to provide urea to a large fraction of the truck SCR-urea consumers (65% to 97% urea consumption) at prices that are cost-competitive with competing emission control technologies
• The cost of retailing urea will depend on the urea throughput at each station
• Urea throughput at a station will be determined primarily by two factors: – the SCR technology that drives the urea/diesel consumption ratio– the market penetration of SCR technology
• Larger stations can obtain urea at lower cost, thus putting a downward pressure on sale price.
• If smaller stations cannot afford to provide urea at a price that truck operators are willing to pay, then those stations will either lose their market share to other stations, or be forced to operate at lower margins
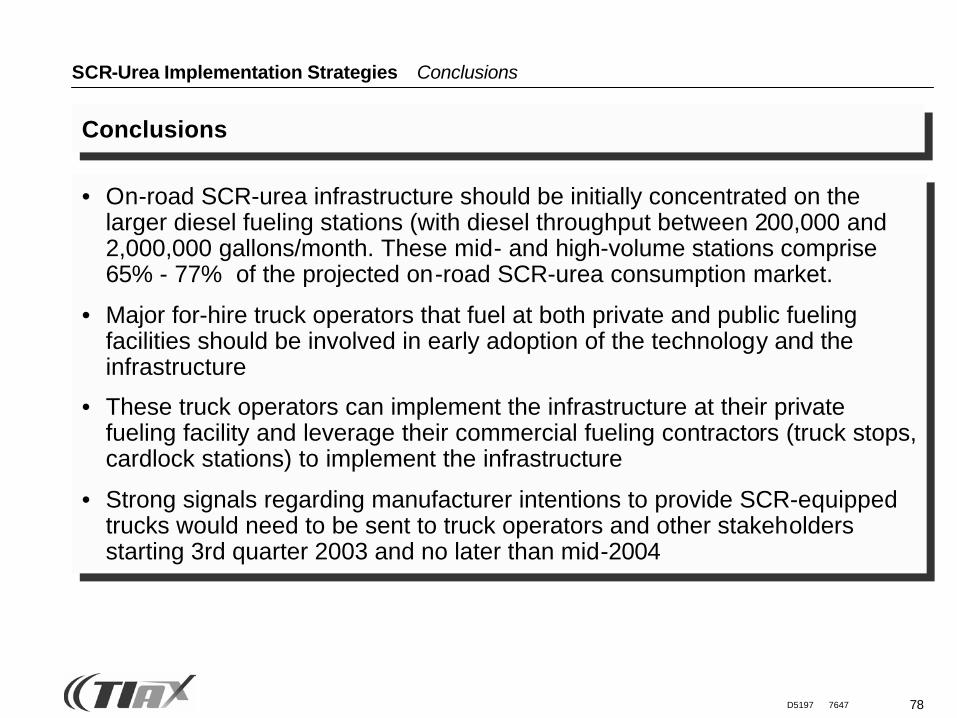
78D5197 7647
SCR-Urea Implementation Strategies Conclusions
Conclusions
• On-road SCR-urea infrastructure should be initially concentrated on the larger diesel fueling stations (with diesel throughput between 200,000 and 2,000,000 gallons/month. These mid- and high-volume stations comprise 65% - 77% of the projected on-road SCR-urea consumption market.
• Major for-hire truck operators that fuel at both private and public fueling facilities should be involved in early adoption of the technology and the infrastructure
• These truck operators can implement the infrastructure at their private fueling facility and leverage their commercial fueling contractors (truck stops, cardlock stations) to implement the infrastructure
• Strong signals regarding manufacturer intentions to provide SCR-equipped trucks would need to be sent to truck operators and other stakeholders starting 3rd quarter 2003 and no later than mid-2004
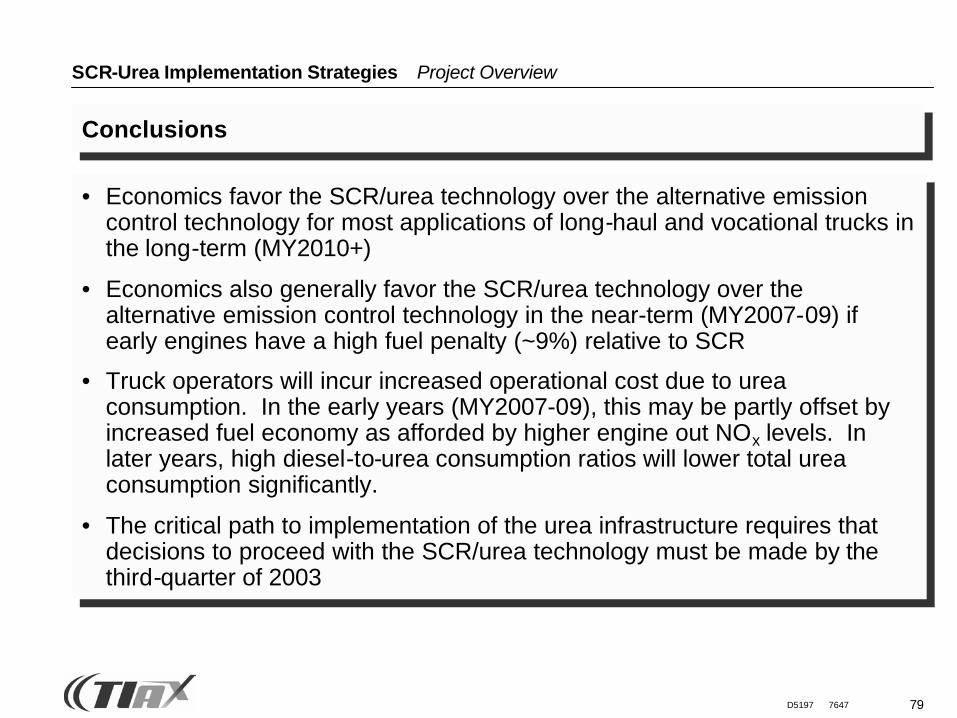
79D5197 7647
SCR-Urea Implementation Strategies Project Overview
Conclusions
• Economics favor the SCR/urea technology over the alternative emission control technology for most applications of long-haul and vocational trucks in the long-term (MY2010+)
• Economics also generally favor the SCR/urea technology over the alternative emission control technology in the near-term (MY2007-09) if early engines have a high fuel penalty (~9%) relative to SCR
• Truck operators will incur increased operational cost due to urea consumption. In the early years (MY2007-09), this may be partly offset by increased fuel economy as afforded by higher engine out NOx levels. In later years, high diesel-to-urea consumption ratios will lower total urea consumption significantly.
• The critical path to implementation of the urea infrastructure requires that decisions to proceed with the SCR/urea technology must be made by the third-quarter of 2003
80D5197 7647
2 Task 1 — Determine Market Structure
3 Task 2 — Urea Cost Model Framework
1 Project Overview
4 Task 3 — SCR Urea Cost Model
SCR-Urea Implementation Strategies Agenda
5 Task 4 — Critical Path Analysis
7 Conclusions
8 Next Steps
6 Task 5 — Potential Business Cases
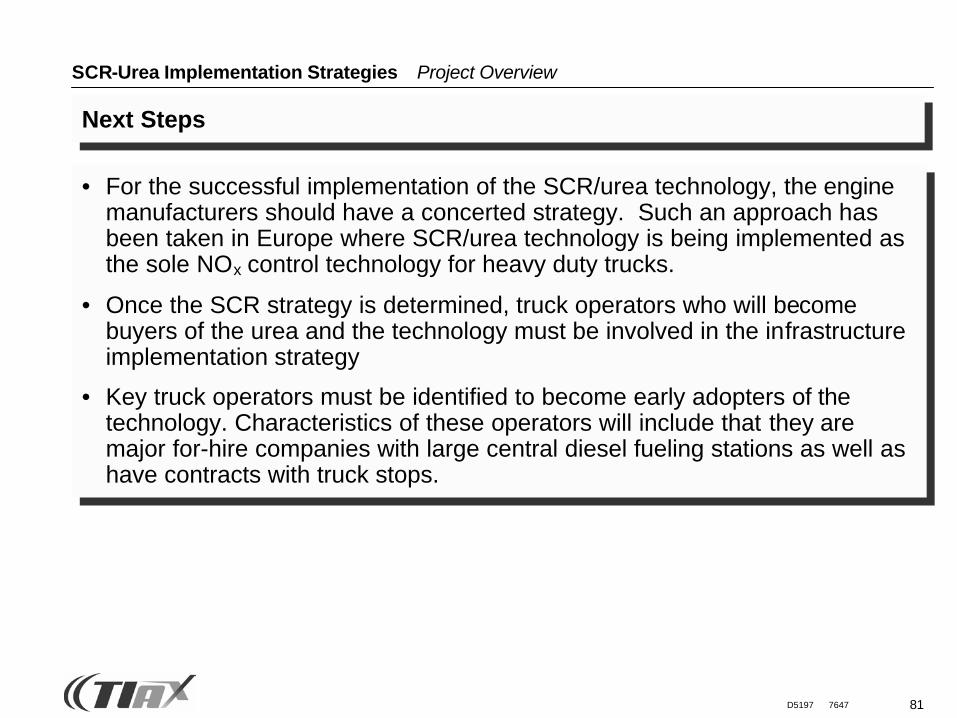
81D5197 7647
SCR-Urea Implementation Strategies Project Overview
Next Steps
• For the successful implementation of the SCR/urea technology, the engine manufacturers should have a concerted strategy. Such an approach has been taken in Europe where SCR/urea technology is being implemented as the sole NOx control technology for heavy duty trucks.
• Once the SCR strategy is determined, truck operators who will become buyers of the urea and the technology must be involved in the infrastructure implementation strategy
• Key truck operators must be identified to become early adopters of the technology. Characteristics of these operators will include that they are major for-hire companies with large central diesel fueling stations as well as have contracts with truck stops.
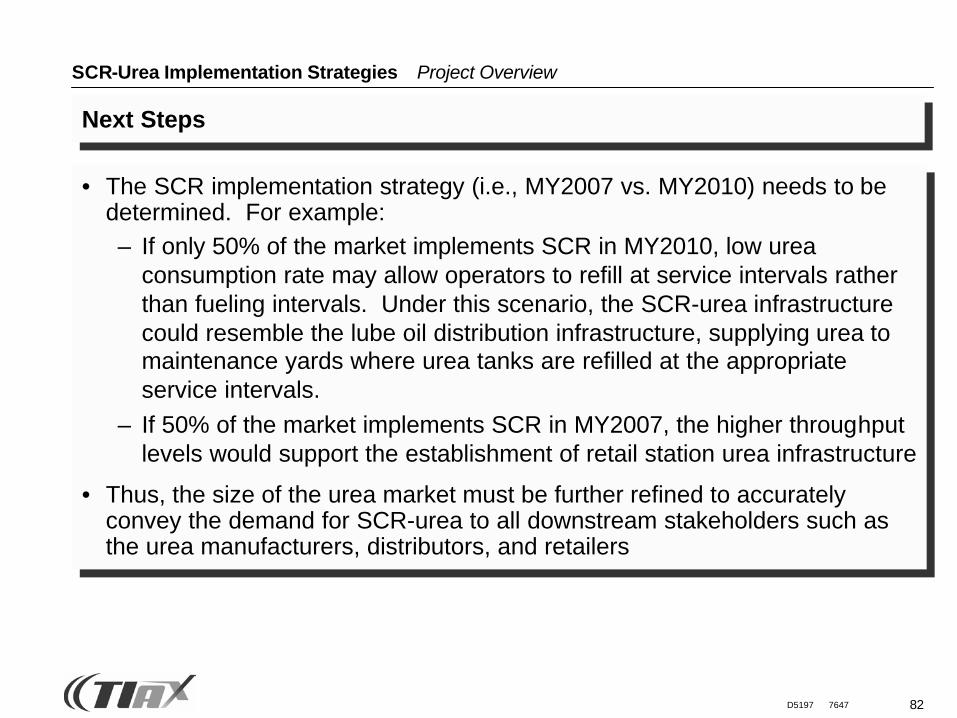
82D5197 7647
SCR-Urea Implementation Strategies Project Overview
Next Steps
• The SCR implementation strategy (i.e., MY2007 vs. MY2010) needs to be determined. For example:– If only 50% of the market implements SCR in MY2010, low urea
consumption rate may allow operators to refill at service intervals rather than fueling intervals. Under this scenario, the SCR-urea infrastructure could resemble the lube oil distribution infrastructure, supplying urea to maintenance yards where urea tanks are refilled at the appropriate service intervals.
– If 50% of the market implements SCR in MY2007, the higher throughput levels would support the establishment of retail station urea infrastructure
• Thus, the size of the urea market must be further refined to accurately convey the demand for SCR-urea to all downstream stakeholders such as the urea manufacturers, distributors, and retailers
TIAX LLC1601 S. De Anza Blvd, Suite 100Cupertino, California95014-5363
Reference: D5197
SCR-Urea Infrastructure Implementation Strategies Final Review Meeting
Created for:Engine Manufacturers AssociationChicago, IllinoisMay 7, 2003
Appendix Information for:
83
84D5197 7647
The following contacts were initiated and are ongoing to obtain input and data for Tasks 1-3 and the overall project
• EMA SCR-urea committee members
• Mr. Bill Gouse, ATA
• Ms. Tracy Embree, FleetGuard
• Ms. Sharon Corigliano, NATSO Foundation
• Dr. Adam Schubert, BP
• Mr. Jeff Herzog, US EPA
• Mr. Fred Kirchner, PetroNJ
SCR-Urea Implementation Strategies Acknowledgements
• Mr. George Strickland, Director of Engineering/Construction for TravelCenters of America
• Mr. Anders Hedgren, IDENTIC (Sweden)
• Gilbarco, Marketing Division
• Mr. David McClure, PetroStopping Centers
• Mr. Jerry Kroon, Agrium
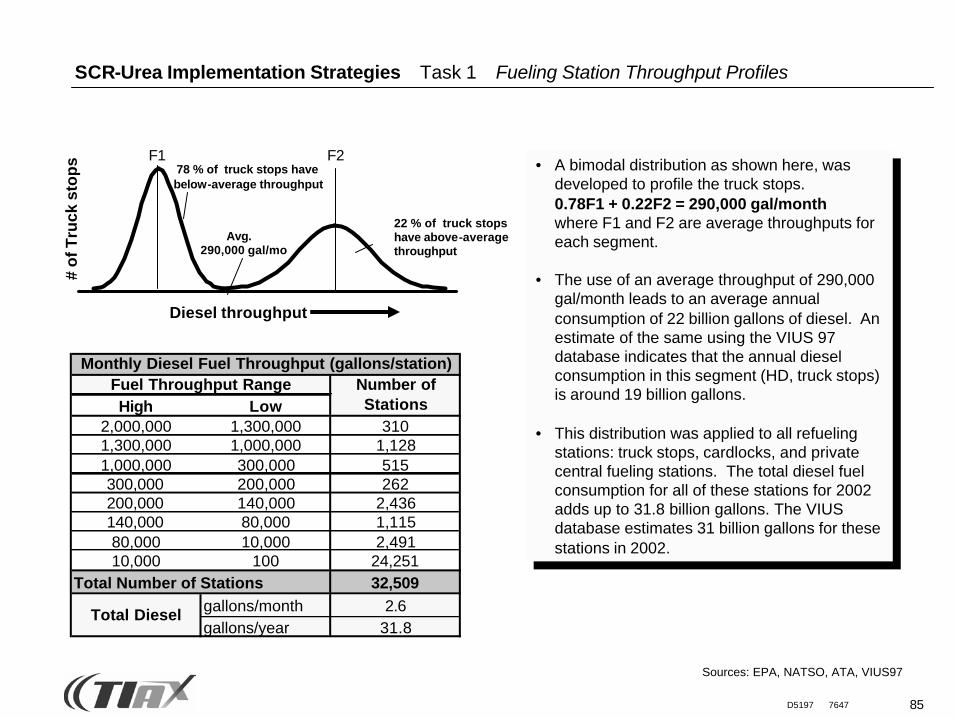
85D5197 7647
SCR-Urea Implementation Strategies Task 1 Fueling Station Throughput Profiles
F1 F2
Avg. 290,000 gal/mo
78 % of truck stops havebelow-average throughput
22 % of truck stops have above-average throughput
Diesel throughput
# o
f Tru
ck s
top
s • A bimodal distribution as shown here, was developed to profile the truck stops.0.78F1 + 0.22F2 = 290,000 gal/monthwhere F1 and F2 are average throughputs for each segment.
• The use of an average throughput of 290,000 gal/month leads to an average annual consumption of 22 billion gallons of diesel. An estimate of the same using the VIUS 97 database indicates that the annual diesel consumption in this segment (HD, truck stops) is around 19 billion gallons.
• This distribution was applied to all refueling stations: truck stops, cardlocks, and private central fueling stations. The total diesel fuel consumption for all of these stations for 2002 adds up to 31.8 billion gallons. The VIUS database estimates 31 billion gallons for these stations in 2002.
Sources: EPA, NATSO, ATA, VIUS97
High Low2,000,000 1,300,000 3101,300,000 1,000,000 1,1281,000,000 300,000 515300,000 200,000 262200,000 140,000 2,436140,000 80,000 1,11580,000 10,000 2,49110,000 100 24,251
Total Number of Stations 32,509gallons/month 2.6gallons/year 31.8
Monthly Diesel Fuel Throughput (gallons/station)Fuel Throughput Range Number of
Stations
Total Diesel
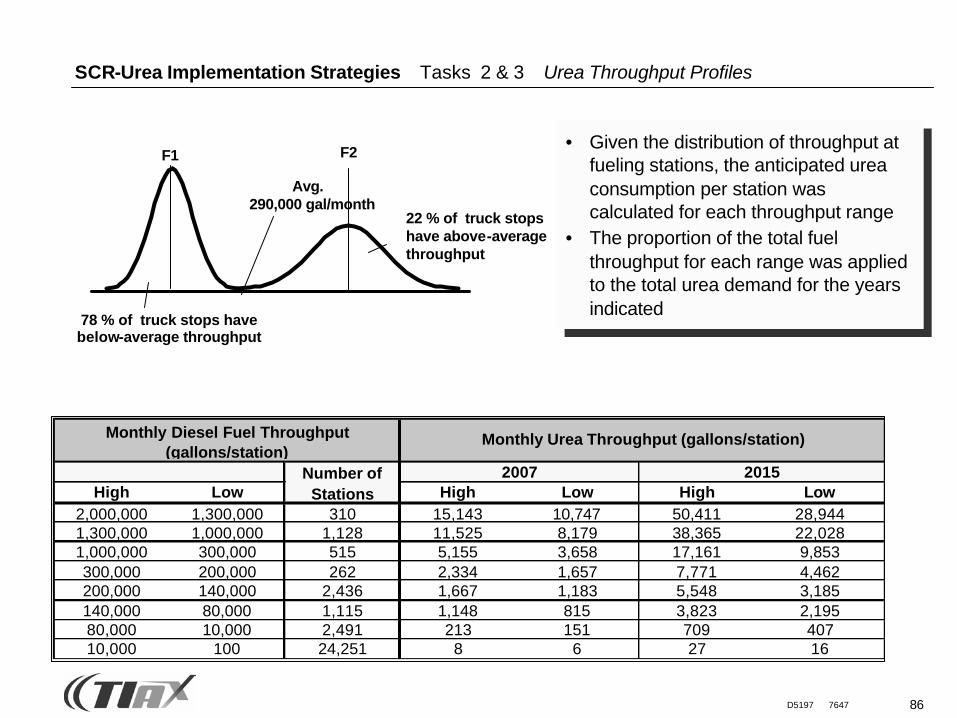
86D5197 7647
SCR-Urea Implementation Strategies Tasks 2 & 3 Urea Throughput Profiles
F1 F2
Avg. 290,000 gal/month
78 % of truck stops havebelow-average throughput
22 % of truck stops have above-average throughput
• Given the distribution of throughput at fueling stations, the anticipated urea consumption per station was calculated for each throughput range
• The proportion of the total fuel throughput for each range was applied to the total urea demand for the years indicated
High Low High Low High Low2,000,000 1,300,000 310 15,143 10,747 50,411 28,9441,300,000 1,000,000 1,128 11,525 8,179 38,365 22,0281,000,000 300,000 515 5,155 3,658 17,161 9,853300,000 200,000 262 2,334 1,657 7,771 4,462200,000 140,000 2,436 1,667 1,183 5,548 3,185140,000 80,000 1,115 1,148 815 3,823 2,19580,000 10,000 2,491 213 151 709 40710,000 100 24,251 8 6 27 16
2007 2015Number of Stations
Monthly Diesel Fuel Throughput (gallons/station)
Monthly Urea Throughput (gallons/station)
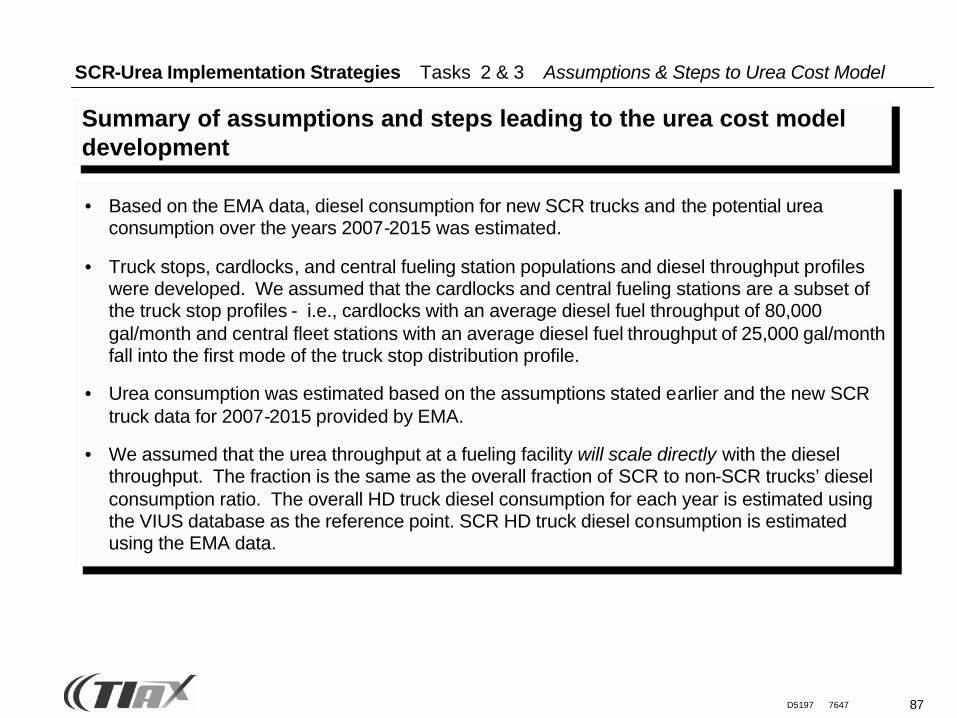
87D5197 7647
SCR-Urea Implementation Strategies Tasks 2 & 3 Assumptions & Steps to Urea Cost Model
Summary of assumptions and steps leading to the urea cost model development
• Based on the EMA data, diesel consumption for new SCR trucks and the potential urea consumption over the years 2007-2015 was estimated.
• Truck stops, cardlocks, and central fueling station populations and diesel throughput profiles were developed. We assumed that the cardlocks and central fueling stations are a subset of the truck stop profiles - i.e., cardlocks with an average diesel fuel throughput of 80,000 gal/month and central fleet stations with an average diesel fuel throughput of 25,000 gal/month fall into the first mode of the truck stop distribution profile.
• Urea consumption was estimated based on the assumptions stated earlier and the new SCR truck data for 2007-2015 provided by EMA.
• We assumed that the urea throughput at a fueling facility will scale directly with the diesel throughput. The fraction is the same as the overall fraction of SCR to non-SCR trucks’ diesel consumption ratio. The overall HD truck diesel consumption for each year is estimated using the VIUS database as the reference point. SCR HD truck diesel consumption is estimated using the EMA data.
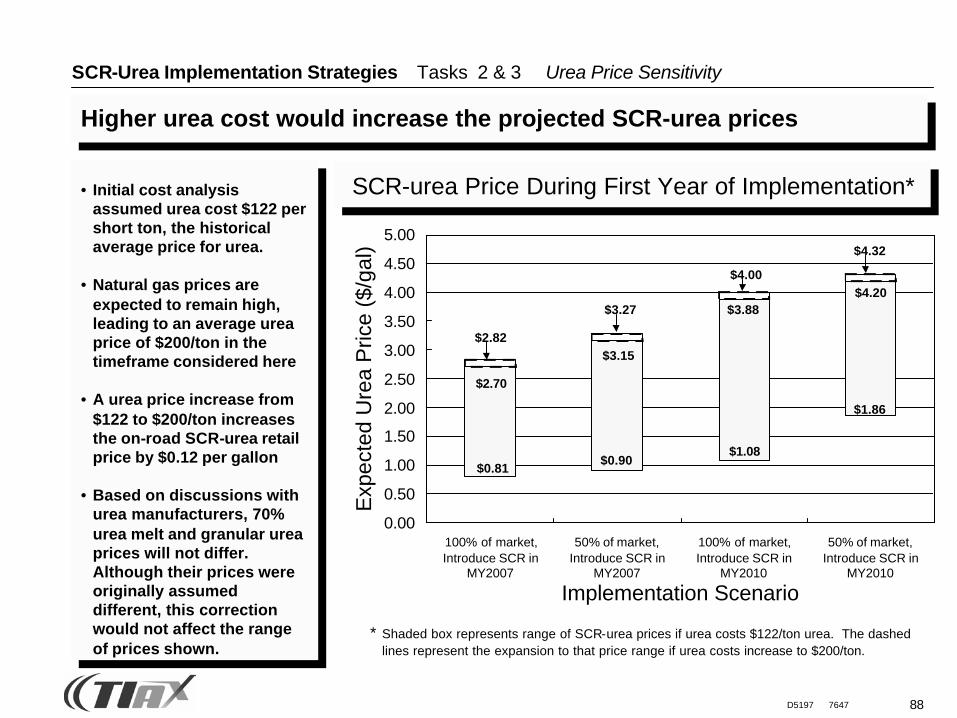
88D5197 7647
Higher urea cost would increase the projected SCR-urea prices
SCR-Urea Implementation Strategies Tasks 2 & 3 Urea Price Sensitivity
• Initial cost analysis assumed urea cost $122 per short ton, the historical average price for urea.
• Natural gas prices are expected to remain high, leading to an average urea price of $200/ton in the timeframe considered here
• A urea price increase from $122 to $200/ton increases the on-road SCR-urea retail price by $0.12 per gallon
• Based on discussions with urea manufacturers, 70% urea melt and granular urea prices will not differ. Although their prices were originally assumed different, this correction would not affect the range of prices shown.
SCR-urea Price During First Year of Implementation*
$1.86
$1.08$0.90
$0.81
0.00
0.50
1.00
1.50
2.00
2.50
3.00
3.50
4.00
4.50
5.00
100% of market,Introduce SCR in
MY2007
50% of market,Introduce SCR in
MY2007
100% of market,Introduce SCR in
MY2010
50% of market,Introduce SCR in
MY2010
Implementation Scenario
Exp
ecte
d U
rea
Pric
e ($
/gal
)$2.70
$3.15
$4.20$3.88
$2.82
$3.27
$4.00
$4.32
* Shaded box represents range of SCR-urea prices if urea costs $122/ton urea. The dashed lines represent the expansion to that price range if urea costs increase to $200/ton.
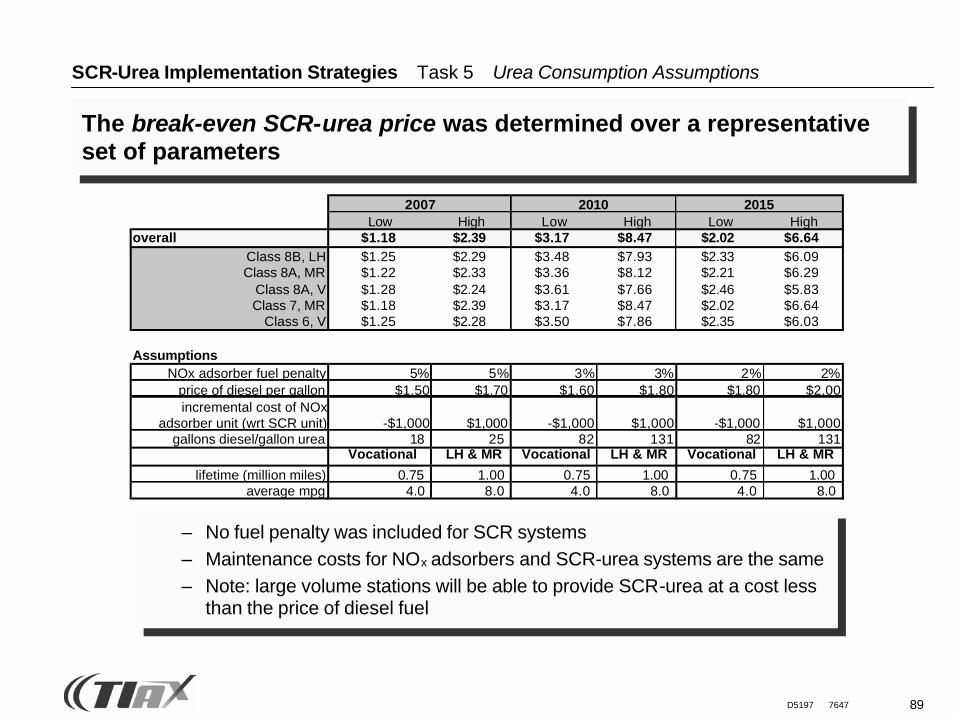
89D5197 7647
SCR-Urea Implementation Strategies Task 5 Urea Consumption Assumptions
The break-even SCR-urea price was determined over a representative set of parameters
– No fuel penalty was included for SCR systems– Maintenance costs for NOx adsorbers and SCR-urea systems are the same– Note: large volume stations will be able to provide SCR-urea at a cost less
than the price of diesel fuel
Low High Low High Low Highoverall $1.18 $2.39 $3.17 $8.47 $2.02 $6.64
Class 8B, LH $1.25 $2.29 $3.48 $7.93 $2.33 $6.09Class 8A, MR $1.22 $2.33 $3.36 $8.12 $2.21 $6.29
Class 8A, V $1.28 $2.24 $3.61 $7.66 $2.46 $5.83Class 7, MR $1.18 $2.39 $3.17 $8.47 $2.02 $6.64
Class 6, V $1.25 $2.28 $3.50 $7.86 $2.35 $6.03
AssumptionsNOx adsorber fuel penalty 5% 5% 3% 3% 2% 2%
price of diesel per gallon $1.50 $1.70 $1.60 $1.80 $1.80 $2.00incremental cost of NOx
adsorber unit (wrt SCR unit) -$1,000 $1,000 -$1,000 $1,000 -$1,000 $1,000gallons diesel/gallon urea 18 25 82 131 82 131
Vocational LH & MR Vocational LH & MR Vocational LH & MR
lifetime (million miles) 0.75 1.00 0.75 1.00 0.75 1.00 average mpg 4.0 8.0 4.0 8.0 4.0 8.0
2007 2010 2015