Embed Size (px)
Citation preview
Losing Facility Name and Type:Street Address:
City, State:
Current 3D ZIP Code(s):
Type of Distribution to Consolidate:
Gaining Facility Name and Type:Current 3D ZIP Code(s):
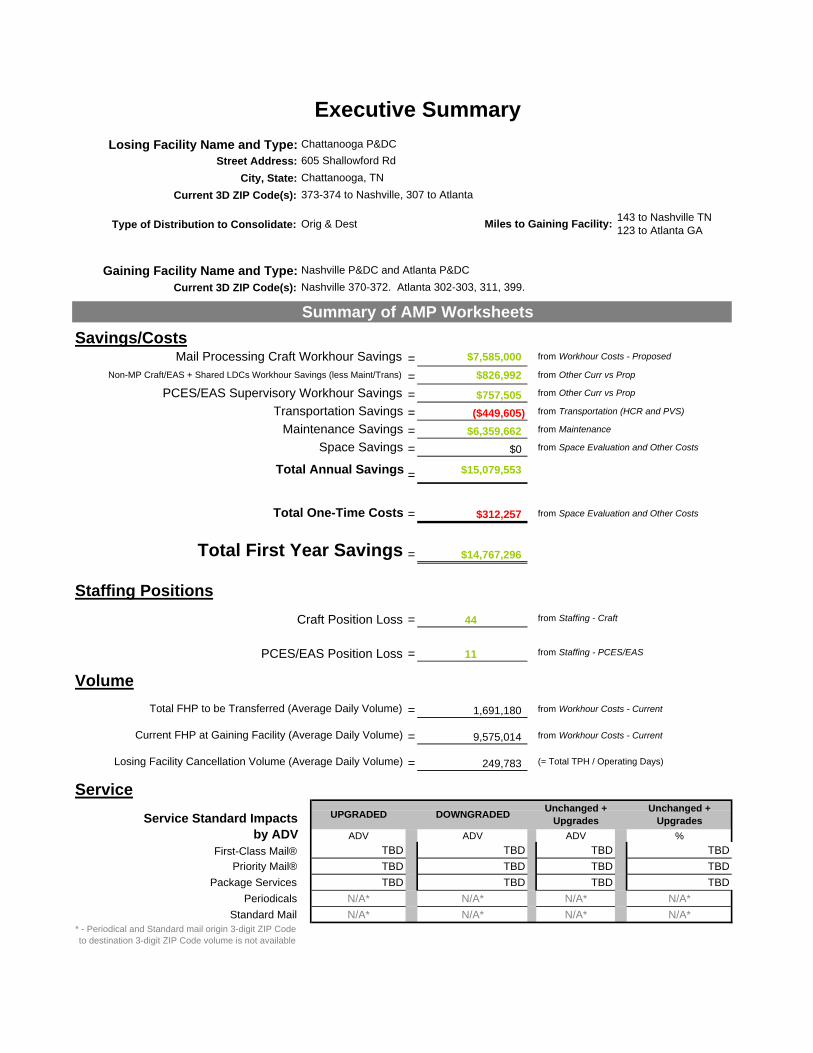
= $7,585,000
= $826,992
= $757,505
= ($449,605) from Transportation (HCR and PVS)
= $6,359,662 from Maintenance
= $0 from Space Evaluation and Other Costs
= $15,079,553
= $312,257 from Space Evaluation and Other Costs
= $14,767,296
= 44 from Staffing - Craft
= 11 from Staffing - PCES/EAS
= 1,691,180 from Workhour Costs - Current
= 9,575,014 from Workhour Costs - Current
= 249,783
ADV ADV ADV %
First-Class Mail® TBD TBD TBD TBD
Priority Mail® TBD TBD TBD TBD
Package Services TBD TBD TBD TBD
Periodicals N/A* N/A* N/A* N/A*
Standard Mail N/A* N/A* N/A* N/A** - Periodical and Standard mail origin 3-digit ZIP Code to destination 3-digit ZIP Code volume is not available
Unchanged + UpgradesService Standard Impacts
by ADV
Service
UPGRADED DOWNGRADEDUnchanged +
Upgrades
Total FHP to be Transferred (Average Daily Volume)
Current FHP at Gaining Facility (Average Daily Volume)
Losing Facility Cancellation Volume (Average Daily Volume) (= Total TPH / Operating Days)
Staffing Positions
Craft Position Loss
PCES/EAS Position Loss
Volume
Space Savings
Total Annual Savings
Total One-Time Costs
Total First Year Savings
PCES/EAS Supervisory Workhour Savings from Other Curr vs Prop
Transportation Savings
Maintenance Savings
Mail Processing Craft Workhour Savings from Workhour Costs - Proposed
Non-MP Craft/EAS + Shared LDCs Workhour Savings (less Maint/Trans) from Other Curr vs Prop
Nashville P&DC and Atlanta P&DC
Nashville 370-372. Atlanta 302-303, 311, 399.
Summary of AMP Worksheets
Savings/Costs
605 Shallowford Rd
Chattanooga, TN
373-374 to Nashville, 307 to Atlanta
Orig & Dest Miles to Gaining Facility:143 to Nashville TN 123 to Atlanta GA
Executive Summary
Chattanooga P&DC
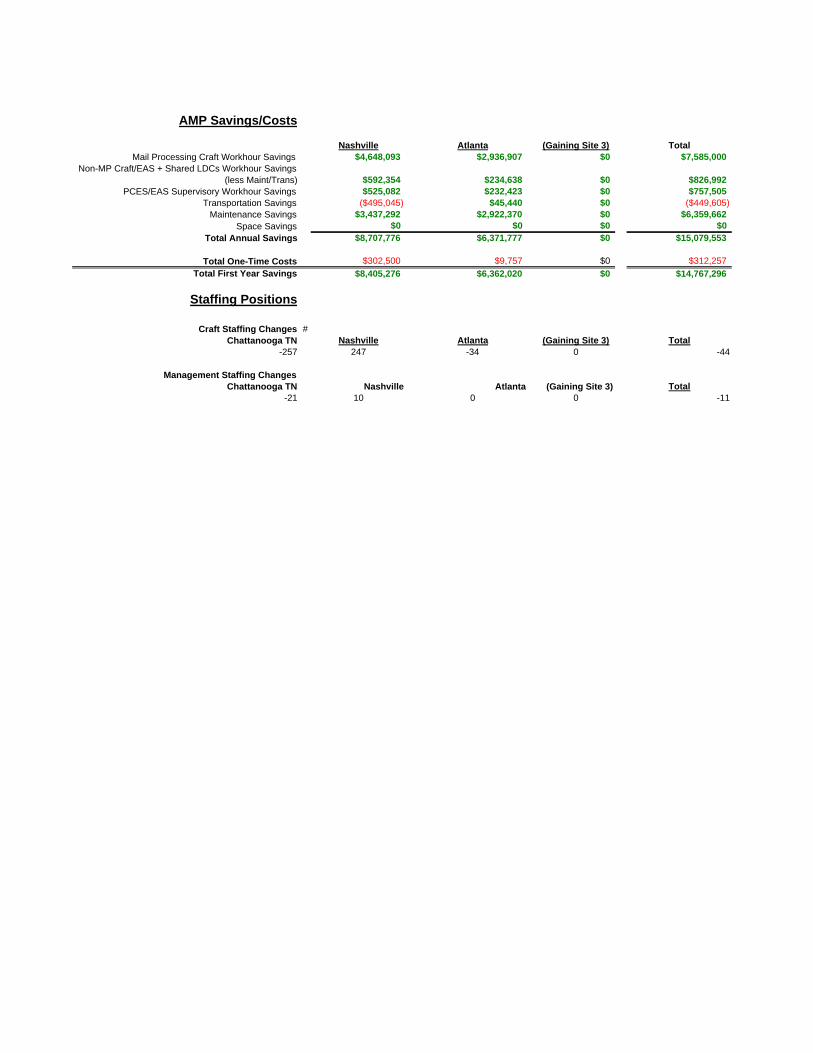
AMP Savings/Costs
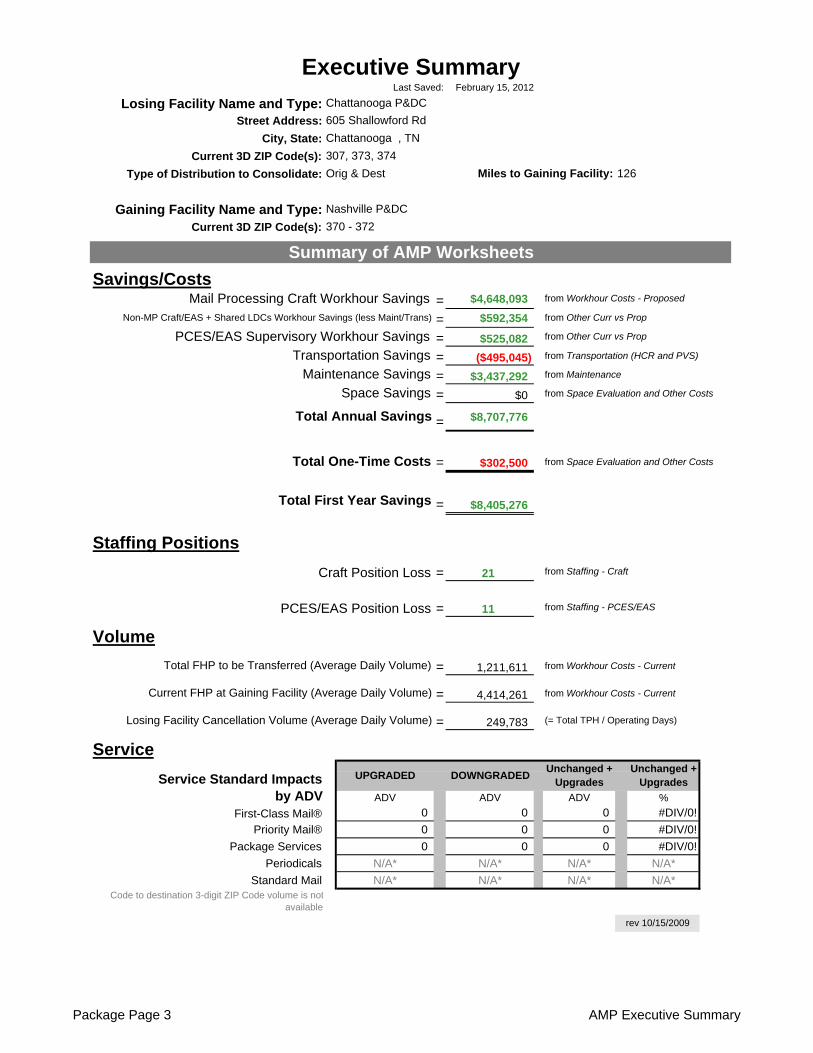
Nashville Atlanta (Gaining Site 3) TotalMail Processing Craft Workhour Savings $4,648,093 $2,936,907 $0 $7,585,000
Non-MP Craft/EAS + Shared LDCs Workhour Savings (less Maint/Trans) $592,354 $234,638 $0 $826,992
PCES/EAS Supervisory Workhour Savings $525,082 $232,423 $0 $757,505Transportation Savings ($495,045) $45,440 $0 ($449,605)
Maintenance Savings $3,437,292 $2,922,370 $0 $6,359,662Space Savings $0 $0 $0 $0
Total Annual Savings $8,707,776 $6,371,777 $0 $15,079,553
Total One-Time Costs $302,500 $9,757 $0 $312,257
Total First Year Savings $8,405,276 $6,362,020 $0 $14,767,296
Staffing Positions
Craft Staffing Changes #Chattanooga TN Nashville Atlanta (Gaining Site 3) Total
-257 247 -34 0 -44
Management Staffing ChangesChattanooga TN Nashville Atlanta (Gaining Site 3) Total
-21 10 0 0 -11
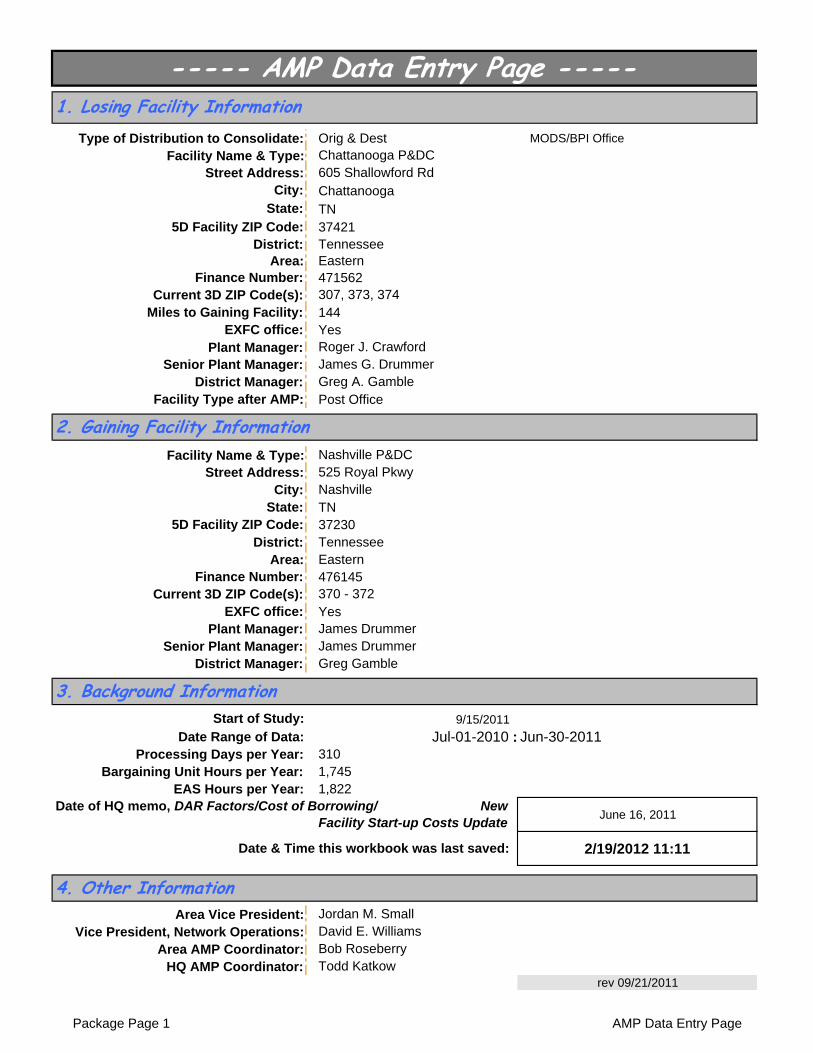
Type of Distribution to Consolidate: Orig & Dest MODS/BPI Office
Facility Name & Type:Street Address:
City: Chattanooga State: TN
5D Facility ZIP Code: 37421District: Tennessee
Area: EasternFinance Number: 471562
Current 3D ZIP Code(s):Miles to Gaining Facility: 144
EXFC office: YesPlant Manager:
Senior Plant Manager:District Manager:
Facility Type after AMP: Post Office
Facility Name & Type:Street Address:
City:State: TN
5D Facility ZIP Code: 37230District: Tennessee
Area: EasternFinance Number: 476145
Current 3D ZIP Code(s):EXFC office: Yes
Plant Manager:Senior Plant Manager:
District Manager:
Start of Study: 9/15/2011
Date Range of Data: Jul-01-2010 : Jun-30-2011Processing Days per Year: 310
Bargaining Unit Hours per Year: 1,745EAS Hours per Year: 1,822
June 16, 2011
2/19/2012 11:11
Area Vice President:Vice President, Network Operations:
Area AMP Coordinator:HQ AMP Coordinator:
rev 09/21/2011
----- AMP Data Entry Page -----
Chattanooga P&DC605 Shallowford Rd
Roger J. Crawford
1. Losing Facility Information
Todd Katkow
307, 373, 374
James DrummerGreg Gamble
Jordan M. SmallDavid E. Williams
Greg A. Gamble
Nashville P&DC525 Royal Pkwy
James Drummer
4. Other Information
James G. Drummer
Nashville
370 - 372
2. Gaining Facility Information
Bob Roseberry
Date & Time this workbook was last saved:
3. Background Information
Date of HQ memo, DAR Factors/Cost of Borrowing/ New Facility Start-up Costs Update
Package Page 1 AMP Data Entry Page
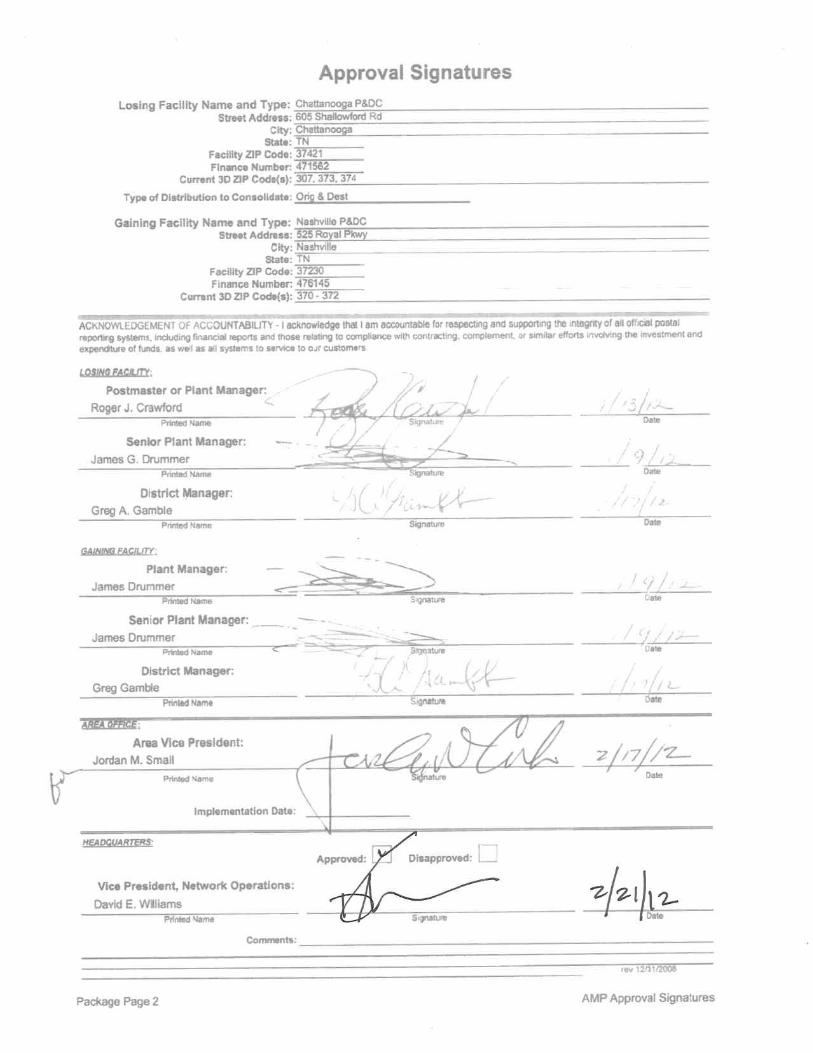
Losing Facility Name and Type:Street Address:
City, State:
Current 3D ZIP Code(s):
Type of Distribution to Consolidate:
Gaining Facility Name and Type:Current 3D ZIP Code(s):
= $4,648,093
= $592,354
= $525,082
= ($495,045) from Transportation (HCR and PVS)
= $3,437,292 from Maintenance
= $0 from Space Evaluation and Other Costs
= $8,707,776
= $302,500 from Space Evaluation and Other Costs
= $8,405,276
= 21 from Staffing - Craft
= 11 from Staffing - PCES/EAS
= 1,211,611 from Workhour Costs - Current
= 4,414,261 from Workhour Costs - Current
= 249,783
ADV ADV ADV %
First-Class Mail® 0 0 0 #DIV/0!
Priority Mail® 0 0 0 #DIV/0!
Package Services 0 0 0 #DIV/0!
Periodicals N/A* N/A* N/A* N/A*
Standard Mail N/A* N/A* N/A* N/A*Code to destination 3-digit ZIP Code volume is not
available
Service
rev 10/15/2009
Total FHP to be Transferred (Average Daily Volume)
Current FHP at Gaining Facility (Average Daily Volume)
Losing Facility Cancellation Volume (Average Daily Volume) (= Total TPH / Operating Days)
Service Standard Impacts by ADV
UPGRADED DOWNGRADEDUnchanged +
Upgrades
Staffing Positions
Craft Position Loss
PCES/EAS Position Loss
Volume
Space Savings
Total Annual Savings
Total One-Time Costs
Total First Year Savings
PCES/EAS Supervisory Workhour Savings from Other Curr vs Prop
Transportation Savings
Maintenance Savings
Savings/CostsMail Processing Craft Workhour Savings from Workhour Costs - Proposed
Non-MP Craft/EAS + Shared LDCs Workhour Savings (less Maint/Trans) from Other Curr vs Prop
126
Nashville P&DC
370 - 372
Summary of AMP Worksheets
Unchanged + Upgrades
Executive SummaryLast Saved: February 15, 2012
Chattanooga P&DC
605 Shallowford Rd
Chattanooga , TN
307, 373, 374
Orig & Dest Miles to Gaining Facility:
Package Page 3 AMP Executive Summary
Losing Facility Name and Type:Current 3D ZIP Code(s):
Type of Distribution to Consolidate:
Gaining Facility Name and Type:Current 3D ZIP Code(s):
rev 06/10/2009
February 19, 2012
370 - 372
Orig & Dest
Summary NarrativeLast Saved:
Chattanooga P&DC
Nashville P&DC
307, 373, 374
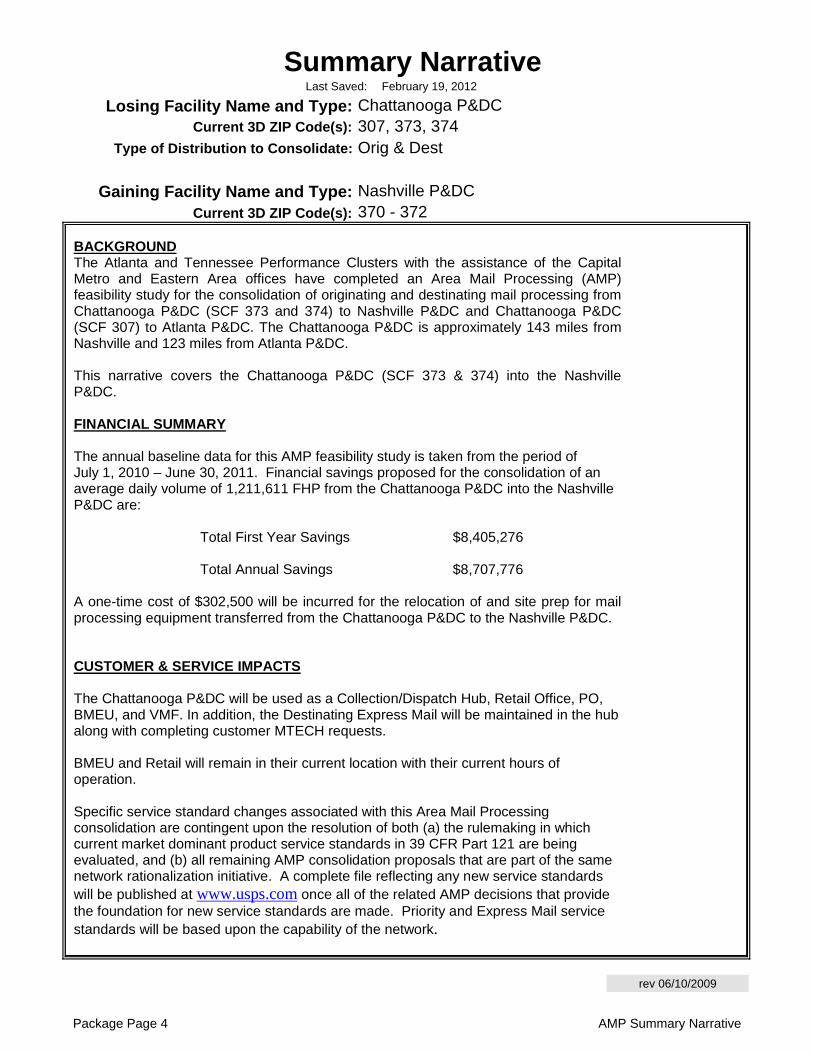
BACKGROUND The Atlanta and Tennessee Performance Clusters with the assistance of the Capital Metro and Eastern Area offices have completed an Area Mail Processing (AMP)feasibility study for the consolidation of originating and destinating mail processing fromChattanooga P&DC (SCF 373 and 374) to Nashville P&DC and Chattanooga P&DC (SCF 307) to Atlanta P&DC. The Chattanooga P&DC is approximately 143 miles fromNashville and 123 miles from Atlanta P&DC. This narrative covers the Chattanooga P&DC (SCF 373 & 374) into the Nashville P&DC. FINANCIAL SUMMARY The annual baseline data for this AMP feasibility study is taken from the period of July 1, 2010 – June 30, 2011. Financial savings proposed for the consolidation of an average daily volume of 1,211,611 FHP from the Chattanooga P&DC into the Nashville P&DC are: Total First Year Savings $8,405,276 Total Annual Savings $8,707,776 A one-time cost of $302,500 will be incurred for the relocation of and site prep for mailprocessing equipment transferred from the Chattanooga P&DC to the Nashville P&DC. CUSTOMER & SERVICE IMPACTS The Chattanooga P&DC will be used as a Collection/Dispatch Hub, Retail Office, PO, BMEU, and VMF. In addition, the Destinating Express Mail will be maintained in the hub along with completing customer MTECH requests. BMEU and Retail will remain in their current location with their current hours of operation. Specific service standard changes associated with this Area Mail Processing consolidation are contingent upon the resolution of both (a) the rulemaking in which current market dominant product service standards in 39 CFR Part 121 are being evaluated, and (b) all remaining AMP consolidation proposals that are part of the same network rationalization initiative. A complete file reflecting any new service standards will be published at www.usps.com once all of the related AMP decisions that provide the foundation for new service standards are made. Priority and Express Mail service standards will be based upon the capability of the network.
Package Page 4 AMP Summary Narrative
rev 06/10/2009
Summary Narrative (continued)
Summary Narrative Page 2
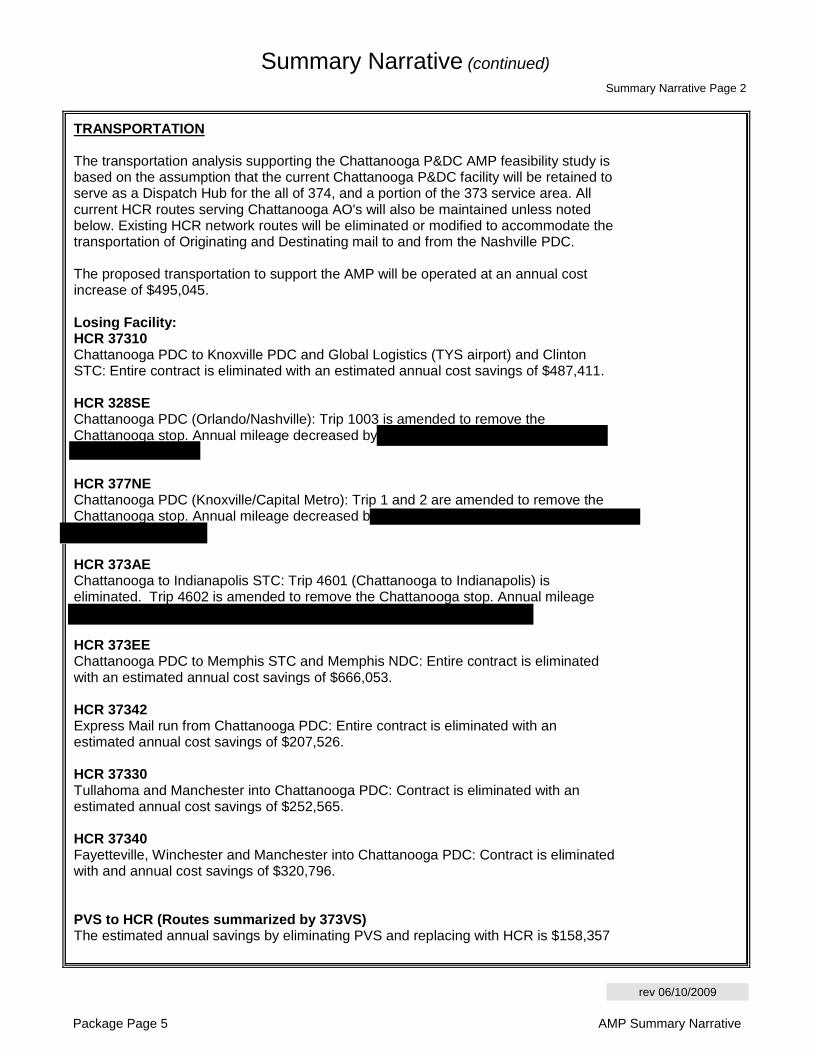
TRANSPORTATION The transportation analysis supporting the Chattanooga P&DC AMP feasibility study is based on the assumption that the current Chattanooga P&DC facility will be retained to serve as a Dispatch Hub for the all of 374, and a portion of the 373 service area. All current HCR routes serving Chattanooga AO's will also be maintained unless noted below. Existing HCR network routes will be eliminated or modified to accommodate the transportation of Originating and Destinating mail to and from the Nashville PDC. The proposed transportation to support the AMP will be operated at an annual cost increase of $495,045. Losing Facility: HCR 37310 Chattanooga PDC to Knoxville PDC and Global Logistics (TYS airport) and Clinton STC: Entire contract is eliminated with an estimated annual cost savings of $487,411. HCR 328SE Chattanooga PDC (Orlando/Nashville): Trip 1003 is amended to remove the Chattanooga stop. Annual mileage decreased by
HCR 377NE Chattanooga PDC (Knoxville/Capital Metro): Trip 1 and 2 are amended to remove the Chattanooga stop. Annual mileage decreased b
HCR 373AE Chattanooga to Indianapolis STC: Trip 4601 (Chattanooga to Indianapolis) is eliminated. Trip 4602 is amended to remove the Chattanooga stop. Annual mileage
HCR 373EE Chattanooga PDC to Memphis STC and Memphis NDC: Entire contract is eliminated with an estimated annual cost savings of $666,053. HCR 37342 Express Mail run from Chattanooga PDC: Entire contract is eliminated with an estimated annual cost savings of $207,526. HCR 37330 Tullahoma and Manchester into Chattanooga PDC: Contract is eliminated with an estimated annual cost savings of $252,565. HCR 37340 Fayetteville, Winchester and Manchester into Chattanooga PDC: Contract is eliminated with and annual cost savings of $320,796. PVS to HCR (Routes summarized by 373VS) The estimated annual savings by eliminating PVS and replacing with HCR is $158,357
Package Page 5 AMP Summary Narrative
rev 06/10/2009
Summary Narrative Page 3
Summary Narrative (continued)
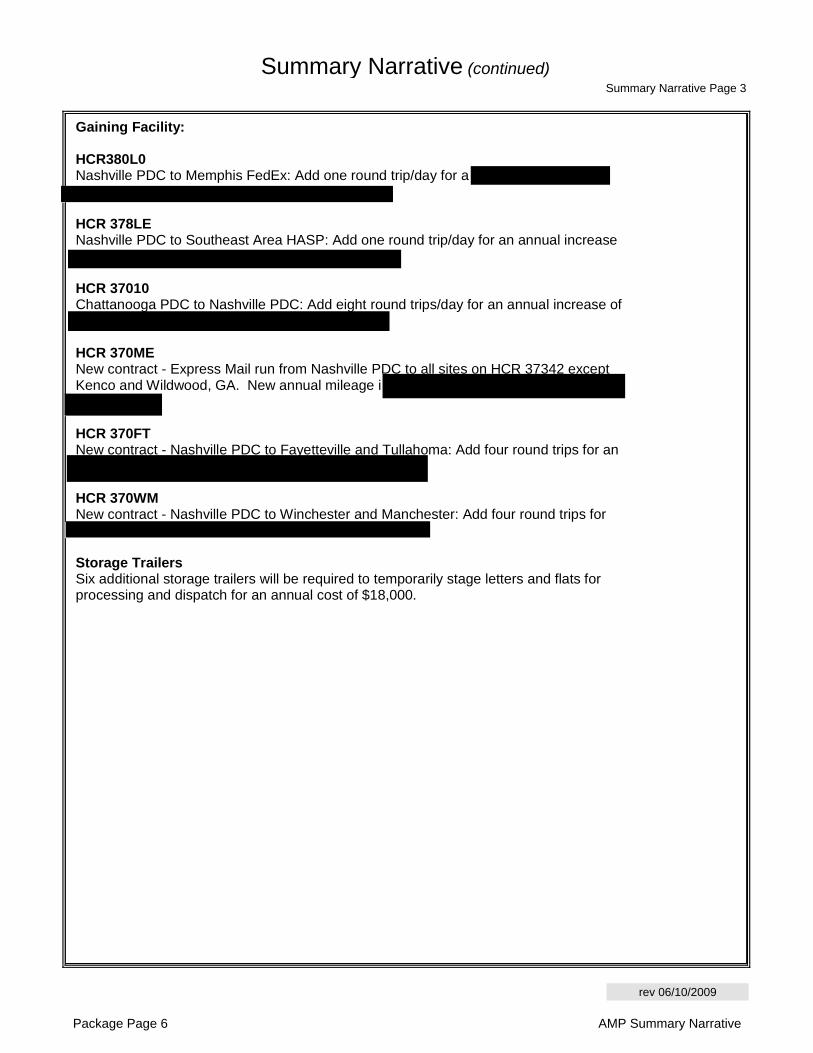
Gaining Facility: HCR380L0 Nashville PDC to Memphis FedEx: Add one round trip/day for a
HCR 378LE Nashville PDC to Southeast Area HASP: Add one round trip/day for an annual increase
HCR 37010 Chattanooga PDC to Nashville PDC: Add eight round trips/day for an annual increase of
HCR 370ME New contract - Express Mail run from Nashville PDC to all sites on HCR 37342 except Kenco and Wildwood, GA. New annual mileage i
HCR 370FT New contract - Nashville PDC to Fayetteville and Tullahoma: Add four round trips for an
HCR 370WM New contract - Nashville PDC to Winchester and Manchester: Add four round trips for
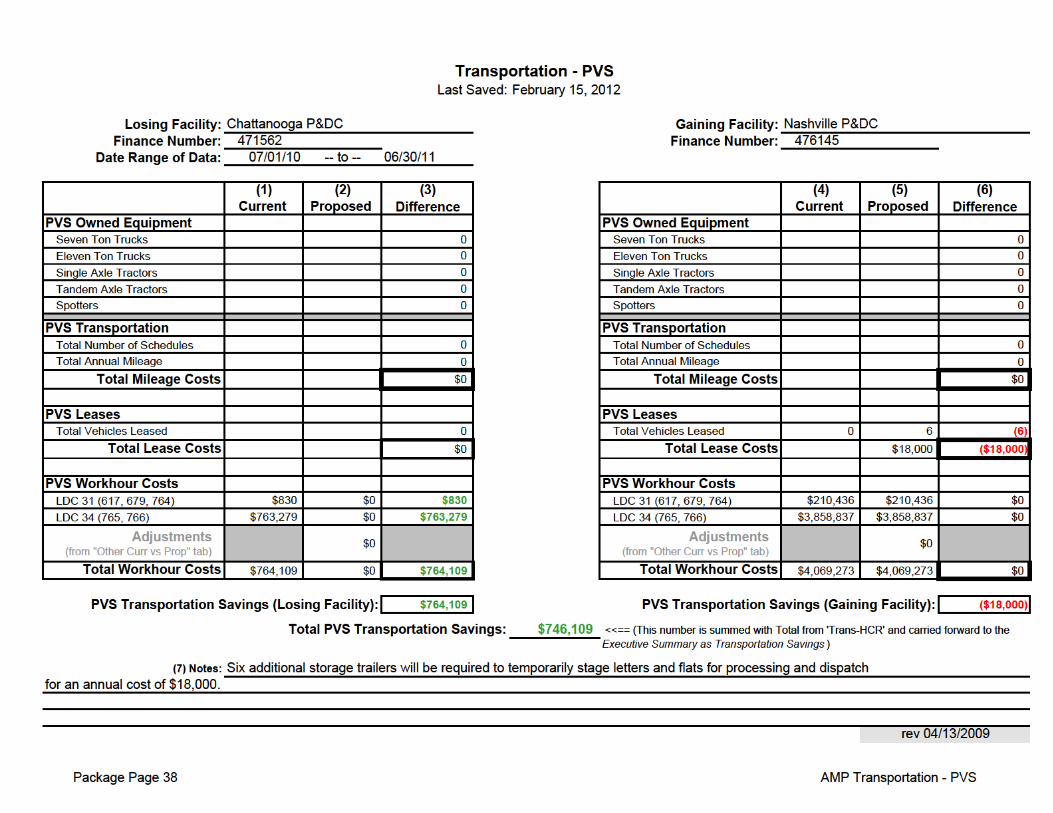
Storage Trailers Six additional storage trailers will be required to temporarily stage letters and flats for processing and dispatch for an annual cost of $18,000.
Package Page 6 AMP Summary Narrative
rev 06/10/2009
Summary Narrative (continued)Summary Narrative Page 4
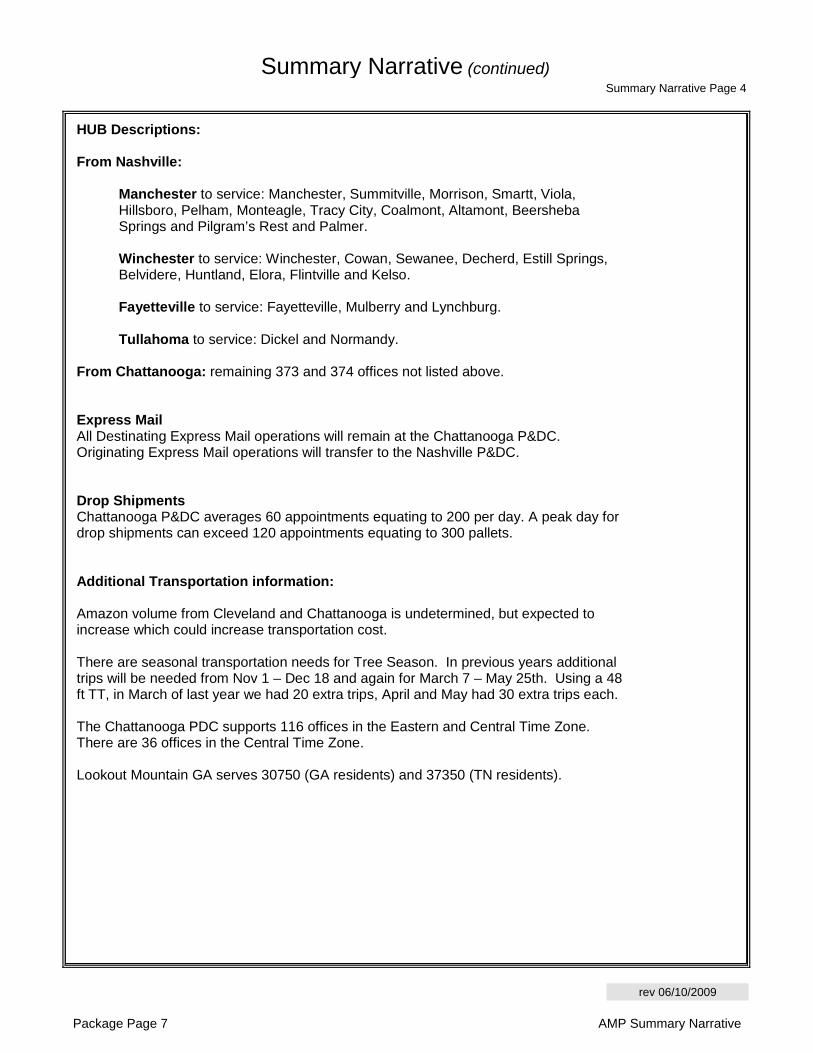
HUB Descriptions: From Nashville:
Manchester to service: Manchester, Summitville, Morrison, Smartt, Viola, Hillsboro, Pelham, Monteagle, Tracy City, Coalmont, Altamont, Beersheba Springs and Pilgram’s Rest and Palmer.
Winchester to service: Winchester, Cowan, Sewanee, Decherd, Estill Springs, Belvidere, Huntland, Elora, Flintville and Kelso.
Fayetteville to service: Fayetteville, Mulberry and Lynchburg. Tullahoma to service: Dickel and Normandy.
From Chattanooga: remaining 373 and 374 offices not listed above. Express Mail All Destinating Express Mail operations will remain at the Chattanooga P&DC. Originating Express Mail operations will transfer to the Nashville P&DC. Drop Shipments Chattanooga P&DC averages 60 appointments equating to 200 per day. A peak day for drop shipments can exceed 120 appointments equating to 300 pallets. Additional Transportation information: Amazon volume from Cleveland and Chattanooga is undetermined, but expected to increase which could increase transportation cost. There are seasonal transportation needs for Tree Season. In previous years additional trips will be needed from Nov 1 – Dec 18 and again for March 7 – May 25th. Using a 48 ft TT, in March of last year we had 20 extra trips, April and May had 30 extra trips each. The Chattanooga PDC supports 116 offices in the Eastern and Central Time Zone. There are 36 offices in the Central Time Zone. Lookout Mountain GA serves 30750 (GA residents) and 37350 (TN residents).
Package Page 7 AMP Summary Narrative
Last Saved:
Losing Facility Name and Type:Current 3D ZIP Code(s):
Miles to Gaining Facility:
Gaining Facility Name and Type:Current 3D ZIP Code(s):
rev 03/20/2008
370 - 372
MAP
Chattanooga P&DC
Nashville P&DC
307, 373, 374
February 15, 2012
126
Package Page 10 AMP MAP
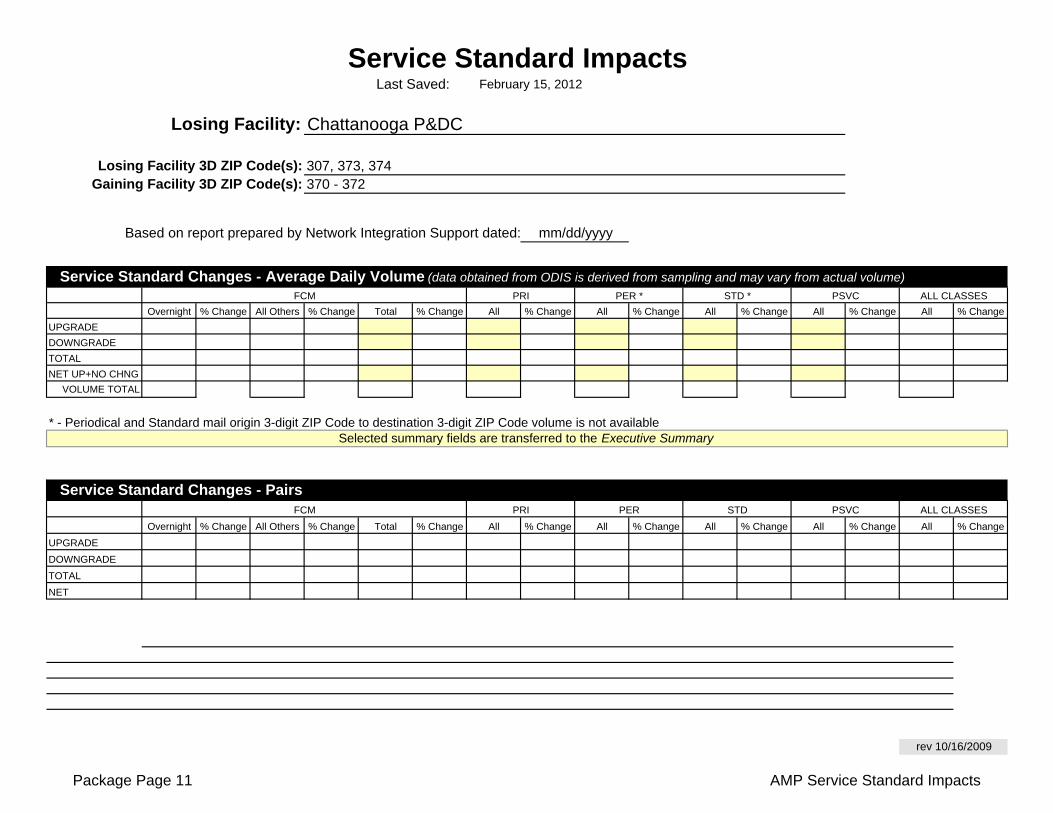
Overnight % Change All Others % Change Total % Change All % Change All % Change All % Change All % Change All % Change
UPGRADE
DOWNGRADE
TOTAL
NET UP+NO CHNG
VOLUME TOTAL
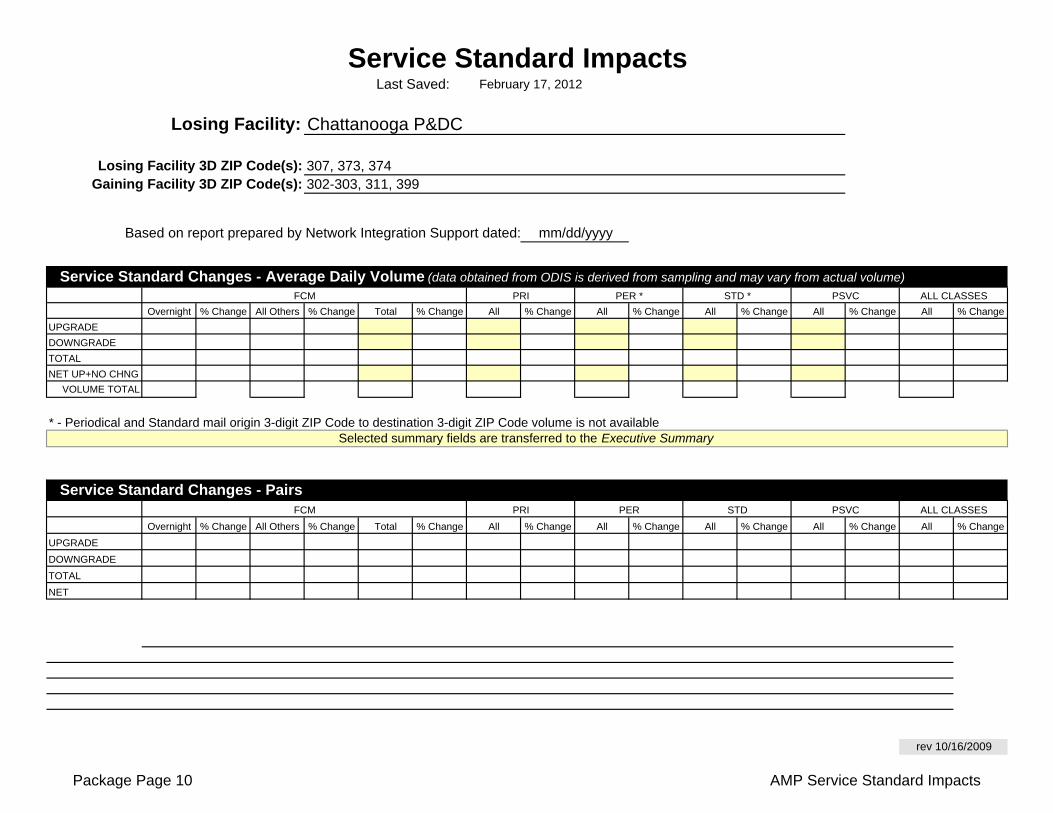
* - Periodical and Standard mail origin 3-digit ZIP Code to destination 3-digit ZIP Code volume is not available
Overnight % Change All Others % Change Total % Change All % Change All % Change All % Change All % Change All % Change
UPGRADE
DOWNGRADE
TOTAL
NET
Service Standard Impacts
PRI ALL CLASSESSTD *FCM PER *
Based on report prepared by Network Integration Support dated:
Last Saved:
PER STD
February 15, 2012
Losing Facility:
PSVC ALL CLASSES
rev 10/16/2009
Losing Facility 3D ZIP Code(s):
mm/dd/yyyy
Selected summary fields are transferred to the Executive Summary
Chattanooga P&DC
307, 373, 374370 - 372Gaining Facility 3D ZIP Code(s):
Service Standard Changes - PairsFCM PRI
PSVC
Service Standard Changes - Average Daily Volume (data obtained from ODIS is derived from sampling and may vary from actual volume)
Package Page 11 AMP Service Standard Impacts

Last Saved: Stakeholder Notification Page 1
AMP Event: Start of Study
rev 07/16/2008
Chattanooga P&DC
Stakeholders Notification Losing Facility:
February 15, 2012(WorkBook Tab Notification - 1)
Package Page 12 AMP Stakeholders Notification
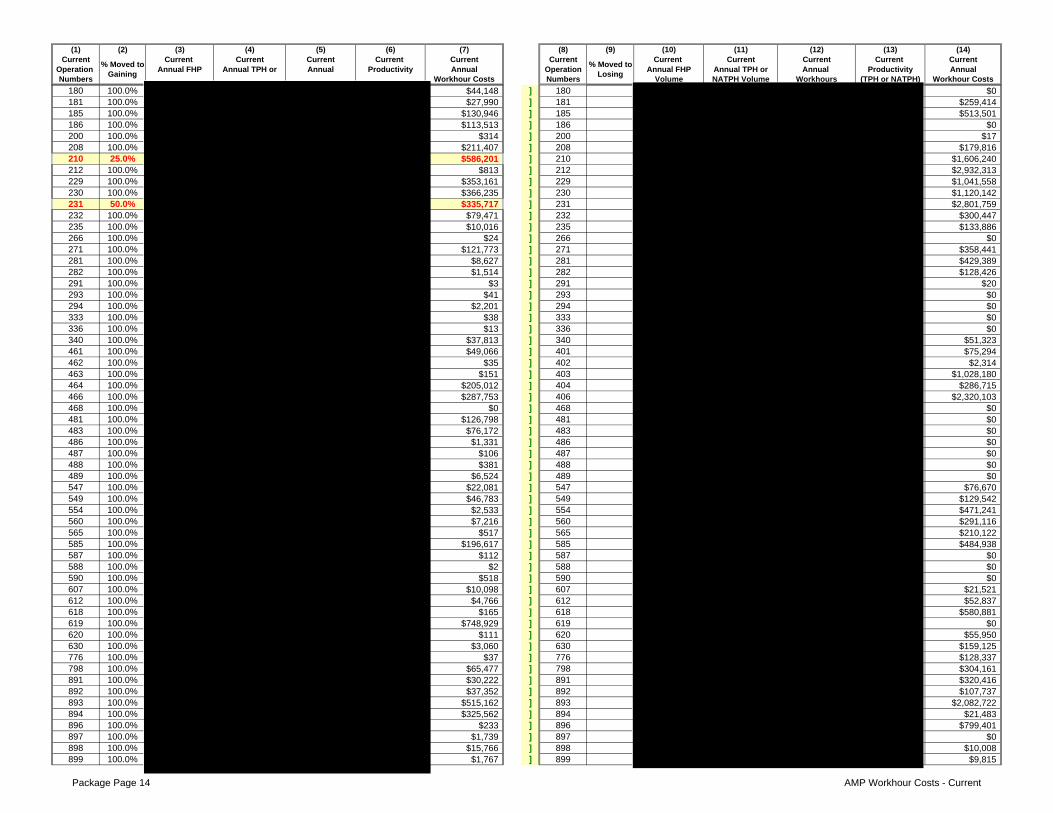
(1) (2) (3) (4) (5) (6) (7) (8) (9) (10) (11) (12) (13) (14)Current Current Current Current Current Current Current Current Current Current Current Current
Operation Annual FHP Annual TPH or Annual Productivity Annual Operation Annual FHP Annual TPH or Annual Productivity AnnualNumbers Workhour Costs Numbers Volume NATPH Volume Workhours (TPH or NATPH) Workhour Costs
% Moved to Losing
% Moved to Gaining
180 100.0% $44,148 ] 180 $0181 100.0% $27,990 ] 181 $259,414185 100.0% $130,946 ] 185 $513,501186 100.0% $113,513 ] 186 $0200 100.0% $314 ] 200 $17208 100.0% $211,407 ] 208 $179,816210 25.0% $586,201 ] 210 $1,606,240212 100.0% $813 ] 212 $2,932,313229 100.0% $353,161 ] 229 $1,041,558230 100.0% $366,235 ] 230 $1,120,142231 50.0% $335,717 ] 231 $2,801,759232 100.0% $79,471 ] 232 $300,447235 100.0% $10,016 ] 235 $133,886266 100.0% $24 ] 266 $0271 100.0% $121,773 ] 271 $358,441281 100.0% $8,627 ] 281 $429,389282 100.0% $1,514 ] 282 $128,426291 100.0% $3 ] 291 $20293 100.0% $41 ] 293 $0294 100.0% $2,201 ] 294 $0333 100.0% $38 ] 333 $0336 100.0% $13 ] 336 $0340 100.0% $37,813 ] 340 $51,323461 100.0% $49,066 ] 401 $75,294462 100.0% $35 ] 402 $2,314463 100.0% $151 ] 403 $1,028,180464 100.0% $205,012 ] 404 $286,715466 100.0% $287,753 ] 406 $2,320,103468 100.0% $0 ] 468 $0481 100.0% $126,798 ] 481 $0483 100.0% $76,172 ] 483 $0486 100.0% $1,331 ] 486 $0487 100.0% $106 ] 487 $0488 100.0% $381 ] 488 $0489 100.0% $6,524 ] 489 $0547 100.0% $22,081 ] 547 $76,670549 100.0% $46,783 ] 549 $129,542554 100.0% $2,533 ] 554 $471,241560 100.0% $7,216 ] 560 $291,116565 100.0% $517 ] 565 $210,122585 100.0% $196,617 ] 585 $484,938587 100.0% $112 ] 587 $0588 100.0% $2 ] 588 $0590 100.0% $518 ] 590 $0607 100.0% $10,098 ] 607 $21,521612 100.0% $4,766 ] 612 $52,837618 100.0% $165 ] 618 $580,881619 100.0% $748,929 ] 619 $0620 100.0% $111 ] 620 $55,950630 100.0% $3,060 ] 630 $159,125776 100.0% $37 ] 776 $128,337798 100.0% $65,477 ] 798 $304,161891 100.0% $30,222 ] 891 $320,416892 100.0% $37,352 ] 892 $107,737893 100.0% $515,162 ] 893 $2,082,722894 100.0% $325,562 ] 894 $21,483896 100.0% $233 ] 896 $799,401897 100.0% $1,739 ] 897 $0898 100.0% $15,766 ] 898 $10,008899 100.0% $1,767 ] 899 $9,815
Package Page 14 AMP Workhour Costs - Current
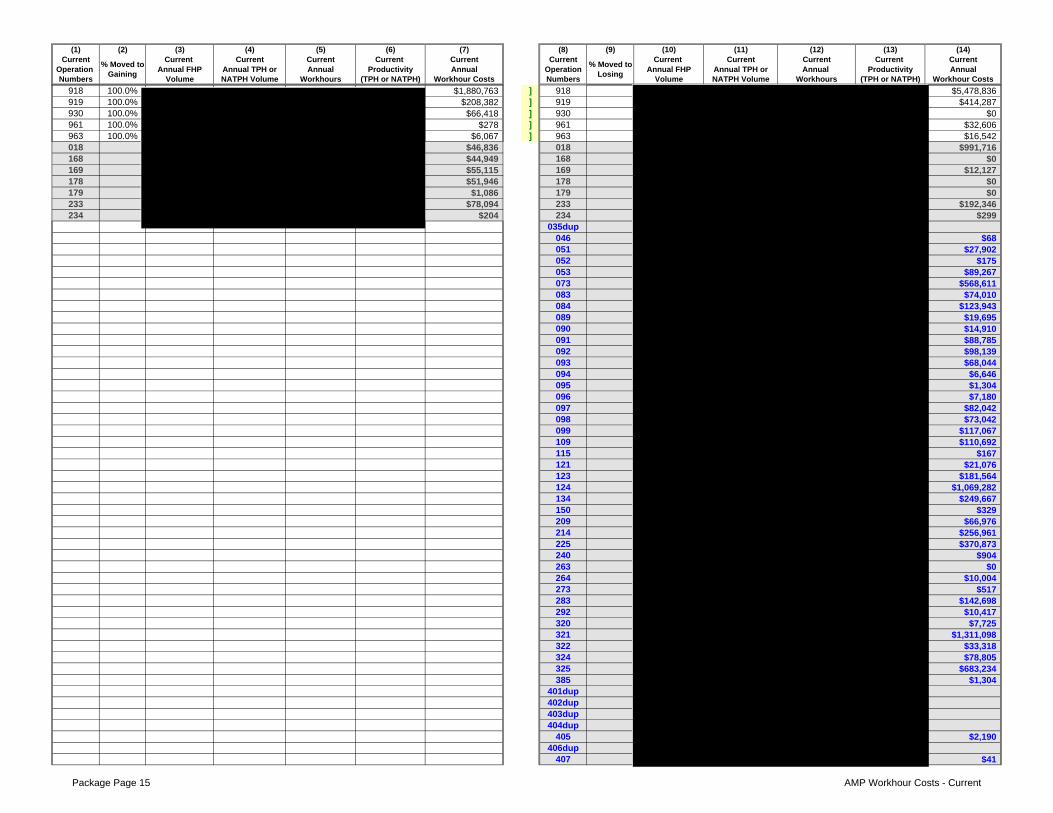
(1) (2) (3) (4) (5) (6) (7) (8) (9) (10) (11) (12) (13) (14)Current Current Current Current Current Current Current Current Current Current Current Current
Operation Annual FHP Annual TPH or Annual Productivity Annual Operation Annual FHP Annual TPH or Annual Productivity AnnualNumbers Volume NATPH Volume Workhours (TPH or NATPH) Workhour Costs Numbers Volume NATPH Volume Workhours (TPH or NATPH) Workhour Costs
% Moved to Losing
% Moved to Gaining
918 100.0% $1,880,763 ] 918 $5,478,836919 100.0% $208,382 ] 919 $414,287930 100.0% $66,418 ] 930 $0961 100.0% $278 ] 961 $32,606963 100.0% $6,067 ] 963 $16,542018 $46,836 018 $991,716168 $44,949 168 $0169 $55,115 169 $12,127178 $51,946 178 $0179 $1,086 179 $0233 $78,094 233 $192,346234 $204 234 $299
035dup046 $68051 $27,902052 $175053 $89,267073 $568,611083 $74,010084 $123,943089 $19,695090 $14,910091 $88,785092 $98,139093 $68,044094 $6,646095 $1,304096 $7,180097 $82,042098 $73,042099 $117,067109 $110,692115 $167121 $21,076123 $181,564124 $1,069,282134 $249,667150 $329209 $66,976214 $256,961225 $370,873240 $904263 $0264 $10,004273 $517283 $142,698292 $10,417320 $7,725321 $1,311,098322 $33,318324 $78,805325 $683,234385 $1,304
401dup402dup403dup404dup
405 $2,190406dup
407 $41
Package Page 15 AMP Workhour Costs - Current
(1) (2) (3) (4) (5) (6) (7) (8) (9) (10) (11) (12) (13) (14)Current Current Current Current Current Current Current Current Current Current Current Current
Operation Annual FHP Annual TPH or Annual Productivity Annual Operation Annual FHP Annual TPH or Annual Productivity AnnualNumbers Volume NATPH Volume Workhours (TPH or NATPH) Workhour Costs Numbers Volume NATPH Volume Workhours (TPH or NATPH) Workhour Costs
% Moved to Losing
% Moved to Gaining
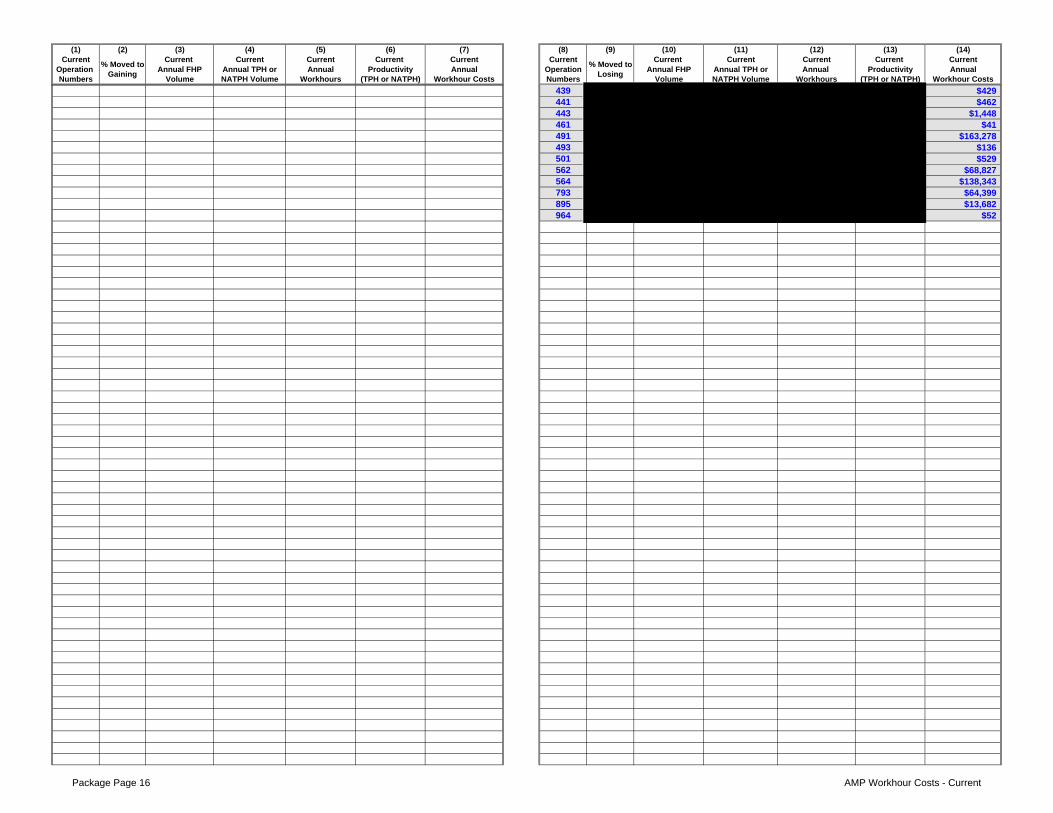
439 $429441 $462443 $1,448461 $41491 $163,278493 $136501 $529562 $68,827564 $138,343793 $64,399895 $13,682964 $52
Package Page 16 AMP Workhour Costs - Current
(1) (2) (3) (4) (5) (6) (7) (8) (9) (10) (11) (12) (13) (14)Current Current Current Current Current Current Current Current Current Current Current Current
Operation Annual FHP Annual TPH or Annual Productivity Annual Operation Annual FHP Annual TPH or Annual Productivity AnnualNumbers Volume NATPH Volume Workhours (TPH or NATPH) Workhour Costs Numbers Volume NATPH Volume Workhours (TPH or NATPH) Workhour Costs
% Moved to Losing
% Moved to Gaining
Package Page 17 AMP Workhour Costs - Current
(1) (2) (3) (4) (5) (6) (7) (8) (9) (10) (11) (12) (13) (14)Current Current Current Current Current Current Current Current Current Current Current Current
Operation Annual FHP Annual TPH or Annual Productivity Annual Operation Annual FHP Annual TPH or Annual Productivity AnnualNumbers Volume NATPH Volume Workhours (TPH or NATPH) Workhour Costs Numbers Volume NATPH Volume Workhours (TPH or NATPH) Workhour Costs
% Moved to Losing
% Moved to Gaining
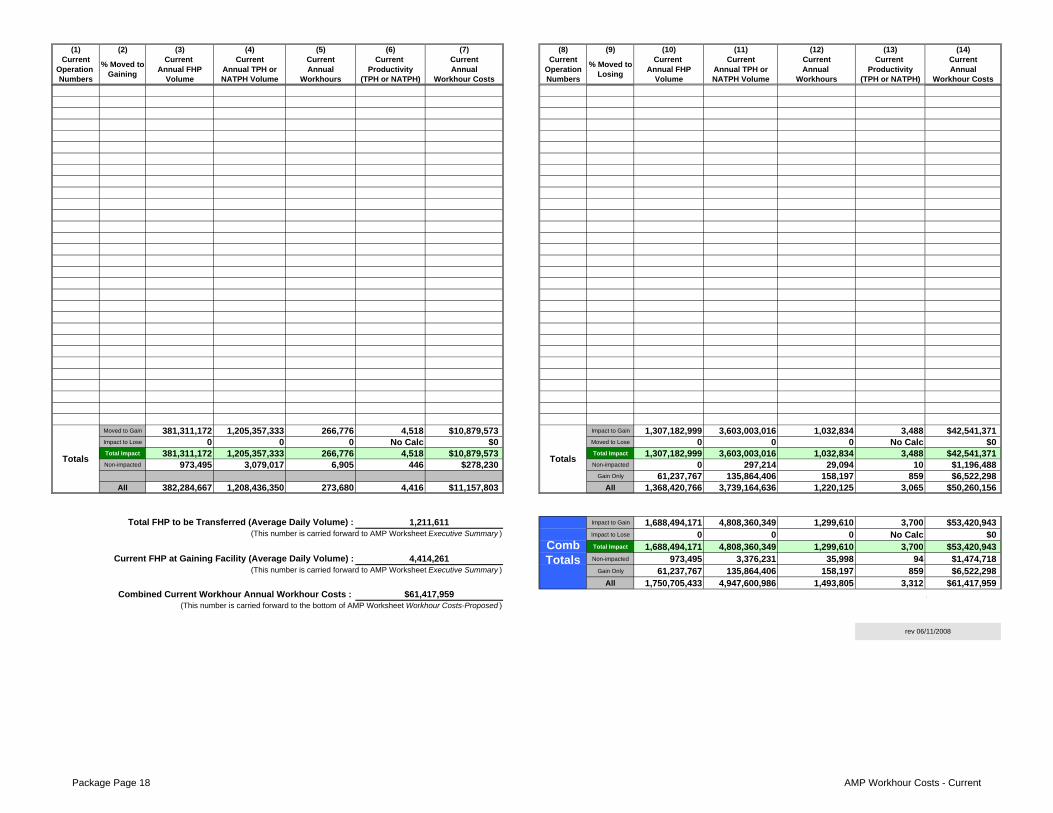
Moved to Gain 381,311,172 1,205,357,333 266,776 4,518 $10,879,573 Impact to Gain 1,307,182,999 3,603,003,016 1,032,834 3,488 $42,541,371Impact to Lose 0 0 0 No Calc $0 Moved to Lose 0 0 0 No Calc $0Total Impact 381,311,172 1,205,357,333 266,776 4,518 $10,879,573 Total Impact 1,307,182,999 3,603,003,016 1,032,834 3,488 $42,541,371Non-impacted 973,495 3,079,017 6,905 446 $278,230 Non-impacted 0 297,214 29,094 10 $1,196,488
Gain Only 61,237,767 135,864,406 158,197 859 $6,522,298All 382,284,667 1,208,436,350 273,680 4,416 $11,157,803 All 1,368,420,766 3,739,164,636 1,220,125 3,065 $50,260,156
Impact to Gain 1,688,494,171 4,808,360,349 1,299,610 3,700 $53,420,943Impact to Lose 0 0 0 No Calc $0Total Impact 1,688,494,171 4,808,360,349 1,299,610 3,700 $53,420,943Non-impacted 973,495 3,376,231 35,998 94 $1,474,718
Gain Only 61,237,767 135,864,406 158,197 859 $6,522,298All 1,750,705,433 4,947,600,986 1,493,805 3,312 $61,417,959
.
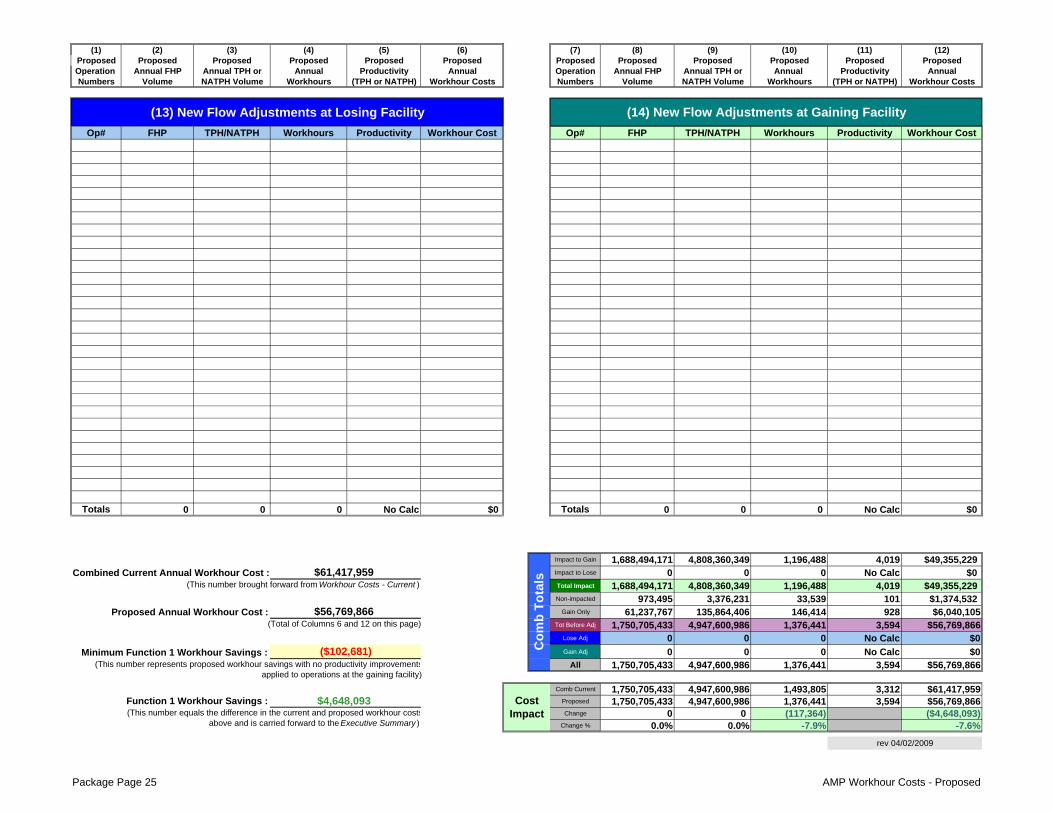
(This number is carried forward to the bottom of AMP Worksheet Workhour Costs-Proposed )$61,417,959
Current FHP at Gaining Facility (Average Daily Volume) : 4,414,261 (This number is carried forward to AMP Worksheet Executive Summary )
(This number is carried forward to AMP Worksheet Executive Summary )
Combined Current Workhour Annual Workhour Costs :
1,211,611 Total FHP to be Transferred (Average Daily Volume) :
Totals
rev 06/11/2008
Comb Totals
Totals
Package Page 18 AMP Workhour Costs - Current
Last Saved:
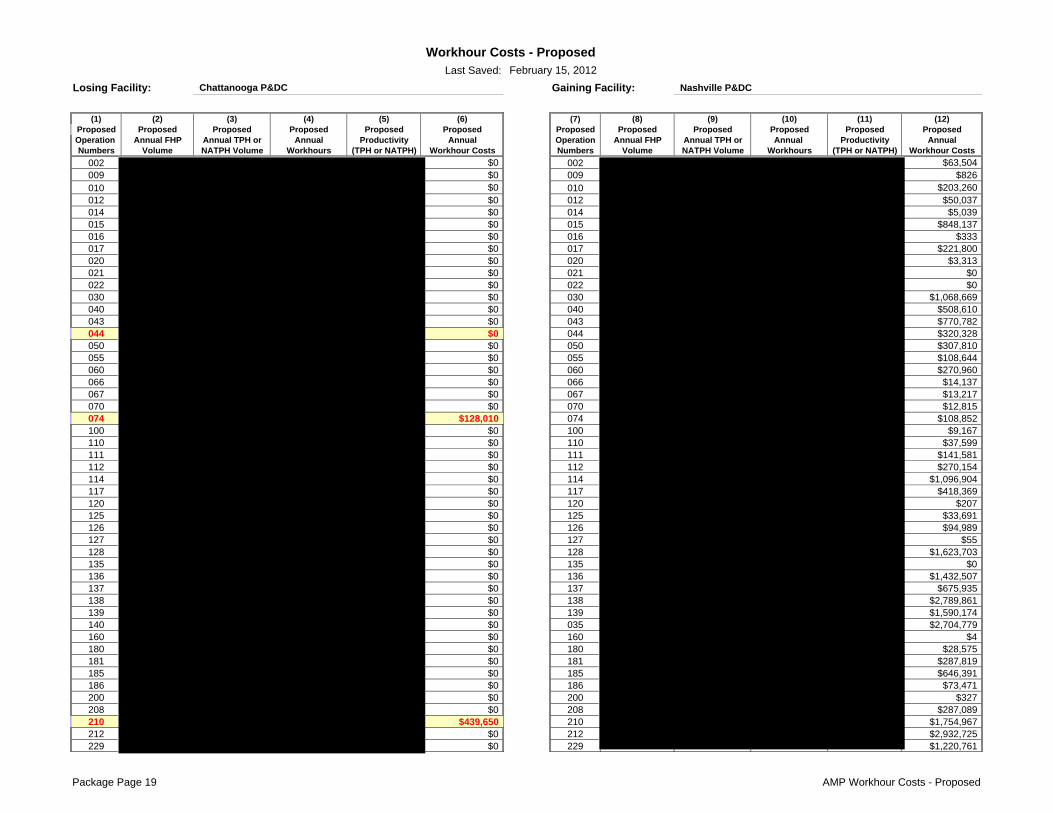
Losing Facility: Gaining Facility:
(1) (2) (3) (4) (5) (6) (7) (8) (9) (10) (11) (12)Proposed Proposed Proposed Proposed Proposed Proposed Proposed Proposed Proposed Proposed Proposed ProposedOperation Annual FHP Annual TPH or Annual Productivity Annual Operation Annual FHP Annual TPH or Annual Productivity AnnualNumbers Volume NATPH Volume Workhours (TPH or NATPH) Workhour Costs Numbers Volume NATPH Volume Workhours (TPH or NATPH) Workhour Costs
002 $0 002 $63,504009 $0 009 $826010 $0 010 $203,260012 $0 012 $50,037014 $0 014 $5,039015 $0 015 $848,137016 $0 016 $333017 $0 017 $221,800020 $0 020 $3,313021 $0 021 $0022 $0 022 $0030 $0 030 $1,068,669040 $0 040 $508,610043 $0 043 $770,782044 $0 044 $320,328050 $0 050 $307,810055 $0 055 $108,644060 $0 060 $270,960066 $0 066 $14,137067 $0 067 $13,217070 $0 070 $12,815074 $128,010 074 $108,852100 $0 100 $9,167110 $0 110 $37,599111 $0 111 $141,581112 $0 112 $270,154114 $0 114 $1,096,904117 $0 117 $418,369120 $0 120 $207125 $0 125 $33,691126 $0 126 $94,989127 $0 127 $55128 $0 128 $1,623,703135 $0 135 $0136 $0 136 $1,432,507137 $0 137 $675,935138 $0 138 $2,789,861139 $0 139 $1,590,174140 $0 035 $2,704,779160 $0 160 $4180 $0 180 $28,575181 $0 181 $287,819185 $0 185 $646,391186 $0 186 $73,471200 $0 200 $327208 $0 208 $287,089210 $439,650 210 $1,754,967212 $0 212 $2,932,725229 $0 229 $1,220,761
Nashville P&DC
Workhour Costs - Proposed
Chattanooga P&DC
February 15, 2012
Package Page 19 AMP Workhour Costs - Proposed
(1) (2) (3) (4) (5) (6) (7) (8) (9) (10) (11) (12)Proposed Proposed Proposed Proposed Proposed Proposed Proposed Proposed Proposed Proposed Proposed ProposedOperation Annual FHP Annual TPH or Annual Productivity Annual Operation Annual FHP Annual TPH or Annual Productivity AnnualNumbers Volume NATPH Volume Workhours (TPH or NATPH) Workhour Costs Numbers Volume NATPH Volume Workhours (TPH or NATPH) Workhour Costs
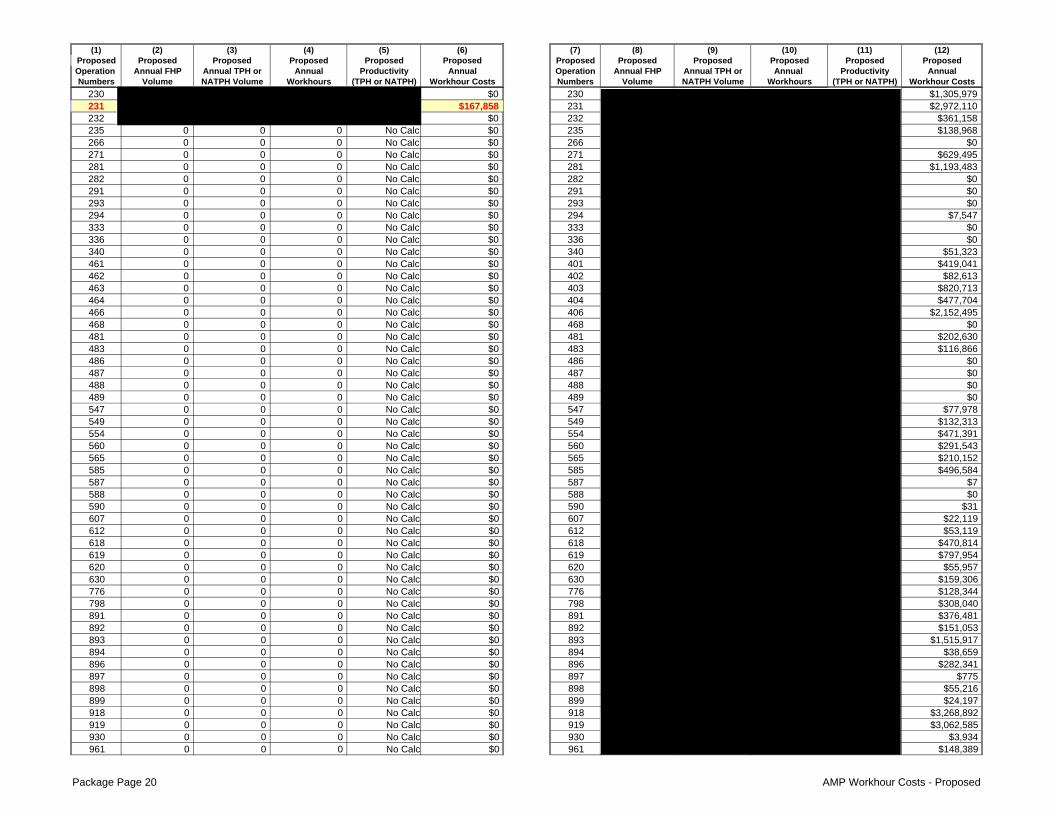
230 $0 230 $1,305,979231 $167,858 231 $2,972,110232 $0 232 $361,158235 0 0 0 No Calc $0 235 $138,968266 0 0 0 No Calc $0 266 $0271 0 0 0 No Calc $0 271 $629,495281 0 0 0 No Calc $0 281 $1,193,483282 0 0 0 No Calc $0 282 $0291 0 0 0 No Calc $0 291 $0293 0 0 0 No Calc $0 293 $0294 0 0 0 No Calc $0 294 $7,547333 0 0 0 No Calc $0 333 $0336 0 0 0 No Calc $0 336 $0340 0 0 0 No Calc $0 340 $51,323461 0 0 0 No Calc $0 401 $419,041462 0 0 0 No Calc $0 402 $82,613463 0 0 0 No Calc $0 403 $820,713464 0 0 0 No Calc $0 404 $477,704466 0 0 0 No Calc $0 406 $2,152,495468 0 0 0 No Calc $0 468 $0481 0 0 0 No Calc $0 481 $202,630483 0 0 0 No Calc $0 483 $116,866486 0 0 0 No Calc $0 486 $0487 0 0 0 No Calc $0 487 $0488 0 0 0 No Calc $0 488 $0489 0 0 0 No Calc $0 489 $0547 0 0 0 No Calc $0 547 $77,978549 0 0 0 No Calc $0 549 $132,313554 0 0 0 No Calc $0 554 $471,391560 0 0 0 No Calc $0 560 $291,543565 0 0 0 No Calc $0 565 $210,152585 0 0 0 No Calc $0 585 $496,584587 0 0 0 No Calc $0 587 $7588 0 0 0 No Calc $0 588 $0590 0 0 0 No Calc $0 590 $31607 0 0 0 No Calc $0 607 $22,119612 0 0 0 No Calc $0 612 $53,119618 0 0 0 No Calc $0 618 $470,814619 0 0 0 No Calc $0 619 $797,954620 0 0 0 No Calc $0 620 $55,957630 0 0 0 No Calc $0 630 $159,306776 0 0 0 No Calc $0 776 $128,344798 0 0 0 No Calc $0 798 $308,040891 0 0 0 No Calc $0 891 $376,481892 0 0 0 No Calc $0 892 $151,053893 0 0 0 No Calc $0 893 $1,515,917894 0 0 0 No Calc $0 894 $38,659896 0 0 0 No Calc $0 896 $282,341897 0 0 0 No Calc $0 897 $775898 0 0 0 No Calc $0 898 $55,216899 0 0 0 No Calc $0 899 $24,197918 0 0 0 No Calc $0 918 $3,268,892919 0 0 0 No Calc $0 919 $3,062,585930 0 0 0 No Calc $0 930 $3,934961 0 0 0 No Calc $0 961 $148,389
Package Page 20 AMP Workhour Costs - Proposed
(1) (2) (3) (4) (5) (6) (7) (8) (9) (10) (11) (12)Proposed Proposed Proposed Proposed Proposed Proposed Proposed Proposed Proposed Proposed Proposed ProposedOperation Annual FHP Annual TPH or Annual Productivity Annual Operation Annual FHP Annual TPH or Annual Productivity AnnualNumbers Workhour Costs Numbers Volume NATPH Volume Workhours (TPH or NATPH) Workhour Costs
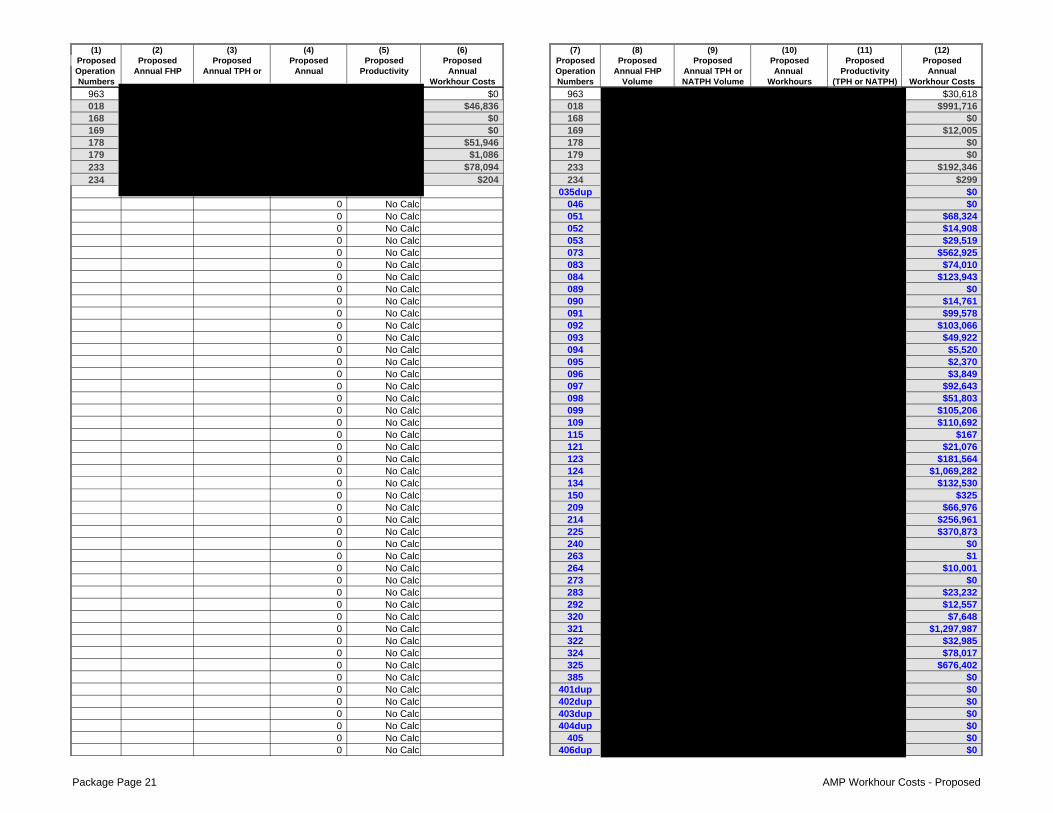
963 $0 963 $30,618018 $46,836 018 $991,716168 $0 168 $0169 $0 169 $12,005178 $51,946 178 $0179 $1,086 179 $0233 $78,094 233 $192,346234 $204 234 $299
035dup $00 No Calc 046 $00 No Calc 051 $68,3240 No Calc 052 $14,9080 No Calc 053 $29,5190 No Calc 073 $562,9250 No Calc 083 $74,0100 No Calc 084 $123,9430 No Calc 089 $00 No Calc 090 $14,7610 No Calc 091 $99,5780 No Calc 092 $103,0660 No Calc 093 $49,9220 No Calc 094 $5,5200 No Calc 095 $2,3700 No Calc 096 $3,8490 No Calc 097 $92,6430 No Calc 098 $51,8030 No Calc 099 $105,2060 No Calc 109 $110,6920 No Calc 115 $1670 No Calc 121 $21,0760 No Calc 123 $181,5640 No Calc 124 $1,069,2820 No Calc 134 $132,5300 No Calc 150 $3250 No Calc 209 $66,9760 No Calc 214 $256,9610 No Calc 225 $370,8730 No Calc 240 $00 No Calc 263 $10 No Calc 264 $10,0010 No Calc 273 $00 No Calc 283 $23,2320 No Calc 292 $12,5570 No Calc 320 $7,6480 No Calc 321 $1,297,9870 No Calc 322 $32,9850 No Calc 324 $78,0170 No Calc 325 $676,4020 No Calc 385 $00 No Calc 401dup $00 No Calc 402dup $00 No Calc 403dup $00 No Calc 404dup $00 No Calc 405 $00 No Calc 406dup $0
Package Page 21 AMP Workhour Costs - Proposed
(1) (2) (3) (4) (5) (6) (7) (8) (9) (10) (11) (12)Proposed Proposed Proposed Proposed Proposed Proposed Proposed Proposed Proposed Proposed Proposed ProposedOperation Annual FHP Annual TPH or Annual Productivity Annual Operation Annual FHP Annual TPH or Annual Productivity AnnualNumbers Volume NATPH Volume Workhours (TPH or NATPH) Workhour Costs Numbers Volume NATPH Volume Workhours (TPH or NATPH) Workhour Costs
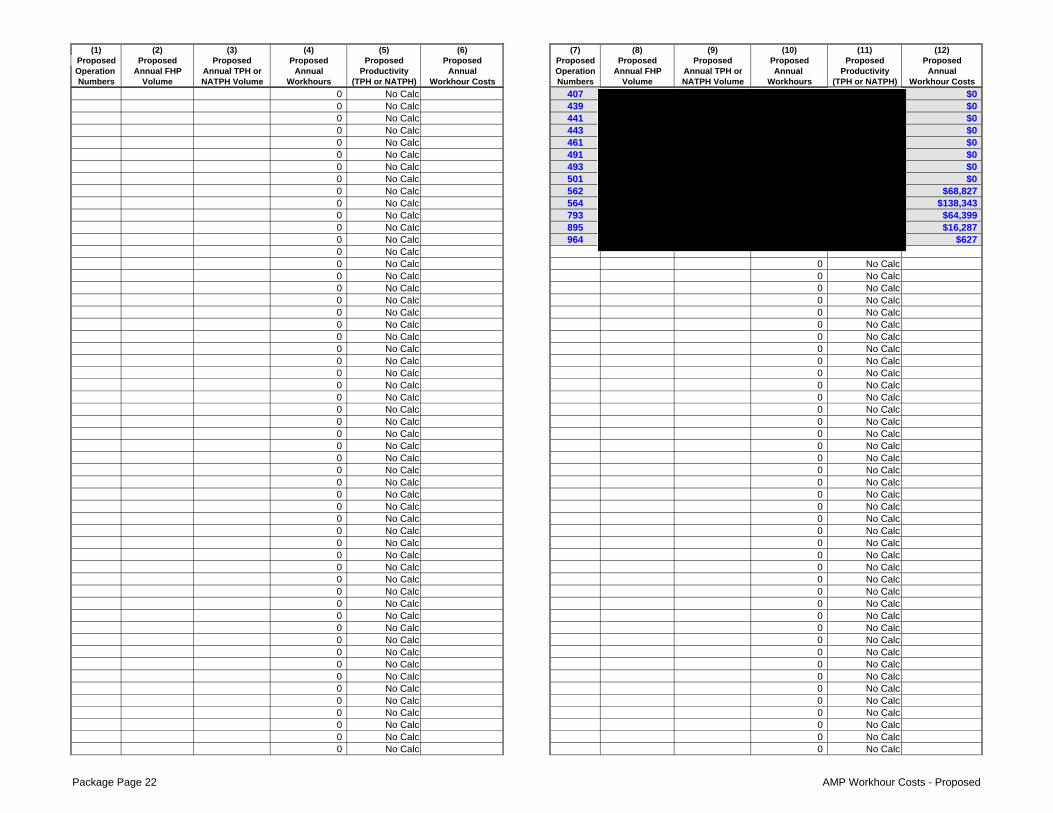
0 No Calc 407 $00 No Calc 439 $00 No Calc 441 $00 No Calc 443 $00 No Calc 461 $00 No Calc 491 $00 No Calc 493 $00 No Calc 501 $00 No Calc 562 $68,8270 No Calc 564 $138,3430 No Calc 793 $64,3990 No Calc 895 $16,2870 No Calc 964 $6270 No Calc0 No Calc 0 No Calc0 No Calc 0 No Calc0 No Calc 0 No Calc0 No Calc 0 No Calc0 No Calc 0 No Calc0 No Calc 0 No Calc0 No Calc 0 No Calc0 No Calc 0 No Calc0 No Calc 0 No Calc0 No Calc 0 No Calc0 No Calc 0 No Calc0 No Calc 0 No Calc0 No Calc 0 No Calc0 No Calc 0 No Calc0 No Calc 0 No Calc0 No Calc 0 No Calc0 No Calc 0 No Calc0 No Calc 0 No Calc0 No Calc 0 No Calc0 No Calc 0 No Calc0 No Calc 0 No Calc0 No Calc 0 No Calc0 No Calc 0 No Calc0 No Calc 0 No Calc0 No Calc 0 No Calc0 No Calc 0 No Calc0 No Calc 0 No Calc0 No Calc 0 No Calc0 No Calc 0 No Calc0 No Calc 0 No Calc0 No Calc 0 No Calc0 No Calc 0 No Calc0 No Calc 0 No Calc0 No Calc 0 No Calc0 No Calc 0 No Calc0 No Calc 0 No Calc0 No Calc 0 No Calc0 No Calc 0 No Calc0 No Calc 0 No Calc0 No Calc 0 No Calc0 No Calc 0 No Calc
Package Page 22 AMP Workhour Costs - Proposed

(1) (2) (3) (4) (5) (6) (7) (8) (9) (10) (11) (12)Proposed Proposed Proposed Proposed Proposed Proposed Proposed Proposed Proposed Proposed Proposed ProposedOperation Annual FHP Annual TPH or Annual Productivity Annual Operation Annual FHP Annual TPH or Annual Productivity AnnualNumbers Volume NATPH Volume Workhours (TPH or NATPH) Workhour Costs Numbers Volume NATPH Volume Workhours (TPH or NATPH) Workhour Costs
0 No Calc 0 No Calc0 No Calc 0 No Calc0 No Calc 0 No Calc0 No Calc 0 No Calc0 No Calc 0 No Calc0 No Calc 0 No Calc0 No Calc 0 No Calc0 No Calc 0 No Calc0 No Calc 0 No Calc0 No Calc 0 No Calc0 No Calc 0 No Calc0 No Calc 0 No Calc0 No Calc 0 No Calc0 No Calc 0 No Calc0 No Calc 0 No Calc0 No Calc 0 No Calc0 No Calc 0 No Calc0 No Calc 0 No Calc0 No Calc 0 No Calc0 No Calc 0 No Calc0 No Calc 0 No Calc0 No Calc 0 No Calc0 No Calc 0 No Calc0 No Calc 0 No Calc0 No Calc 0 No Calc0 No Calc 0 No Calc0 No Calc 0 No Calc0 No Calc 0 No Calc0 No Calc 0 No Calc0 No Calc 0 No Calc0 No Calc 0 No Calc0 No Calc 0 No Calc0 No Calc 0 No Calc0 No Calc 0 No Calc0 No Calc 0 No Calc0 No Calc 0 No Calc0 No Calc 0 No Calc0 No Calc 0 No Calc0 No Calc 0 No Calc0 No Calc 0 No Calc0 No Calc 0 No Calc0 No Calc 0 No Calc0 No Calc 0 No Calc0 No Calc 0 No Calc0 No Calc 0 No Calc0 No Calc 0 No Calc0 No Calc 0 No Calc0 No Calc 0 No Calc0 No Calc 0 No Calc0 No Calc 0 No Calc0 No Calc 0 No Calc0 No Calc 0 No Calc0 No Calc 0 No Calc0 No Calc 0 No Calc0 No Calc 0 No Calc
Package Page 23 AMP Workhour Costs - Proposed
(1) (2) (3) (4) (5) (6) (7) (8) (9) (10) (11) (12)Proposed Proposed Proposed Proposed Proposed Proposed Proposed Proposed Proposed Proposed Proposed ProposedOperation Annual FHP Annual TPH or Annual Productivity Annual Operation Annual FHP Annual TPH or Annual Productivity AnnualNumbers Volume NATPH Volume Workhours (TPH or NATPH) Workhour Costs Numbers Volume NATPH Volume Workhours (TPH or NATPH) Workhour Costs
0 No Calc 0 No Calc0 No Calc 0 No Calc0 No Calc 0 No Calc0 No Calc 0 No Calc0 No Calc 0 No Calc0 No Calc 0 No Calc0 No Calc 0 No Calc0 No Calc 0 No Calc0 No Calc 0 No Calc0 No Calc 0 No Calc0 No Calc 0 No Calc0 No Calc 0 No Calc0 No Calc 0 No Calc0 No Calc 0 No Calc0 No Calc 0 No Calc0 No Calc 0 No Calc0 No Calc 0 No Calc0 No Calc 0 No Calc0 No Calc 0 No Calc0 No Calc 0 No Calc0 No Calc 0 No Calc0 No Calc 0 No Calc0 No Calc 0 No Calc0 No Calc 0 No Calc0 No Calc 0 No Calc0 No Calc 0 No Calc0 No Calc 0 No Calc0 No Calc 0 No Calc0 No Calc 0 No Calc0 No Calc 0 No Calc0 No Calc 0 No Calc0 No Calc 0 No Calc0 No Calc 0 No Calc0 No Calc 0 No Calc0 No Calc 0 No Calc0 No Calc 0 No Calc0 No Calc 0 No Calc0 No Calc 0 No Calc0 No Calc 0 No Calc0 No Calc 0 No Calc0 No Calc 0 No Calc
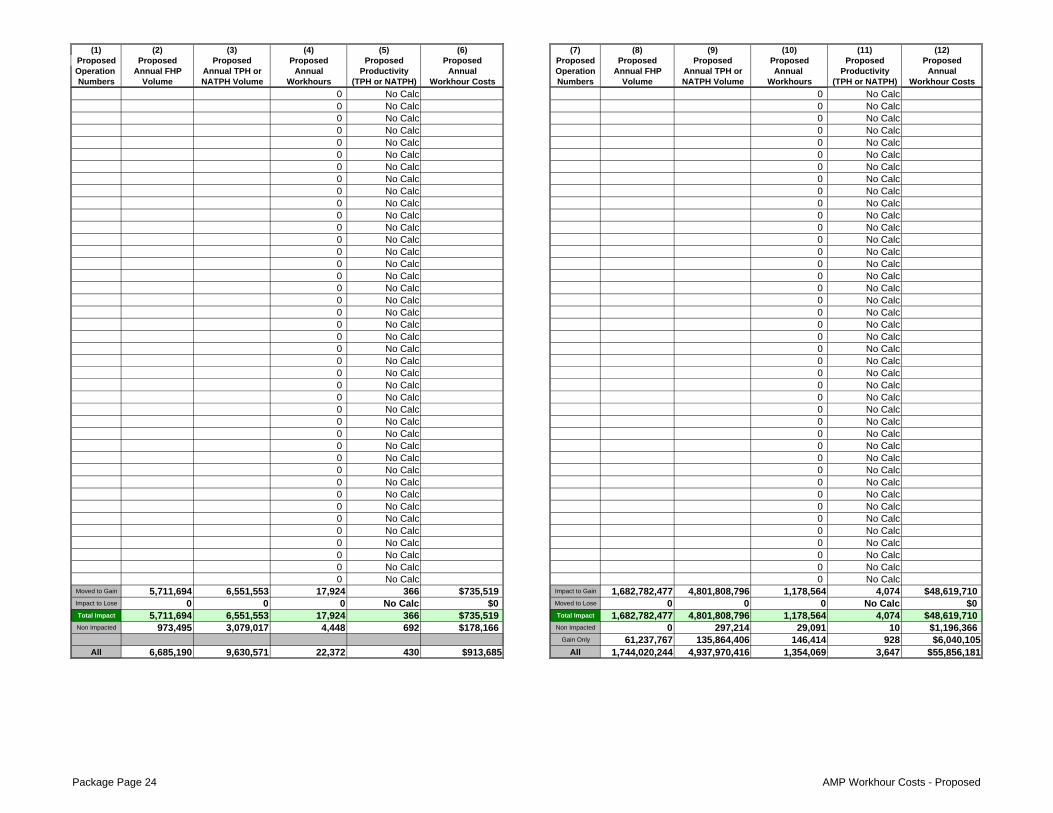
Moved to Gain 5,711,694 6,551,553 17,924 366 $735,519 Impact to Gain 1,682,782,477 4,801,808,796 1,178,564 4,074 $48,619,710Impact to Lose 0 0 0 No Calc $0 Moved to Lose 0 0 0 No Calc $0Total Impact 5,711,694 6,551,553 17,924 366 $735,519 Total Impact 1,682,782,477 4,801,808,796 1,178,564 4,074 $48,619,710Non Impacted 973,495 3,079,017 4,448 692 $178,166 Non Impacted 0 297,214 29,091 10 $1,196,366
Gain Only 61,237,767 135,864,406 146,414 928 $6,040,105All 6,685,190 9,630,571 22,372 430 $913,685 All 1,744,020,244 4,937,970,416 1,354,069 3,647 $55,856,181
Package Page 24 AMP Workhour Costs - Proposed
(1) (2) (3) (4) (5) (6) (7) (8) (9) (10) (11) (12)Proposed Proposed Proposed Proposed Proposed Proposed Proposed Proposed Proposed Proposed Proposed ProposedOperation Annual FHP Annual TPH or Annual Productivity Annual Operation Annual FHP Annual TPH or Annual Productivity AnnualNumbers Volume NATPH Volume Workhours (TPH or NATPH) Workhour Costs Numbers Volume NATPH Volume Workhours (TPH or NATPH) Workhour Costs
Op# FHP TPH/NATPH Workhours Productivity Workhour Cost Op# FHP TPH/NATPH Workhours Productivity Workhour Cost
Totals 0 0 0 No Calc $0 Totals 0 0 0 No Calc $0
Impact to Gain 1,688,494,171 4,808,360,349 1,196,488 4,019 $49,355,229Combined Current Annual Workhour Cost : Impact to Lose 0 0 0 No Calc $0
Total Impact 1,688,494,171 4,808,360,349 1,196,488 4,019 $49,355,229Non-impacted 973,495 3,376,231 33,539 101 $1,374,532
Gain Only 61,237,767 135,864,406 146,414 928 $6,040,105Tot Before Adj 1,750,705,433 4,947,600,986 1,376,441 3,594 $56,769,866
Lose Adj 0 0 0 No Calc $0Gain Adj 0 0 0 No Calc $0
All 1,750,705,433 4,947,600,986 1,376,441 3,594 $56,769,866
Comb Current 1,750,705,433 4,947,600,986 1,493,805 3,312 $61,417,959Proposed 1,750,705,433 4,947,600,986 1,376,441 3,594 $56,769,866Change 0 0 (117,364) ($4,648,093)
Change % 0.0% 0.0% -7.9% -7.6%
rev 04/02/2009
(14) New Flow Adjustments at Gaining Facility(13) New Flow Adjustments at Losing Facility
$61,417,959
Proposed Annual Workhour Cost :(Total of Columns 6 and 12 on this page)
$56,769,866
Co
mb
To
tals
Cost Impact(This number equals the difference in the current and proposed workhour costs
above and is carried forward to the Executive Summary )
(This number brought forward from Workhour Costs - Current )
Function 1 Workhour Savings : $4,648,093
Minimum Function 1 Workhour Savings : ($102,681)(This number represents proposed workhour savings with no productivity improvements
applied to operations at the gaining facility)
Package Page 25 AMP Workhour Costs - Proposed
Last Saved:
to
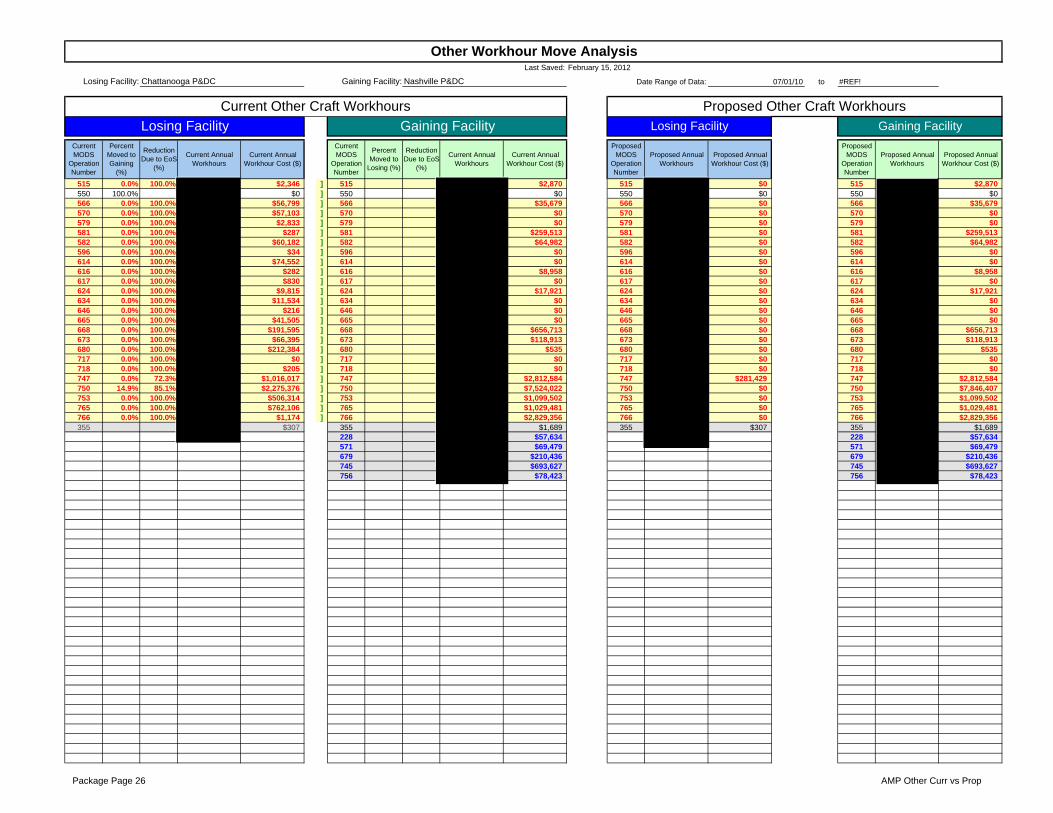
515 0.0% 100.0% $2,346 ] 515 $2,870 515 $0 515 $2,870550 100.0% $0 ] 550 $0 550 $0 550 $0566 0.0% 100.0% $56,799 ] 566 $35,679 566 $0 566 $35,679570 0.0% 100.0% $57,103 ] 570 $0 570 $0 570 $0579 0.0% 100.0% $2,833 ] 579 $0 579 $0 579 $0581 0.0% 100.0% $287 ] 581 $259,513 581 $0 581 $259,513582 0.0% 100.0% $60,182 ] 582 $64,982 582 $0 582 $64,982596 0.0% 100.0% $34 ] 596 $0 596 $0 596 $0614 0.0% 100.0% $74,552 ] 614 $0 614 $0 614 $0616 0.0% 100.0% $282 ] 616 $8,958 616 $0 616 $8,958617 0.0% 100.0% $830 ] 617 $0 617 $0 617 $0624 0.0% 100.0% $9,815 ] 624 $17,921 624 $0 624 $17,921634 0.0% 100.0% $11,534 ] 634 $0 634 $0 634 $0646 0.0% 100.0% $216 ] 646 $0 646 $0 646 $0665 0.0% 100.0% $41,505 ] 665 $0 665 $0 665 $0668 0.0% 100.0% $191,595 ] 668 $656,713 668 $0 668 $656,713673 0.0% 100.0% $66,395 ] 673 $118,913 673 $0 673 $118,913680 0.0% 100.0% $212,384 ] 680 $535 680 $0 680 $535717 0.0% 100.0% $0 ] 717 $0 717 $0 717 $0718 0.0% 100.0% $205 ] 718 $0 718 $0 718 $0747 0.0% 72.3% $1,016,017 ] 747 $2,812,584 747 $281,429 747 $2,812,584750 14.9% 85.1% $2,275,376 ] 750 $7,524,022 750 $0 750 $7,846,407753 0.0% 100.0% $506,314 ] 753 $1,099,502 753 $0 753 $1,099,502765 0.0% 100.0% $762,106 ] 765 $1,029,481 765 $0 765 $1,029,481766 0.0% 100.0% $1,174 ] 766 $2,829,356 766 $0 766 $2,829,356355 $307 355 $1,689 355 $307 355 $1,689
228 $57,634 228 $57,634571 $69,479 571 $69,479679 $210,436 679 $210,436745 $693,627 745 $693,627756 $78,423 756 $78,423
Proposed Other Craft Workhours
Proposed Annual Workhours
Proposed Annual Workhour Cost ($)
Other Workhour Move Analysis
Chattanooga P&DCLosing Facility: Gaining Facility: Nashville P&DC Date Range of Data: #REF!07/01/10
February 15, 2012
Proposed MODS
Operation Number
Proposed Annual Workhours
Current Other Craft Workhours
Current Annual Workhour Cost ($)
Current MODS
Operation Number
Percent Moved to Gaining
(%)
Current Annual Workhours
Current Annual Workhours
Reduction Due to EoS
(%)
Reduction Due to EoS
(%)
Proposed Annual Workhour Cost ($)
Gaining Facility Losing FacilityLosing Facility Gaining Facility
Current MODS
Operation Number
Percent Moved to
Losing (%)
Current Annual Workhour Cost ($)
Proposed MODS
Operation Number
Package Page 26 AMP Other Curr vs Prop

Package Page 27 AMP Other Curr vs Prop
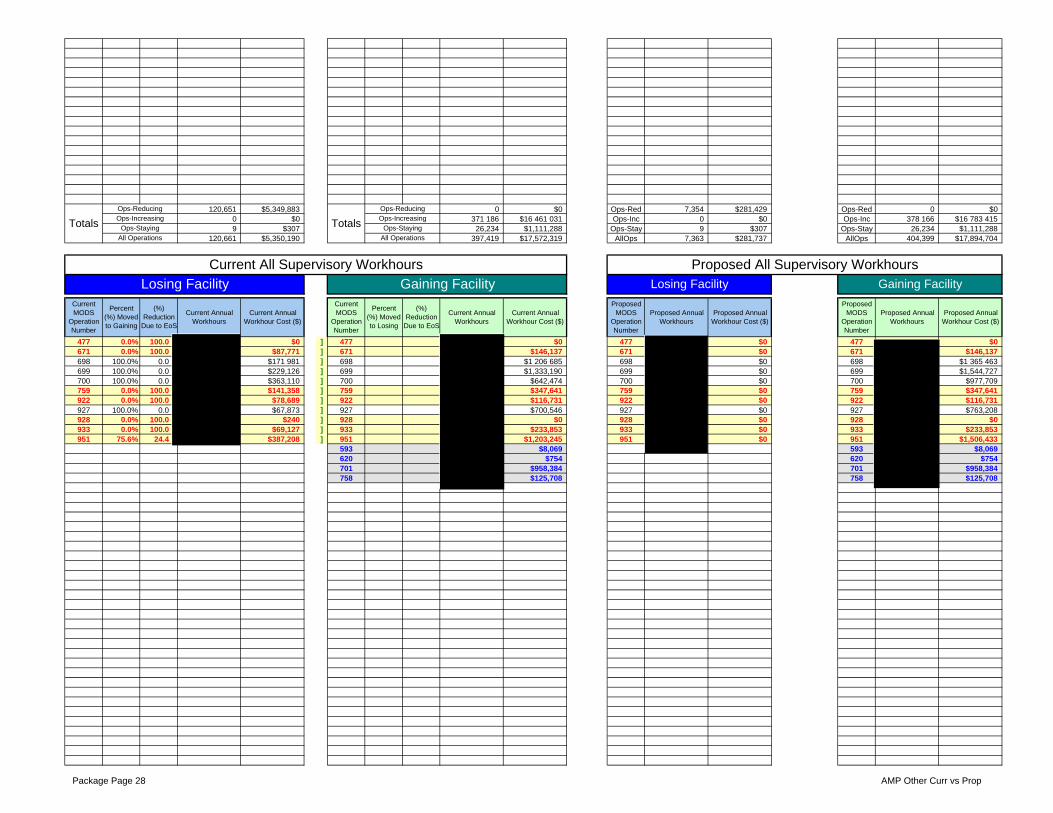
120,651 $5,349,883 0 $0 Ops-Red 7,354 $281,429 Ops-Red 0 $00 $0 371 186 $16 461 031 Ops-Inc 0 $0 Ops-Inc 378 166 $16 783 4159 $307 26,234 $1,111,288 Ops-Stay 9 $307 Ops-Stay 26,234 $1,111,288
120,661 $5,350,190 397,419 $17,572,319 AllOps 7,363 $281,737 AllOps 404,399 $17,894,704
477 0.0% 100.0 $0 ] 477 $0 477 $0 477 $0671 0.0% 100.0 $87,771 ] 671 $146,137 671 $0 671 $146,137698 100.0% 0.0 $171 981 ] 698 $1 206 685 698 $0 698 $1 365 463699 100.0% 0.0 $229,126 ] 699 $1,333,190 699 $0 699 $1,544,727700 100.0% 0.0 $363,110 ] 700 $642,474 700 $0 700 $977,709759 0.0% 100.0 $141,358 ] 759 $347,641 759 $0 759 $347,641922 0.0% 100.0 $78,689 ] 922 $116,731 922 $0 922 $116,731927 100.0% 0.0 $67,873 ] 927 $700,546 927 $0 927 $763,208928 0.0% 100.0 $240 ] 928 $0 928 $0 928 $0933 0.0% 100.0 $69,127 ] 933 $233,853 933 $0 933 $233,853951 75.6% 24.4 $387,208 ] 951 $1,203,245 951 $0 951 $1,506,433
593 $8,069 593 $8,069620 $754 620 $754701 $958,384 701 $958,384758 $125,708 758 $125,708
Proposed MODS
Operation Number
Proposed Annual Workhours
Proposed All Supervisory WorkhoursLosing Facility
Current Annual Workhour Cost ($)
Proposed Annual Workhour Cost ($)
Proposed MODS
Operation Number
Proposed Annual Workhours
Proposed Annual Workhour Cost ($)
Current All Supervisory Workhours
Current Annual Workhour Cost ($)
Current Annual Workhours
Current MODS
Operation Number
Losing Facility Gaining Facility
Totals
Ops-ReducingOps-Increasing
Ops-StayingAll Operations
Percent (%) Moved to Losing
(%) Reduction
Due to EoS
Percent (%) Moved to Gaining
(%) Reduction
Due to EoS
Current Annual Workhours
Totals
Ops-ReducingOps-Increasing
Ops-StayingAll Operations
Gaining Facility
Current MODS
Operation Number
Package Page 28 AMP Other Curr vs Prop

Package Page 29 AMP Other Curr vs Prop
30 244 $1 596 484 0 $0 Ops-Red 0 $0 Ops-Red 0 $00 $0 119,012 $5,930,502 Ops-Inc 0 $0 Ops-Inc 140,773 $7,001,9040 $0 23,027 $1,092,915 Ops-Stay 0 $0 Ops-Stay 23,027 $1,092,915
30 244 $1 596 484 142 039 $7 023 417 AllOps 0 $0 AllOps 163 800 $8 094 819
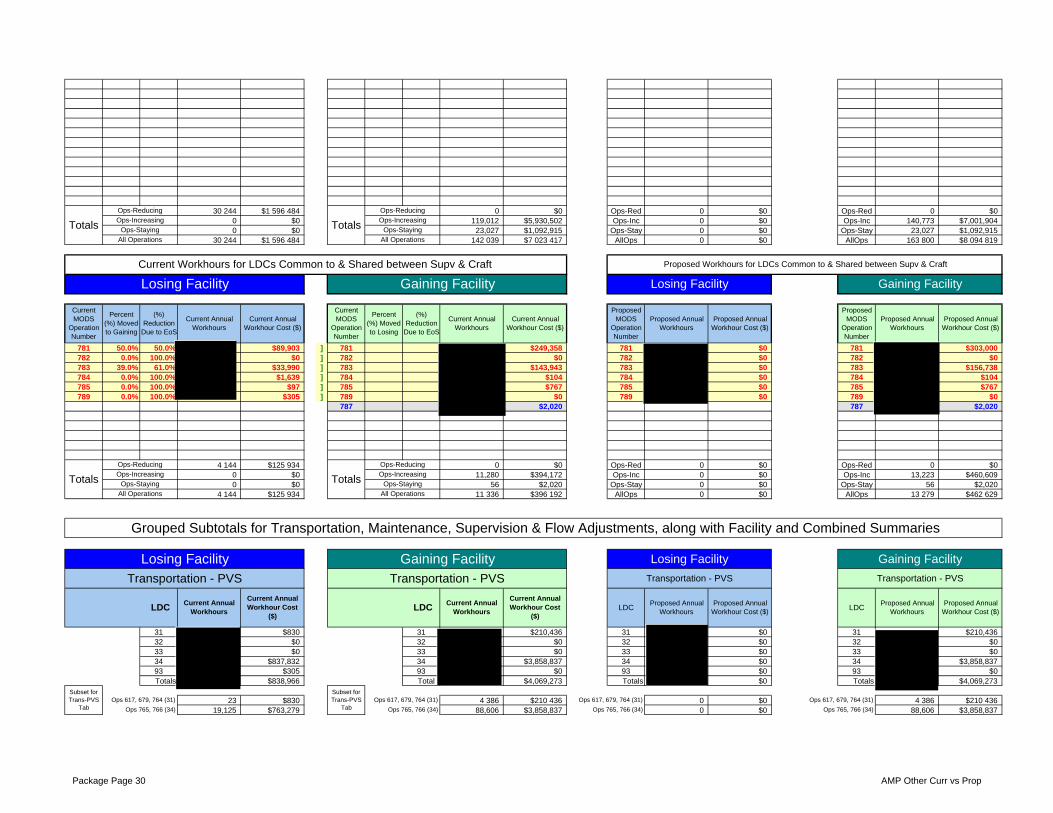
781 50.0% 50.0% $89,903 ] 781 $249,358 781 $0 781 $303,000782 0.0% 100.0% $0 ] 782 $0 782 $0 782 $0783 39.0% 61.0% $33,990 ] 783 $143,943 783 $0 783 $156,738784 0.0% 100.0% $1,639 ] 784 $104 784 $0 784 $104785 0.0% 100.0% $97 ] 785 $767 785 $0 785 $767789 0.0% 100.0% $305 ] 789 $0 789 $0 789 $0
787 $2,020 787 $2,020
4 144 $125 934 0 $0 Ops-Red 0 $0 Ops-Red 0 $00 $0 11,280 $394,172 Ops-Inc 0 $0 Ops-Inc 13,223 $460,6090 $0 56 $2,020 Ops-Stay 0 $0 Ops-Stay 56 $2,020
4 144 $125 934 11 336 $396 192 AllOps 0 $0 AllOps 13 279 $462 629
31 $830 31 $210,436 31 $0 31 $210,43632 $0 32 $0 32 $0 32 $033 $0 33 $0 33 $0 33 $034 $837,832 34 $3,858,837 34 $0 34 $3,858,83793 $305 93 $0 93 $0 93 $0Totals $838,966 Total $4,069,273 Totals $0 Totals $4,069,273
23 $830 4 386 $210 436 0 $0 4 386 $210 43619,125 $763,279 88,606 $3,858,837 0 $0 88,606 $3,858,837
Proposed Annual Workhours
Proposed Annual Workhour Cost ($)
Transportation - PVS
LDCProposed Annual
WorkhoursLDC
Proposed MODS
Operation Number
Proposed Annual Workhours
Ops 765, 766 (34)
Proposed Annual Workhour Cost ($)
Transportation - PVS
Proposed Annual Workhour Cost ($)
Proposed MODS
Operation Number
Proposed Annual Workhours
Proposed Annual Workhour Cost ($)
Totals
Ops-ReducingOps-Increasing
Ops-StayingAll Operations
(%) Reduction
Due to EoS
Current Annual Workhours
Current Annual Workhour Cost ($)
Transportation - PVS
Totals
Ops-ReducingOps-Increasing
Ops-Staying
Ops-Reducing
Percent (%) Moved to Gaining
Losing Facility
Ops 617, 679, 764 (31)Subset for Trans-PVS
Tab
Losing Facility
Losing Facility Gaining Facility
TotalsOps-Increasing
Ops-Staying
Totals
Ops 765, 766 (34)
Ops-Reducing
All Operations
Current Workhours for LDCs Common to & Shared between Supv & Craft Proposed Workhours for LDCs Common to & Shared between Supv & Craft
Current MODS
Operation Number
Gaining Facility
Gaining Facility
Ops 617, 679, 764 (31)
Ops 765, 766 (34)
Ops 617, 679, 764 (31)
All Operations
Percent (%) Moved to Losing
Gaining Facility Losing Facility
Current Annual Workhour Cost ($)
LDCCurrent Annual
Workhours
Current Annual Workhour Cost
($)
Current MODS
Operation Number
(%) Reduction
Due to EoS
Grouped Subtotals for Transportation, Maintenance, Supervision & Flow Adjustments, along with Facility and Combined Summaries
Ops-IncreasingOps-Staying
All Operations
Current Annual Workhours
Subset for Trans-PVS
TabOps 617, 679, 764 (31)
Transportation - PVS
LDCCurrent Annual
Workhours
Current Annual Workhour Cost
($)
Ops 765, 766 (34)
Package Page 30 AMP Other Curr vs Prop
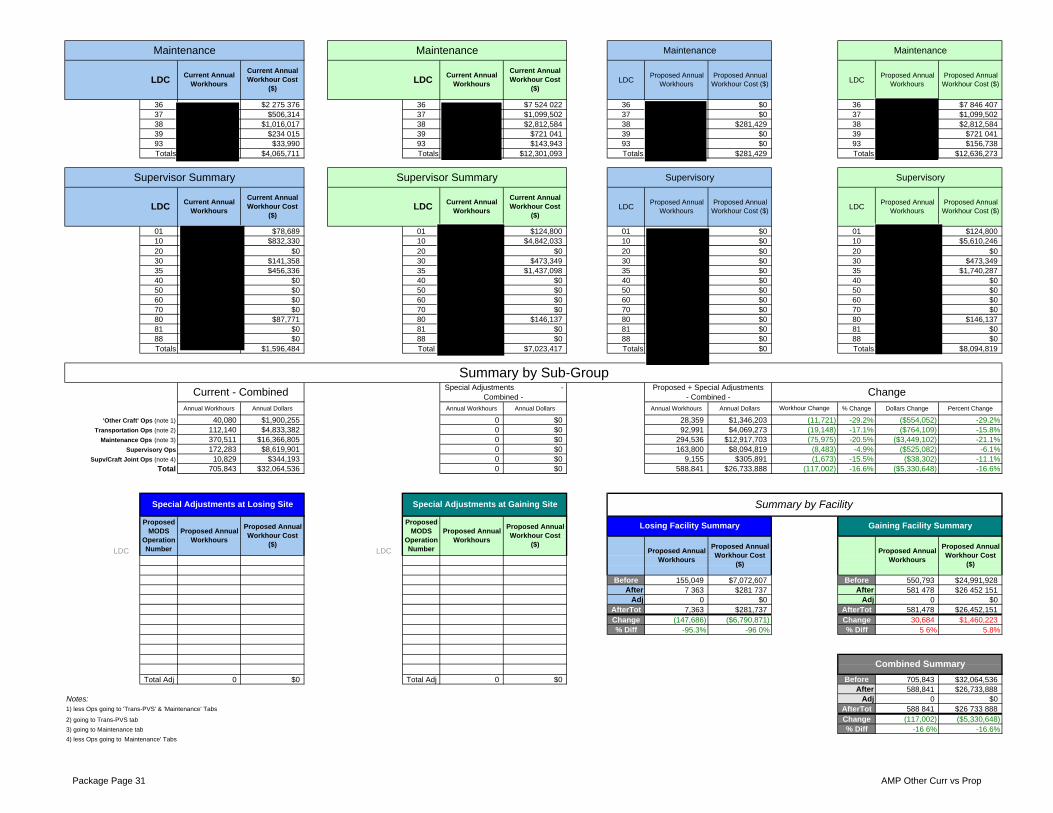
36 $2 275 376 36 $7 524 022 36 $0 36 $7 846 40737 $506,314 37 $1,099,502 37 $0 37 $1,099,50238 $1,016,017 38 $2,812,584 38 $281,429 38 $2,812,58439 $234 015 39 $721 041 39 $0 39 $721 04193 $33,990 93 $143,943 93 $0 93 $156,738Totals $4,065,711 Totals $12,301,093 Totals $281,429 Totals $12,636,273
01 $78,689 01 $124,800 01 $0 01 $124,80010 $832,330 10 $4,842,033 10 $0 10 $5,610,24620 $0 20 $0 20 $0 20 $030 $141,358 30 $473,349 30 $0 30 $473,34935 $456,336 35 $1,437,098 35 $0 35 $1,740,28740 $0 40 $0 40 $0 40 $050 $0 50 $0 50 $0 50 $060 $0 60 $0 60 $0 60 $070 $0 70 $0 70 $0 70 $080 $87,771 80 $146,137 80 $0 80 $146,13781 $0 81 $0 81 $0 81 $088 $0 88 $0 88 $0 88 $0Totals $1,596,484 Total $7,023,417 Totals $0 Totals $8,094,819
Annual Workhours Annual Dollars Annual Workhours Annual Dollars Annual Workhours Annual Dollars % Change Dollars Change Percent Change
40,080 $1,900,255 0 $0 28,359 $1,346,203 -29.2% ($554,052) -29.2%112,140 $4,833,382 0 $0 92,991 $4,069,273 -17.1% ($764,109) -15.8%370,511 $16,366,805 0 $0 294,536 $12,917,703 -20.5% ($3,449,102) -21.1%172,283 $8,619,901 0 $0 163,800 $8,094,819 -4.9% ($525,082) -6.1%
10,829 $344,193 0 $0 9,155 $305,891 -15.5% ($38,302) -11.1%705,843 $32,064,536 0 $0 588,841 $26,733,888 -16.6% ($5,330,648) -16.6%
LDC LDC Before 155,049 $7,072,607 Before 550,793 $24,991,928 After 7 363 $281 737 After 581 478 $26 452 151 Adj 0 $0 Adj 0 $0 AfterTot 7,363 $281,737 AfterTot 581,478 $26,452,151 Change (147,686) ($6,790,871) Change 30,684 $1,460,223 % Diff -95.3% -96 0% % Diff 5 6% 5.8%
Total Adj 0 $0 Total Adj 0 $0 Before 705,843 $32,064,536After 588,841 $26,733,888
Adj 0 $0AfterTot 588 841 $26 733 888Change (117,002) ($5,330,648)% Diff -16 6% -16.6%
Supervisory
LDCProposed Annual
WorkhoursProposed Annual
Workhour Cost ($)
Proposed Annual Workhour Cost ($)LDC LDC
Current Annual Workhours
Current Annual Workhour Cost
($)
Maintenance
Proposed Annual Workhour Cost
($)
Special Adjustments at Gaining Site
Maintenance
Current Annual Workhour Cost
($)
Summary by Sub-GroupSpecial Adjustments -
Combined -
Gaining Facility SummaryProposed Annual Workhour Cost
($)
Proposed MODS
Operation Number
Combined Summary
Proposed Annual Workhours
Proposed Annual Workhour Cost
($)
Proposed Annual Workhour Cost
($)
Proposed Annual Workhours
Proposed MODS
Operation Number
Proposed Annual Workhours
LDC
Proposed Annual Workhours
Losing Facility Summary
Current Annual Workhours
Maintenance
Proposed Annual Workhour Cost ($)
Proposed Annual WorkhoursLDC
Proposed Annual Workhours
Maintenance
Supervisor Summary Supervisor Summary
LDCCurrent Annual
Workhours
Current Annual Workhour Cost
($)LDC
Current Annual Workhours
Current Annual Workhour Cost
($)
Supervisory
LDCProposed Annual
WorkhoursProposed Annual
Workhour Cost ($)
Summary by FacilitySpecial Adjustments at Losing Site
(1,673)Supv/Craft Joint Ops (note 4)
Total (117,002)
(19,148)(75,975)
(8,483)Maintenance Ops (note 3)
Transportation Ops (note 2)
ChangeProposed + Special Adjustments - Combined -Current - Combined
Workhour Change
(11,721)
4) less Ops going to Maintenance' Tabs
'Other Craft' Ops (note 1)
Notes:1) less Ops going to 'Trans-PVS' & 'Maintenance' Tabs
2) going to Trans-PVS tab
3) going to Maintenance tab
Supervisory Ops
Package Page 31 AMP Other Curr vs Prop

rev 06/17/2008
Package Page 32 AMP Other Curr vs Prop

Last Saved:
Losing Facility:Data Extraction Date: 09/20/11
(2) (3) (4) (5) (6)
LevelCurrent Auth
StaffingCurrent On-Rolls
Proposed Staffing
Difference
1 EAS-25 1 1 0 -1
2 EAS-22 1 1 0 -1
3 EAS-22 1 1 0 -1
4 EAS-21 1 1 0 -1
5 EAS-18 1 1 0 -1
6 EAS-18 1 1 0 -1
7 EAS-17 2 2 0 -2
8 EAS-17 9 7 0 -7
9 EAS-17 4 4 0 -4
10 EAS-17 1 1 0 -1
11 EAS-12 1 1 0 -1
1213141516171819202122232425262728293031
Finance Number:
MGR DISTRIBUTION OPERATIONS
MGR MAINTENANCE
MGR IN-PLANT SUPPORT
NETWORKS SPECIALIST
OPERATIONS SUPPORT SPECIALIST
OPERATIONS SUPPORT SPECIALIST
Management Positions
SUPV DISTRIBUTION OPERATIONS
SUPV MAINTENANCE OPERATIONS
SUPV TRANSPORTATION OPERATIONS
SECRETARY (FLD)
Line
(1)
Position Title
MGR PROCESSING/DISTRIBUTION
Staffing - Management
471562
February 15, 2012
Chattanooga P&DC
Package Page 32 AMP Staffing - PCES/EAS
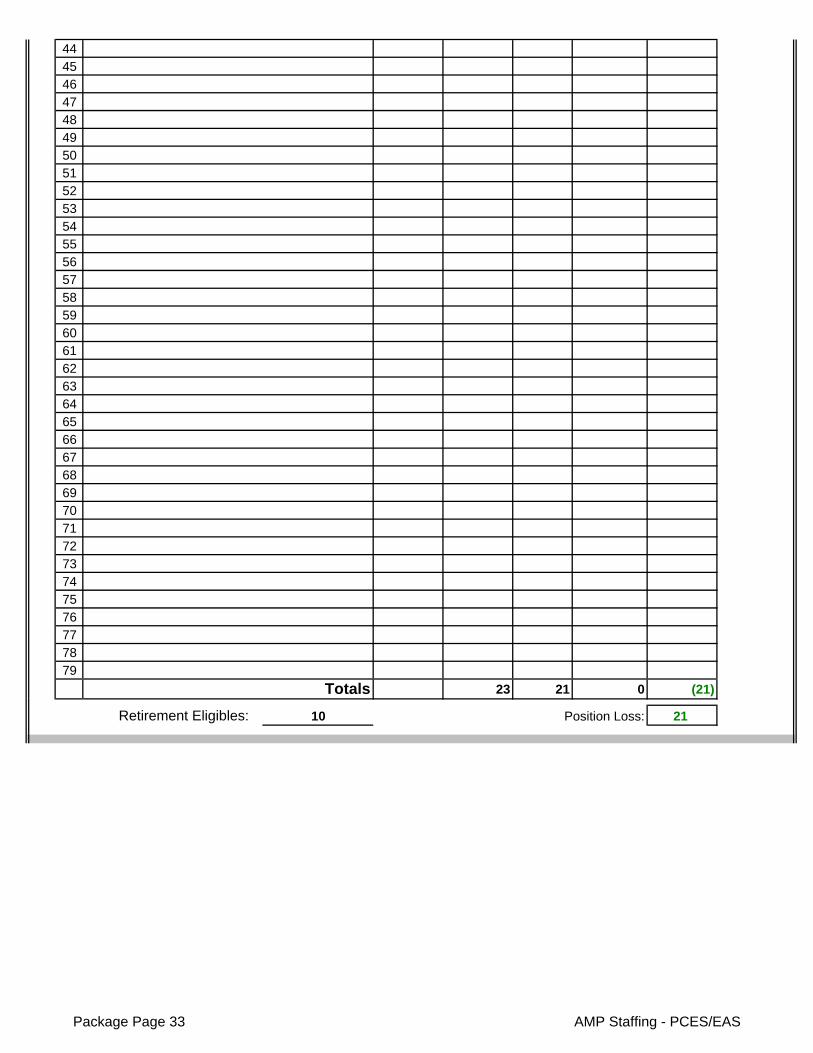
444546474849505152535455565758596061626364656667686970717273747576777879
23 21 0 (21)
Retirement Eligibles: 10 Position Loss: 21
Totals
Package Page 33 AMP Staffing - PCES/EAS
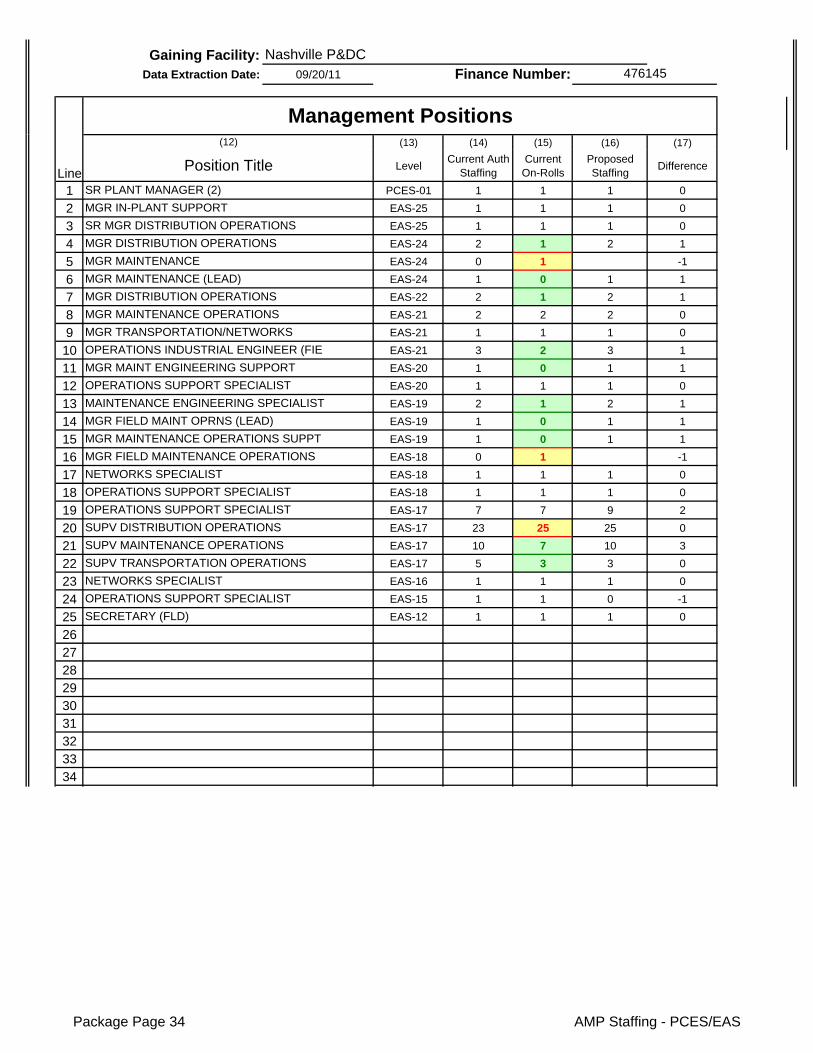
Gaining Facility:Data Extraction Date: 09/20/11
(13) (14) (15) (16) (17)
LevelCurrent Auth
StaffingCurrent On-Rolls
Proposed Staffing
Difference
1 PCES-01 1 1 1 0
2 EAS-25 1 1 1 0
3 EAS-25 1 1 1 0
4 EAS-24 2 1 2 1
5 EAS-24 0 1 -1
6 EAS-24 1 0 1 1
7 EAS-22 2 1 2 1
8 EAS-21 2 2 2 0
9 EAS-21 1 1 1 0
10 EAS-21 3 2 3 1
11 EAS-20 1 0 1 1
12 EAS-20 1 1 1 0
13 EAS-19 2 1 2 1
14 EAS-19 1 0 1 1
15 EAS-19 1 0 1 1
16 EAS-18 0 1 -1
17 EAS-18 1 1 1 0
18 EAS-18 1 1 1 0
19 EAS-17 7 7 9 2
20 EAS-17 23 25 25 0
21 EAS-17 10 7 10 3
22 EAS-17 5 3 3 0
23 EAS-16 1 1 1 0
24 EAS-15 1 1 0 -1
25 EAS-12 1 1 1 0
262728293031323334
SUPV TRANSPORTATION OPERATIONS
NETWORKS SPECIALIST
OPERATIONS SUPPORT SPECIALIST
SECRETARY (FLD)
OPERATIONS SUPPORT SPECIALIST
OPERATIONS SUPPORT SPECIALIST
SUPV DISTRIBUTION OPERATIONS
SUPV MAINTENANCE OPERATIONS
MGR FIELD MAINT OPRNS (LEAD)
MGR MAINTENANCE OPERATIONS SUPPT
MGR FIELD MAINTENANCE OPERATIONS
NETWORKS SPECIALIST
OPERATIONS INDUSTRIAL ENGINEER (FIE
MGR MAINT ENGINEERING SUPPORT
OPERATIONS SUPPORT SPECIALIST
MAINTENANCE ENGINEERING SPECIALIST
MGR MAINTENANCE (LEAD)
MGR DISTRIBUTION OPERATIONS
MGR MAINTENANCE OPERATIONS
MGR TRANSPORTATION/NETWORKS
MGR IN-PLANT SUPPORT
SR MGR DISTRIBUTION OPERATIONS
MGR DISTRIBUTION OPERATIONS
MGR MAINTENANCE
SR PLANT MANAGER (2)Line Position Title
(12)
Management Positions
Finance Number: 476145
Nashville P&DC
Package Page 34 AMP Staffing - PCES/EAS
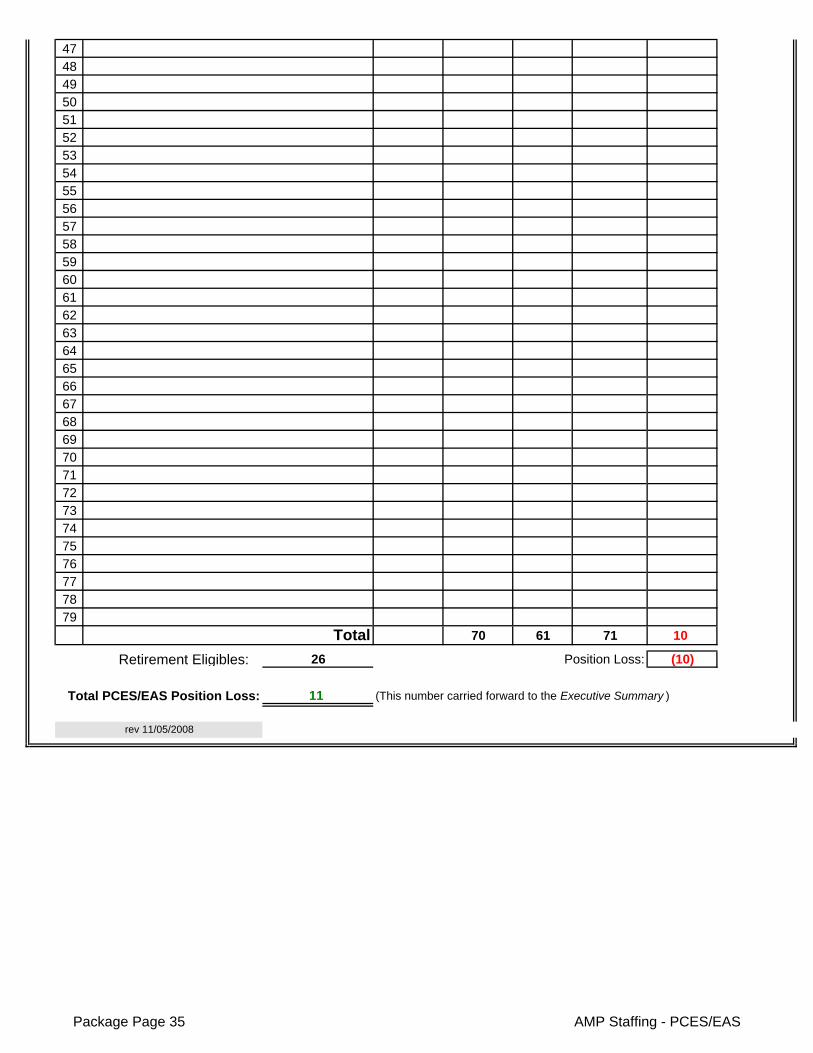
474849505152535455565758596061626364656667686970717273747576777879
70 61 71 10
Retirement Eligibles: 26 Position Loss: (10)
11
Total
rev 11/05/2008
Total PCES/EAS Position Loss: (This number carried forward to the Executive Summary )
Package Page 35 AMP Staffing - PCES/EAS
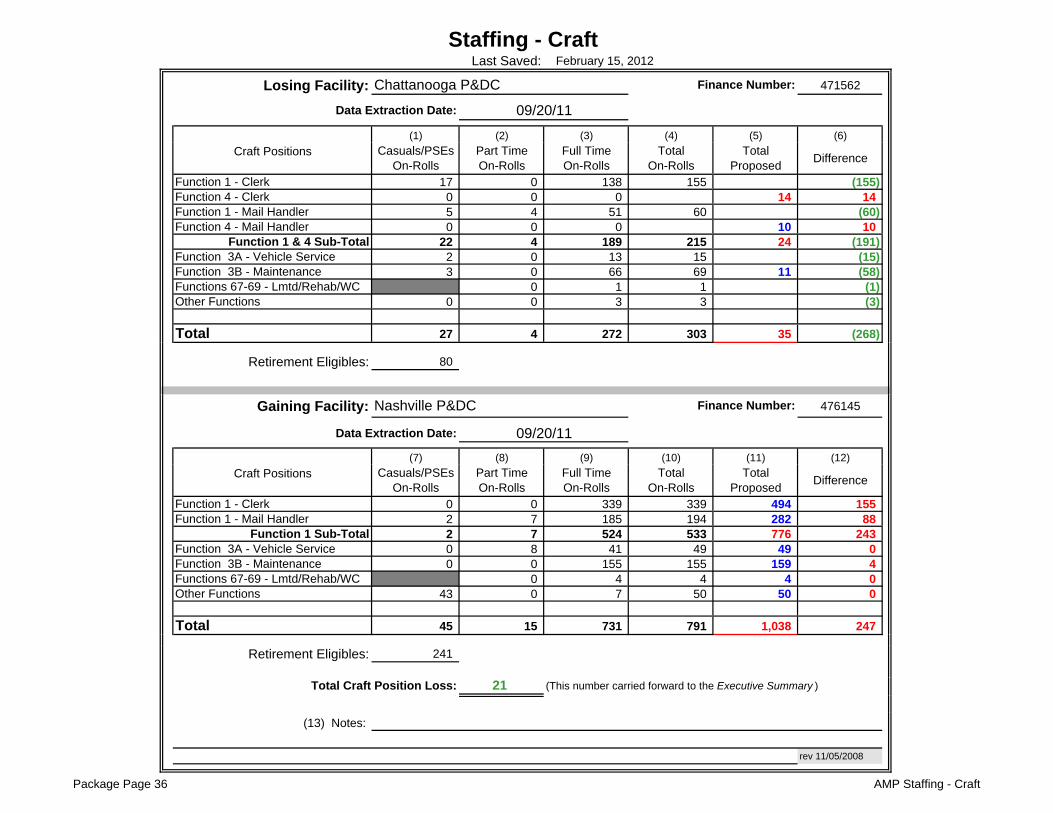
Losing Facility: 471562
(1) (2) (3) (4) (5) (6)
Craft Positions
Function 1 - Clerk 17 0 138 155 (155)Function 4 - Clerk 0 0 0 14 14Function 1 - Mail Handler 5 4 51 60 (60)Function 4 - Mail Handler 0 0 0 10 10
Function 1 & 4 Sub-Total 22 4 189 215 24 (191)Function 3A - Vehicle Service 2 0 13 15 (15)Function 3B - Maintenance 3 0 66 69 11 (58)Functions 67-69 - Lmtd/Rehab/WC 0 1 1 (1)Other Functions 0 0 3 3 (3)
Total 27 4 272 303 35 (268)
Retirement Eligibles: 80
Gaining Facility: 476145
(7) (8) (9) (10) (11) (12)
Craft Positions
Function 1 - Clerk 0 0 339 339 494 155Function 1 - Mail Handler 2 7 185 194 282 88
Function 1 Sub-Total 2 7 524 533 776 243Function 3A - Vehicle Service 0 8 41 49 49 0Function 3B - Maintenance 0 0 155 155 159 4Functions 67-69 - Lmtd/Rehab/WC 0 4 4 4 0Other Functions 43 0 7 50 50 0
Total 45 15 731 791 1,038 247
Retirement Eligibles: 241
21
(13) Notes:
rev 11/05/2008
Total On-Rolls
(This number carried forward to the Executive Summary )
Casuals/PSEs On-Rolls
Data Extraction Date:
Chattanooga P&DC
Part Time On-Rolls
Full Time On-Rolls
Staffing - Craft
Difference
Difference
Last Saved: February 15, 2012
Data Extraction Date: 09/20/11
Casuals/PSEs On-Rolls
09/20/11
Total Proposed
Finance Number:
Nashville P&DC Finance Number:
Total Craft Position Loss:
Total Proposed
Part Time On-Rolls
Full Time On-Rolls
Total On-Rolls
Package Page 36 AMP Staffing - Craft
Losing Facility: Gaining Facility:
Date Range of Data: :
(1) (2) (3) (4) (5) (6)
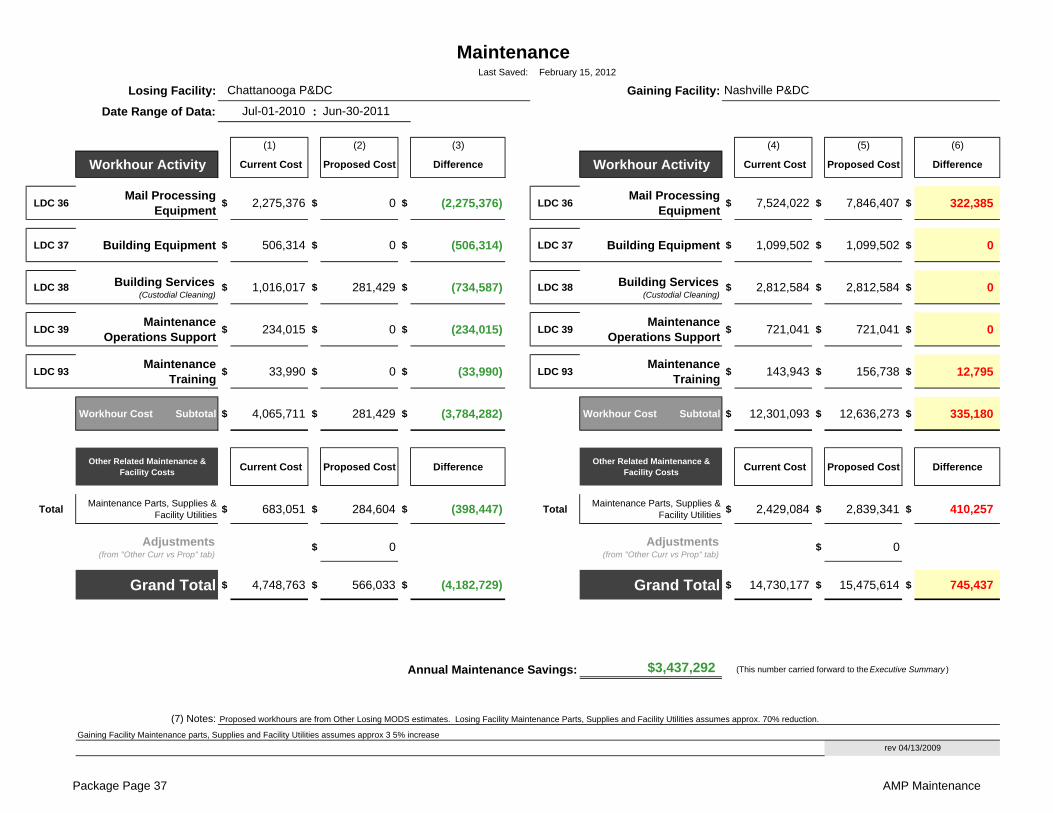
Workhour Activity Current Cost Proposed Cost Difference Workhour Activity Current Cost Proposed Cost Difference
LDC 36Mail Processing
Equipment$ 2,275,376 $ 0 $ (2,275,376) LDC 36
Mail Processing Equipment
$ 7,524,022 $ 7,846,407 $ 322,385
LDC 37 Building Equipment $ 506,314 $ 0 $ (506,314) LDC 37 Building Equipment $ 1,099,502 $ 1,099,502 $ 0
LDC 38 Building Services (Custodial Cleaning)
$ 1,016,017 $ 281,429 $ (734,587) LDC 38 Building Services (Custodial Cleaning)
$ 2,812,584 $ 2,812,584 $ 0
LDC 39Maintenance
Operations Support$ 234,015 $ 0 $ (234,015) LDC 39
Maintenance Operations Support
$ 721,041 $ 721,041 $ 0
LDC 93Maintenance
Training$ 33,990 $ 0 $ (33,990) LDC 93
Maintenance Training
$ 143,943 $ 156,738 $ 12,795
Workhour Cost Subtotal $ 4,065,711 $ 281,429 $ (3,784,282) Workhour Cost Subtotal $ 12,301,093 $ 12,636,273 $ 335,180
Other Related Maintenance & Facility Costs
Current Cost Proposed Cost DifferenceOther Related Maintenance &
Facility Costs Current Cost Proposed Cost Difference
TotalMaintenance Parts, Supplies &
Facility Utilities$ 683,051 $ 284,604 $ (398,447) Total
Maintenance Parts, Supplies & Facility Utilities
$ 2,429,084 $ 2,839,341 $ 410,257
Adjustments (from "Other Curr vs Prop" tab)
$ 0 Adjustments (from "Other Curr vs Prop" tab)
$ 0
Grand Total $ 4,748,763 $ 566,033 $ (4,182,729) Grand Total $ 14,730,177 $ 15,475,614 $ 745,437
$3,437,292 (This number carried forward to the Executive Summary )
(7) Notes:
rev 04/13/2009
Maintenance
Proposed workhours are from Other Losing MODS estimates. Losing Facility Maintenance Parts, Supplies and Facility Utilities assumes approx. 70% reduction.
Gaining Facility Maintenance parts, Supplies and Facility Utilities assumes approx 3 5% increase
Last Saved:
Chattanooga P&DC Nashville P&DC
February 15, 2012
Jul-01-2010 Jun-30-2011
Annual Maintenance Savings:
Package Page 37 AMP Maintenance
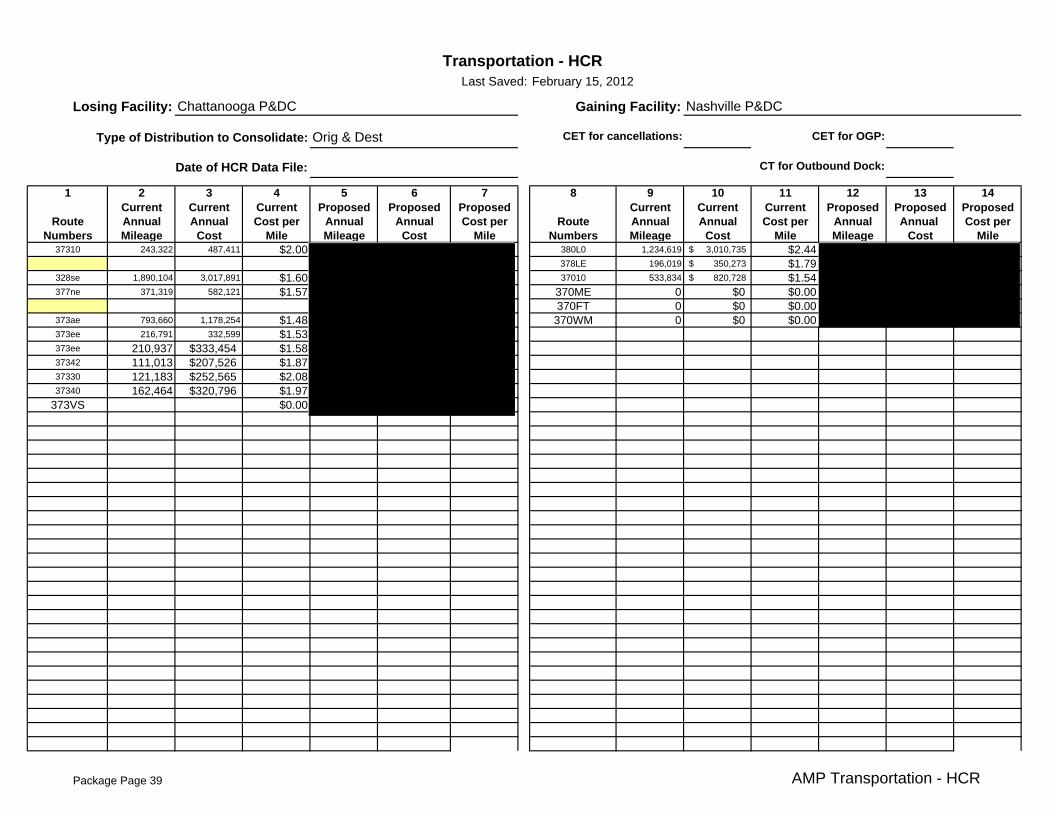
1 2 3 4 5 6 7 8 9 10 11 12 13 14Current Current Current Proposed Proposed Proposed Current Current Current Proposed Proposed Proposed
Route Annual Annual Cost per Annual Annual Cost per Route Annual Annual Cost per Annual Annual Cost perNumbers Mileage Cost Mile Mileage Cost Mile Numbers Mileage Cost Mile Mileage Cost Mile
37310 243,322 487,411 $2.00 380L0 1,234,619 3,010,735$ $2.44378LE 196,019 350,273$ $1.79
328se 1,890,104 3,017,891 $1.60 37010 533,834 820,728$ $1.54377ne 371,319 582,121 $1.57 370ME 0 $0 $0.00
370FT 0 $0 $0.00373ae 793,660 1,178,254 $1.48 370WM 0 $0 $0.00373ee 216,791 332,599 $1.53373ee 210,937 $333,454 $1.5837342 111,013 $207,526 $1.8737330 121,183 $252,565 $2.0837340 162,464 $320,796 $1.97
373VS $0.00
Transportation - HCR
Orig & Dest CET for OGP:
CT for Outbound Dock:
Type of Distribution to Consolidate:
Date of HCR Data File:
CET for cancellations:
Last Saved: February 15, 2012
Losing Facility: Chattanooga P&DC Nashville P&DCGaining Facility:
Package Page 39 AMP Transportation - HCR
1 2 3 4 5 6 7 8 9 10 11 12 13 14Current Current Current Proposed Proposed Proposed Current Current Current Proposed Proposed Proposed
Route Annual Annual Cost per Annual Annual Cost per Route Annual Annual Cost per Annual Annual Cost perNumbers Mileage Cost Mile Mileage Cost Mile Numbers Mileage Cost Mile Mileage Cost Mile
Package Page 40 AMP Transportation - HCR
1 2 3 4 5 6 7 8 9 10 11 12 13 14Current Current Current Proposed Proposed Proposed Current Current Current Proposed Proposed Proposed
Route Annual Annual Cost per Annual Annual Cost per Route Annual Annual Cost per Annual Annual Cost perNumbers Mileage Cost Mile Mileage Cost Mile Numbers Mileage Cost Mile Mileage Cost Mile
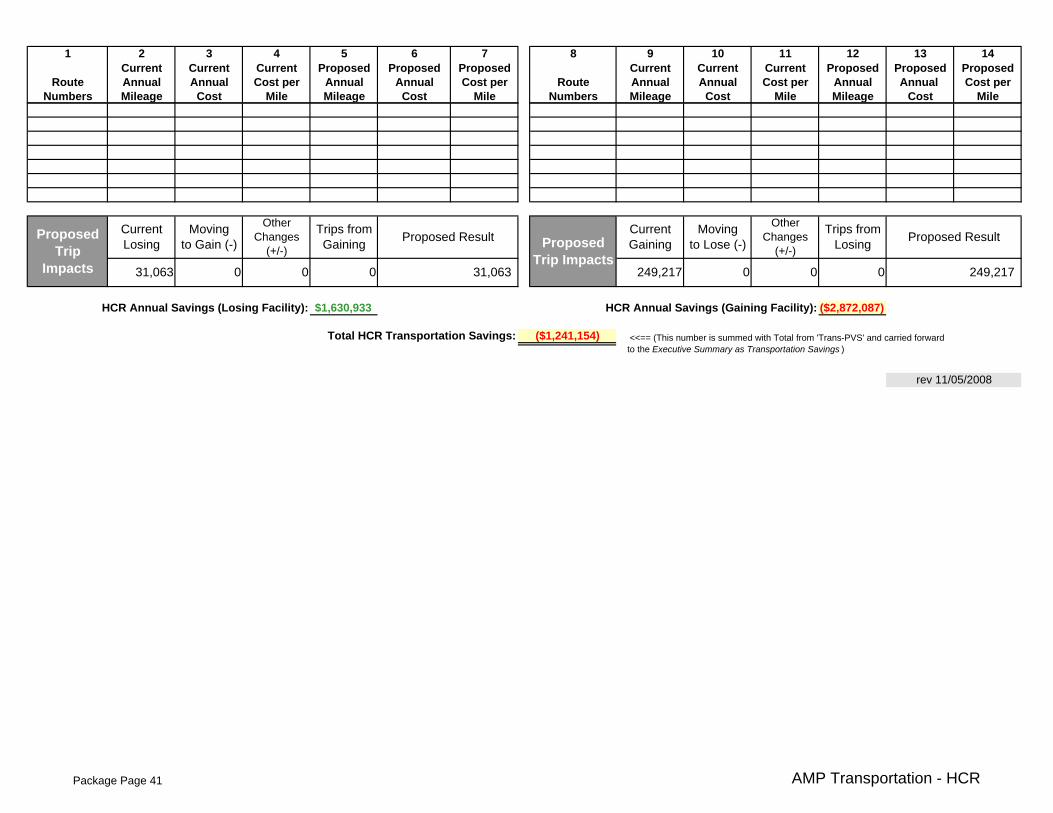
$1,630,933 ($2,872,087)
Total HCR Transportation Savings:
Other Changes
(+/-)
31,063 249,217
Moving to Gain (-)
Proposed Trip
Impacts
Current Losing
Proposed ResultTrips from Gaining
Other Changes
(+/-)
HCR Annual Savings (Losing Facility): HCR Annual Savings (Gaining Facility):
Proposed Trip Impacts
31,063 0 0 0 0
rev 11/05/2008
Current Gaining
($1,241,154)
249,2170
Proposed ResultTrips from
Losing
0
Moving to Lose (-)
<<== (This number is summed with Total from 'Trans-PVS' and carried forward to the Executive Summary as Transportation Savings )
Package Page 41 AMP Transportation - HCR

Orig & Dest
(1) (2)
DMM L011 From:
DMM L201 Action Code* Column A - 3-Digit ZIP Code Prefix Group
DMM L601
DMM L602
DMM L603 To:
DMM L604 Action Code* Column A - 3-Digit ZIP Code Prefix Group
DMM L605
DMM L606
DMM L607
DMM L801
(3)
Action Code*
Action Code*
Action Code*
Action Code*
(4)
Count % Count % Count % Count %
Jul 373 458 88 19% 84 18% 0 0% 370 81% 4
Aug 373 481 88 18% 102 21% 0 0% 393 82% 4
Jul 301 797 235 29% 192 24% 0 0% 562 71% 48
Aug 301 815 255 31% 182 22% 0 0% 560 69% 60
(5) Notes
Column A - Entry ZIP Codes Column B - 3-Digit ZIP Code Destinations Column C - Label to
Column C - Label to
DMM Labeling List L201 - Periodicals Origin Split
Column A - Entry ZIP Codes Column B - 3-Digit ZIP Code Destinations Column C - Label to
Gaining Facility N Metro
Gaining Facility N Metro
Unschd Count
Losing Facility Chattanooga
Losing Facility Chattanooga
No-Show Late Arrival Open Closed
*Action Codes: A=add D=delete CF-change from CT=change to
Column B - Label to
rev 5/14/2009
Drop Shipments for Destination Entry Discounts - FAST Appointment Summary Report
Month Losing/GainingNASS Code
Facility NameTotal
Schd Appts
DMM Labeling List L005 - 3-Digit ZIP Code Prefix Groups - SCF Sortation
Column B - Label to
Distribution Changes
Indicate each DMM labeling list affected by placing an "X" to the left of the list.
Losing Facility:Type of Distribution to Consolidate
If revisions to DMM L005 or DMM L201 are needed, indicate proposed DMM label change below.
Last Saved: February 15, 2012
Chattanooga P&DC
DMM L003
DMM L004
DMM L001
DMM L002
DMM L009
DMM L010
DMM L005
DMM L006
DMM L007
DMM L008
Column C - Label to
*Action Codes: A=add D=delete CF-change from CT=change to
Important Note: Section 2 & 3 illustrate possible changes to DMM labeling lists. Section 2 relates to consolidation of Destination Operations. Section 3 pertains to Originating Operations. The Area Distribution Network group will submit appropriate requests for DMM changes after AMP approval.
Column A - Entry ZIP Codes Column B - 3-Digit ZIP Code Destinations Column C - Label to
Column A - Entry ZIP Codes Column B - 3-Digit ZIP Code Destinations
Package Page 42 AMP Distr bution Changes
Losing Facility: Gaining Facility:
(1) (2) (3) (4) (5) (6) (7) (8)
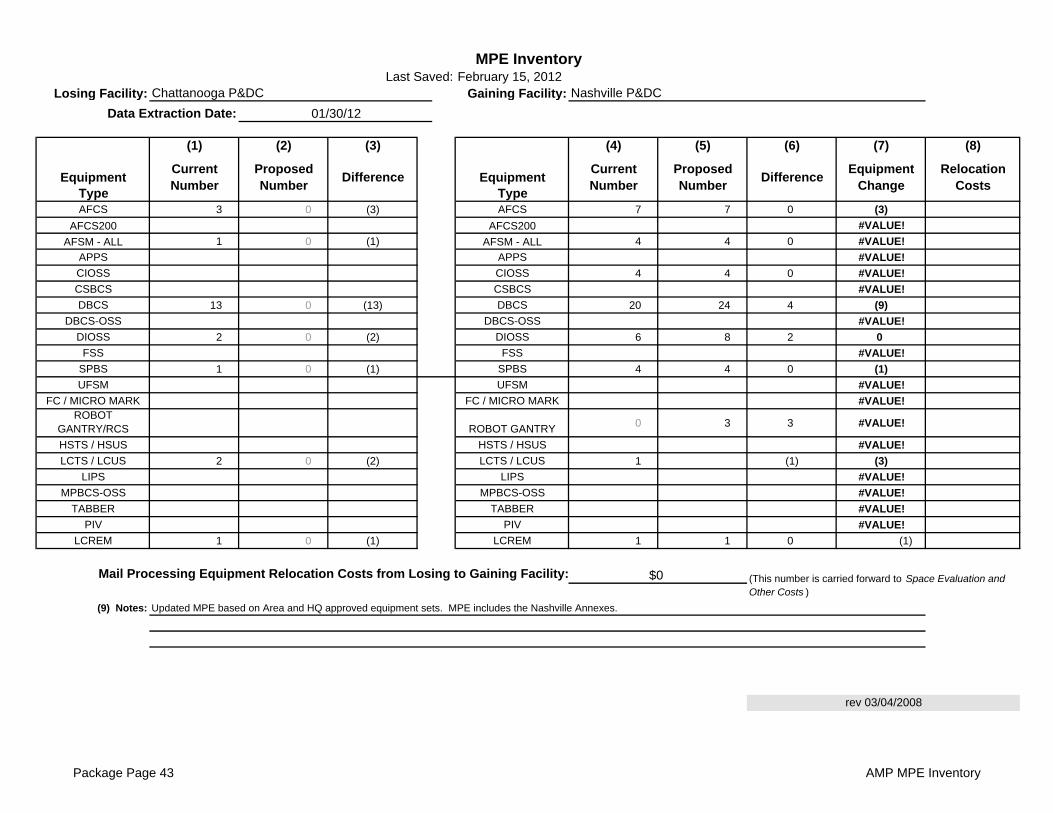
Equipment EquipmentType TypeAFCS 3 0 (3) AFCS 7 7 0 (3)
AFCS200 AFCS200 #VALUE!
AFSM - ALL 1 0 (1) AFSM - ALL 4 4 0 #VALUE!
APPS APPS #VALUE!
CIOSS CIOSS 4 4 0 #VALUE!
CSBCS CSBCS #VALUE!
DBCS 13 0 (13) DBCS 20 24 4 (9)
DBCS-OSS DBCS-OSS #VALUE!
DIOSS 2 0 (2) DIOSS 6 8 2 0
FSS FSS #VALUE!
SPBS 1 0 (1) SPBS 4 4 0 (1)
UFSM UFSM #VALUE!
FC / MICRO MARK FC / MICRO MARK #VALUE!ROBOT
GANTRY/RCS ROBOT GANTRY 0 3 3 #VALUE!
HSTS / HSUS HSTS / HSUS #VALUE!
LCTS / LCUS 2 0 (2) LCTS / LCUS 1 (1) (3)
LIPS LIPS #VALUE!
MPBCS-OSS MPBCS-OSS #VALUE!
TABBER TABBER #VALUE!
PIV PIV #VALUE!
LCREM 1 0 (1) LCREM 1 1 0 (1)
(9) Notes:
Data Extraction Date:
Proposed Number
February 15, 2012MPE Inventory
Updated MPE based on Area and HQ approved equipment sets. MPE includes the Nashville Annexes.
Chattanooga P&DC Nashville P&DC
Current Number
DifferenceEquipment
ChangeRelocation
Costs
Last Saved:
Current Number
rev 03/04/2008
(This number is carried forward to Space Evaluation and Other Costs )
Proposed Number
Difference
Mail Processing Equipment Relocation Costs from Losing to Gaining Facility: $0
01/30/12
Package Page 43 AMP MPE Inventory
Last Saved:
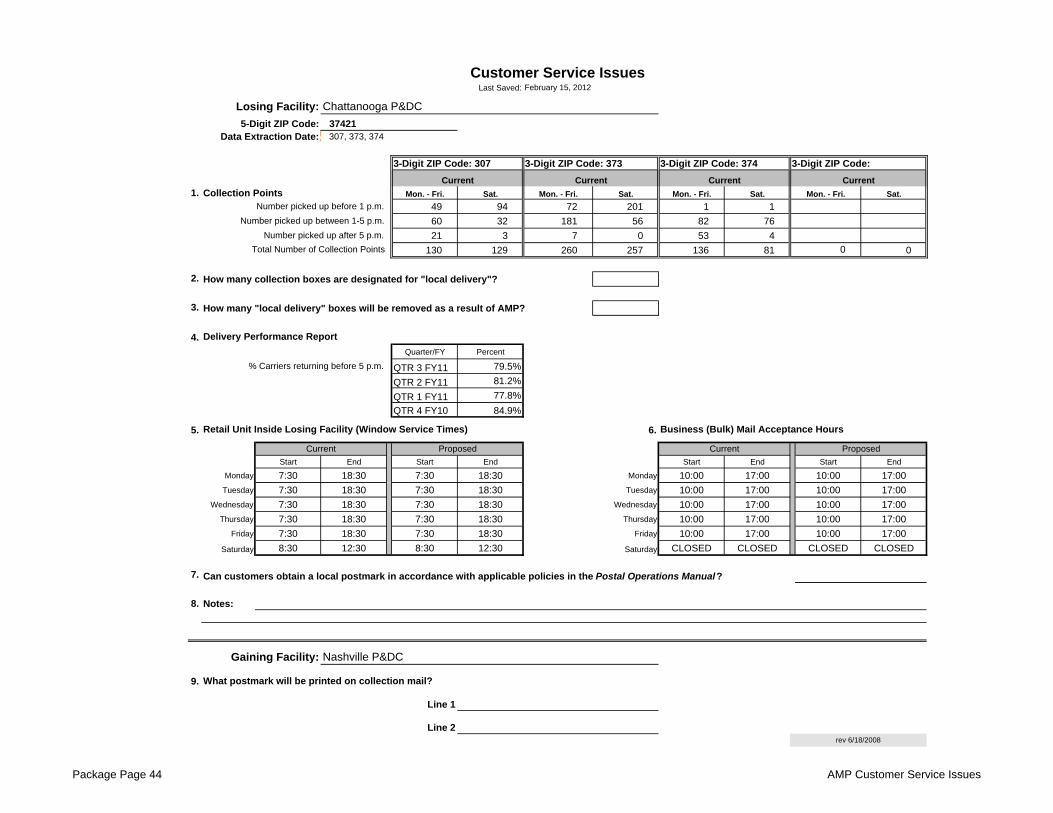
3-Digit ZIP Code: 373 3-Digit ZIP Code: 374
1. Collection Points Mon. - Fri. Sat. Mon. - Fri. Sat. Mon. - Fri. Sat. Sat.
49 94 72 201 1 1
60 32 181 56 82 76
21 3 7 0 53 4
130 129 260 257 136 81 0
2. How many collection boxes are designated for "local delivery"?
3. How many "local delivery" boxes will be removed as a result of AMP?
4.
Quarter/FY Percent
QTR 3 FY11 79.5%
QTR 2 FY11 81.2%
QTR 1 FY11 77.8%
QTR 4 FY10 84.9%
5. 6.
Start End Start End Start End Start End
Monday 7:30 18:30 7:30 18:30 Monday 10:00 17:00 10:00 17:00
Tuesday 7:30 18:30 7:30 18:30 Tuesday 10:00 17:00 10:00 17:00
Wednesday 7:30 18:30 7:30 18:30 Wednesday 10:00 17:00 10:00 17:00
Thursday 7:30 18:30 7:30 18:30 Thursday 10:00 17:00 10:00 17:00
Friday 7:30 18:30 7:30 18:30 Friday 10:00 17:00 10:00 17:00
Saturday 8:30 12:30 8:30 12:30 Saturday CLOSED CLOSED CLOSED CLOSED
7.
8. Notes:
9.
Line 1
Line 2
Number picked up before 1 p.m.
Business (Bulk) Mail Acceptance Hours
Nashville P&DC
0
Losing Facility:
5-Digit ZIP Code:Data Extraction Date:
3-Digit ZIP Code: 307
Mon. - Fri.
Customer Service Issues
Current Proposed
Number picked up after 5 p.m.
Number picked up between 1-5 p.m.
Total Number of Collection Points
Delivery Performance Report
Retail Unit Inside Losing Facility (Window Service Times)
3-Digit ZIP Code:
Current
rev 6/18/2008
37421
Can customers obtain a local postmark in accordance with applicable policies in the Postal Operations Manual?
Gaining Facility:
What postmark will be printed on collection mail?
Proposed
% Carriers returning before 5 p.m.
February 15, 2012
Chattanooga P&DC
307, 373, 374
Current CurrentCurrent
Current
Package Page 44 AMP Customer Service Issues
Last Saved:
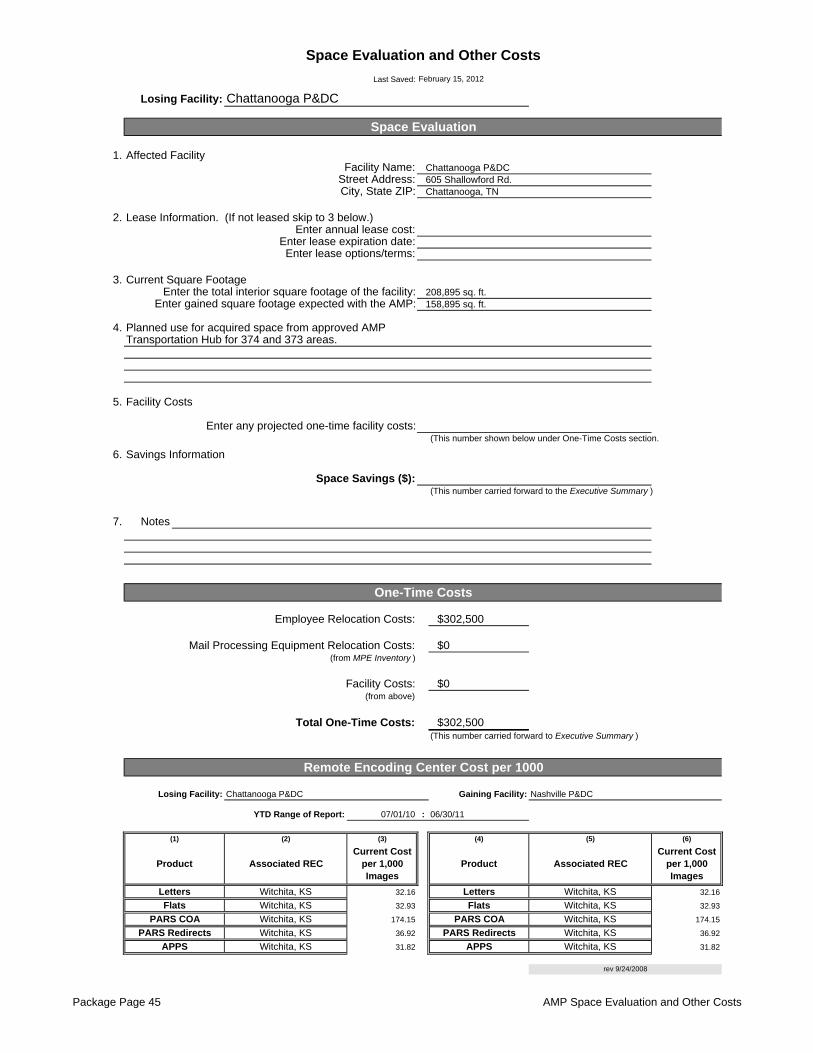
1.
2. Lease Information. (If not leased skip to 3 below.)
3.
4. Planned use for acquired space from approved AMP
5. Facility Costs
(This number shown below under One-Time Costs section.
6. Savings Information
(This number carried forward to the Executive Summary )
7. Notes
(This number carried forward to Executive Summary )
07/01/10 :
(3) (6)
32.16 32.16
32.93 32.93
174.15 174.15
36.92 36.92
31.82 31.82APPS Witchita, KS
Witchita, KS PARS Redirects Witchita, KSPARS Redirects
Total One-Time Costs:
Remote Encoding Center Cost per 1000
Current Cost per 1,000 Images
Flats
PARS COA
Flats
Letters
PARS COA
(5)
Product Associated REC
(4)
Witchita, KS
Witchita, KS
Enter annual lease cost:
Enter the total interior square footage of the facility:Enter gained square footage expected with the AMP:
Enter lease options/terms:
Current Square Footage
Enter lease expiration date:
(from above)
208,895 sq. ft.158,895 sq. ft.
Transportation Hub for 374 and 373 areas.
Enter any projected one-time facility costs:
Letters
Gaining Facility:
Current Cost per 1,000 Images
Losing Facility:
(1)
Product
(2)
Witchita, KS
Associated REC
Mail Processing Equipment Relocation Costs: (from MPE Inventory )
Space Savings ($):
One-Time Costs
Employee Relocation Costs:
$0
Space Evaluation and Other Costs
Street Address:City, State ZIP:
Losing Facility:
Space Evaluation
Affected FacilityFacility Name:
February 15, 2012
Chattanooga P&DC
Chattanooga P&DC
rev 9/24/2008
Chattanooga P&DC Nashville P&DC
06/30/11YTD Range of Report:
Witchita, KS
APPS Witchita, KS
Witchita, KS
Witchita, KS
$0
$302,500
605 Shallowford Rd.Chattanooga, TN
$302,500
Facility Costs:
Package Page 45 AMP Space Evaluation and Other Costs

Type of Distribution to Consolidate: Orig & Dest MODS/BPI Office
Facility Name & Type:Street Address:
City: Chattanooga State: TN
5D Facility ZIP Code: 37421District: Tennessee
Area: EasternFinance Number: 471562
Current 3D ZIP Code(s):Miles to Gaining Facility: 126
EXFC office: YesPlant Manager:
Senior Plant Manager:District Manager:
Facility Type after AMP: Post Office
Facility Name & Type:Street Address:
City:State: GA
5D Facility ZIP Code:District: Atlanta
Area: Capital Metro Finance Number: 120441
Current 3D ZIP Code(s):EXFC office: Yes
Plant Manager:Senior Plant Manager:
District Manager:
Start of Study: 9/15/2011
Date Range of Data: Jul-01-2010 : Jun-30-2011Processing Days per Year: 310
Bargaining Unit Hours per Year: 1,745EAS Hours per Year: 1,822
June 16, 2011
2/19/2012 11:34
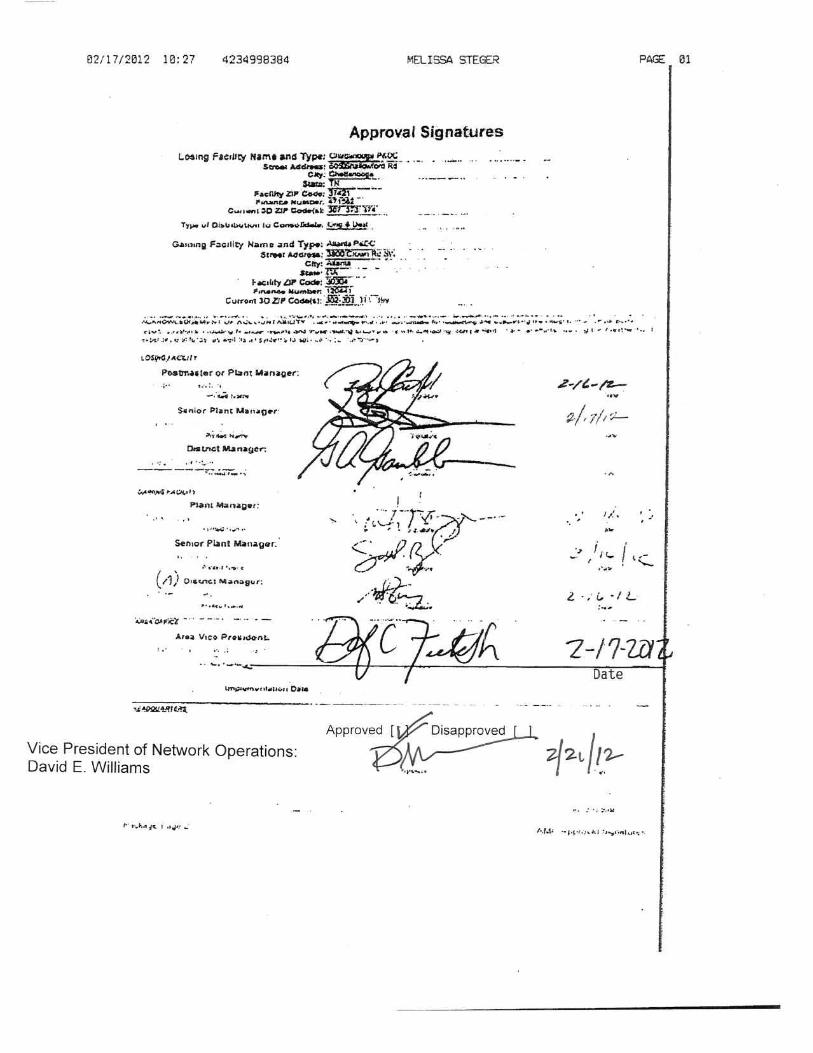
Area Vice President:Vice President, Network Operations:
Area AMP Coordinator:HQ AMP Coordinator:
rev 09/21/2011
----- AMP Data Entry Page -----
Chattanooga P&DC605 Shallowford Rd
Roger J. Crawford
1. Losing Facility Information
Todd Katkow
307, 373, 374
Scott RaymondMichael S. Furey
Jordan Small / David C. FieldsDavid E. Williams
Greg A. Gamble
Atlanta P&DC3900 Crown Rd SW
Mark Hogan
4. Other Information
James G. Drummer
Atlanta
302-303, 311, 399
2. Gaining Facility Information
Bob Roseberry / Janet Hester
Date & Time this workbook was last saved:
3. Background Information
Date of HQ memo, DAR Factors/Cost of Borrowing/ New Facility Start-up Costs Update
30304
Package Page 1 AMP Data Entry Page

Losing Facility Name and Type:Street Address:
City, State:
Current 3D ZIP Code(s):
Type of Distribution to Consolidate:
Gaining Facility Name and Type:Current 3D ZIP Code(s):
= $2,936,907
= $234,638
= $232,423
= $45,440 from Transportation (HCR and PVS)
= $2,922,370 from Maintenance
= $0 from Space Evaluation and Other Costs
= $6,371,777
= $9,757 from Space Evaluation and Other Costs
= $6,362,020
= 327 from Staffing - Craft
= 21 from Staffing - PCES/EAS
= 479,569 from Workhour Costs - Current
= 5,160,753 from Workhour Costs - Current
= 249,783
ADV ADV ADV %
First-Class Mail® 0 0 0 #DIV/0!
Priority Mail® 0 0 0 #DIV/0!
Package Services 0 0 0 #DIV/0!
Periodicals N/A* N/A* N/A* N/A*
Standard Mail N/A* N/A* N/A* N/A*Code to destination 3-digit ZIP Code volume is not
available
Unchanged + Upgrades
Executive SummaryLast Saved: February 19, 2012
Chattanooga P&DC
605 Shallowford Rd
Chattanooga , TN
307, 373, 374
Orig & Dest Miles to Gaining Facility: 126
Atlanta P&DC
302-303, 311, 399
Summary of AMP Worksheets
Savings/CostsMail Processing Craft Workhour Savings from Workhour Costs - Proposed
Non-MP Craft/EAS + Shared LDCs Workhour Savings (less Maint/Trans) from Other Curr vs Prop
PCES/EAS Supervisory Workhour Savings from Other Curr vs Prop
Transportation Savings
Maintenance Savings
Space Savings
Total Annual Savings
Total One-Time Costs
Total First Year Savings
Staffing Positions
Craft Position Loss
PCES/EAS Position Loss
Volume
Service
rev 10/15/2009
Total FHP to be Transferred (Average Daily Volume)
Current FHP at Gaining Facility (Average Daily Volume)
Losing Facility Cancellation Volume (Average Daily Volume) (= Total TPH / Operating Days)
Service Standard Impacts by ADV
UPGRADED DOWNGRADEDUnchanged +
Upgrades
Package Page 3 AMP Executive Summary
Losing Facility Name and Type:Current 3D ZIP Code(s):
Type of Distribution to Consolidate:
Gaining Facility Name and Type:Current 3D ZIP Code(s):
rev 06/10/2009
February 19, 2012
302-303, 311, 399
Orig & Dest
Summary NarrativeLast Saved:
Chattanooga P&DC
Atlanta P&DC
307, 373, 374
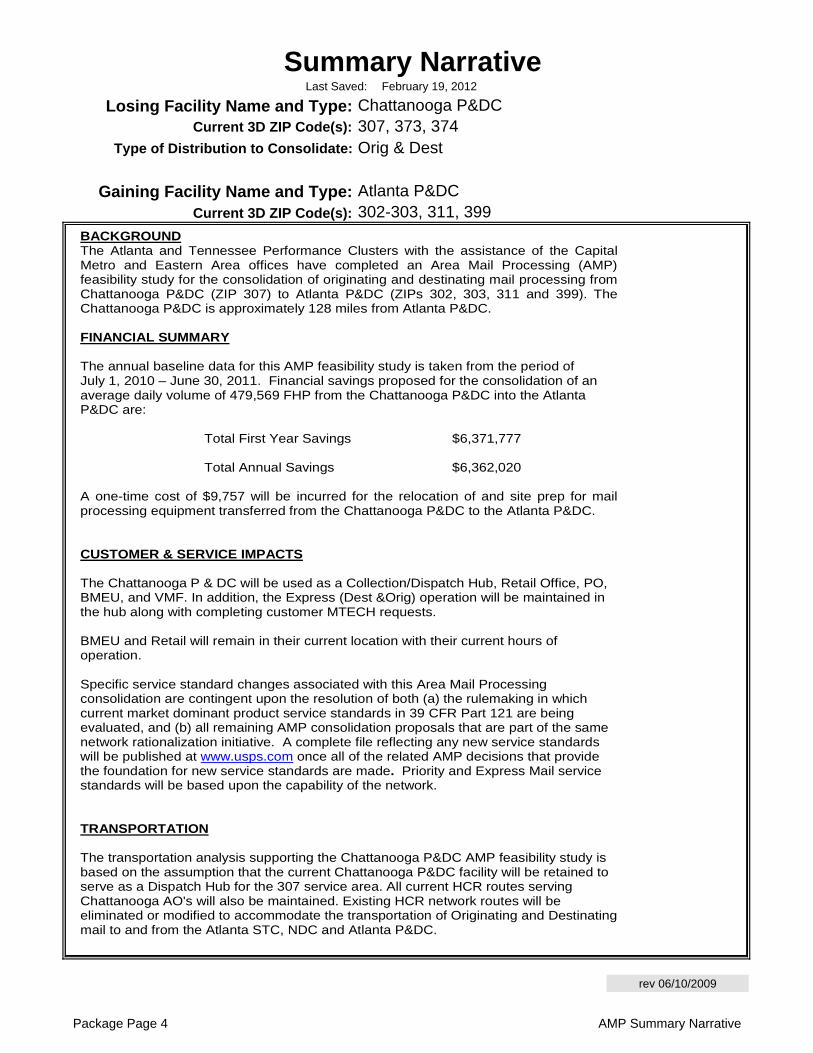
BACKGROUND The Atlanta and Tennessee Performance Clusters with the assistance of the Capital Metro and Eastern Area offices have completed an Area Mail Processing (AMP)feasibility study for the consolidation of originating and destinating mail processing fromChattanooga P&DC (ZIP 307) to Atlanta P&DC (ZIPs 302, 303, 311 and 399). The Chattanooga P&DC is approximately 128 miles from Atlanta P&DC. FINANCIAL SUMMARY The annual baseline data for this AMP feasibility study is taken from the period of July 1, 2010 – June 30, 2011. Financial savings proposed for the consolidation of an average daily volume of 479,569 FHP from the Chattanooga P&DC into the Atlanta P&DC are: Total First Year Savings $6,371,777 Total Annual Savings $6,362,020 A one-time cost of $9,757 will be incurred for the relocation of and site prep for mailprocessing equipment transferred from the Chattanooga P&DC to the Atlanta P&DC. CUSTOMER & SERVICE IMPACTS The Chattanooga P & DC will be used as a Collection/Dispatch Hub, Retail Office, PO, BMEU, and VMF. In addition, the Express (Dest &Orig) operation will be maintained in the hub along with completing customer MTECH requests. BMEU and Retail will remain in their current location with their current hours of operation. Specific service standard changes associated with this Area Mail Processing consolidation are contingent upon the resolution of both (a) the rulemaking in which current market dominant product service standards in 39 CFR Part 121 are being evaluated, and (b) all remaining AMP consolidation proposals that are part of the same network rationalization initiative. A complete file reflecting any new service standards will be published at www.usps.com once all of the related AMP decisions that provide the foundation for new service standards are made. Priority and Express Mail service standards will be based upon the capability of the network. TRANSPORTATION The transportation analysis supporting the Chattanooga P&DC AMP feasibility study is based on the assumption that the current Chattanooga P&DC facility will be retained to serve as a Dispatch Hub for the 307 service area. All current HCR routes serving Chattanooga AO's will also be maintained. Existing HCR network routes will be eliminated or modified to accommodate the transportation of Originating and Destinating mail to and from the Atlanta STC, NDC and Atlanta P&DC.
Package Page 4 AMP Summary Narrative
rev 06/10/2009
Summary Narrative (continued)
Summary Narrative Page 2
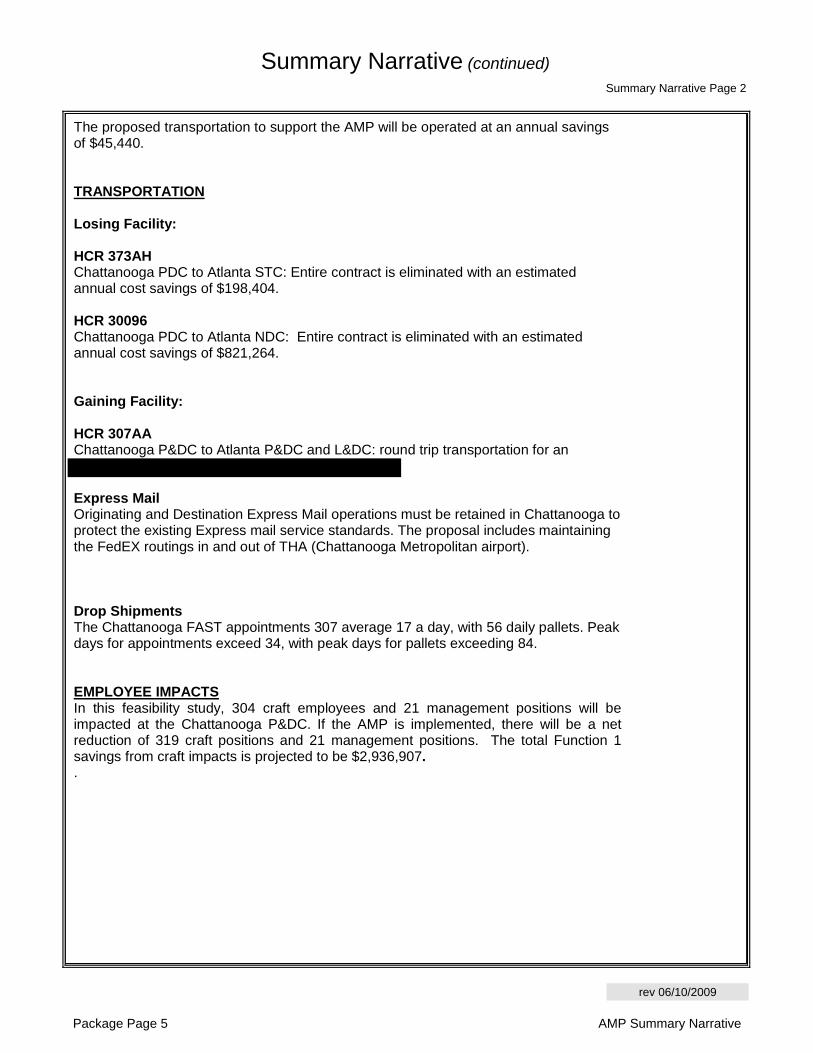
The proposed transportation to support the AMP will be operated at an annual savings of $45,440. TRANSPORTATION Losing Facility: HCR 373AH Chattanooga PDC to Atlanta STC: Entire contract is eliminated with an estimated annual cost savings of $198,404. HCR 30096 Chattanooga PDC to Atlanta NDC: Entire contract is eliminated with an estimated annual cost savings of $821,264. Gaining Facility: HCR 307AA Chattanooga P&DC to Atlanta P&DC and L&DC: round trip transportation for an
Express Mail Originating and Destination Express Mail operations must be retained in Chattanooga to protect the existing Express mail service standards. The proposal includes maintaining the FedEX routings in and out of THA (Chattanooga Metropolitan airport). Drop Shipments The Chattanooga FAST appointments 307 average 17 a day, with 56 daily pallets. Peak days for appointments exceed 34, with peak days for pallets exceeding 84. EMPLOYEE IMPACTS In this feasibility study, 304 craft employees and 21 management positions will be impacted at the Chattanooga P&DC. If the AMP is implemented, there will be a net reduction of 319 craft positions and 21 management positions. The total Function 1 savings from craft impacts is projected to be $2,936,907. .
Package Page 5 AMP Summary Narrative
rev 06/10/2009
Summary Narrative (continued)Summary Narrative Page 4
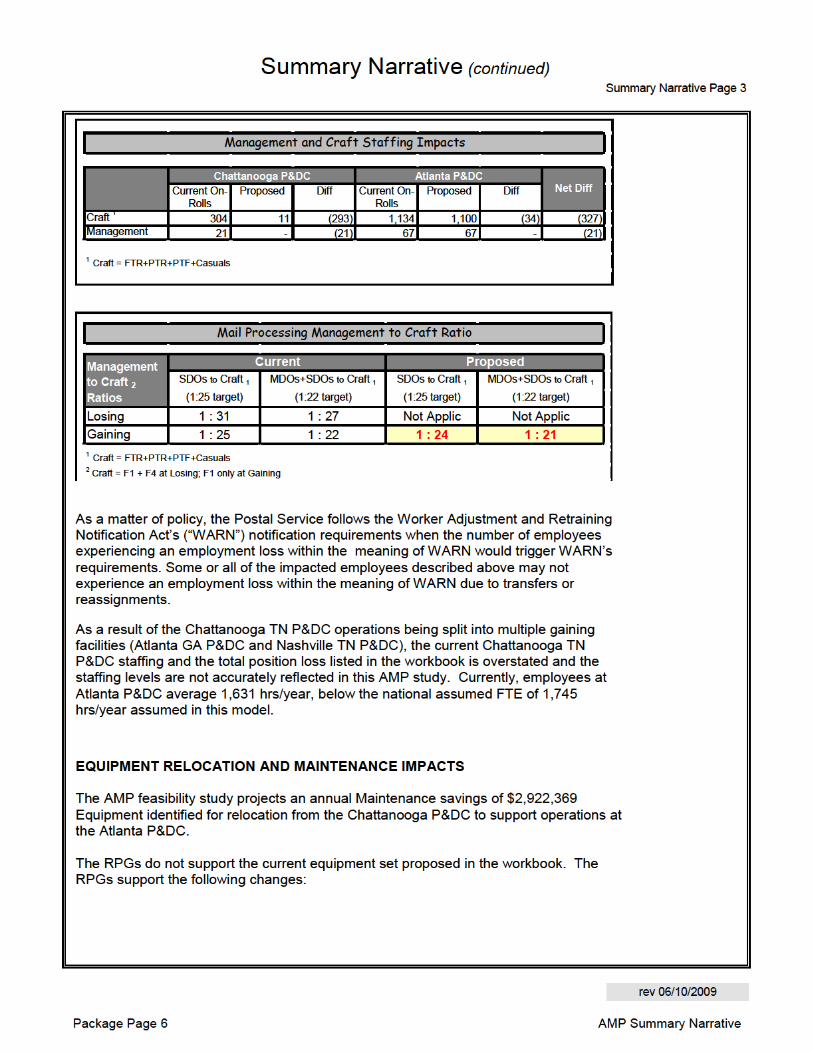
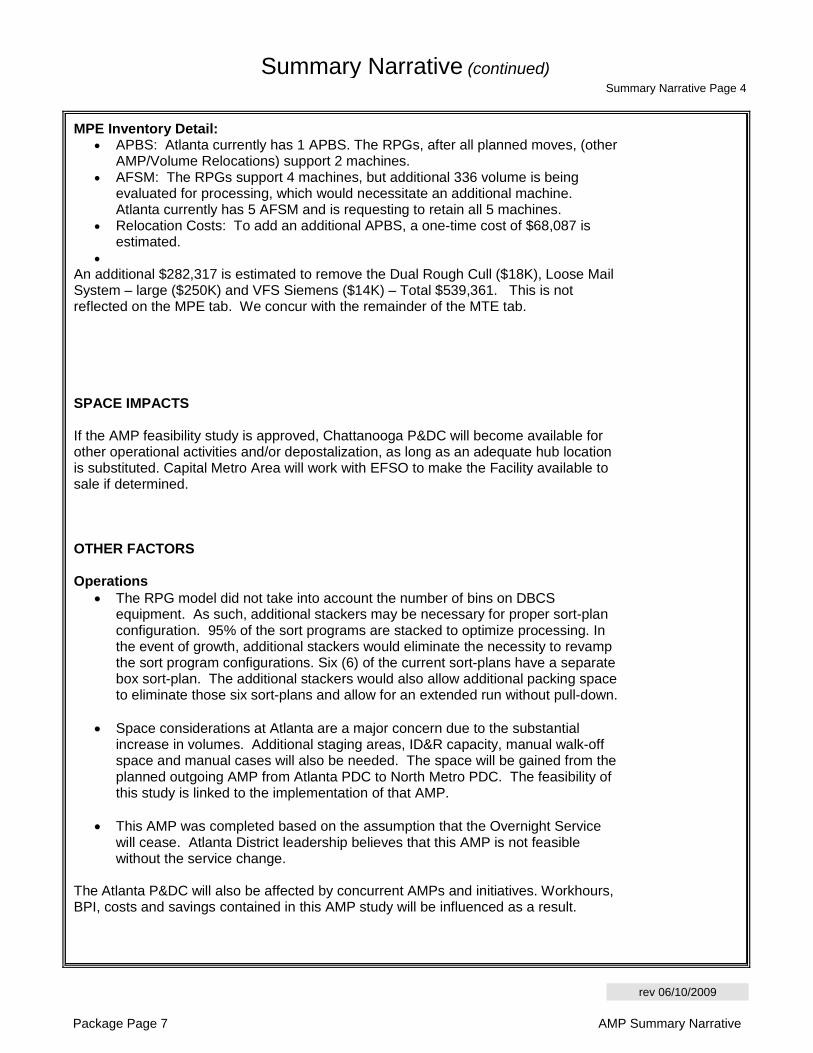
MPE Inventory Detail: APBS: Atlanta currently has 1 APBS. The RPGs, after all planned moves, (other
AMP/Volume Relocations) support 2 machines. AFSM: The RPGs support 4 machines, but additional 336 volume is being
evaluated for processing, which would necessitate an additional machine. Atlanta currently has 5 AFSM and is requesting to retain all 5 machines.
Relocation Costs: To add an additional APBS, a one-time cost of $68,087 is estimated.
An additional $282,317 is estimated to remove the Dual Rough Cull ($18K), Loose Mail System – large ($250K) and VFS Siemens ($14K) – Total $539,361. This is not reflected on the MPE tab. We concur with the remainder of the MTE tab. SPACE IMPACTS If the AMP feasibility study is approved, Chattanooga P&DC will become available for other operational activities and/or depostalization, as long as an adequate hub location is substituted. Capital Metro Area will work with EFSO to make the Facility available to sale if determined. OTHER FACTORS Operations
The RPG model did not take into account the number of bins on DBCS equipment. As such, additional stackers may be necessary for proper sort-plan configuration. 95% of the sort programs are stacked to optimize processing. In the event of growth, additional stackers would eliminate the necessity to revamp the sort program configurations. Six (6) of the current sort-plans have a separate box sort-plan. The additional stackers would also allow additional packing space to eliminate those six sort-plans and allow for an extended run without pull-down.
Space considerations at Atlanta are a major concern due to the substantial
increase in volumes. Additional staging areas, ID&R capacity, manual walk-off space and manual cases will also be needed. The space will be gained from the planned outgoing AMP from Atlanta PDC to North Metro PDC. The feasibility of this study is linked to the implementation of that AMP.
This AMP was completed based on the assumption that the Overnight Service
will cease. Atlanta District leadership believes that this AMP is not feasible without the service change.
The Atlanta P&DC will also be affected by concurrent AMPs and initiatives. Workhours, BPI, costs and savings contained in this AMP study will be influenced as a result.
Package Page 7 AMP Summary Narrative
Last Saved:
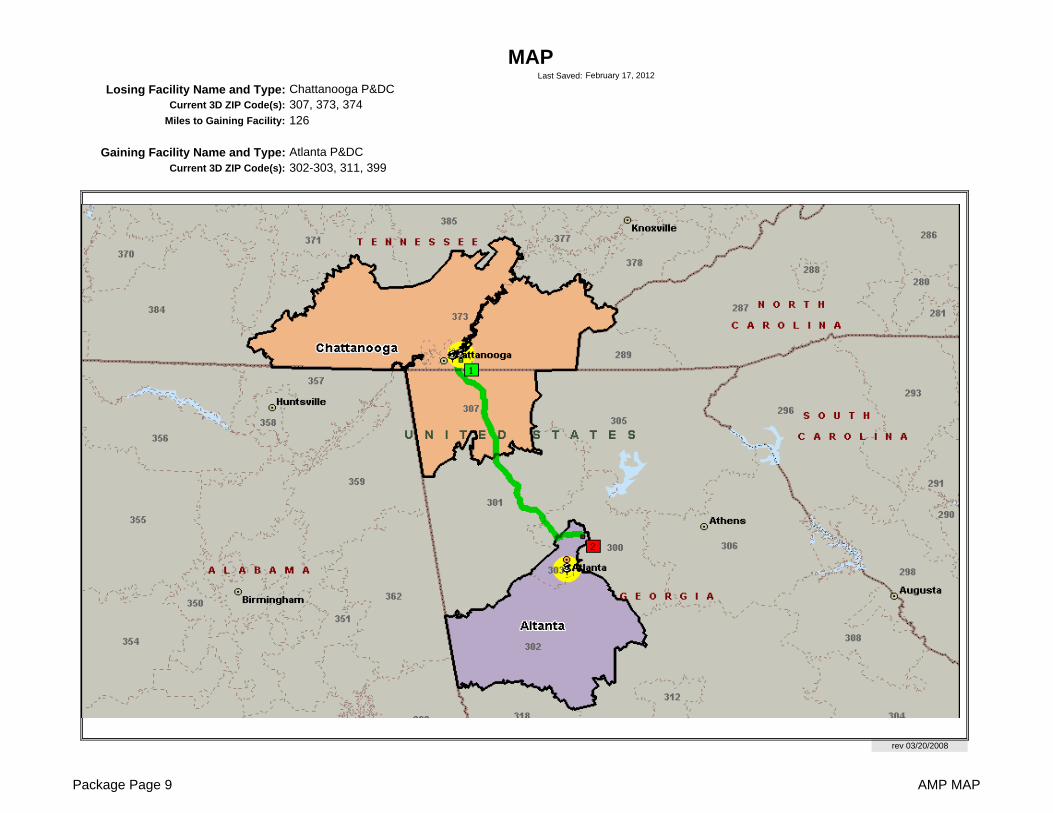
Losing Facility Name and Type:Current 3D ZIP Code(s):
Miles to Gaining Facility:
Gaining Facility Name and Type:Current 3D ZIP Code(s):
rev 03/20/2008
302-303, 311, 399
MAP
Chattanooga P&DC
Atlanta P&DC
307, 373, 374
February 17, 2012
126
Package Page 9 AMP MAP
Overnight % Change All Others % Change Total % Change All % Change All % Change All % Change All % Change All % Change
UPGRADE
DOWNGRADE
TOTAL
NET UP+NO CHNG
VOLUME TOTAL
* - Periodical and Standard mail origin 3-digit ZIP Code to destination 3-digit ZIP Code volume is not available
Overnight % Change All Others % Change Total % Change All % Change All % Change All % Change All % Change All % Change
UPGRADE
DOWNGRADE
TOTAL
NET
Chattanooga P&DC
307, 373, 374302-303, 311, 399Gaining Facility 3D ZIP Code(s):
Service Standard Changes - PairsFCM PRI
PSVC
Service Standard Changes - Average Daily Volume (data obtained from ODIS is derived from sampling and may vary from actual volume)
PSVC ALL CLASSES
rev 10/16/2009
Losing Facility 3D ZIP Code(s):
mm/dd/yyyy
Selected summary fields are transferred to the Executive Summary
PER STD
February 17, 2012
Losing Facility:
Service Standard Impacts
PRI ALL CLASSESSTD *FCM PER *
Based on report prepared by Network Integration Support dated:
Last Saved:
Package Page 10 AMP Service Standard Impacts

Last Saved: Stakeholder Notification Page 1
AMP Event: Start of Study
rev 07/16/2008
Stakeholders Notification Losing Facility:
February 17, 2012(WorkBook Tab Notification - 1)
Chattanooga P&DC
Package Page 11 AMP Stakeholders Notification
Last Saved:
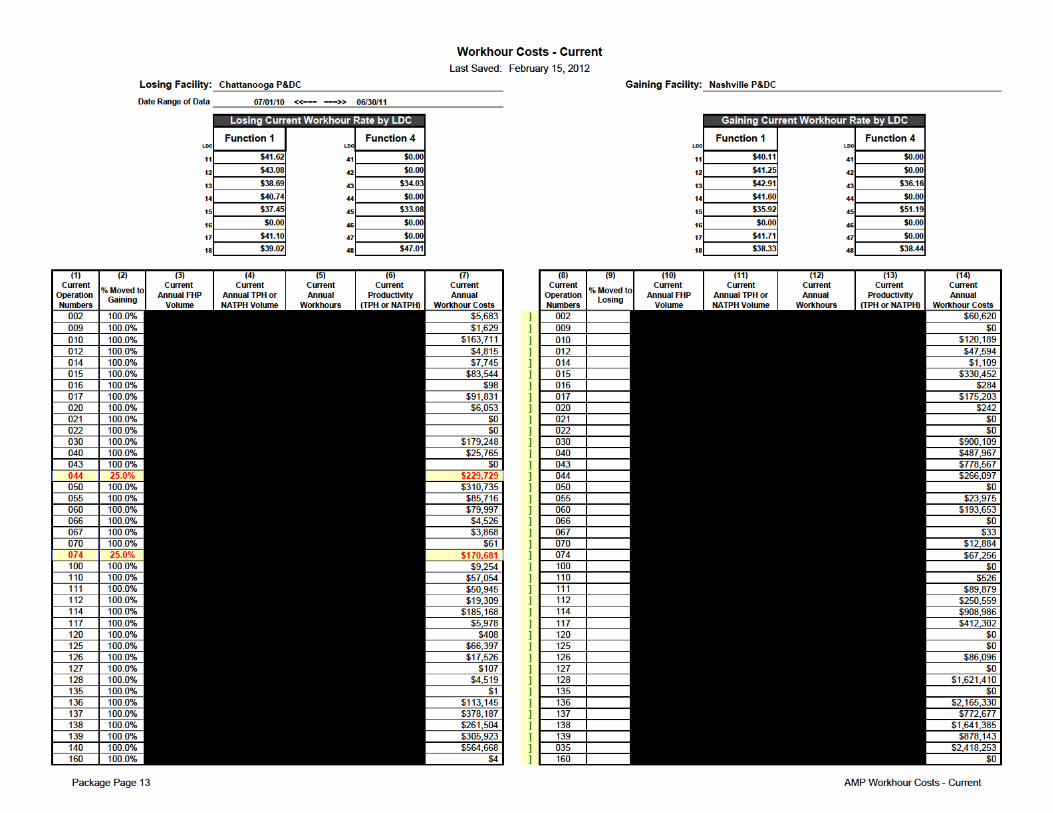
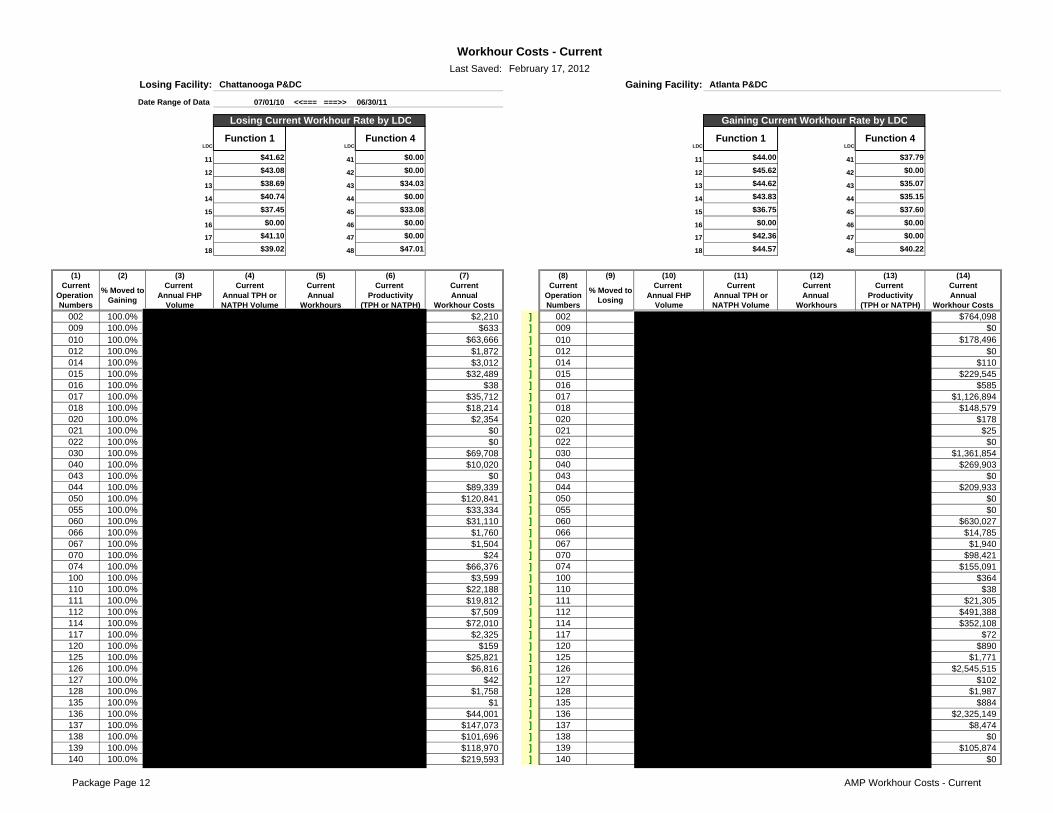
07/01/10 <<=== ===>> 06/30/11
LDC LDC LDC LDC
11 $41.62 41 $0.00 11 $44.00 41 $37.79
12 $43.08 42 $0.00 12 $45.62 42 $0.00
13 $38.69 43 $34.03 13 $44.62 43 $35.07
14 $40.74 44 $0.00 14 $43.83 44 $35.15
15 $37.45 45 $33.08 15 $36.75 45 $37.60
16 $0.00 46 $0.00 16 $0.00 46 $0.00
17 $41.10 47 $0.00 17 $42.36 47 $0.00
18 $39.02 48 $47.01 18 $44.57 48 $40.22
(1) (2) (3) (4) (5) (6) (7) (8) (9) (10) (11) (12) (13) (14)Current Current Current Current Current Current Current Current Current Current Current Current
Operation Annual FHP Annual TPH or Annual Productivity Annual Operation Annual FHP Annual TPH or Annual Productivity AnnualNumbers Volume NATPH Volume Workhours (TPH or NATPH) Workhour Costs Numbers Volume NATPH Volume Workhours (TPH or NATPH) Workhour Costs
002 100.0% $2,210 ] 002 $764,098009 100.0% $633 ] 009 $0010 100.0% $63,666 ] 010 $178,496012 100.0% $1,872 ] 012 $0014 100.0% $3,012 ] 014 $110015 100.0% $32,489 ] 015 $229,545016 100.0% $38 ] 016 $585017 100.0% $35,712 ] 017 $1,126,894018 100.0% $18,214 ] 018 $148,579020 100.0% $2,354 ] 020 $178021 100.0% $0 ] 021 $25022 100.0% $0 ] 022 $0030 100.0% $69,708 ] 030 $1,361,854040 100.0% $10,020 ] 040 $269,903043 100.0% $0 ] 043 $0044 100.0% $89,339 ] 044 $209,933050 100.0% $120,841 ] 050 $0055 100.0% $33,334 ] 055 $0060 100.0% $31,110 ] 060 $630,027066 100.0% $1,760 ] 066 $14,785067 100.0% $1,504 ] 067 $1,940070 100.0% $24 ] 070 $98,421074 100.0% $66,376 ] 074 $155,091100 100.0% $3,599 ] 100 $364110 100.0% $22,188 ] 110 $38111 100.0% $19,812 ] 111 $21,305112 100.0% $7,509 ] 112 $491,388114 100.0% $72,010 ] 114 $352,108117 100.0% $2,325 ] 117 $72120 100.0% $159 ] 120 $890125 100.0% $25,821 ] 125 $1,771126 100.0% $6,816 ] 126 $2,545,515127 100.0% $42 ] 127 $102128 100.0% $1,758 ] 128 $1,987135 100.0% $1 ] 135 $884136 100.0% $44,001 ] 136 $2,325,149137 100.0% $147,073 ] 137 $8,474138 100.0% $101,696 ] 138 $0139 100.0% $118,970 ] 139 $105,874140 100.0% $219,593 ] 140 $0
February 17, 2012
Workhour Costs - Current
Chattanooga P&DC Atlanta P&DC
Losing Current Workhour Rate by LDC
Function 4Function 1
% Moved to Losing
% Moved to Gaining
Losing Facility: Gaining Facility:
Date Range of Data
Function 1
Gaining Current Workhour Rate by LDC
Function 4
Package Page 12 AMP Workhour Costs - Current
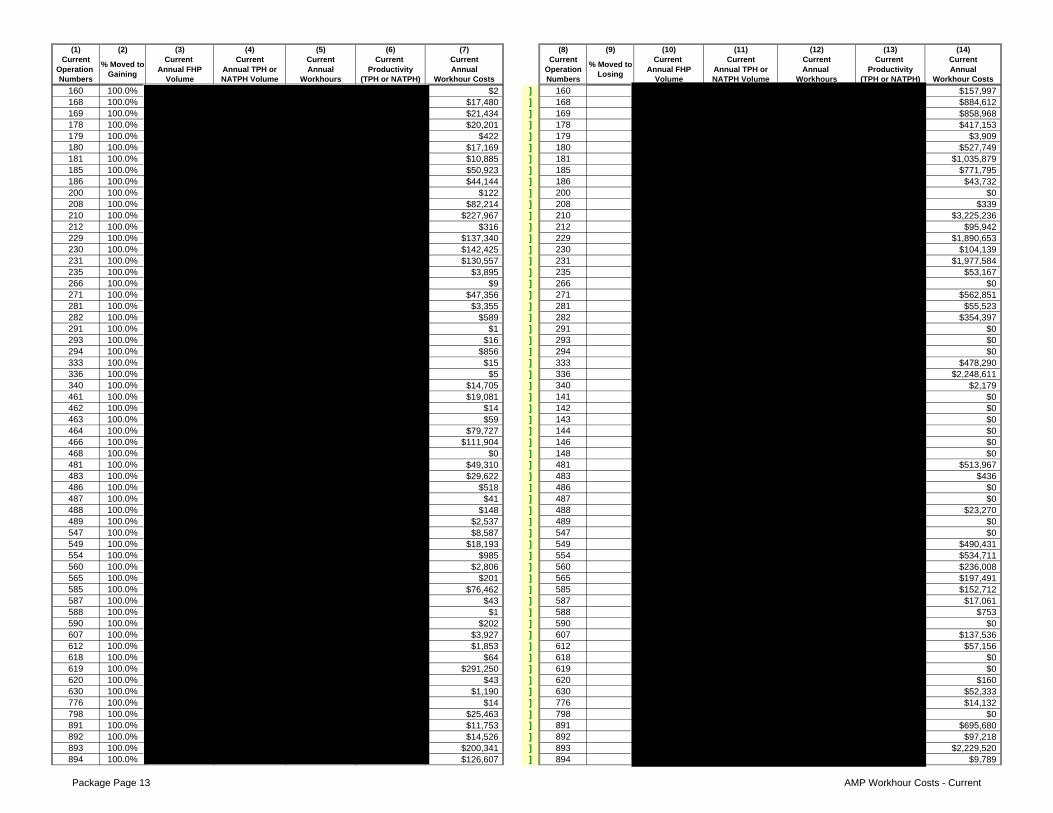
(1) (2) (3) (4) (5) (6) (7) (8) (9) (10) (11) (12) (13) (14)Current Current Current Current Current Current Current Current Current Current Current Current
Operation Annual FHP Annual TPH or Annual Productivity Annual Operation Annual FHP Annual TPH or Annual Productivity AnnualNumbers Volume NATPH Volume Workhours (TPH or NATPH) Workhour Costs Numbers Volume NATPH Volume Workhours (TPH or NATPH) Workhour Costs
% Moved to Losing
% Moved to Gaining
160 100.0% $2 ] 160 $157,997168 100.0% $17,480 ] 168 $884,612169 100.0% $21,434 ] 169 $858,968178 100.0% $20,201 ] 178 $417,153179 100.0% $422 ] 179 $3,909180 100.0% $17,169 ] 180 $527,749181 100.0% $10,885 ] 181 $1,035,879185 100.0% $50,923 ] 185 $771,795186 100.0% $44,144 ] 186 $43,732200 100.0% $122 ] 200 $0208 100.0% $82,214 ] 208 $339210 100.0% $227,967 ] 210 $3,225,236212 100.0% $316 ] 212 $95,942229 100.0% $137,340 ] 229 $1,890,653230 100.0% $142,425 ] 230 $104,139231 100.0% $130,557 ] 231 $1,977,584235 100.0% $3,895 ] 235 $53,167266 100.0% $9 ] 266 $0271 100.0% $47,356 ] 271 $562,851281 100.0% $3,355 ] 281 $55,523282 100.0% $589 ] 282 $354,397291 100.0% $1 ] 291 $0293 100.0% $16 ] 293 $0294 100.0% $856 ] 294 $0333 100.0% $15 ] 333 $478,290336 100.0% $5 ] 336 $2,248,611340 100.0% $14,705 ] 340 $2,179461 100.0% $19,081 ] 141 $0462 100.0% $14 ] 142 $0463 100.0% $59 ] 143 $0464 100.0% $79,727 ] 144 $0466 100.0% $111,904 ] 146 $0468 100.0% $0 ] 148 $0481 100.0% $49,310 ] 481 $513,967483 100.0% $29,622 ] 483 $436486 100.0% $518 ] 486 $0487 100.0% $41 ] 487 $0488 100.0% $148 ] 488 $23,270489 100.0% $2,537 ] 489 $0547 100.0% $8,587 ] 547 $0549 100.0% $18,193 ] 549 $490,431554 100.0% $985 ] 554 $534,711560 100.0% $2,806 ] 560 $236,008565 100.0% $201 ] 565 $197,491585 100.0% $76,462 ] 585 $152,712587 100.0% $43 ] 587 $17,061588 100.0% $1 ] 588 $753590 100.0% $202 ] 590 $0607 100.0% $3,927 ] 607 $137,536612 100.0% $1,853 ] 612 $57,156618 100.0% $64 ] 618 $0619 100.0% $291,250 ] 619 $0620 100.0% $43 ] 620 $160630 100.0% $1,190 ] 630 $52,333776 100.0% $14 ] 776 $14,132798 100.0% $25,463 ] 798 $0891 100.0% $11,753 ] 891 $695,680892 100.0% $14,526 ] 892 $97,218893 100.0% $200,341 ] 893 $2,229,520894 100.0% $126,607 ] 894 $9,789
Package Page 13 AMP Workhour Costs - Current
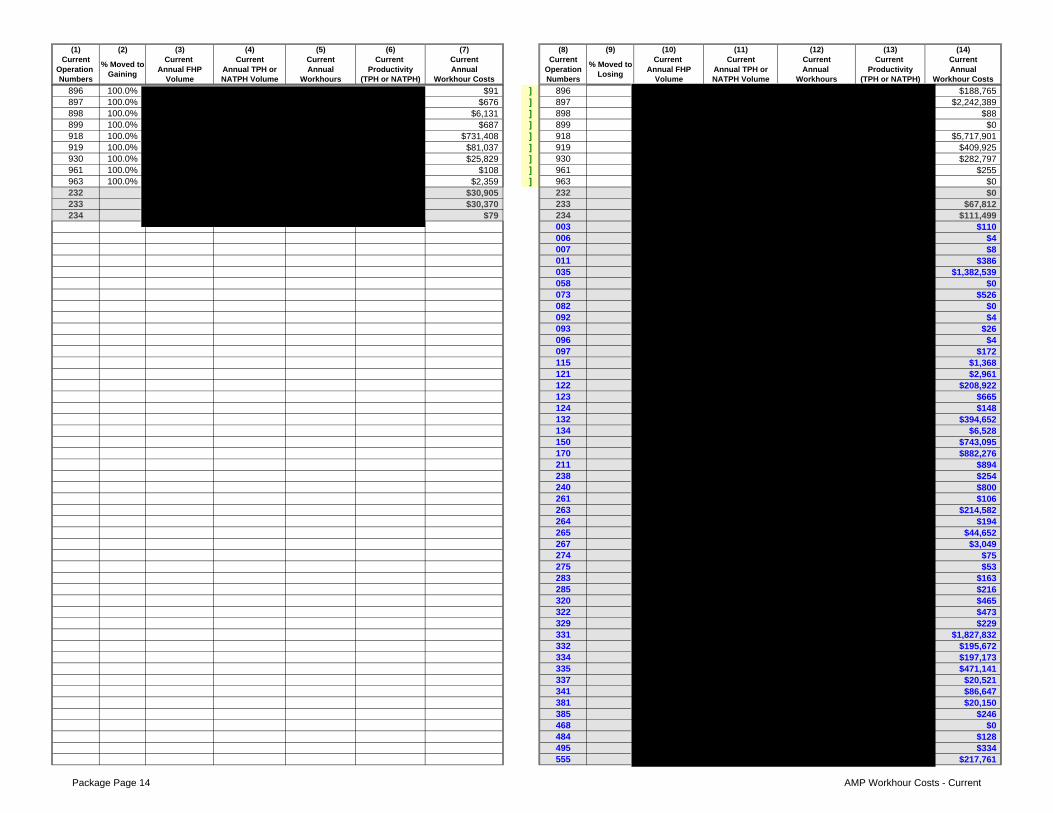
(1) (2) (3) (4) (5) (6) (7) (8) (9) (10) (11) (12) (13) (14)Current Current Current Current Current Current Current Current Current Current Current Current
Operation Annual FHP Annual TPH or Annual Productivity Annual Operation Annual FHP Annual TPH or Annual Productivity AnnualNumbers Volume NATPH Volume Workhours (TPH or NATPH) Workhour Costs Numbers Volume NATPH Volume Workhours (TPH or NATPH) Workhour Costs
% Moved to Losing
% Moved to Gaining
896 100.0% $91 ] 896 $188,765897 100.0% $676 ] 897 $2,242,389898 100.0% $6,131 ] 898 $88899 100.0% $687 ] 899 $0918 100.0% $731,408 ] 918 $5,717,901919 100.0% $81,037 ] 919 $409,925930 100.0% $25,829 ] 930 $282,797961 100.0% $108 ] 961 $255963 100.0% $2,359 ] 963 $0232 $30,905 232 $0233 $30,370 233 $67,812234 $79 234 $111,499
003 $110006 $4007 $8011 $386035 $1,382,539058 $0073 $526082 $0092 $4093 $26096 $4097 $172115 $1,368121 $2,961122 $208,922123 $665124 $148132 $394,652134 $6,528150 $743,095170 $882,276211 $894238 $254240 $800261 $106263 $214,582264 $194265 $44,652267 $3,049274 $75275 $53283 $163285 $216320 $465322 $473329 $229331 $1,827,832332 $195,672334 $197,173335 $471,141337 $20,521341 $86,647381 $20,150385 $246468 $0484 $128495 $334555 $217,761
Package Page 14 AMP Workhour Costs - Current
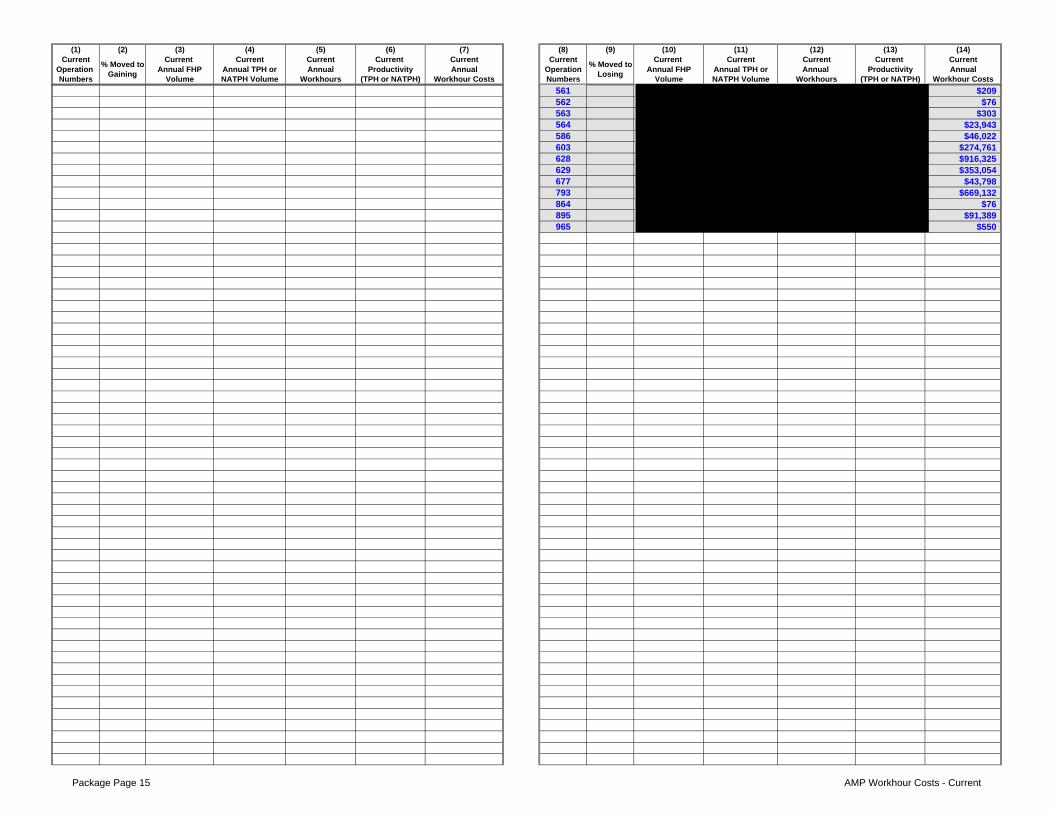
(1) (2) (3) (4) (5) (6) (7) (8) (9) (10) (11) (12) (13) (14)Current Current Current Current Current Current Current Current Current Current Current Current
Operation Annual FHP Annual TPH or Annual Productivity Annual Operation Annual FHP Annual TPH or Annual Productivity AnnualNumbers Volume NATPH Volume Workhours (TPH or NATPH) Workhour Costs Numbers Volume NATPH Volume Workhours (TPH or NATPH) Workhour Costs
% Moved to Losing
% Moved to Gaining
561 $209562 $76563 $303564 $23,943586 $46,022603 $274,761628 $916,325629 $353,054677 $43,798793 $669,132864 $76895 $91,389965 $550
Package Page 15 AMP Workhour Costs - Current

(1) (2) (3) (4) (5) (6) (7) (8) (9) (10) (11) (12) (13) (14)Current Current Current Current Current Current Current Current Current Current Current Current
Operation Annual FHP Annual TPH or Annual Productivity Annual Operation Annual FHP Annual TPH or Annual Productivity AnnualNumbers Volume NATPH Volume Workhours (TPH or NATPH) Workhour Costs Numbers Volume NATPH Volume Workhours (TPH or NATPH) Workhour Costs
% Moved to Losing
% Moved to Gaining
Package Page 16 AMP Workhour Costs - Current
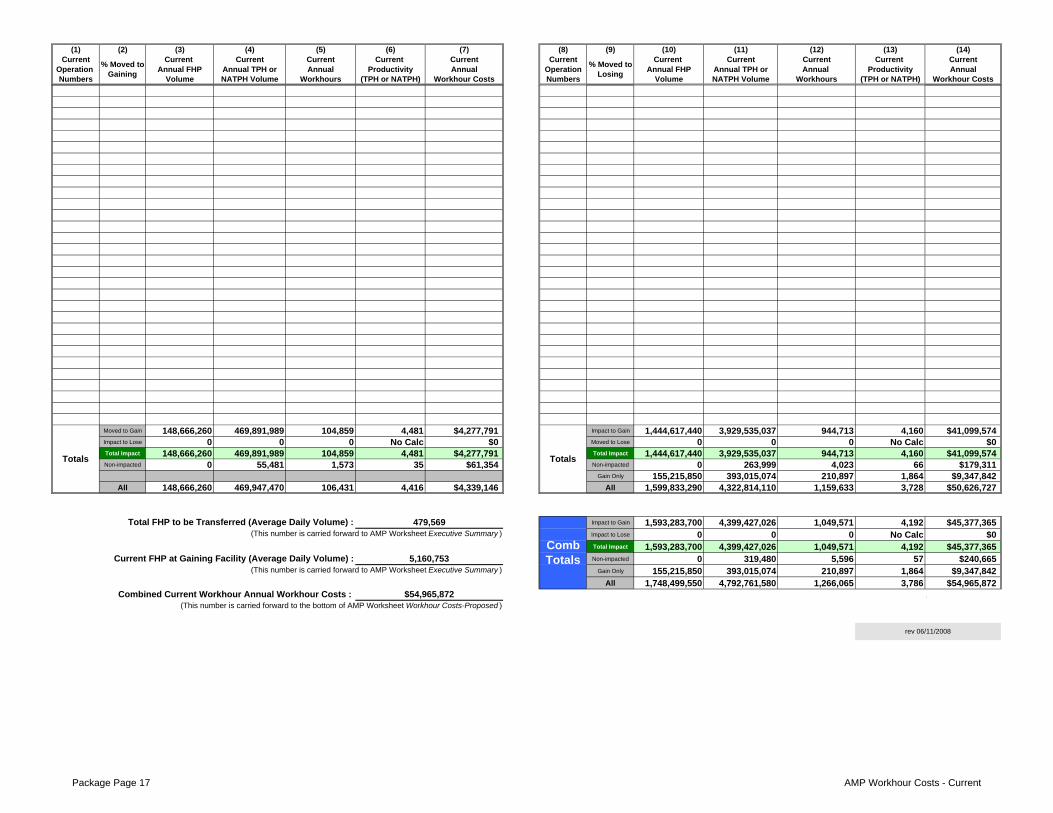
(1) (2) (3) (4) (5) (6) (7) (8) (9) (10) (11) (12) (13) (14)Current Current Current Current Current Current Current Current Current Current Current Current
Operation Annual FHP Annual TPH or Annual Productivity Annual Operation Annual FHP Annual TPH or Annual Productivity AnnualNumbers Volume NATPH Volume Workhours (TPH or NATPH) Workhour Costs Numbers Volume NATPH Volume Workhours (TPH or NATPH) Workhour Costs
% Moved to Losing
% Moved to Gaining
Moved to Gain 148,666,260 469,891,989 104,859 4,481 $4,277,791 Impact to Gain 1,444,617,440 3,929,535,037 944,713 4,160 $41,099,574Impact to Lose 0 0 0 No Calc $0 Moved to Lose 0 0 0 No Calc $0Total Impact 148,666,260 469,891,989 104,859 4,481 $4,277,791 Total Impact 1,444,617,440 3,929,535,037 944,713 4,160 $41,099,574Non-impacted 0 55,481 1,573 35 $61,354 Non-impacted 0 263,999 4,023 66 $179,311
Gain Only 155,215,850 393,015,074 210,897 1,864 $9,347,842All 148,666,260 469,947,470 106,431 4,416 $4,339,146 All 1,599,833,290 4,322,814,110 1,159,633 3,728 $50,626,727
Impact to Gain 1,593,283,700 4,399,427,026 1,049,571 4,192 $45,377,365Impact to Lose 0 0 0 No Calc $0Total Impact 1,593,283,700 4,399,427,026 1,049,571 4,192 $45,377,365Non-impacted 0 319,480 5,596 57 $240,665
Gain Only 155,215,850 393,015,074 210,897 1,864 $9,347,842All 1,748,499,550 4,792,761,580 1,266,065 3,786 $54,965,872
.
rev 06/11/2008
Comb Totals
Totals Totals
(This number is carried forward to AMP Worksheet Executive Summary )
Combined Current Workhour Annual Workhour Costs :
479,569 Total FHP to be Transferred (Average Daily Volume) :
(This number is carried forward to the bottom of AMP Worksheet Workhour Costs-Proposed )$54,965,872
Current FHP at Gaining Facility (Average Daily Volume) : 5,160,753 (This number is carried forward to AMP Worksheet Executive Summary )
Package Page 17 AMP Workhour Costs - Current
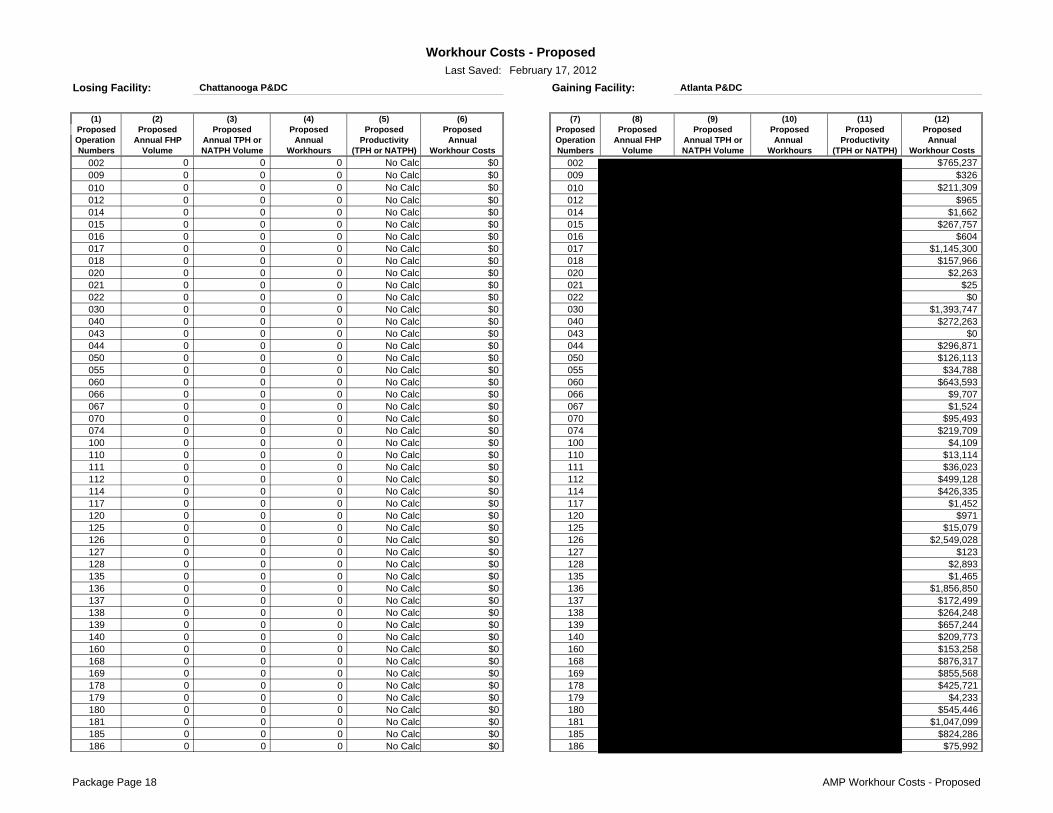
Last Saved:
Losing Facility: Gaining Facility:
(1) (2) (3) (4) (5) (6) (7) (8) (9) (10) (11) (12)Proposed Proposed Proposed Proposed Proposed Proposed Proposed Proposed Proposed Proposed Proposed ProposedOperation Annual FHP Annual TPH or Annual Productivity Annual Operation Annual FHP Annual TPH or Annual Productivity AnnualNumbers Volume NATPH Volume Workhours (TPH or NATPH) Workhour Costs Numbers Volume NATPH Volume Workhours (TPH or NATPH) Workhour Costs
002 0 0 0 No Calc $0 002 $765,237009 0 0 0 No Calc $0 009 $326010 0 0 0 No Calc $0 010 $211,309012 0 0 0 No Calc $0 012 $965014 0 0 0 No Calc $0 014 $1,662015 0 0 0 No Calc $0 015 $267,757016 0 0 0 No Calc $0 016 $604017 0 0 0 No Calc $0 017 $1,145,300018 0 0 0 No Calc $0 018 $157,966020 0 0 0 No Calc $0 020 $2,263021 0 0 0 No Calc $0 021 $25022 0 0 0 No Calc $0 022 $0030 0 0 0 No Calc $0 030 $1,393,747040 0 0 0 No Calc $0 040 $272,263043 0 0 0 No Calc $0 043 $0044 0 0 0 No Calc $0 044 $296,871050 0 0 0 No Calc $0 050 $126,113055 0 0 0 No Calc $0 055 $34,788060 0 0 0 No Calc $0 060 $643,593066 0 0 0 No Calc $0 066 $9,707067 0 0 0 No Calc $0 067 $1,524070 0 0 0 No Calc $0 070 $95,493074 0 0 0 No Calc $0 074 $219,709100 0 0 0 No Calc $0 100 $4,109110 0 0 0 No Calc $0 110 $13,114111 0 0 0 No Calc $0 111 $36,023112 0 0 0 No Calc $0 112 $499,128114 0 0 0 No Calc $0 114 $426,335117 0 0 0 No Calc $0 117 $1,452120 0 0 0 No Calc $0 120 $971125 0 0 0 No Calc $0 125 $15,079126 0 0 0 No Calc $0 126 $2,549,028127 0 0 0 No Calc $0 127 $123128 0 0 0 No Calc $0 128 $2,893135 0 0 0 No Calc $0 135 $1,465136 0 0 0 No Calc $0 136 $1,856,850137 0 0 0 No Calc $0 137 $172,499138 0 0 0 No Calc $0 138 $264,248139 0 0 0 No Calc $0 139 $657,244140 0 0 0 No Calc $0 140 $209,773160 0 0 0 No Calc $0 160 $153,258168 0 0 0 No Calc $0 168 $876,317169 0 0 0 No Calc $0 169 $855,568178 0 0 0 No Calc $0 178 $425,721179 0 0 0 No Calc $0 179 $4,233180 0 0 0 No Calc $0 180 $545,446181 0 0 0 No Calc $0 181 $1,047,099185 0 0 0 No Calc $0 185 $824,286186 0 0 0 No Calc $0 186 $75,992
Workhour Costs - Proposed
Chattanooga P&DC
February 17, 2012
Atlanta P&DC
Package Page 18 AMP Workhour Costs - Proposed
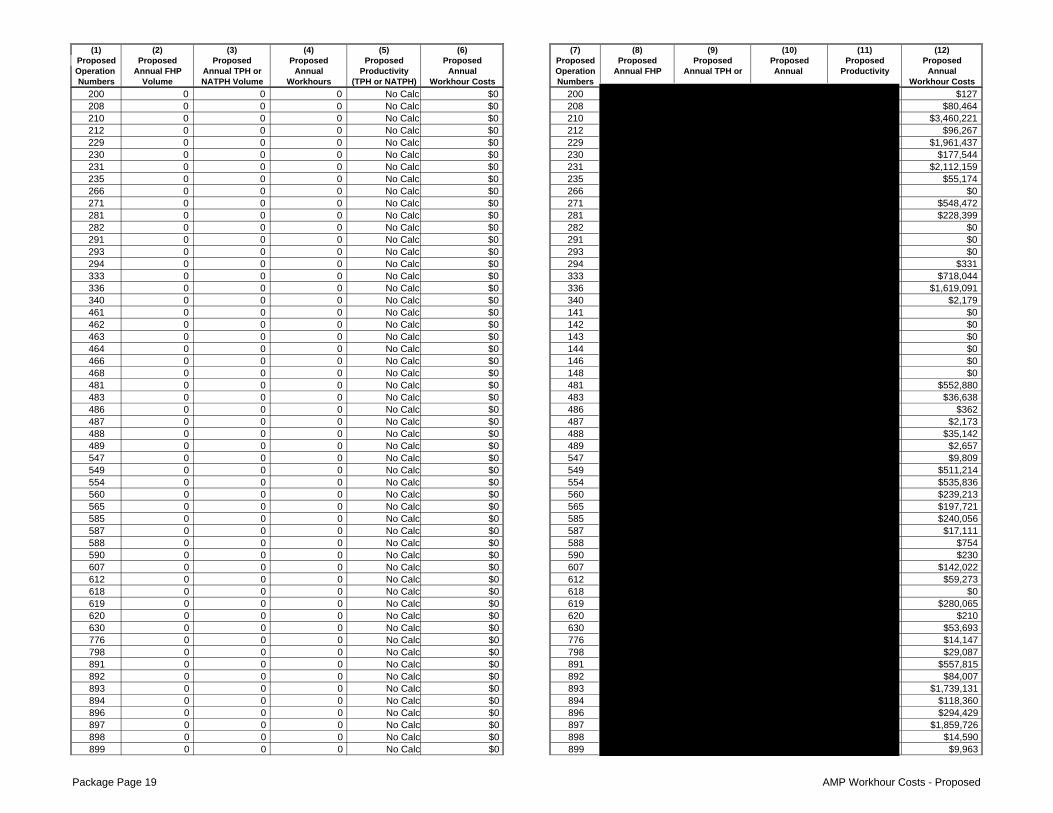
(1) (2) (3) (4) (5) (6) (7) (8) (9) (10) (11) (12)Proposed Proposed Proposed Proposed Proposed Proposed Proposed Proposed Proposed Proposed Proposed ProposedOperation Annual FHP Annual TPH or Annual Productivity Annual Operation Annual FHP Annual TPH or Annual Productivity AnnualNumbers Volume NATPH Volume Workhours (TPH or NATPH) Workhour Costs Numbers Workhour Costs
200 0 0 0 No Calc $0 200 $127208 0 0 0 No Calc $0 208 $80,464210 0 0 0 No Calc $0 210 $3,460,221212 0 0 0 No Calc $0 212 $96,267229 0 0 0 No Calc $0 229 $1,961,437230 0 0 0 No Calc $0 230 $177,544231 0 0 0 No Calc $0 231 $2,112,159235 0 0 0 No Calc $0 235 $55,174266 0 0 0 No Calc $0 266 $0271 0 0 0 No Calc $0 271 $548,472281 0 0 0 No Calc $0 281 $228,399282 0 0 0 No Calc $0 282 $0291 0 0 0 No Calc $0 291 $0293 0 0 0 No Calc $0 293 $0294 0 0 0 No Calc $0 294 $331333 0 0 0 No Calc $0 333 $718,044336 0 0 0 No Calc $0 336 $1,619,091340 0 0 0 No Calc $0 340 $2,179461 0 0 0 No Calc $0 141 $0462 0 0 0 No Calc $0 142 $0463 0 0 0 No Calc $0 143 $0464 0 0 0 No Calc $0 144 $0466 0 0 0 No Calc $0 146 $0468 0 0 0 No Calc $0 148 $0481 0 0 0 No Calc $0 481 $552,880483 0 0 0 No Calc $0 483 $36,638486 0 0 0 No Calc $0 486 $362487 0 0 0 No Calc $0 487 $2,173488 0 0 0 No Calc $0 488 $35,142489 0 0 0 No Calc $0 489 $2,657547 0 0 0 No Calc $0 547 $9,809549 0 0 0 No Calc $0 549 $511,214554 0 0 0 No Calc $0 554 $535,836560 0 0 0 No Calc $0 560 $239,213565 0 0 0 No Calc $0 565 $197,721585 0 0 0 No Calc $0 585 $240,056587 0 0 0 No Calc $0 587 $17,111588 0 0 0 No Calc $0 588 $754590 0 0 0 No Calc $0 590 $230607 0 0 0 No Calc $0 607 $142,022612 0 0 0 No Calc $0 612 $59,273618 0 0 0 No Calc $0 618 $0619 0 0 0 No Calc $0 619 $280,065620 0 0 0 No Calc $0 620 $210630 0 0 0 No Calc $0 630 $53,693776 0 0 0 No Calc $0 776 $14,147798 0 0 0 No Calc $0 798 $29,087891 0 0 0 No Calc $0 891 $557,815892 0 0 0 No Calc $0 892 $84,007893 0 0 0 No Calc $0 893 $1,739,131894 0 0 0 No Calc $0 894 $118,360896 0 0 0 No Calc $0 896 $294,429897 0 0 0 No Calc $0 897 $1,859,726898 0 0 0 No Calc $0 898 $14,590899 0 0 0 No Calc $0 899 $9,963
Package Page 19 AMP Workhour Costs - Proposed
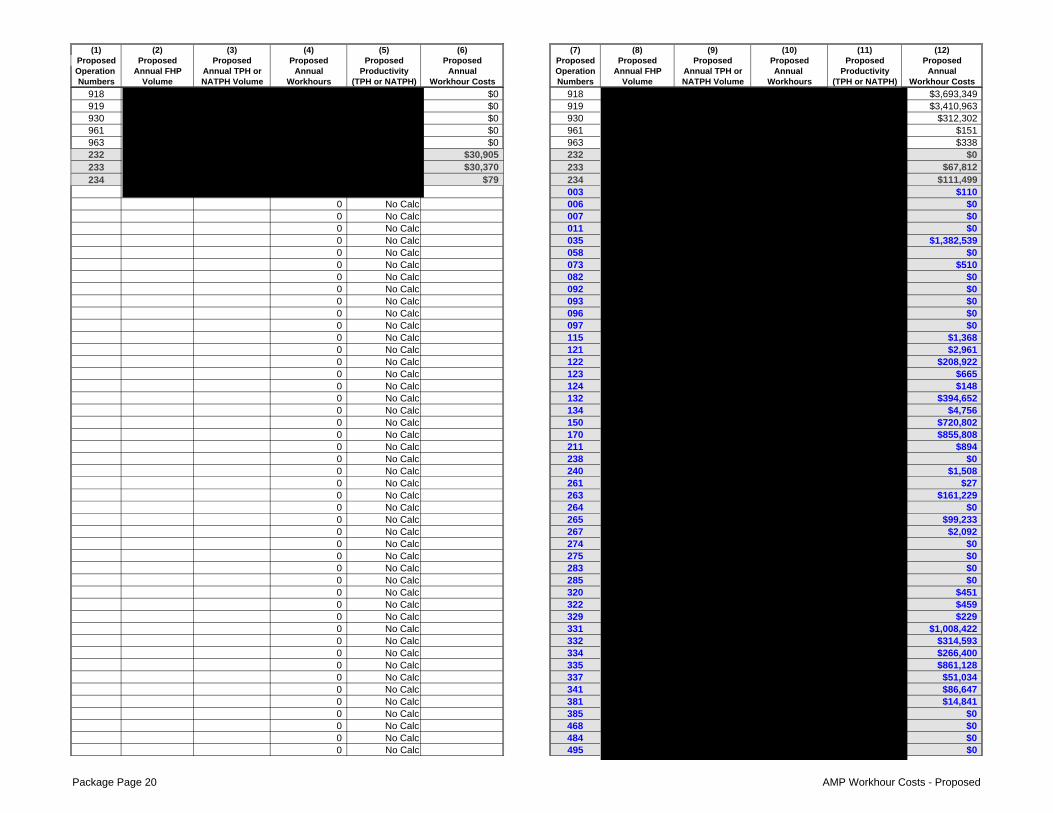
(1) (2) (3) (4) (5) (6) (7) (8) (9) (10) (11) (12)Proposed Proposed Proposed Proposed Proposed Proposed Proposed Proposed Proposed Proposed Proposed ProposedOperation Annual FHP Annual TPH or Annual Productivity Annual Operation Annual FHP Annual TPH or Annual Productivity AnnualNumbers Volume NATPH Volume Workhours (TPH or NATPH) Workhour Costs Numbers Volume NATPH Volume Workhours (TPH or NATPH) Workhour Costs
918 $0 918 $3,693,349919 $0 919 $3,410,963930 $0 930 $312,302961 $0 961 $151963 $0 963 $338232 $30,905 232 $0233 $30,370 233 $67,812234 $79 234 $111,499
003 $1100 No Calc 006 $00 No Calc 007 $00 No Calc 011 $00 No Calc 035 $1,382,5390 No Calc 058 $00 No Calc 073 $5100 No Calc 082 $00 No Calc 092 $00 No Calc 093 $00 No Calc 096 $00 No Calc 097 $00 No Calc 115 $1,3680 No Calc 121 $2,9610 No Calc 122 $208,9220 No Calc 123 $6650 No Calc 124 $1480 No Calc 132 $394,6520 No Calc 134 $4,7560 No Calc 150 $720,8020 No Calc 170 $855,8080 No Calc 211 $8940 No Calc 238 $00 No Calc 240 $1,5080 No Calc 261 $270 No Calc 263 $161,2290 No Calc 264 $00 No Calc 265 $99,2330 No Calc 267 $2,0920 No Calc 274 $00 No Calc 275 $00 No Calc 283 $00 No Calc 285 $00 No Calc 320 $4510 No Calc 322 $4590 No Calc 329 $2290 No Calc 331 $1,008,4220 No Calc 332 $314,5930 No Calc 334 $266,4000 No Calc 335 $861,1280 No Calc 337 $51,0340 No Calc 341 $86,6470 No Calc 381 $14,8410 No Calc 385 $00 No Calc 468 $00 No Calc 484 $00 No Calc 495 $0
Package Page 20 AMP Workhour Costs - Proposed

(1) (2) (3) (4) (5) (6) (7) (8) (9) (10) (11) (12)Proposed Proposed Proposed Proposed Proposed Proposed Proposed Proposed Proposed Proposed Proposed ProposedOperation Annual FHP Annual TPH or Annual Productivity Annual Operation Annual FHP Annual TPH or Annual Productivity AnnualNumbers Volume NATPH Volume Workhours (TPH or NATPH) Workhour Costs Numbers Volume NATPH Volume Workhours (TPH or NATPH) Workhour Costs
0 No Calc 555 $217,7610 No Calc 561 $2090 No Calc 562 $760 No Calc 563 $3030 No Calc 564 $23,9430 No Calc 586 $46,0220 No Calc 603 $00 No Calc 628 $586,2620 No Calc 629 $524,1360 No Calc 677 $43,7980 No Calc 793 $669,1320 No Calc 864 $00 No Calc 895 $65,8840 No Calc 965 $00 No Calc0 No Calc 0 No Calc0 No Calc 0 No Calc0 No Calc 0 No Calc0 No Calc 0 No Calc0 No Calc 0 No Calc0 No Calc 0 No Calc0 No Calc 0 No Calc0 No Calc 0 No Calc0 No Calc 0 No Calc0 No Calc 0 No Calc0 No Calc 0 No Calc0 No Calc 0 No Calc0 No Calc 0 No Calc0 No Calc 0 No Calc0 No Calc 0 No Calc0 No Calc 0 No Calc0 No Calc 0 No Calc0 No Calc 0 No Calc0 No Calc 0 No Calc0 No Calc 0 No Calc0 No Calc 0 No Calc0 No Calc 0 No Calc0 No Calc 0 No Calc0 No Calc 0 No Calc0 No Calc 0 No Calc0 No Calc 0 No Calc0 No Calc 0 No Calc0 No Calc 0 No Calc0 No Calc 0 No Calc0 No Calc 0 No Calc0 No Calc 0 No Calc0 No Calc 0 No Calc0 No Calc 0 No Calc0 No Calc 0 No Calc0 No Calc 0 No Calc0 No Calc 0 No Calc0 No Calc 0 No Calc0 No Calc 0 No Calc0 No Calc 0 No Calc0 No Calc 0 No Calc
Package Page 21 AMP Workhour Costs - Proposed
(1) (2) (3) (4) (5) (6) (7) (8) (9) (10) (11) (12)Proposed Proposed Proposed Proposed Proposed Proposed Proposed Proposed Proposed Proposed Proposed ProposedOperation Annual FHP Annual TPH or Annual Productivity Annual Operation Annual FHP Annual TPH or Annual Productivity AnnualNumbers Volume NATPH Volume Workhours (TPH or NATPH) Workhour Costs Numbers Volume NATPH Volume Workhours (TPH or NATPH) Workhour Costs
0 No Calc 0 No Calc0 No Calc 0 No Calc0 No Calc 0 No Calc0 No Calc 0 No Calc0 No Calc 0 No Calc0 No Calc 0 No Calc0 No Calc 0 No Calc0 No Calc 0 No Calc0 No Calc 0 No Calc0 No Calc 0 No Calc0 No Calc 0 No Calc0 No Calc 0 No Calc0 No Calc 0 No Calc0 No Calc 0 No Calc0 No Calc 0 No Calc0 No Calc 0 No Calc0 No Calc 0 No Calc0 No Calc 0 No Calc0 No Calc 0 No Calc0 No Calc 0 No Calc0 No Calc 0 No Calc0 No Calc 0 No Calc0 No Calc 0 No Calc0 No Calc 0 No Calc0 No Calc 0 No Calc0 No Calc 0 No Calc0 No Calc 0 No Calc0 No Calc 0 No Calc0 No Calc 0 No Calc0 No Calc 0 No Calc0 No Calc 0 No Calc0 No Calc 0 No Calc0 No Calc 0 No Calc0 No Calc 0 No Calc0 No Calc 0 No Calc0 No Calc 0 No Calc0 No Calc 0 No Calc0 No Calc 0 No Calc0 No Calc 0 No Calc0 No Calc 0 No Calc0 No Calc 0 No Calc0 No Calc 0 No Calc0 No Calc 0 No Calc0 No Calc 0 No Calc0 No Calc 0 No Calc0 No Calc 0 No Calc0 No Calc 0 No Calc0 No Calc 0 No Calc0 No Calc 0 No Calc0 No Calc 0 No Calc0 No Calc 0 No Calc0 No Calc 0 No Calc0 No Calc 0 No Calc0 No Calc 0 No Calc0 No Calc 0 No Calc
Package Page 22 AMP Workhour Costs - Proposed
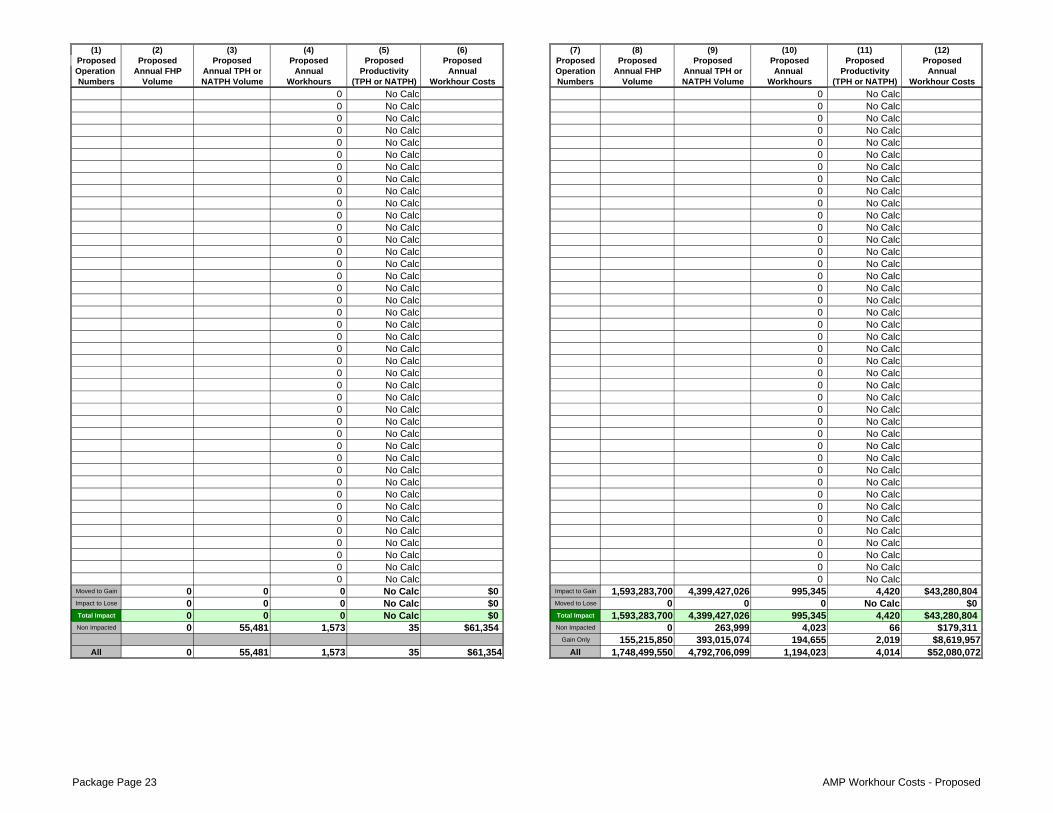
(1) (2) (3) (4) (5) (6) (7) (8) (9) (10) (11) (12)Proposed Proposed Proposed Proposed Proposed Proposed Proposed Proposed Proposed Proposed Proposed ProposedOperation Annual FHP Annual TPH or Annual Productivity Annual Operation Annual FHP Annual TPH or Annual Productivity AnnualNumbers Volume NATPH Volume Workhours (TPH or NATPH) Workhour Costs Numbers Volume NATPH Volume Workhours (TPH or NATPH) Workhour Costs
0 No Calc 0 No Calc0 No Calc 0 No Calc0 No Calc 0 No Calc0 No Calc 0 No Calc0 No Calc 0 No Calc0 No Calc 0 No Calc0 No Calc 0 No Calc0 No Calc 0 No Calc0 No Calc 0 No Calc0 No Calc 0 No Calc0 No Calc 0 No Calc0 No Calc 0 No Calc0 No Calc 0 No Calc0 No Calc 0 No Calc0 No Calc 0 No Calc0 No Calc 0 No Calc0 No Calc 0 No Calc0 No Calc 0 No Calc0 No Calc 0 No Calc0 No Calc 0 No Calc0 No Calc 0 No Calc0 No Calc 0 No Calc0 No Calc 0 No Calc0 No Calc 0 No Calc0 No Calc 0 No Calc0 No Calc 0 No Calc0 No Calc 0 No Calc0 No Calc 0 No Calc0 No Calc 0 No Calc0 No Calc 0 No Calc0 No Calc 0 No Calc0 No Calc 0 No Calc0 No Calc 0 No Calc0 No Calc 0 No Calc0 No Calc 0 No Calc0 No Calc 0 No Calc0 No Calc 0 No Calc0 No Calc 0 No Calc0 No Calc 0 No Calc0 No Calc 0 No Calc0 No Calc 0 No Calc
Moved to Gain 0 0 0 No Calc $0 Impact to Gain 1,593,283,700 4,399,427,026 995,345 4,420 $43,280,804Impact to Lose 0 0 0 No Calc $0 Moved to Lose 0 0 0 No Calc $0Total Impact 0 0 0 No Calc $0 Total Impact 1,593,283,700 4,399,427,026 995,345 4,420 $43,280,804Non Impacted 0 55,481 1,573 35 $61,354 Non Impacted 0 263,999 4,023 66 $179,311
Gain Only 155,215,850 393,015,074 194,655 2,019 $8,619,957All 0 55,481 1,573 35 $61,354 All 1,748,499,550 4,792,706,099 1,194,023 4,014 $52,080,072
Package Page 23 AMP Workhour Costs - Proposed
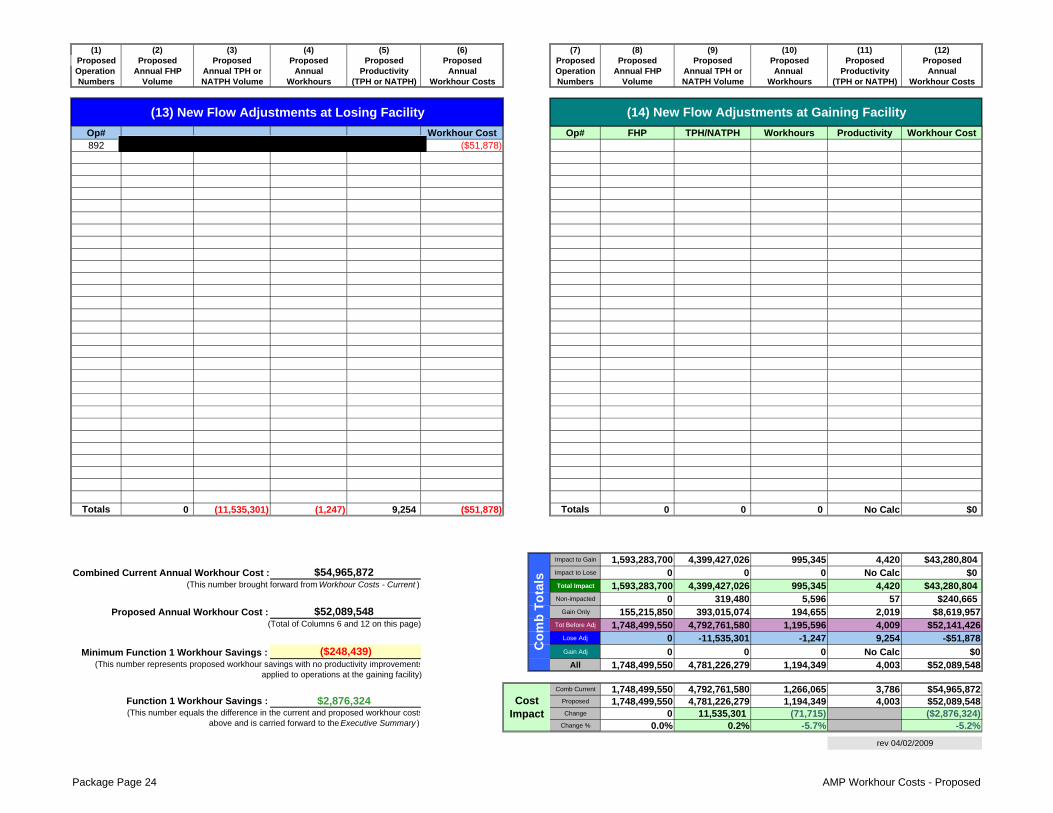
(1) (2) (3) (4) (5) (6) (7) (8) (9) (10) (11) (12)Proposed Proposed Proposed Proposed Proposed Proposed Proposed Proposed Proposed Proposed Proposed ProposedOperation Annual FHP Annual TPH or Annual Productivity Annual Operation Annual FHP Annual TPH or Annual Productivity AnnualNumbers Volume NATPH Volume Workhours (TPH or NATPH) Workhour Costs Numbers Volume NATPH Volume Workhours (TPH or NATPH) Workhour Costs
Op# Workhour Cost Op# FHP TPH/NATPH Workhours Productivity Workhour Cost892 ($51,878)
Totals 0 (11,535,301) (1,247) 9,254 ($51,878) Totals 0 0 0 No Calc $0
Impact to Gain 1,593,283,700 4,399,427,026 995,345 4,420 $43,280,804Combined Current Annual Workhour Cost : Impact to Lose 0 0 0 No Calc $0
Total Impact 1,593,283,700 4,399,427,026 995,345 4,420 $43,280,804Non-impacted 0 319,480 5,596 57 $240,665
Gain Only 155,215,850 393,015,074 194,655 2,019 $8,619,957Tot Before Adj 1,748,499,550 4,792,761,580 1,195,596 4,009 $52,141,426
Lose Adj 0 -11,535,301 -1,247 9,254 -$51,878Gain Adj 0 0 0 No Calc $0
All 1,748,499,550 4,781,226,279 1,194,349 4,003 $52,089,548
Comb Current 1,748,499,550 4,792,761,580 1,266,065 3,786 $54,965,872Proposed 1,748,499,550 4,781,226,279 1,194,349 4,003 $52,089,548Change 0 11,535,301 (71,715) ($2,876,324)
Change % 0.0% 0.2% -5.7% -5.2%
Co
mb
To
tals
Cost Impact(This number equals the difference in the current and proposed workhour costs
above and is carried forward to the Executive Summary )
(This number brought forward from Workhour Costs - Current )
Function 1 Workhour Savings : $2,876,324
Minimum Function 1 Workhour Savings : ($248,439)(This number represents proposed workhour savings with no productivity improvements
applied to operations at the gaining facility)
(13) New Flow Adjustments at Losing Facility
$54,965,872
Proposed Annual Workhour Cost :(Total of Columns 6 and 12 on this page)
$52,089,548
rev 04/02/2009
(14) New Flow Adjustments at Gaining Facility
Package Page 24 AMP Workhour Costs - Proposed
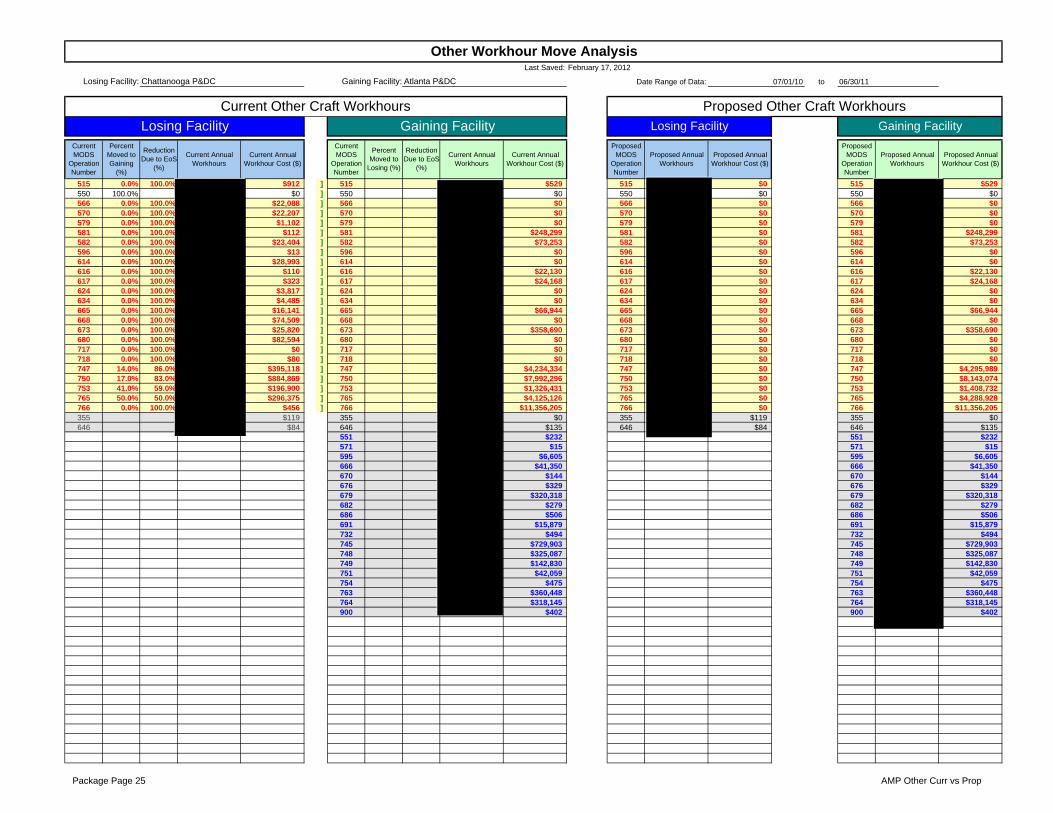
Last Saved:
to
515 0.0% 100.0% $912 ] 515 $529 515 $0 515 $529550 100.0% $0 ] 550 $0 550 $0 550 $0566 0.0% 100.0% $22,088 ] 566 $0 566 $0 566 $0570 0.0% 100.0% $22,207 ] 570 $0 570 $0 570 $0579 0.0% 100.0% $1,102 ] 579 $0 579 $0 579 $0581 0.0% 100.0% $112 ] 581 $248,299 581 $0 581 $248,299582 0.0% 100.0% $23,404 ] 582 $73,253 582 $0 582 $73,253596 0.0% 100.0% $13 ] 596 $0 596 $0 596 $0614 0.0% 100.0% $28,993 ] 614 $0 614 $0 614 $0616 0.0% 100.0% $110 ] 616 $22,130 616 $0 616 $22,130617 0.0% 100.0% $323 ] 617 $24,168 617 $0 617 $24,168624 0.0% 100.0% $3,817 ] 624 $0 624 $0 624 $0634 0.0% 100.0% $4,485 ] 634 $0 634 $0 634 $0665 0.0% 100.0% $16,141 ] 665 $66,944 665 $0 665 $66,944668 0.0% 100.0% $74,509 ] 668 $0 668 $0 668 $0673 0.0% 100.0% $25,820 ] 673 $358,690 673 $0 673 $358,690680 0.0% 100.0% $82,594 ] 680 $0 680 $0 680 $0717 0.0% 100.0% $0 ] 717 $0 717 $0 717 $0718 0.0% 100.0% $80 ] 718 $0 718 $0 718 $0747 14.0% 86.0% $395,118 ] 747 $4,234,334 747 $0 747 $4,295,989750 17.0% 83.0% $884,869 ] 750 $7,992,296 750 $0 750 $8,143,074753 41.0% 59.0% $196,900 ] 753 $1,326,431 753 $0 753 $1,408,732765 50.0% 50.0% $296,375 ] 765 $4,125,126 765 $0 765 $4,288,928766 0.0% 100.0% $456 ] 766 $11,356,205 766 $0 766 $11,356,205355 $119 355 $0 355 $119 355 $0646 $84 646 $135 646 $84 646 $135
551 $232 551 $232571 $15 571 $15595 $6,605 595 $6,605666 $41,350 666 $41,350670 $144 670 $144676 $329 676 $329679 $320,318 679 $320,318682 $279 682 $279686 $506 686 $506691 $15,879 691 $15,879732 $494 732 $494745 $729,903 745 $729,903748 $325,087 748 $325,087749 $142,830 749 $142,830751 $42,059 751 $42,059754 $475 754 $475763 $360,448 763 $360,448764 $318,145 764 $318,145900 $402 900 $402
Gaining Facility
Current MODS
Operation Number
Percent Moved to
Losing (%)
Current Annual Workhour Cost ($)
Proposed MODS
Operation Number
Proposed Annual Workhour Cost ($)
Gaining Facility Losing FacilityLosing Facility
Current Other Craft Workhours
Current Annual Workhour Cost ($)
Current MODS
Operation Number
Percent Moved to Gaining
(%)
Current Annual Workhours
Current Annual Workhours
Reduction Due to EoS
(%)
Reduction Due to EoS
(%)
Proposed MODS
Operation Number
Proposed Annual Workhours
Other Workhour Move Analysis
Chattanooga P&DCLosing Facility: Gaining Facility: Atlanta P&DC Date Range of Data: 06/30/1107/01/10
February 17, 2012
Proposed Other Craft Workhours
Proposed Annual Workhours
Proposed Annual Workhour Cost ($)
Package Page 25 AMP Other Curr vs Prop

Package Page 26 AMP Other Curr vs Prop
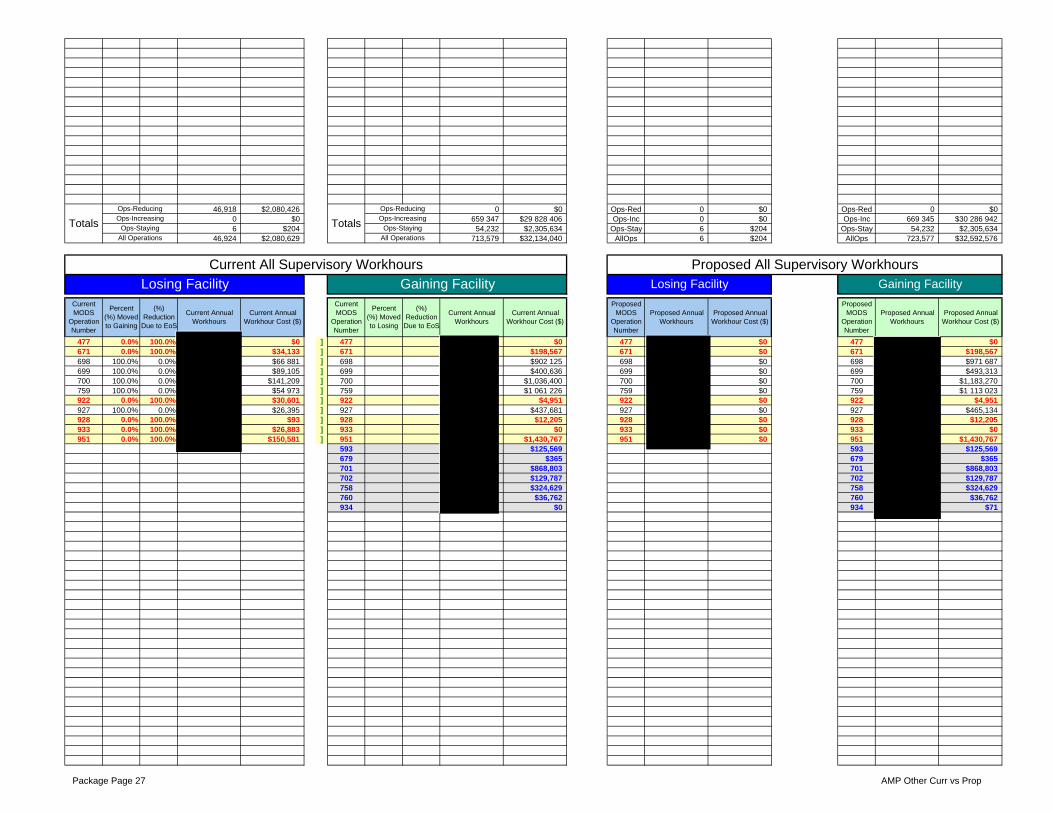
46,918 $2,080,426 0 $0 Ops-Red 0 $0 Ops-Red 0 $00 $0 659 347 $29 828 406 Ops-Inc 0 $0 Ops-Inc 669 345 $30 286 9426 $204 54,232 $2,305,634 Ops-Stay 6 $204 Ops-Stay 54,232 $2,305,634
46,924 $2,080,629 713,579 $32,134,040 AllOps 6 $204 AllOps 723,577 $32,592,576
477 0.0% 100.0% $0 ] 477 $0 477 $0 477 $0671 0.0% 100.0% $34,133 ] 671 $198,567 671 $0 671 $198,567698 100.0% 0.0% $66 881 ] 698 $902 125 698 $0 698 $971 687699 100.0% 0.0% $89,105 ] 699 $400,636 699 $0 699 $493,313700 100.0% 0.0% $141,209 ] 700 $1,036,400 700 $0 700 $1,183,270759 100.0% 0.0% $54 973 ] 759 $1 061 226 759 $0 759 $1 113 023922 0.0% 100.0% $30,601 ] 922 $4,951 922 $0 922 $4,951927 100.0% 0.0% $26,395 ] 927 $437,681 927 $0 927 $465,134928 0.0% 100.0% $93 ] 928 $12,205 928 $0 928 $12,205933 0.0% 100.0% $26,883 ] 933 $0 933 $0 933 $0951 0.0% 100.0% $150,581 ] 951 $1,430,767 951 $0 951 $1,430,767
593 $125,569 593 $125,569679 $365 679 $365701 $868,803 701 $868,803702 $129,787 702 $129,787758 $324,629 758 $324,629760 $36,762 760 $36,762934 $0 934 $71
Gaining Facility
Current MODS
Operation Number
Totals
Ops-ReducingOps-Increasing
Ops-StayingAll Operations
Percent (%) Moved to Losing
(%) Reduction
Due to EoS
Percent (%) Moved to Gaining
(%) Reduction
Due to EoS
Current Annual Workhours
Totals
Ops-ReducingOps-Increasing
Ops-StayingAll Operations
Current All Supervisory Workhours
Current Annual Workhour Cost ($)
Current Annual Workhours
Current MODS
Operation Number
Losing Facility Gaining Facility
Current Annual Workhour Cost ($)
Proposed Annual Workhour Cost ($)
Proposed MODS
Operation Number
Proposed Annual Workhours
Proposed Annual Workhour Cost ($)
Losing Facility
Proposed MODS
Operation Number
Proposed Annual Workhours
Proposed All Supervisory Workhours
Package Page 27 AMP Other Curr vs Prop

Package Page 28 AMP Other Curr vs Prop
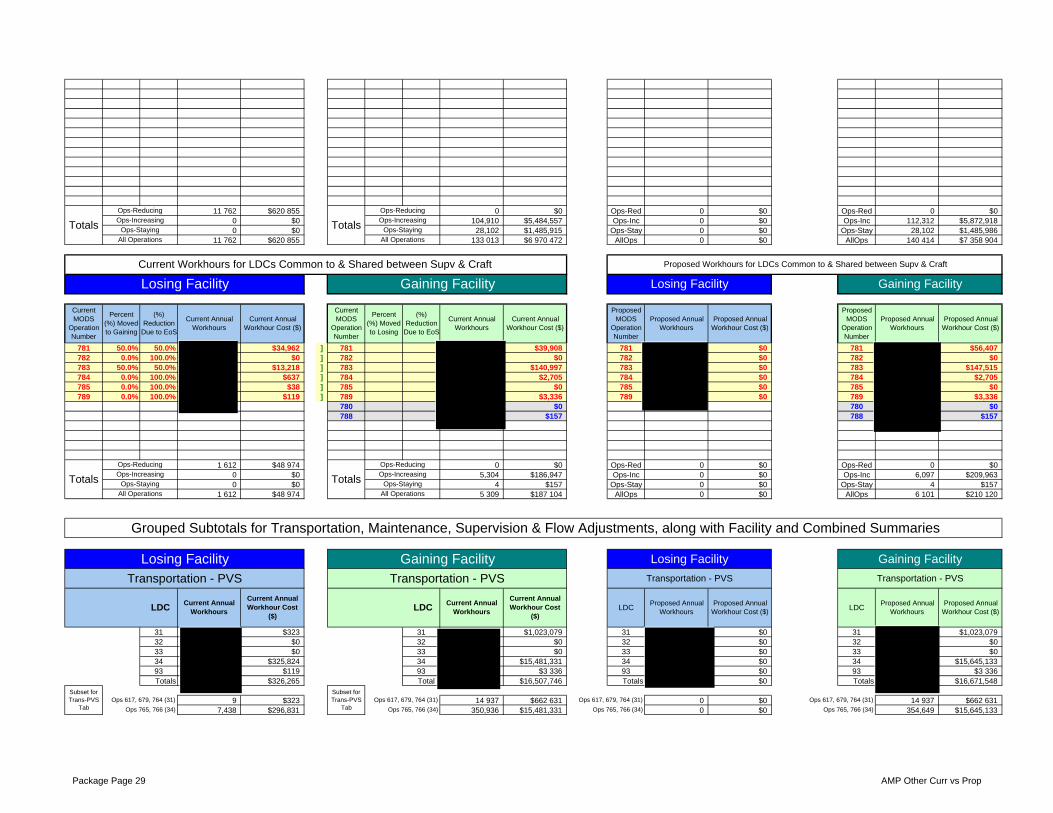
11 762 $620 855 0 $0 Ops-Red 0 $0 Ops-Red 0 $00 $0 104,910 $5,484,557 Ops-Inc 0 $0 Ops-Inc 112,312 $5,872,9180 $0 28,102 $1,485,915 Ops-Stay 0 $0 Ops-Stay 28,102 $1,485,986
11 762 $620 855 133 013 $6 970 472 AllOps 0 $0 AllOps 140 414 $7 358 904
781 50.0% 50.0% $34,962 ] 781 $39,908 781 $0 781 $56,407782 0.0% 100.0% $0 ] 782 $0 782 $0 782 $0783 50.0% 50.0% $13,218 ] 783 $140,997 783 $0 783 $147,515784 0.0% 100.0% $637 ] 784 $2,705 784 $0 784 $2,705785 0.0% 100.0% $38 ] 785 $0 785 $0 785 $0789 0.0% 100.0% $119 ] 789 $3,336 789 $0 789 $3,336
780 $0 780 $0788 $157 788 $157
1 612 $48 974 0 $0 Ops-Red 0 $0 Ops-Red 0 $00 $0 5,304 $186,947 Ops-Inc 0 $0 Ops-Inc 6,097 $209,9630 $0 4 $157 Ops-Stay 0 $0 Ops-Stay 4 $157
1 612 $48 974 5 309 $187 104 AllOps 0 $0 AllOps 6 101 $210 120
31 $323 31 $1,023,079 31 $0 31 $1,023,07932 $0 32 $0 32 $0 32 $033 $0 33 $0 33 $0 33 $034 $325,824 34 $15,481,331 34 $0 34 $15,645,13393 $119 93 $3 336 93 $0 93 $3 336Totals $326,265 Total $16,507,746 Totals $0 Totals $16,671,548
9 $323 14 937 $662 631 0 $0 14 937 $662 6317,438 $296,831 350,936 $15,481,331 0 $0 354,649 $15,645,133
Subset for Trans-PVS
TabOps 617, 679, 764 (31)
Transportation - PVS
LDCCurrent Annual
Workhours
Current Annual Workhour Cost
($)
Ops 765, 766 (34)
LDCCurrent Annual
Workhours
Current Annual Workhour Cost
($)
Current MODS
Operation Number
(%) Reduction
Due to EoS
Grouped Subtotals for Transportation, Maintenance, Supervision & Flow Adjustments, along with Facility and Combined Summaries
Ops-IncreasingOps-Staying
All Operations
Current Annual Workhours
All Operations
Percent (%) Moved to Losing
Gaining Facility Losing Facility
Current Annual Workhour Cost ($)
Gaining Facility
Ops 617, 679, 764 (31)
Ops 765, 766 (34)
Ops 617, 679, 764 (31)
Ops 765, 766 (34)
Ops-Reducing
All Operations
Current Workhours for LDCs Common to & Shared between Supv & Craft Proposed Workhours for LDCs Common to & Shared between Supv & Craft
Current MODS
Operation Number
Gaining Facility
Totals
Losing Facility
Losing Facility Gaining Facility
TotalsOps-Increasing
Ops-Staying
Losing Facility
Ops 617, 679, 764 (31)Subset for Trans-PVS
Tab
(%) Reduction
Due to EoS
Current Annual Workhours
Current Annual Workhour Cost ($)
Transportation - PVS
Totals
Ops-ReducingOps-Increasing
Ops-Staying
Ops-Reducing
Percent (%) Moved to Gaining
Totals
Ops-ReducingOps-Increasing
Ops-StayingAll Operations
Proposed Annual Workhour Cost ($)
Proposed MODS
Operation Number
Proposed Annual Workhours
Proposed Annual Workhour Cost ($)
LDC
Proposed MODS
Operation Number
Proposed Annual Workhours
Ops 765, 766 (34)
Proposed Annual Workhour Cost ($)
Transportation - PVS
Proposed Annual Workhours
Proposed Annual Workhour Cost ($)
Transportation - PVS
LDCProposed Annual
Workhours
Package Page 29 AMP Other Curr vs Prop
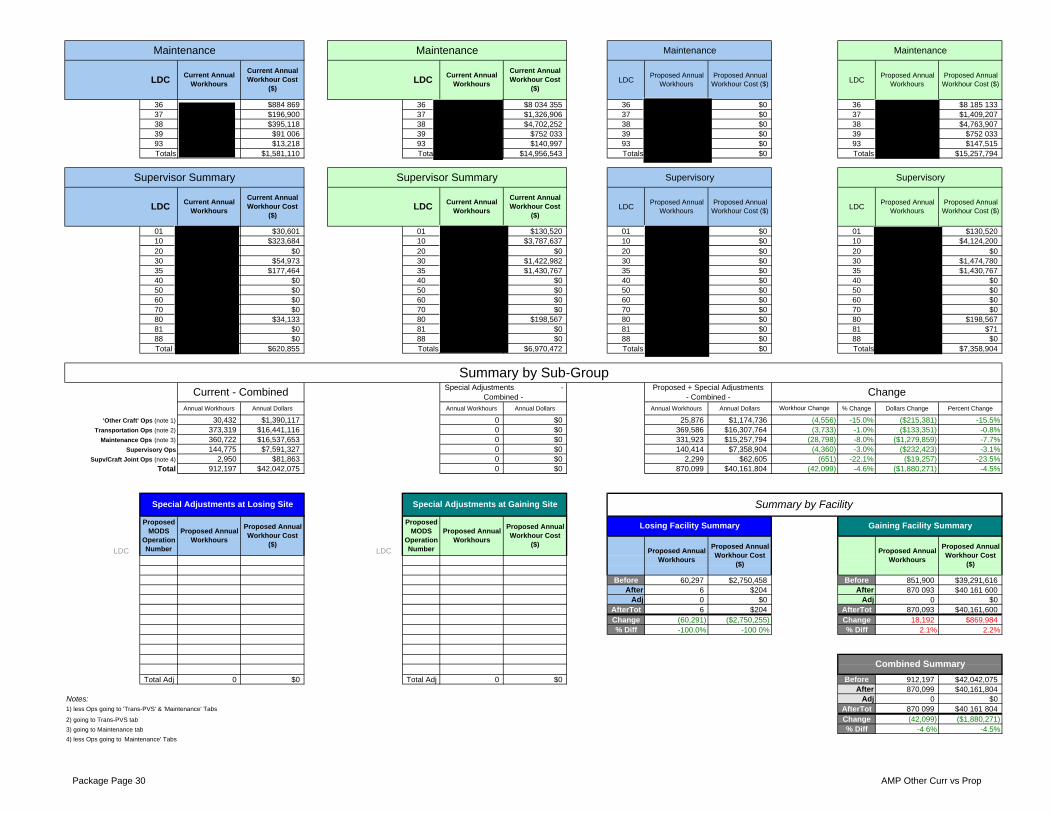
36 $884 869 36 $8 034 355 36 $0 36 $8 185 13337 $196,900 37 $1,326,906 37 $0 37 $1,409,20738 $395,118 38 $4,702,252 38 $0 38 $4,763,90739 $91 006 39 $752 033 39 $0 39 $752 03393 $13,218 93 $140,997 93 $0 93 $147,515Totals $1,581,110 Tota $14,956,543 Totals $0 Totals $15,257,794
01 $30,601 01 $130,520 01 $0 01 $130,52010 $323,684 10 $3,787,637 10 $0 10 $4,124,20020 $0 20 $0 20 $0 20 $030 $54,973 30 $1,422,982 30 $0 30 $1,474,78035 $177,464 35 $1,430,767 35 $0 35 $1,430,76740 $0 40 $0 40 $0 40 $050 $0 50 $0 50 $0 50 $060 $0 60 $0 60 $0 60 $070 $0 70 $0 70 $0 70 $080 $34,133 80 $198,567 80 $0 80 $198,56781 $0 81 $0 81 $0 81 $7188 $0 88 $0 88 $0 88 $0Total $620,855 Totals $6,970,472 Totals $0 Totals $7,358,904
Annual Workhours Annual Dollars Annual Workhours Annual Dollars Annual Workhours Annual Dollars % Change Dollars Change Percent Change
30,432 $1,390,117 0 $0 25,876 $1,174,736 -15.0% ($215,381) -15.5%373,319 $16,441,116 0 $0 369,586 $16,307,764 -1.0% ($133,351) -0.8%360,722 $16,537,653 0 $0 331,923 $15,257,794 -8.0% ($1,279,859) -7.7%144,775 $7,591,327 0 $0 140,414 $7,358,904 -3.0% ($232,423) -3.1%
2,950 $81,863 0 $0 2,299 $62,605 -22.1% ($19,257) -23.5%912,197 $42,042,075 0 $0 870,099 $40,161,804 -4.6% ($1,880,271) -4.5%
LDC LDC Before 60,297 $2,750,458 Before 851,900 $39,291,616 After 6 $204 After 870 093 $40 161 600 Adj 0 $0 Adj 0 $0 AfterTot 6 $204 AfterTot 870,093 $40,161,600 Change (60,291) ($2,750,255) Change 18,192 $869,984 % Diff -100.0% -100 0% % Diff 2.1% 2.2%
Total Adj 0 $0 Total Adj 0 $0 Before 912,197 $42,042,075After 870,099 $40,161,804
Adj 0 $0AfterTot 870 099 $40 161 804Change (42,099) ($1,880,271)% Diff -4 6% -4.5%
(4,556)
4) less Ops going to Maintenance' Tabs
'Other Craft' Ops (note 1)
Notes:1) less Ops going to 'Trans-PVS' & 'Maintenance' Tabs
2) going to Trans-PVS tab
3) going to Maintenance tab
Supervisory Ops
ChangeProposed + Special Adjustments - Combined -Current - Combined
Workhour Change
(3,733)(28,798)
(4,360)Maintenance Ops (note 3)
Transportation Ops (note 2)
Summary by FacilitySpecial Adjustments at Losing Site
(651)Supv/Craft Joint Ops (note 4)
Total (42,099)
Supervisory
LDCProposed Annual
WorkhoursProposed Annual
Workhour Cost ($)
Supervisor Summary Supervisor Summary
LDCCurrent Annual
Workhours
Current Annual Workhour Cost
($)LDC
Current Annual Workhours
Current Annual Workhour Cost
($)
Maintenance
Current Annual Workhours
Maintenance
Proposed Annual Workhour Cost ($)
Proposed Annual WorkhoursLDC
Proposed Annual WorkhoursLDC
Proposed Annual Workhours
Losing Facility Summary
Combined Summary
Proposed Annual Workhours
Proposed Annual Workhour Cost
($)
Proposed Annual Workhour Cost
($)
Proposed Annual Workhours
Proposed MODS
Operation Number
Proposed Annual Workhours
Proposed Annual Workhour Cost
($)
Proposed MODS
Operation Number
Proposed Annual Workhour Cost
($)
Special Adjustments at Gaining Site
Maintenance
Current Annual Workhour Cost
($)
Summary by Sub-GroupSpecial Adjustments -
Combined -
Gaining Facility Summary
Maintenance
LDC LDCCurrent Annual
Workhours
Current Annual Workhour Cost
($)
Proposed Annual Workhour Cost ($)
Supervisory
LDCProposed Annual
WorkhoursProposed Annual
Workhour Cost ($)
Package Page 30 AMP Other Curr vs Prop

rev 06/17/2008
Package Page 31 AMP Other Curr vs Prop
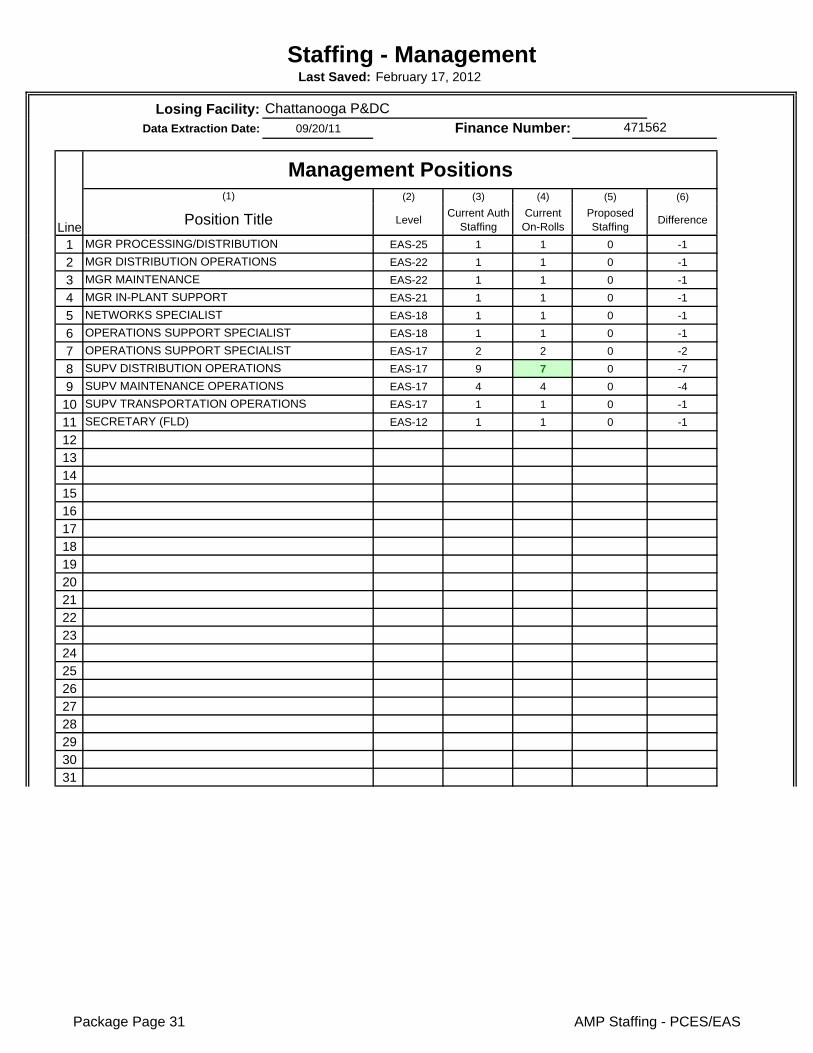
Last Saved:
Losing Facility:Data Extraction Date: 09/20/11
(2) (3) (4) (5) (6)
LevelCurrent Auth
StaffingCurrent On-Rolls
Proposed Staffing
Difference
1 EAS-25 1 1 0 -1
2 EAS-22 1 1 0 -1
3 EAS-22 1 1 0 -1
4 EAS-21 1 1 0 -1
5 EAS-18 1 1 0 -1
6 EAS-18 1 1 0 -1
7 EAS-17 2 2 0 -2
8 EAS-17 9 7 0 -7
9 EAS-17 4 4 0 -4
10 EAS-17 1 1 0 -1
11 EAS-12 1 1 0 -1
1213141516171819202122232425262728293031
Staffing - Management
471562
February 17, 2012
Chattanooga P&DC
Line
(1)
Position Title
MGR PROCESSING/DISTRIBUTION
Management Positions
SUPV DISTRIBUTION OPERATIONS
SUPV MAINTENANCE OPERATIONS
SUPV TRANSPORTATION OPERATIONS
SECRETARY (FLD)
Finance Number:
MGR DISTRIBUTION OPERATIONS
MGR MAINTENANCE
MGR IN-PLANT SUPPORT
NETWORKS SPECIALIST
OPERATIONS SUPPORT SPECIALIST
OPERATIONS SUPPORT SPECIALIST
Package Page 31 AMP Staffing - PCES/EAS

444546474849505152535455565758596061626364656667686970717273747576777879
23 21 0 (21)
Retirement Eligibles: 10 Position Loss: 21
Totals
Package Page 32 AMP Staffing - PCES/EAS
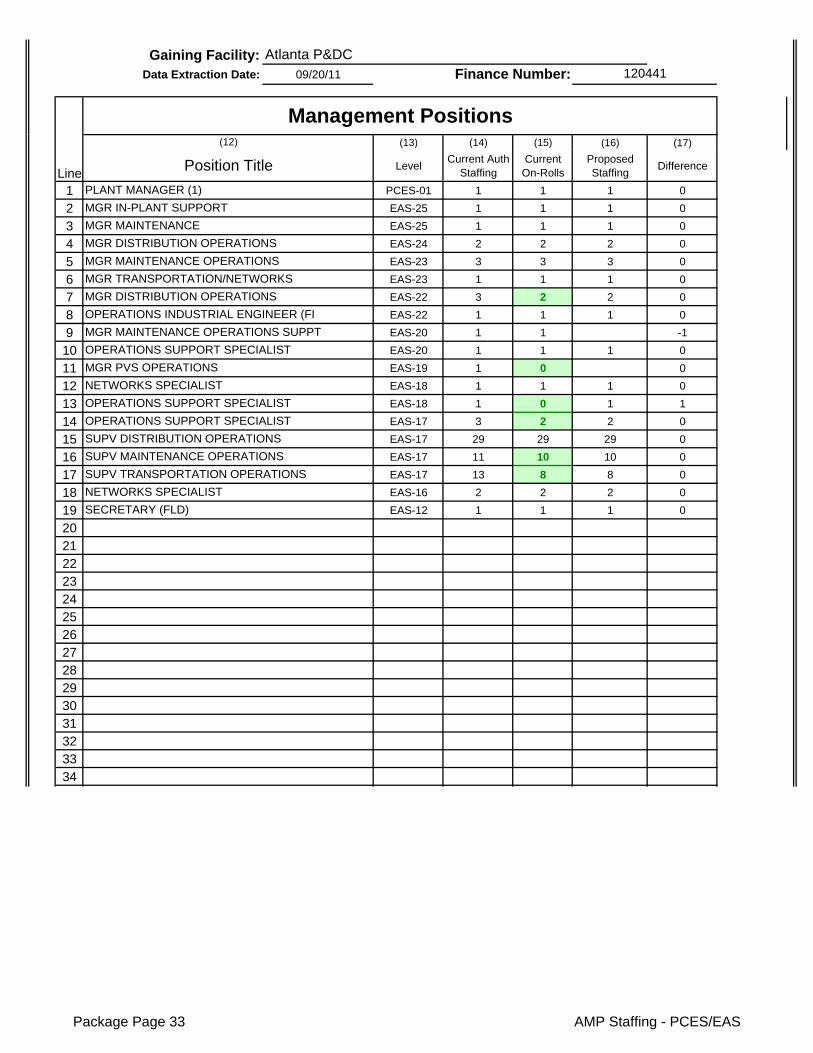
Gaining Facility:Data Extraction Date: 09/20/11
(13) (14) (15) (16) (17)
LevelCurrent Auth
StaffingCurrent On-Rolls
Proposed Staffing
Difference
1 PCES-01 1 1 1 0
2 EAS-25 1 1 1 0
3 EAS-25 1 1 1 0
4 EAS-24 2 2 2 0
5 EAS-23 3 3 3 0
6 EAS-23 1 1 1 0
7 EAS-22 3 2 2 0
8 EAS-22 1 1 1 0
9 EAS-20 1 1 -1
10 EAS-20 1 1 1 0
11 EAS-19 1 0 0
12 EAS-18 1 1 1 0
13 EAS-18 1 0 1 1
14 EAS-17 3 2 2 0
15 EAS-17 29 29 29 0
16 EAS-17 11 10 10 0
17 EAS-17 13 8 8 0
18 EAS-16 2 2 2 0
19 EAS-12 1 1 1 0
202122232425262728293031323334
Finance Number: 120441
Atlanta P&DC
Line Position Title
(12)
Management Positions
PLANT MANAGER (1)
MGR IN-PLANT SUPPORT
MGR MAINTENANCE
MGR DISTRIBUTION OPERATIONS
MGR MAINTENANCE OPERATIONS
MGR TRANSPORTATION/NETWORKS
MGR DISTRIBUTION OPERATIONS
OPERATIONS INDUSTRIAL ENGINEER (FI
MGR MAINTENANCE OPERATIONS SUPPT
OPERATIONS SUPPORT SPECIALIST
MGR PVS OPERATIONS
NETWORKS SPECIALIST
OPERATIONS SUPPORT SPECIALIST
OPERATIONS SUPPORT SPECIALIST
SUPV DISTRIBUTION OPERATIONS
SUPV MAINTENANCE OPERATIONS
SUPV TRANSPORTATION OPERATIONS
NETWORKS SPECIALIST
SECRETARY (FLD)
Package Page 33 AMP Staffing - PCES/EAS
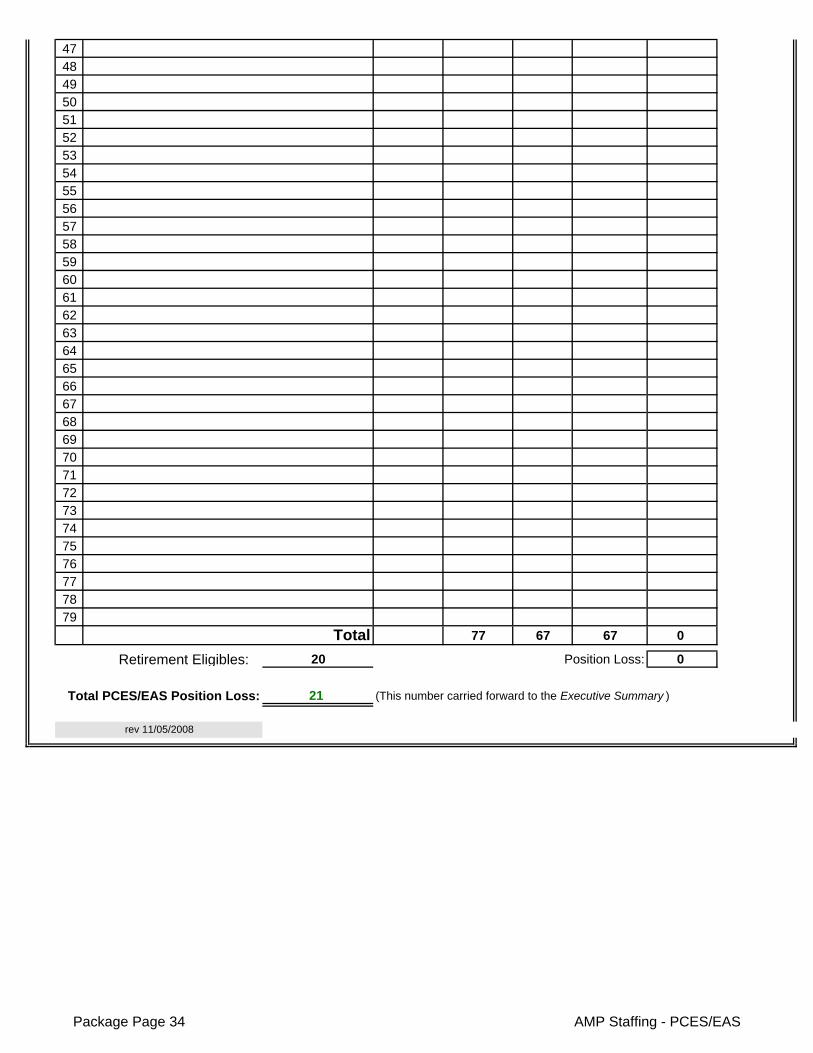
474849505152535455565758596061626364656667686970717273747576777879
77 67 67 0
Retirement Eligibles: 20 Position Loss: 0
21
Total
rev 11/05/2008
Total PCES/EAS Position Loss: (This number carried forward to the Executive Summary )
Package Page 34 AMP Staffing - PCES/EAS
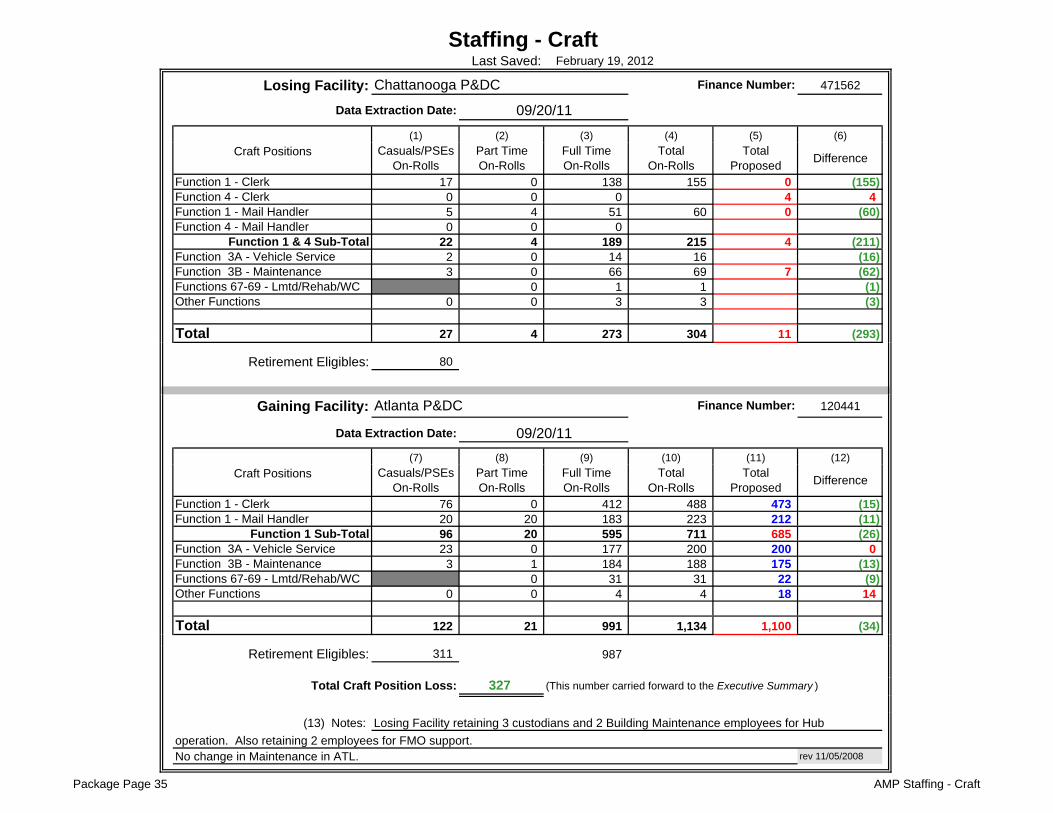
Losing Facility: 471562
(1) (2) (3) (4) (5) (6)
Craft Positions
Function 1 - Clerk 17 0 138 155 0 (155)Function 4 - Clerk 0 0 0 4 4Function 1 - Mail Handler 5 4 51 60 0 (60)Function 4 - Mail Handler 0 0 0
Function 1 & 4 Sub-Total 22 4 189 215 4 (211)Function 3A - Vehicle Service 2 0 14 16 (16)Function 3B - Maintenance 3 0 66 69 7 (62)Functions 67-69 - Lmtd/Rehab/WC 0 1 1 (1)Other Functions 0 0 3 3 (3)
Total 27 4 273 304 11 (293)
Retirement Eligibles: 80
Gaining Facility: 120441
(7) (8) (9) (10) (11) (12)
Craft Positions
Function 1 - Clerk 76 0 412 488 473 (15)Function 1 - Mail Handler 20 20 183 223 212 (11)
Function 1 Sub-Total 96 20 595 711 685 (26)Function 3A - Vehicle Service 23 0 177 200 200 0Function 3B - Maintenance 3 1 184 188 175 (13)Functions 67-69 - Lmtd/Rehab/WC 0 31 31 22 (9)Other Functions 0 0 4 4 18 14
Total 122 21 991 1,134 1,100 (34)
Retirement Eligibles: 311 987
327
(13) Notes:
rev 11/05/2008No change in Maintenance in ATL.
Finance Number:
Atlanta P&DC Finance Number:
operation. Also retaining 2 employees for FMO support.
Total Craft Position Loss:
Total Proposed
Part Time On-Rolls
Full Time On-Rolls
Total On-Rolls
Staffing - Craft
Difference
Difference
Last Saved: February 19, 2012
Data Extraction Date: 09/20/11
Casuals/PSEs On-Rolls
09/20/11
Total Proposed
Data Extraction Date:
Chattanooga P&DC
Part Time On-Rolls
Full Time On-Rolls
Total On-Rolls
(This number carried forward to the Executive Summary )
Losing Facility retaining 3 custodians and 2 Building Maintenance employees for Hub
Casuals/PSEs On-Rolls
Package Page 35 AMP Staffing - Craft
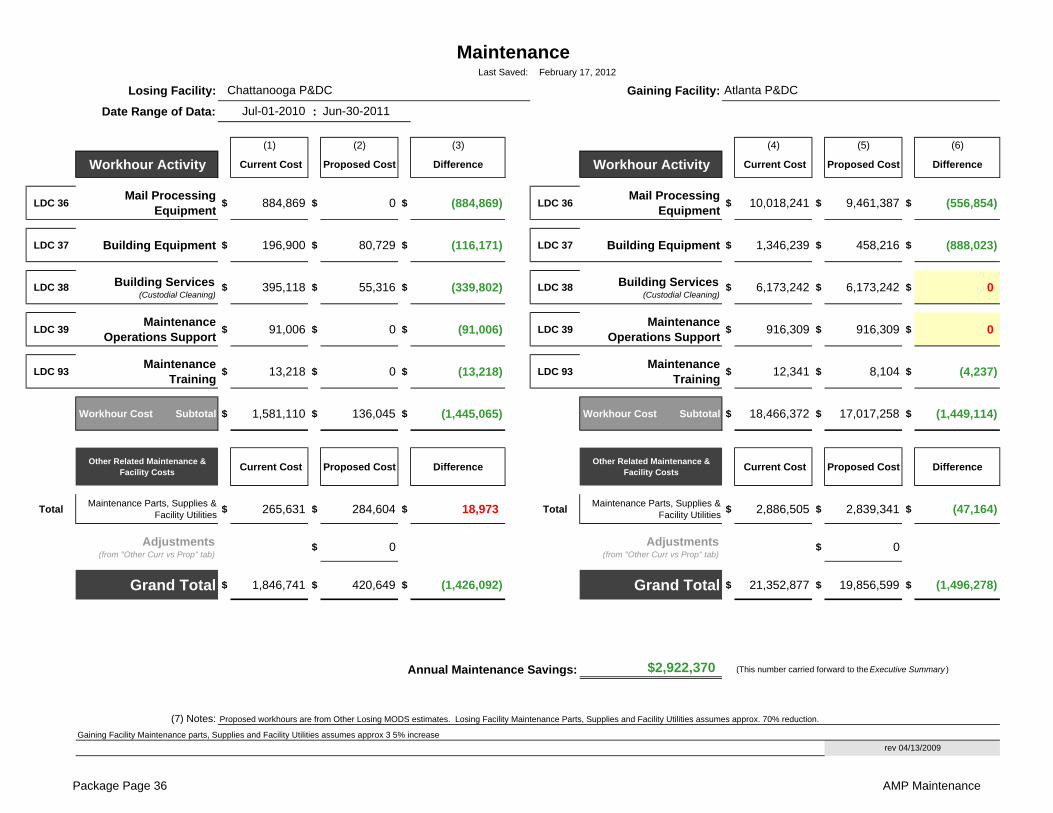
Losing Facility: Gaining Facility:
Date Range of Data: :
(1) (2) (3) (4) (5) (6)
Workhour Activity Current Cost Proposed Cost Difference Workhour Activity Current Cost Proposed Cost Difference
LDC 36Mail Processing
Equipment$ 884,869 $ 0 $ (884,869) LDC 36
Mail Processing Equipment
$ 10,018,241 $ 9,461,387 $ (556,854)
LDC 37 Building Equipment $ 196,900 $ 80,729 $ (116,171) LDC 37 Building Equipment $ 1,346,239 $ 458,216 $ (888,023)
LDC 38 Building Services (Custodial Cleaning)
$ 395,118 $ 55,316 $ (339,802) LDC 38 Building Services (Custodial Cleaning)
$ 6,173,242 $ 6,173,242 $ 0
LDC 39Maintenance
Operations Support$ 91,006 $ 0 $ (91,006) LDC 39
Maintenance Operations Support
$ 916,309 $ 916,309 $ 0
LDC 93Maintenance
Training$ 13,218 $ 0 $ (13,218) LDC 93
Maintenance Training
$ 12,341 $ 8,104 $ (4,237)
Workhour Cost Subtotal $ 1,581,110 $ 136,045 $ (1,445,065) Workhour Cost Subtotal $ 18,466,372 $ 17,017,258 $ (1,449,114)
Other Related Maintenance & Facility Costs
Current Cost Proposed Cost DifferenceOther Related Maintenance &
Facility Costs Current Cost Proposed Cost Difference
TotalMaintenance Parts, Supplies &
Facility Utilities$ 265,631 $ 284,604 $ 18,973 Total
Maintenance Parts, Supplies & Facility Utilities
$ 2,886,505 $ 2,839,341 $ (47,164)
Adjustments (from "Other Curr vs Prop" tab)
$ 0 Adjustments (from "Other Curr vs Prop" tab)
$ 0
Grand Total $ 1,846,741 $ 420,649 $ (1,426,092) Grand Total $ 21,352,877 $ 19,856,599 $ (1,496,278)
$2,922,370 (This number carried forward to the Executive Summary )
(7) Notes:
Annual Maintenance Savings:
rev 04/13/2009
Maintenance
Proposed workhours are from Other Losing MODS estimates. Losing Facility Maintenance Parts, Supplies and Facility Utilities assumes approx. 70% reduction.
Gaining Facility Maintenance parts, Supplies and Facility Utilities assumes approx 3 5% increase
Last Saved:
Chattanooga P&DC Atlanta P&DC
February 17, 2012
Jul-01-2010 Jun-30-2011
Package Page 36 AMP Maintenance
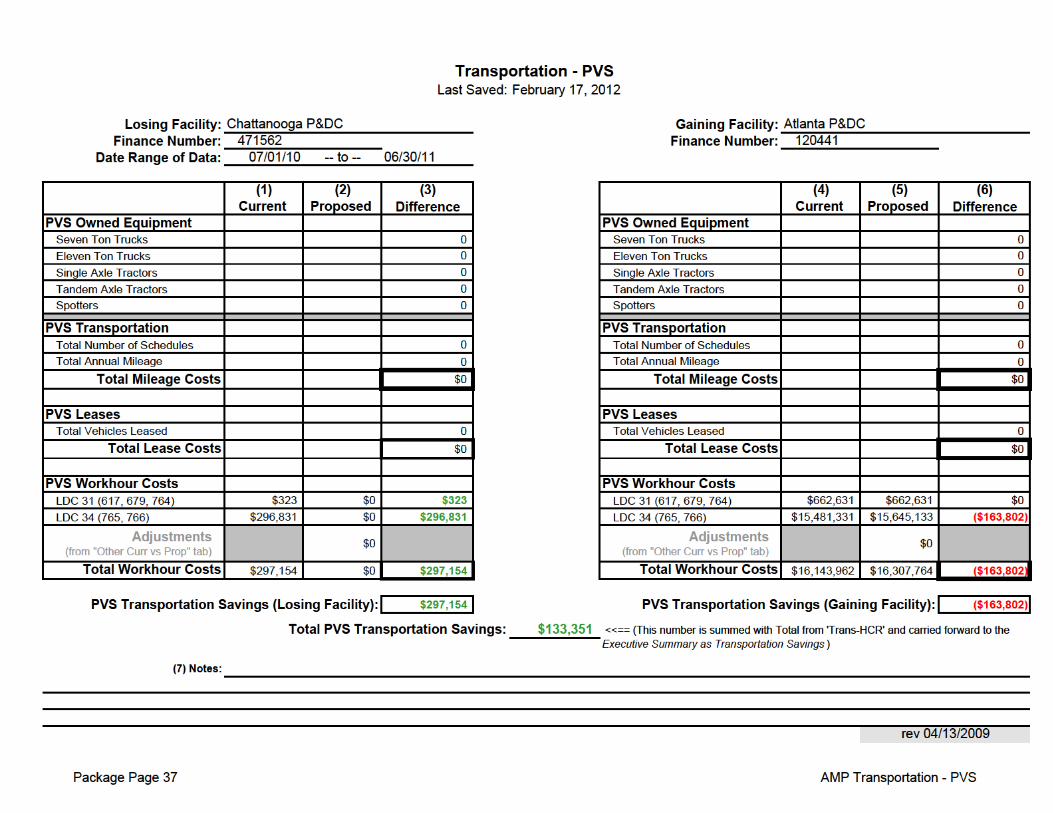
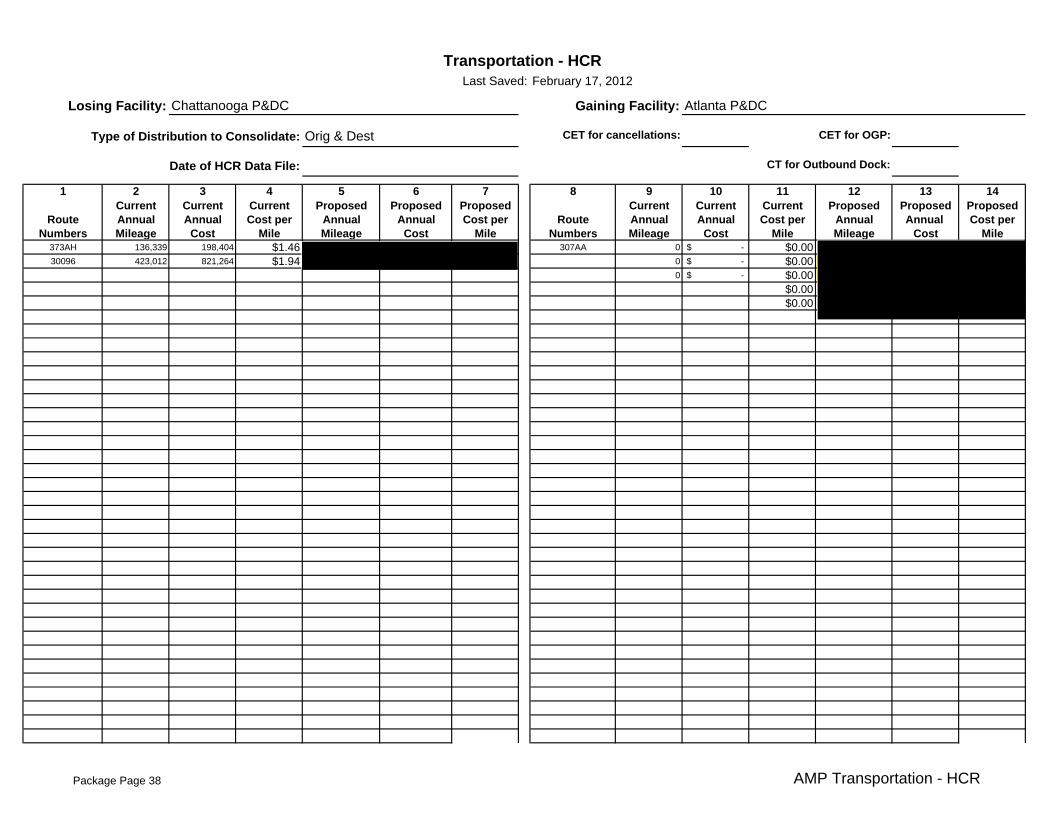
1 2 3 4 5 6 7 8 9 10 11 12 13 14Current Current Current Proposed Proposed Proposed Current Current Current Proposed Proposed Proposed
Route Annual Annual Cost per Annual Annual Cost per Route Annual Annual Cost per Annual Annual Cost perNumbers Mileage Cost Mile Mileage Cost Mile Numbers Mileage Cost Mile Mileage Cost Mile
373AH 136,339 198,404 $1.46 307AA 0 -$ $0.0030096 423,012 821,264 $1.94 0 -$ $0.00
0 -$ $0.00 $0.00 $0.00
Type of Distribution to Consolidate:
Date of HCR Data File:
CET for cancellations:
Last Saved: February 17, 2012
Losing Facility: Chattanooga P&DC Atlanta P&DCGaining Facility:
Orig & Dest CET for OGP:
CT for Outbound Dock:
Transportation - HCR
Package Page 38 AMP Transportation - HCR
1 2 3 4 5 6 7 8 9 10 11 12 13 14Current Current Current Proposed Proposed Proposed Current Current Current Proposed Proposed Proposed
Route Annual Annual Cost per Annual Annual Cost per Route Annual Annual Cost per Annual Annual Cost perNumbers Mileage Cost Mile Mileage Cost Mile Numbers Mileage Cost Mile Mileage Cost Mile
Package Page 39 AMP Transportation - HCR
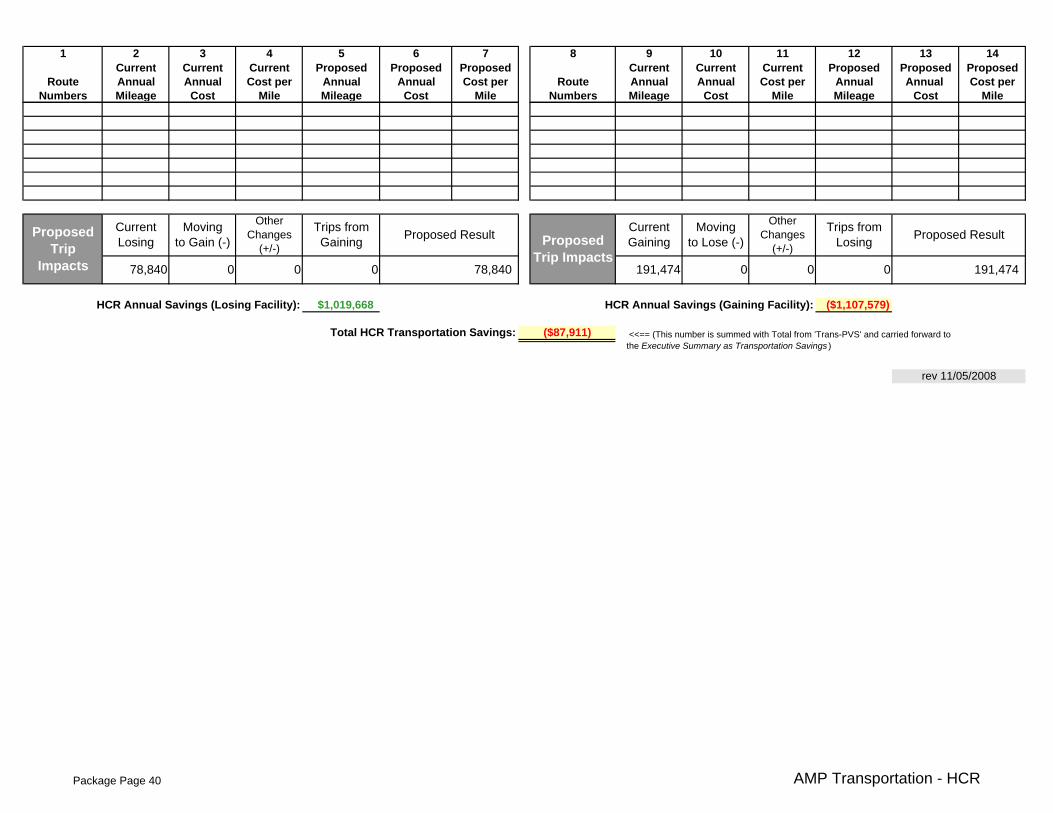
1 2 3 4 5 6 7 8 9 10 11 12 13 14Current Current Current Proposed Proposed Proposed Current Current Current Proposed Proposed Proposed
Route Annual Annual Cost per Annual Annual Cost per Route Annual Annual Cost per Annual Annual Cost perNumbers Mileage Cost Mile Mileage Cost Mile Numbers Mileage Cost Mile Mileage Cost Mile
$1,019,668 ($1,107,579)
Total HCR Transportation Savings:
Trips from Losing
0
Moving to Lose (-)
<<== (This number is summed with Total from 'Trans-PVS' and carried forward to the Executive Summary as Transportation Savings )
rev 11/05/2008
Current Gaining
($87,911)
191,4740
Proposed Result
HCR Annual Savings (Losing Facility): HCR Annual Savings (Gaining Facility):
Proposed Trip Impacts
78,840 0 0 0 0
Other Changes
(+/-)
78,840 191,474
Moving to Gain (-)
Proposed Trip
Impacts
Current Losing
Proposed ResultTrips from Gaining
Other Changes
(+/-)
Package Page 40 AMP Transportation - HCR

Orig & Dest
(1) (2)
x DMM L011 From:
x x DMM L201 Action Code* Column A - 3-Digit ZIP Code Prefix Group
DMM L601
x DMM L602
x DMM L603 To:
DMM L604 Action Code* Column A - 3-Digit ZIP Code Prefix Group
DMM L605
x DMM L606
DMM L607
x DMM L801
(3)
Action Code*
Action Code*
Action Code*
Action Code*
(4)
Count % Count % Count % Count %
Jul 373 458 88 19% 84 18% 0 0% 370 81% 4
Aug 373 481 88 18% 102 21% 0 0% 393 82% 4
Jul 301 797 235 29% 192 24% 0 0% 562 71% 48
Aug 301 815 255 31% 182 22% 0 0% 560 69% 60
(5) Notes
*Action Codes: A=add D=delete CF-change from CT=change to
Important Note: Section 2 & 3 illustrate possible changes to DMM labeling lists. Section 2 relates to consolidation of Destination Operations. Section 3 pertains to Originating Operations. The Area Distribution Network group will submit appropriate requests for DMM changes after AMP approval.
Column A - Entry ZIP Codes Column B - 3-Digit ZIP Code Destinations Column C - Label to
Column A - Entry ZIP Codes Column B - 3-Digit ZIP Code Destinations Column C - Label to
DMM L009
DMM L010
DMM L005
DMM L006
DMM L007
DMM L008
DMM L003
DMM L004
DMM L001
DMM L002
Distribution Changes
Indicate each DMM labeling list affected by placing an "X" to the left of the list.
Losing Facility:Type of Distribution to Consolidate
If revisions to DMM L005 or DMM L201 are needed, indicate proposed DMM label change below.
Last Saved: February 17, 2012
Chattanooga P&DC
DMM Labeling List L005 - 3-Digit ZIP Code Prefix Groups - SCF Sortation
Column B - Label to
*Action Codes: A=add D=delete CF-change from CT=change to
Column B - Label to
rev 5/14/2009
Drop Shipments for Destination Entry Discounts - FAST Appointment Summary Report
Month Losing/GainingNASS Code
Facility NameTotal
Schd ApptsUnschd Count
Losing Facility Chattanooga
Losing Facility Chattanooga
No-Show Late Arrival Open Closed
Gaining Facility N Metro
Gaining Facility N Metro
DMM Labeling List L201 - Periodicals Origin Split
Column A - Entry ZIP Codes Column B - 3-Digit ZIP Code Destinations Column C - Label to
Column C - Label to
Column A - Entry ZIP Codes Column B - 3-Digit ZIP Code Destinations Column C - Label to
Package Page 41 AMP Distr bution Changes
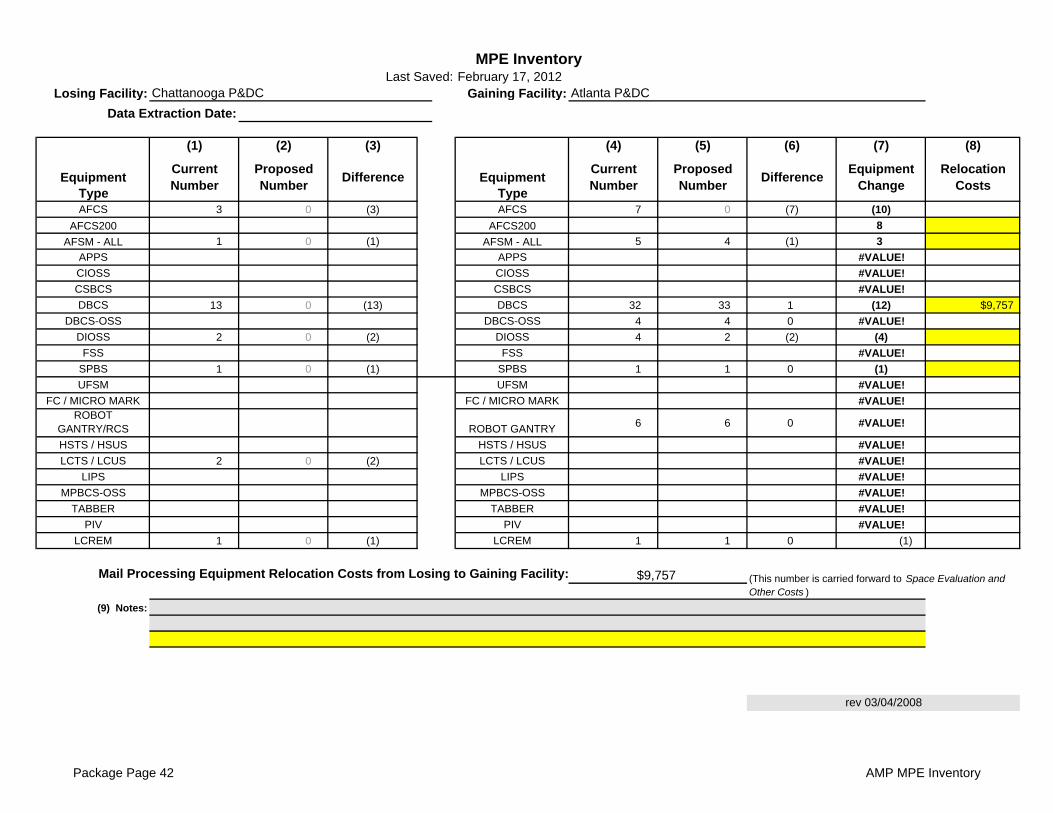
Losing Facility: Gaining Facility:
(1) (2) (3) (4) (5) (6) (7) (8)
Equipment EquipmentType TypeAFCS 3 0 (3) AFCS 7 0 (7) (10)
AFCS200 AFCS200 8
AFSM - ALL 1 0 (1) AFSM - ALL 5 4 (1) 3
APPS APPS #VALUE!
CIOSS CIOSS #VALUE!
CSBCS CSBCS #VALUE!
DBCS 13 0 (13) DBCS 32 33 1 (12) $9,757
DBCS-OSS DBCS-OSS 4 4 0 #VALUE!
DIOSS 2 0 (2) DIOSS 4 2 (2) (4)
FSS FSS #VALUE!
SPBS 1 0 (1) SPBS 1 1 0 (1)
UFSM UFSM #VALUE!
FC / MICRO MARK FC / MICRO MARK #VALUE!ROBOT
GANTRY/RCS ROBOT GANTRY 6 6 0 #VALUE!
HSTS / HSUS HSTS / HSUS #VALUE!
LCTS / LCUS 2 0 (2) LCTS / LCUS #VALUE!
LIPS LIPS #VALUE!
MPBCS-OSS MPBCS-OSS #VALUE!
TABBER TABBER #VALUE!
PIV PIV #VALUE!
LCREM 1 0 (1) LCREM 1 1 0 (1)
(9) Notes:
rev 03/04/2008
(This number is carried forward to Space Evaluation and Other Costs )
Proposed Number
Difference
Mail Processing Equipment Relocation Costs from Losing to Gaining Facility: $9,757
MPE Inventory
Chattanooga P&DC Atlanta P&DC
Current Number
DifferenceEquipment
ChangeRelocation
Costs
Last Saved:
Current Number
Data Extraction Date:
Proposed Number
February 17, 2012
Package Page 42 AMP MPE Inventory
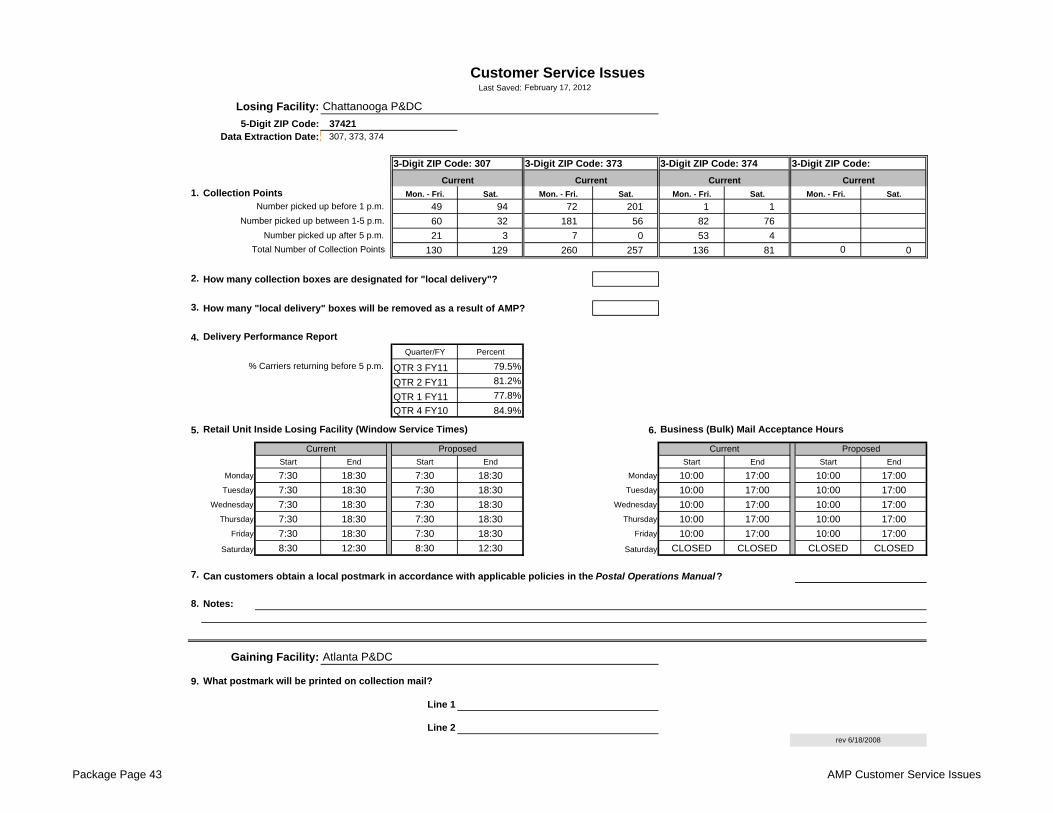
Last Saved:
3-Digit ZIP Code: 373 3-Digit ZIP Code: 374
1. Collection Points Mon. - Fri. Sat. Mon. - Fri. Sat. Mon. - Fri. Sat. Sat.
49 94 72 201 1 1
60 32 181 56 82 76
21 3 7 0 53 4
130 129 260 257 136 81 0
2. How many collection boxes are designated for "local delivery"?
3. How many "local delivery" boxes will be removed as a result of AMP?
4.
Quarter/FY Percent
QTR 3 FY11 79.5%
QTR 2 FY11 81.2%
QTR 1 FY11 77.8%
QTR 4 FY10 84.9%
5. 6.
Start End Start End Start End Start End
Monday 7:30 18:30 7:30 18:30 Monday 10:00 17:00 10:00 17:00
Tuesday 7:30 18:30 7:30 18:30 Tuesday 10:00 17:00 10:00 17:00
Wednesday 7:30 18:30 7:30 18:30 Wednesday 10:00 17:00 10:00 17:00
Thursday 7:30 18:30 7:30 18:30 Thursday 10:00 17:00 10:00 17:00
Friday 7:30 18:30 7:30 18:30 Friday 10:00 17:00 10:00 17:00
Saturday 8:30 12:30 8:30 12:30 Saturday CLOSED CLOSED CLOSED CLOSED
7.
8. Notes:
9.
Line 1
Line 2
February 17, 2012
Chattanooga P&DC
307, 373, 374
Current CurrentCurrent
Current
3-Digit ZIP Code:
Current
rev 6/18/2008
37421
Can customers obtain a local postmark in accordance with applicable policies in the Postal Operations Manual?
Gaining Facility:
What postmark will be printed on collection mail?
Proposed
% Carriers returning before 5 p.m.
Mon. - Fri.
Customer Service Issues
Current Proposed
Number picked up after 5 p.m.
Number picked up between 1-5 p.m.
Total Number of Collection Points
Delivery Performance Report
Retail Unit Inside Losing Facility (Window Service Times)
Losing Facility:
5-Digit ZIP Code:Data Extraction Date:
3-Digit ZIP Code: 307
Number picked up before 1 p.m.
Business (Bulk) Mail Acceptance Hours
Atlanta P&DC
0
Package Page 43 AMP Customer Service Issues
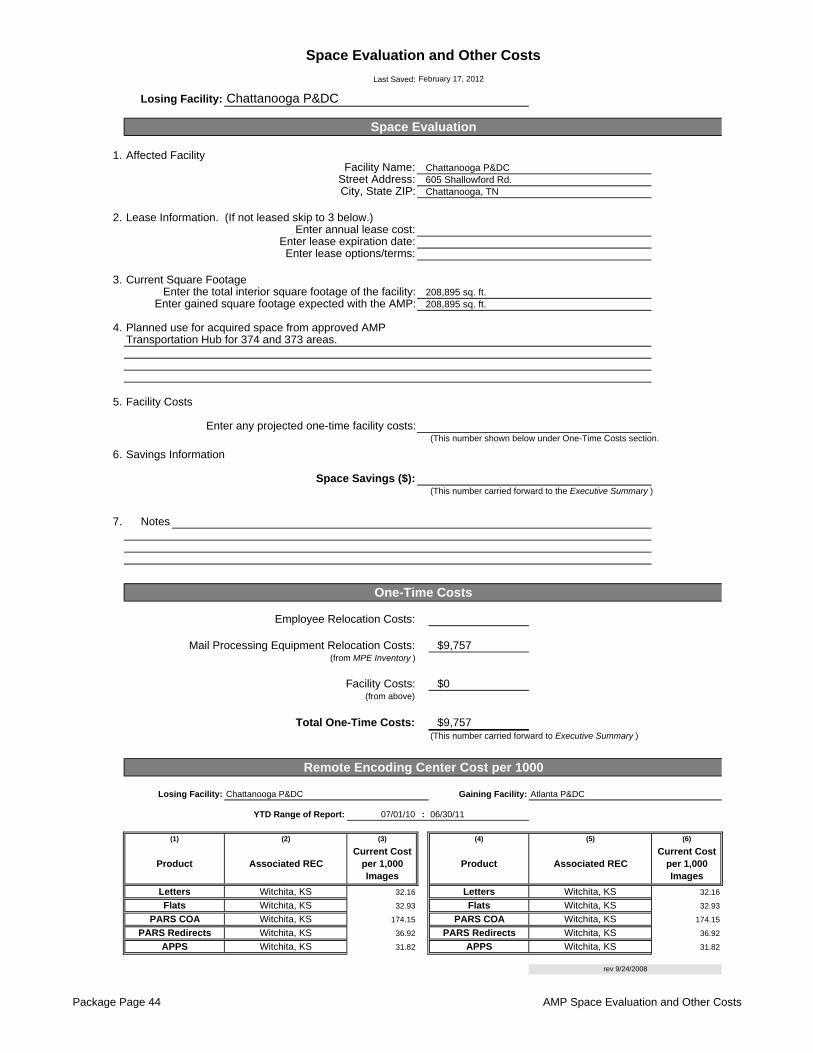
Last Saved:
1.
2. Lease Information. (If not leased skip to 3 below.)
3.
4. Planned use for acquired space from approved AMP
5. Facility Costs
(This number shown below under One-Time Costs section.
6. Savings Information
(This number carried forward to the Executive Summary )
7. Notes
(This number carried forward to Executive Summary )
07/01/10 :
(3) (6)
32.16 32.16
32.93 32.93
174.15 174.15
36.92 36.92
31.82 31.82
$0
$9,757
605 Shallowford Rd.Chattanooga, TN
Facility Costs:
rev 9/24/2008
Chattanooga P&DC Atlanta P&DC
06/30/11YTD Range of Report:
Witchita, KS
APPS Witchita, KS
Witchita, KS
Witchita, KS
Space Evaluation and Other Costs
Street Address:City, State ZIP:
Losing Facility:
Space Evaluation
Affected FacilityFacility Name:
February 17, 2012
Chattanooga P&DC
Chattanooga P&DC
Mail Processing Equipment Relocation Costs: (from MPE Inventory )
Space Savings ($):
One-Time Costs
Employee Relocation Costs:
$9,757
Letters
Gaining Facility:
Current Cost per 1,000 Images
Losing Facility:
(1)
Product
(2)
Witchita, KS
Associated REC
208,895 sq. ft.208,895 sq. ft.
Transportation Hub for 374 and 373 areas.
Enter any projected one-time facility costs:
Witchita, KS
Witchita, KS
Enter annual lease cost:
Enter the total interior square footage of the facility:Enter gained square footage expected with the AMP:
Enter lease options/terms:
Current Square Footage
Enter lease expiration date:
(from above)
(5)
Product Associated REC
(4)
Witchita, KSPARS Redirects
Total One-Time Costs:
Remote Encoding Center Cost per 1000
Current Cost per 1,000 Images
Flats
PARS COA
Flats
Letters
PARS COA
APPS Witchita, KS
Witchita, KS PARS Redirects
Package Page 44 AMP Space Evaluation and Other Costs