Embed Size (px)
Citation preview

2017 Edition
Our g�u�e view of your �tu� ��gy
www.cepsaenergyoutlook.com
2017
CEPS
A EN
ERGY
OUT
LOOK
203
0
Executive summary
Cepsa’s view of the global energy mix for the future Cepsa Energy Outlook 2030 is the energy
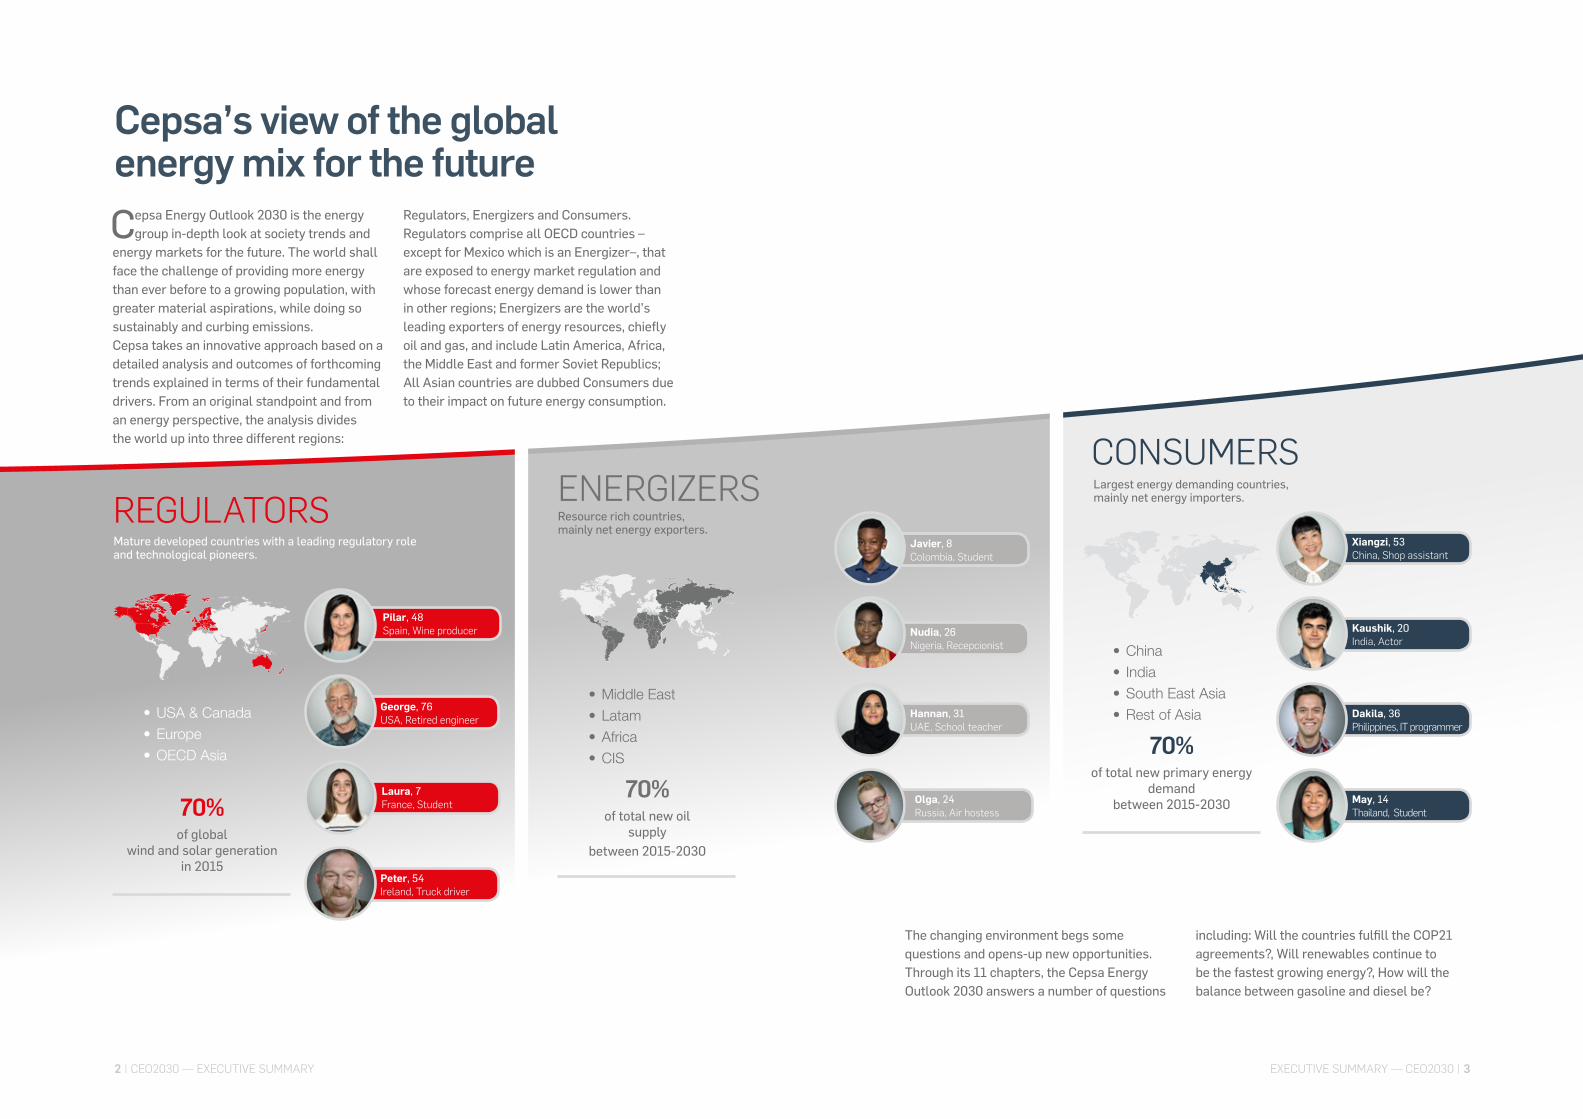
group in-depth look at society trends and energy markets for the future. The world shall face the challenge of providing more energy than ever before to a growing population, with greater material aspirations, while doing so sustainably and curbing emissions.Cepsa takes an innovative approach based on a detailed analysis and outcomes of forthcoming trends explained in terms of their fundamental drivers. From an original standpoint and from an energy perspective, the analysis divides the world up into three different regions:
Regulators, Energizers and Consumers.Regulators comprise all OECD countries –except for Mexico which is an Energizer–, that are exposed to energy market regulation and whose forecast energy demand is lower than in other regions; Energizers are the world’s leading exporters of energy resources, chiefly oil and gas, and include Latin America, Africa, the Middle East and former Soviet Republics; All Asian countries are dubbed Consumers due to their impact on future energy consumption.
• China• India• South East Asia• Rest of Asia
of total new primary energy demand
between 2015-2030
70%
Kaushik, 20India, Actor
Xiangzi, 53China, Shop assistant
Dakila, 36Philippines, IT programmer
May, 14Thailand, Student
• Middle East• Latam• Africa• CIS
of total new oil supply
between 2015-2030
70%
Javier, 8Colombia, Student
Nudia, 26Nigeria, Recepcionist
Olga, 24Russia, Air hostess
Hannan, 31UAE, School teacher
CONSUMERSLargest energy demanding countries, mainly net energy importers.
• USA & Canada• Europe • OECD Asia
of global wind and solar generation
in 2015
70%
Pilar, 48Spain, Wine producer
Peter, 54Ireland, Truck driver
George, 76USA, Retired engineer
Laura, 7France, Student
REGULATORS ENERGIZERSMature developed countries with a leading regulatory role and technological pioneers.
Resource rich countries,mainly net energy exporters.
The changing environment begs some questions and opens-up new opportunities. Through its 11 chapters, the Cepsa Energy Outlook 2030 answers a number of questions
including: Will the countries fulfill the COP21 agreements?, Will renewables continue to be the fastest growing energy?, How will the balance between gasoline and diesel be?
EXECUTIVE SUMMARY — CEO2030 | 32 | CEO2030 — EXECUTIVE SUMMARY
POPULATION & ECONOMY
More for all
The world’s GDP will increase by 50% between now and 2030, although the
growth rate will slow down when compared with previous years, in step with the population. The economic shift toward the East will be consolidated in the years ahead as population
giants China and India lead global GDP growth.The middle classes will grow strongly, particularly in Asia, supporting similar levels of economic growth as seen in the last 15 years. The rise of this strong middle class will be the most relevant socio-economic factor affecting energy consumption in the years ahead.
1
As middle class incomes increase and trigger economic development, they will have a knock-on effect on demand“
TECHNOLOGY
The game changer
New technologies such as big data and the Internet of Things will speed up change
by finding new ways to save energy and boost productivity, as well as revolutionize the way business is done. Technological advances will enhance efficiency, anticipate customer needs and enable them to interact with suppliers. All these innovations will allow users to consume energy smartly.Technological advances in renewable energy in the form of cost reductions along with favorable policy support will have great impact
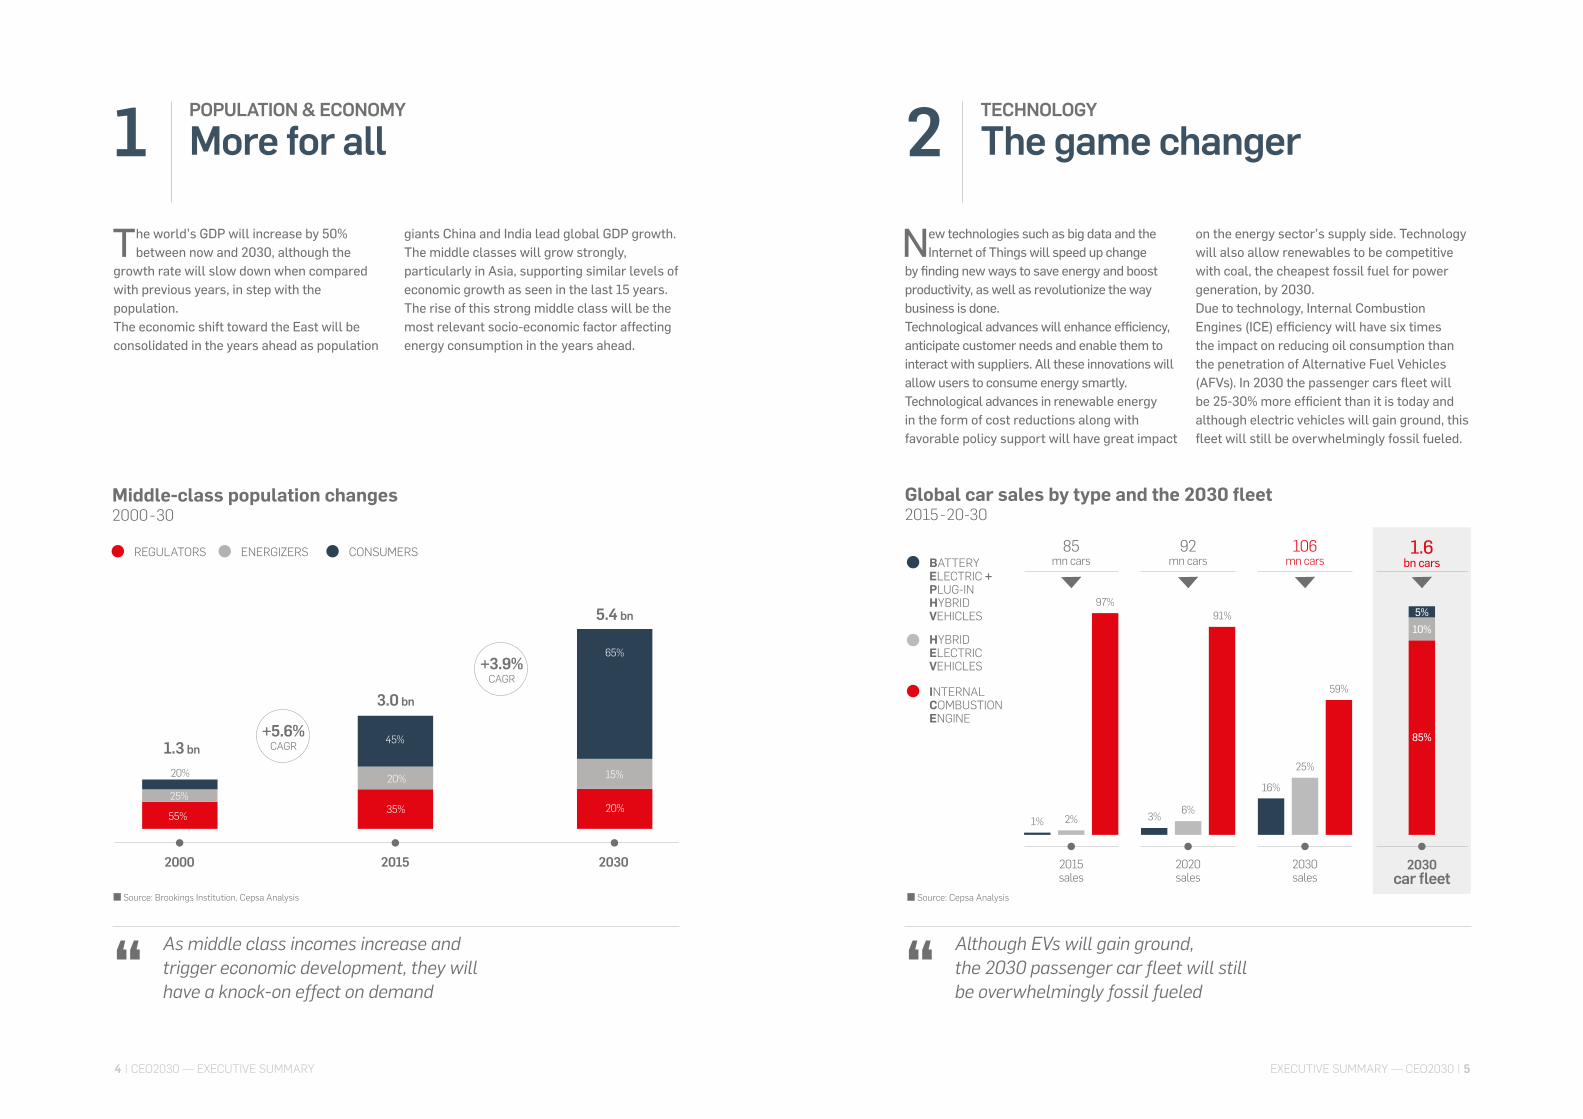
on the energy sector’s supply side. Technology will also allow renewables to be competitive with coal, the cheapest fossil fuel for power generation, by 2030.Due to technology, Internal Combustion Engines (ICE) efficiency will have six times the impact on reducing oil consumption than the penetration of Alternative Fuel Vehicles (AFVs). In 2030 the passenger cars fleet will be 25-30% more efficient than it is today and although electric vehicles will gain ground, this fleet will still be overwhelmingly fossil fueled.
2
Global car sales by type and the 2030 fleet2015-20-30
BATTERY ELECTRIC + PLUG-IN HYBRID VEHICLES
HYBRID ELECTRIC VEHICLES
INTERNAL COMBUSTION ENGINE
3% 6%
91%
1% 2%
97%
92 mn cars
16%
25%
59%
5%10%
85%
106 mn cars
2020sales
2030car fleet
2030sales
85 mn cars
1.6 bn cars
■ Source: Cepsa Analysis
2015sales
Although EVs will gain ground, the 2030 passenger car fleet will still be overwhelmingly fossil fueled“
55%
25%
20%
35%
20%
45%
20%
15%
65%
20152000 2030
3.0 bn
1.3 bn
5.4 bn
Middle-class population changes2000-30
REGULATORS ENERGIZERS CONSUMERS
■ Source: Brookings Institution, Cepsa Analysis
+5.6%CAGR
+3.9%CAGR
EXECUTIVE SUMMARY — CEO2030 | 54 | CEO2030 — EXECUTIVE SUMMARY
MOBILITY
A smart move
Accelerating future trends will be the vast numbers of people crowding into cities,
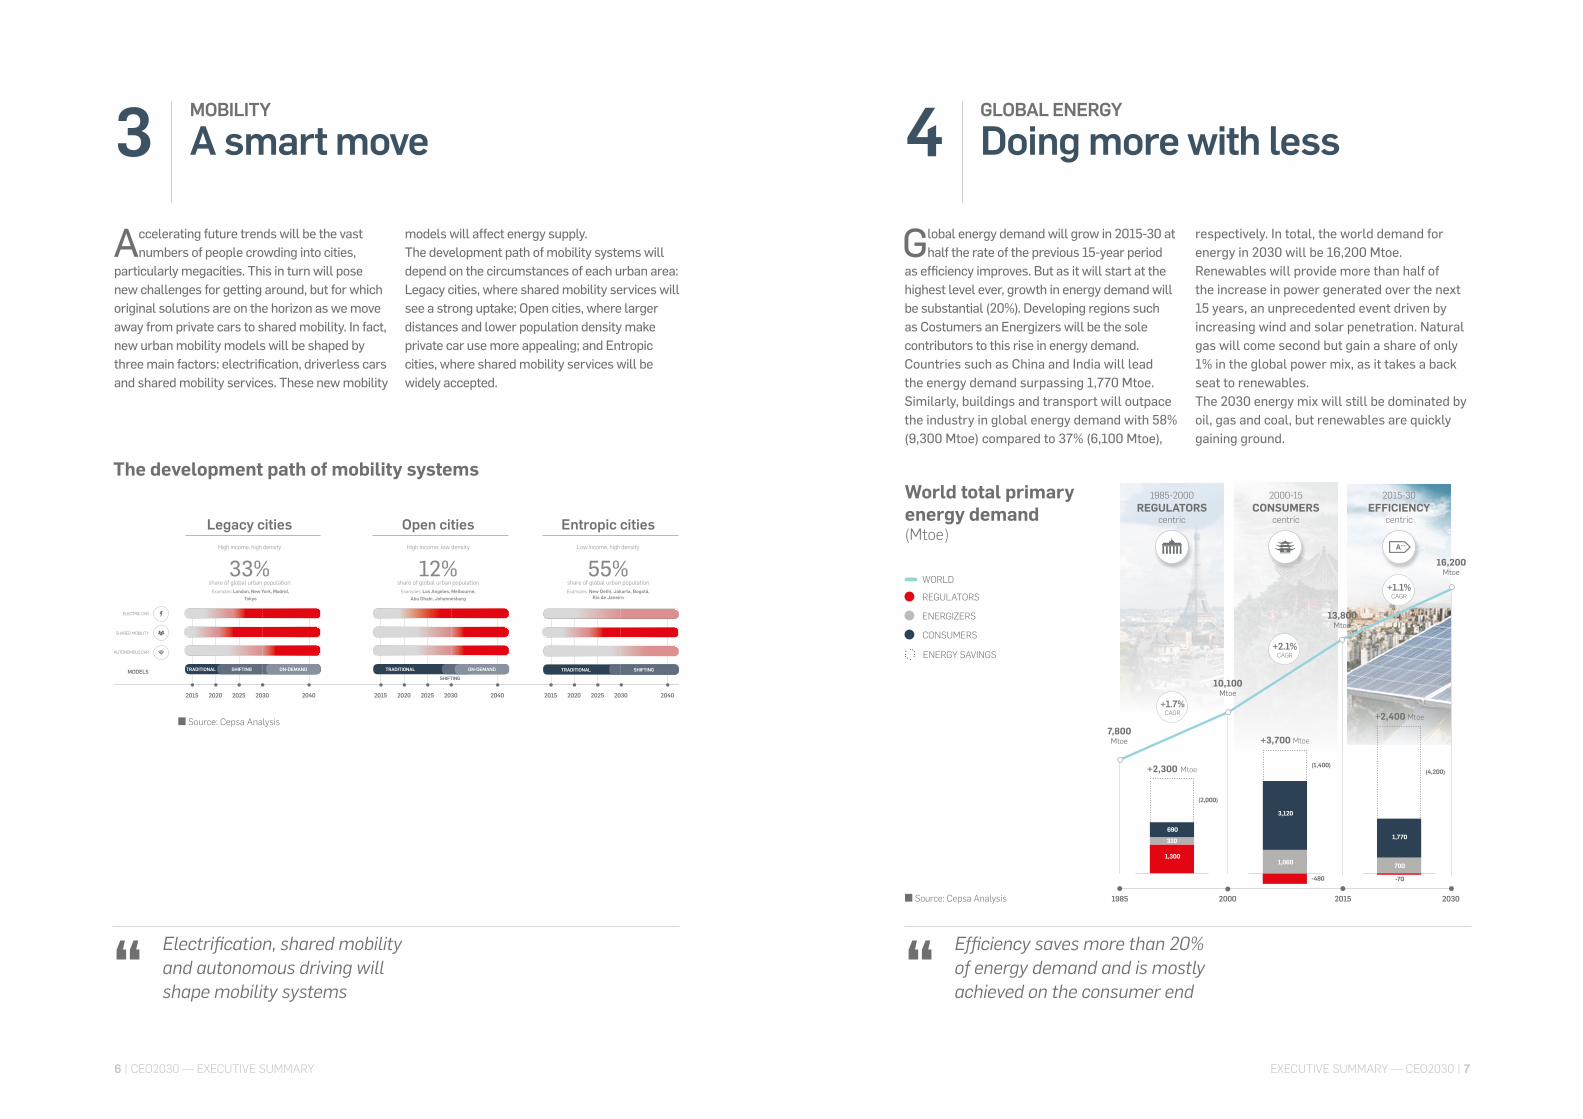
particularly megacities. This in turn will pose new challenges for getting around, but for which original solutions are on the horizon as we move away from private cars to shared mobility. In fact, new urban mobility models will be shaped by three main factors: electrification, driverless cars and shared mobility services. These new mobility
models will affect energy supply.The development path of mobility systems will depend on the circumstances of each urban area: Legacy cities, where shared mobility services will see a strong uptake; Open cities, where larger distances and lower population density make private car use more appealing; and Entropic cities, where shared mobility services will be widely accepted.
3
Electrification, shared mobility and autonomous driving will shape mobility systems“
GLOBAL ENERGY
Doing more with less
Global energy demand will grow in 2015-30 at half the rate of the previous 15-year period
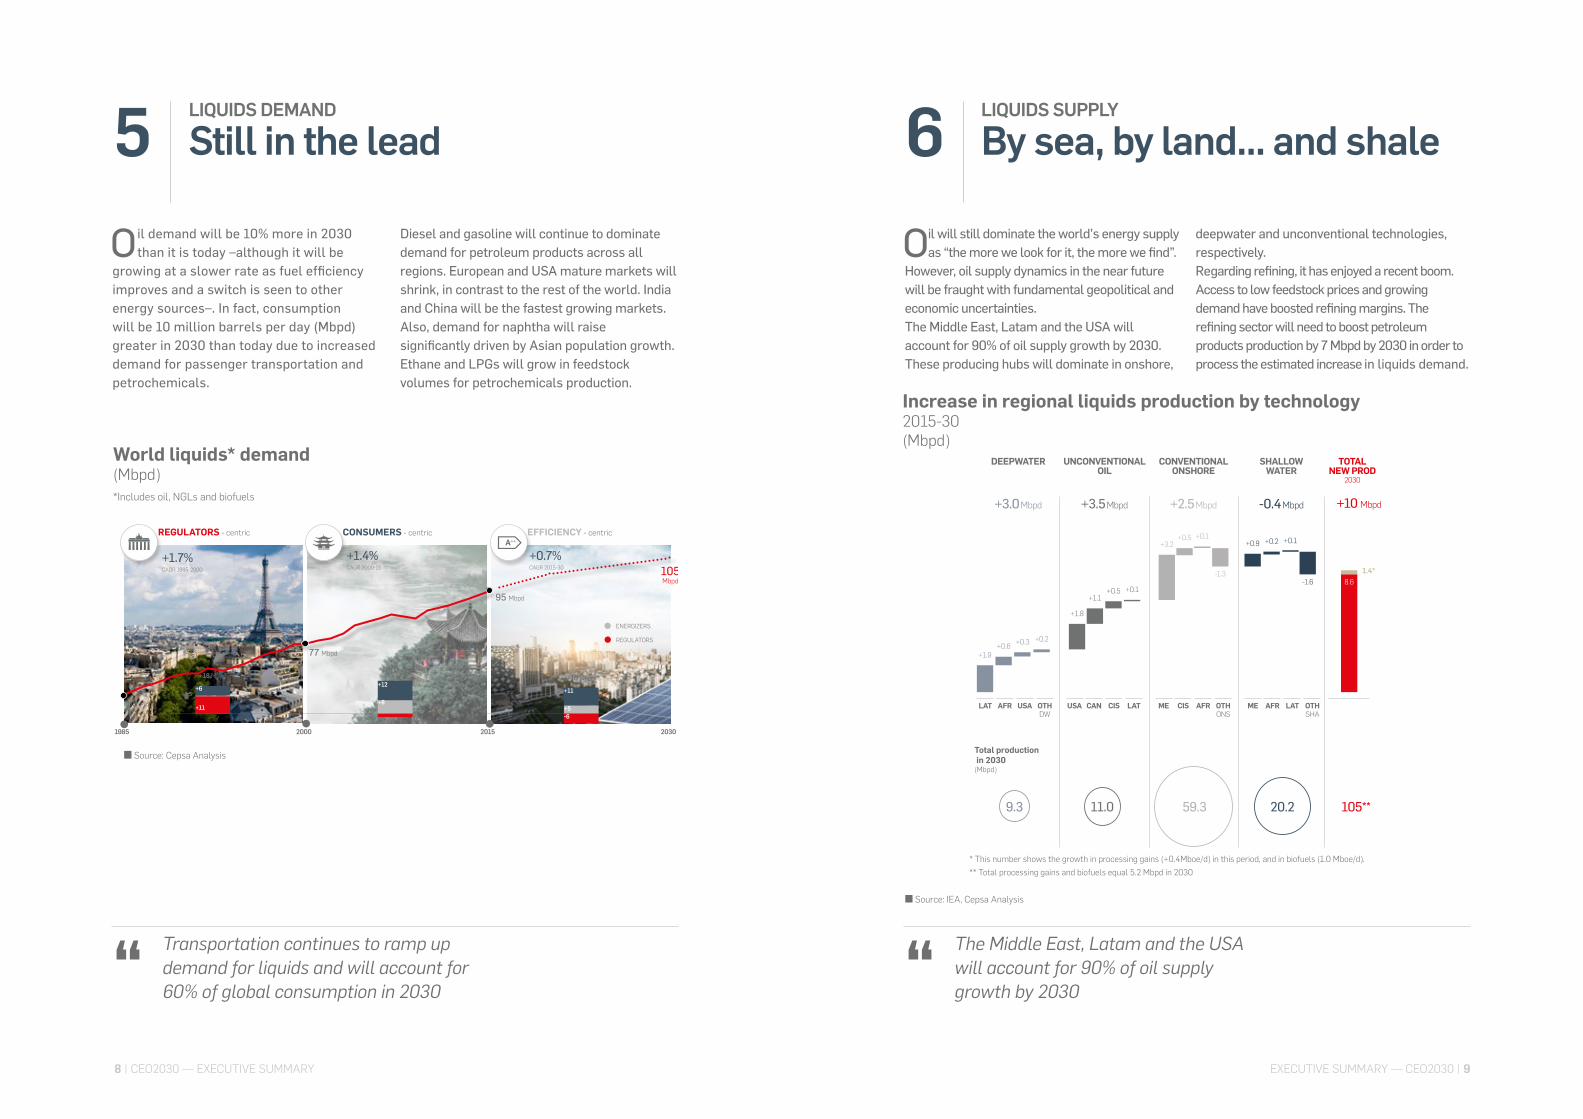
as efficiency improves. But as it will start at the highest level ever, growth in energy demand will be substantial (20%). Developing regions such as Costumers an Energizers will be the sole contributors to this rise in energy demand. Countries such as China and India will lead the energy demand surpassing 1,770 Mtoe. Similarly, buildings and transport will outpace the industry in global energy demand with 58% (9,300 Mtoe) compared to 37% (6,100 Mtoe),
respectively. In total, the world demand for energy in 2030 will be 16,200 Mtoe.Renewables will provide more than half of the increase in power generated over the next 15 years, an unprecedented event driven by increasing wind and solar penetration. Natural gas will come second but gain a share of only 1% in the global power mix, as it takes a back seat to renewables. The 2030 energy mix will still be dominated by oil, gas and coal, but renewables are quickly gaining ground.
4
Efficiency saves more than 20% of energy demand and is mostly achieved on the consumer end“
Open cities Entropic citiesHigh income, low density
12%share of global urban population
Examples: Los Angeles, Melbourne, Abu Dhabi, Johannesburg
Low income, high density
55%share of global urban populationExamples: New Delhi, Jakarta, Bogotá,
Rio de Janeiro
2015 2020 2025 2030 2040
SHIFTINGTRADITIONAL
2015 2020 2025 2030 2040
TRADITIONAL ON-DEMAND
SHIFTING
Legacy citiesHigh income, high density
33%share of global urban population
Examples: London, New York, Madrid, Tokyo
2015 2020 2025 2030 2040
TRADITIONAL SHIFTING ON-DEMANDMODELS
ELECTRIC CAR
SHARED MOBILITY
AUTONOMOUS CAR
■ Source: Cepsa Analysis
World total primaryenergy demand(Mtoe)
The development path of mobility systems
■ Source: Cepsa Analysis
1985-2000REGULATORS
centric
2000-15CONSUMERS
centric
2015-30EFFICIENCY
centric
1985
1,300
690
310
(2,000)
-480
1,060
1,770
-70
700
(4,200)
REGULATORS CONSUMERSENERGIZERS ENERGY SAVINGS
+2,400 Mtoe
(1,400)
+3,700 Mtoe
+2,300 Mtoe
2000 2015 2030
10,100 Mtoe
+2.1% CAGR
+1.7% CAGR
+1.1% CAGR
13,800 Mtoe
16,200 Mtoe
7,800 Mtoe
WORLD
3,120
WORLD
■ Source: Cepsa Analysis
REGULATORS
CONSUMERS
ENERGIZERS
ENERGY SAVINGS
■ Source: Cepsa Analysis
EXECUTIVE SUMMARY — CEO2030 | 76 | CEO2030 — EXECUTIVE SUMMARY
LIQUIDS DEMAND
Still in the lead
Oil demand will be 10% more in 2030 than it is today –although it will be
growing at a slower rate as fuel efficiency improves and a switch is seen to other energy sources–. In fact, consumption will be 10 million barrels per day (Mbpd) greater in 2030 than today due to increased demand for passenger transportation and petrochemicals.
Diesel and gasoline will continue to dominate demand for petroleum products across all regions. European and USA mature markets will shrink, in contrast to the rest of the world. India and China will be the fastest growing markets. Also, demand for naphtha will raise significantly driven by Asian population growth. Ethane and LPGs will grow in feedstock volumes for petrochemicals production.
5
Transportation continues to ramp up demand for liquids and will account for 60% of global consumption in 2030“
LIQUIDS SUPPLY
By sea, by land... and shale6
The Middle East, Latam and the USA will account for 90% of oil supply growth by 2030“
Oil will still dominate the world’s energy supply as “the more we look for it, the more we find”.
However, oil supply dynamics in the near future will be fraught with fundamental geopolitical and economic uncertainties. The Middle East, Latam and the USA will account for 90% of oil supply growth by 2030. These producing hubs will dominate in onshore,
deepwater and unconventional technologies, respectively. Regarding refining, it has enjoyed a recent boom. Access to low feedstock prices and growing demand have boosted refining margins. The refining sector will need to boost petroleum products production by 7 Mbpd by 2030 in order to process the estimated increase in liquids demand.
World liquids* demand(Mbpd)*Includes oil, NGLs and biofuels
CONSUMERS
REGULATORS
ENERGIZERS
1985 2000
REGULATORS - centric
59 Mbpd
77 Mbpd
2015 2030
CONSUMERS - centric EFFICIENCY - centric
95 Mbpd
105Mbpd
+6+0.5
+18 Mbpd +18 Mbpd+10 Mbpd
+11+8
+12
-2+5
+11
-6
■ Source: Cepsa Analysis
+1.7% CAGR 1985-2000
+1.4% CAGR 2000-15
+0.7% CAGR 2015-30
Increase in regional liquids production by technology 2015-30(Mbpd)
* This number shows the growth in processing gains (+0.4Mboe/d) in this period, and in biofuels (1.0 Mboe/d).** Total processing gains and biofuels equal 5.2 Mbpd in 2030
■ Source: IEA, Cepsa Analysis
■ Source: Cepsa Analysis
LAT AFR USA OTHDW
USA CAN CIS LAT ME CIS AFR OTHONS
ME AFR LAT OTHSHA
TOTAL NEW PROD
2030
DEEPWATER UNCONVENTIONALOIL
CONVENTIONAL ONSHORE
SHALLOWWATER
+3.0Mbpd +3.5Mbpd +2.5Mbpd -0.4Mbpd +10 Mbpd
+1.9+0.6 +0.3 +0.2
+1.8
+1.1+0.5 +0.1
+3.2+0.5 +0.1
-1.3
+0.9 +0.2 +0.1
-1.61.4*
8.6
Total production in 2030(Mbpd)
105**59.3 20.211.09.3
EXECUTIVE SUMMARY — CEO2030 | 98 | CEO2030 — EXECUTIVE SUMMARY
GAS
A volatile transition
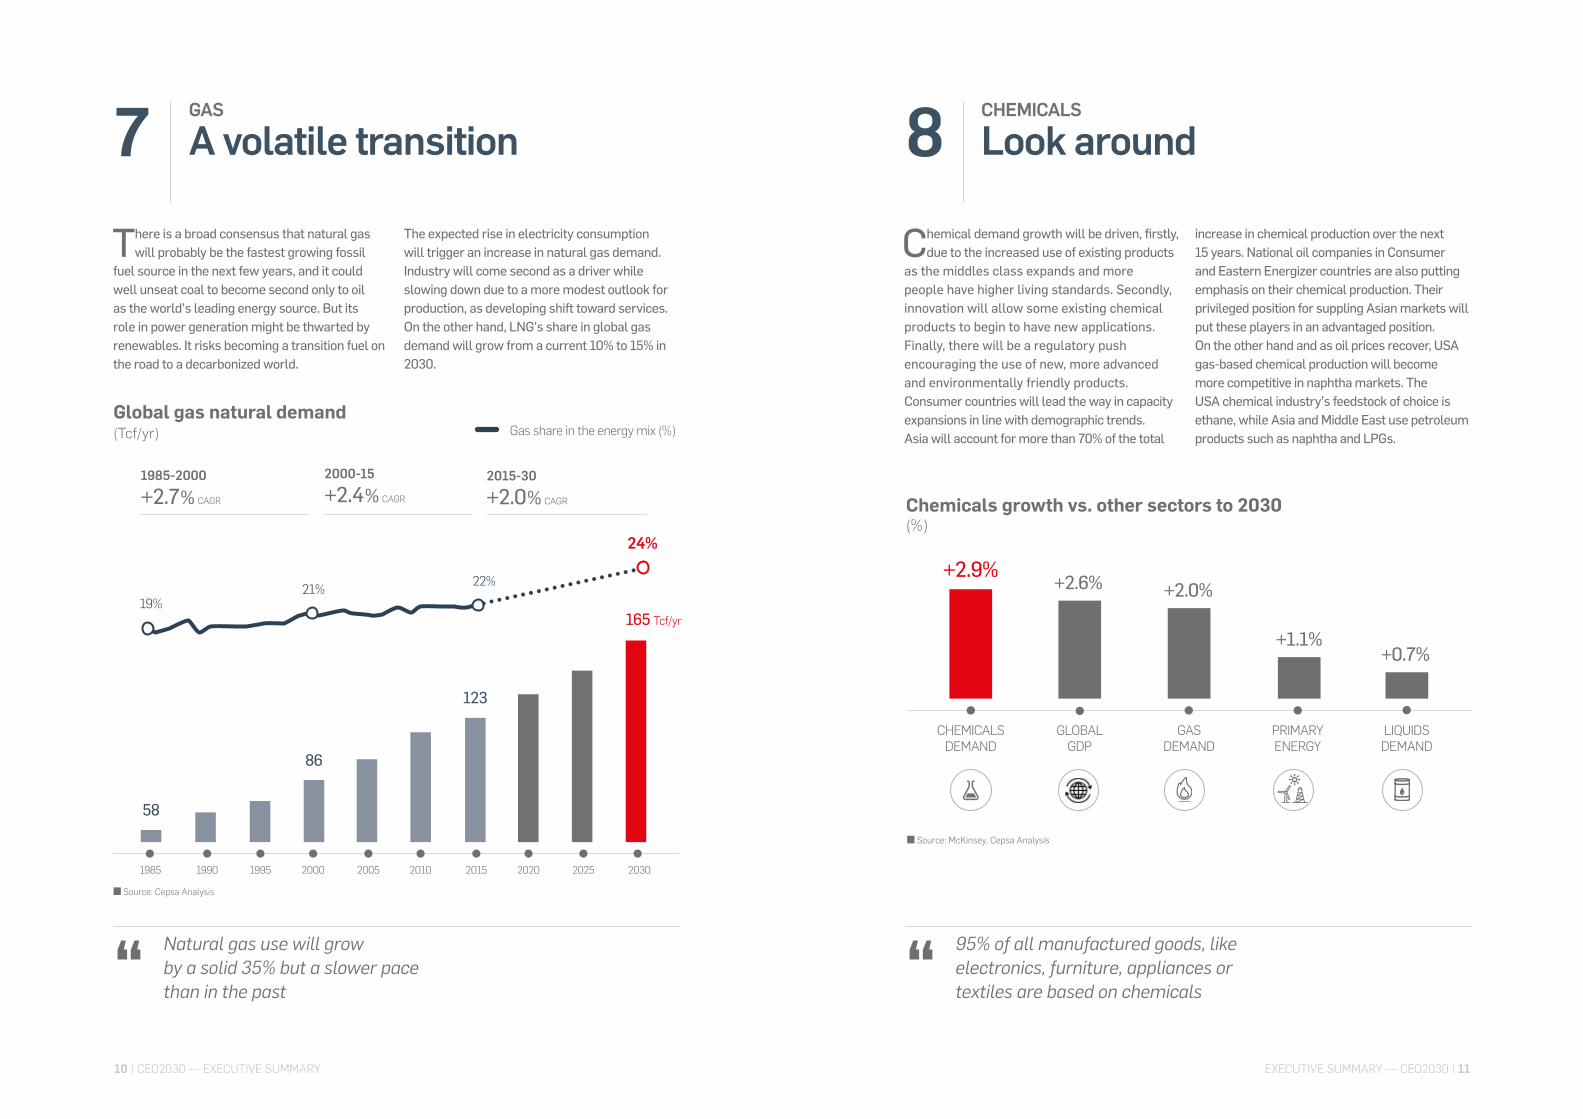
There is a broad consensus that natural gas will probably be the fastest growing fossil
fuel source in the next few years, and it could well unseat coal to become second only to oil as the world’s leading energy source. But its role in power generation might be thwarted by renewables. It risks becoming a transition fuel on the road to a decarbonized world.
The expected rise in electricity consumption will trigger an increase in natural gas demand. Industry will come second as a driver while slowing down due to a more modest outlook for production, as developing shift toward services. On the other hand, LNG’s share in global gas demand will grow from a current 10% to 15% in 2030.
7
Natural gas use will grow by a solid 35% but a slower pace than in the past“
CHEMICALS
Look around8
95% of all manufactured goods, like electronics, furniture, appliances or textiles are based on chemicals“
Chemical demand growth will be driven, firstly, due to the increased use of existing products
as the middles class expands and more people have higher living standards. Secondly, innovation will allow some existing chemical products to begin to have new applications. Finally, there will be a regulatory push encouraging the use of new, more advanced and environmentally friendly products.Consumer countries will lead the way in capacity expansions in line with demographic trends. Asia will account for more than 70% of the total
increase in chemical production over the next 15 years. National oil companies in Consumer and Eastern Energizer countries are also putting emphasis on their chemical production. Their privileged position for suppling Asian markets will put these players in an advantaged position.On the other hand and as oil prices recover, USA gas-based chemical production will become more competitive in naphtha markets. The USA chemical industry’s feedstock of choice is ethane, while Asia and Middle East use petroleum products such as naphtha and LPGs.
58
86
123
1985 1990 1995 2000 2005 2010 2015 2020 20302025
165 Tcf/yr
Global gas natural demand(Tcf/yr)
1985-2000
+2.7% CAGR
2000-15
+2.4% CAGR
2015-30
+2.0% CAGR
Gas share in the energy mix (%)
19%21% 22%
24%
■ Source: Cepsa Analysis
Chemicals growth vs. other sectors to 2030(%)
CHEMICALSDEMAND
+2.9%
GLOBALGDP
GASDEMAND
PRIMARYENERGY
LIQUIDSDEMAND
+2.6% +2.0%
+1.1%+0.7%
■ Source: McKinsey, Cepsa Analysis
EXECUTIVE SUMMARY — CEO2030 | 1110 | CEO2030 — EXECUTIVE SUMMARY
EMISSIONS
A crucial balancing act
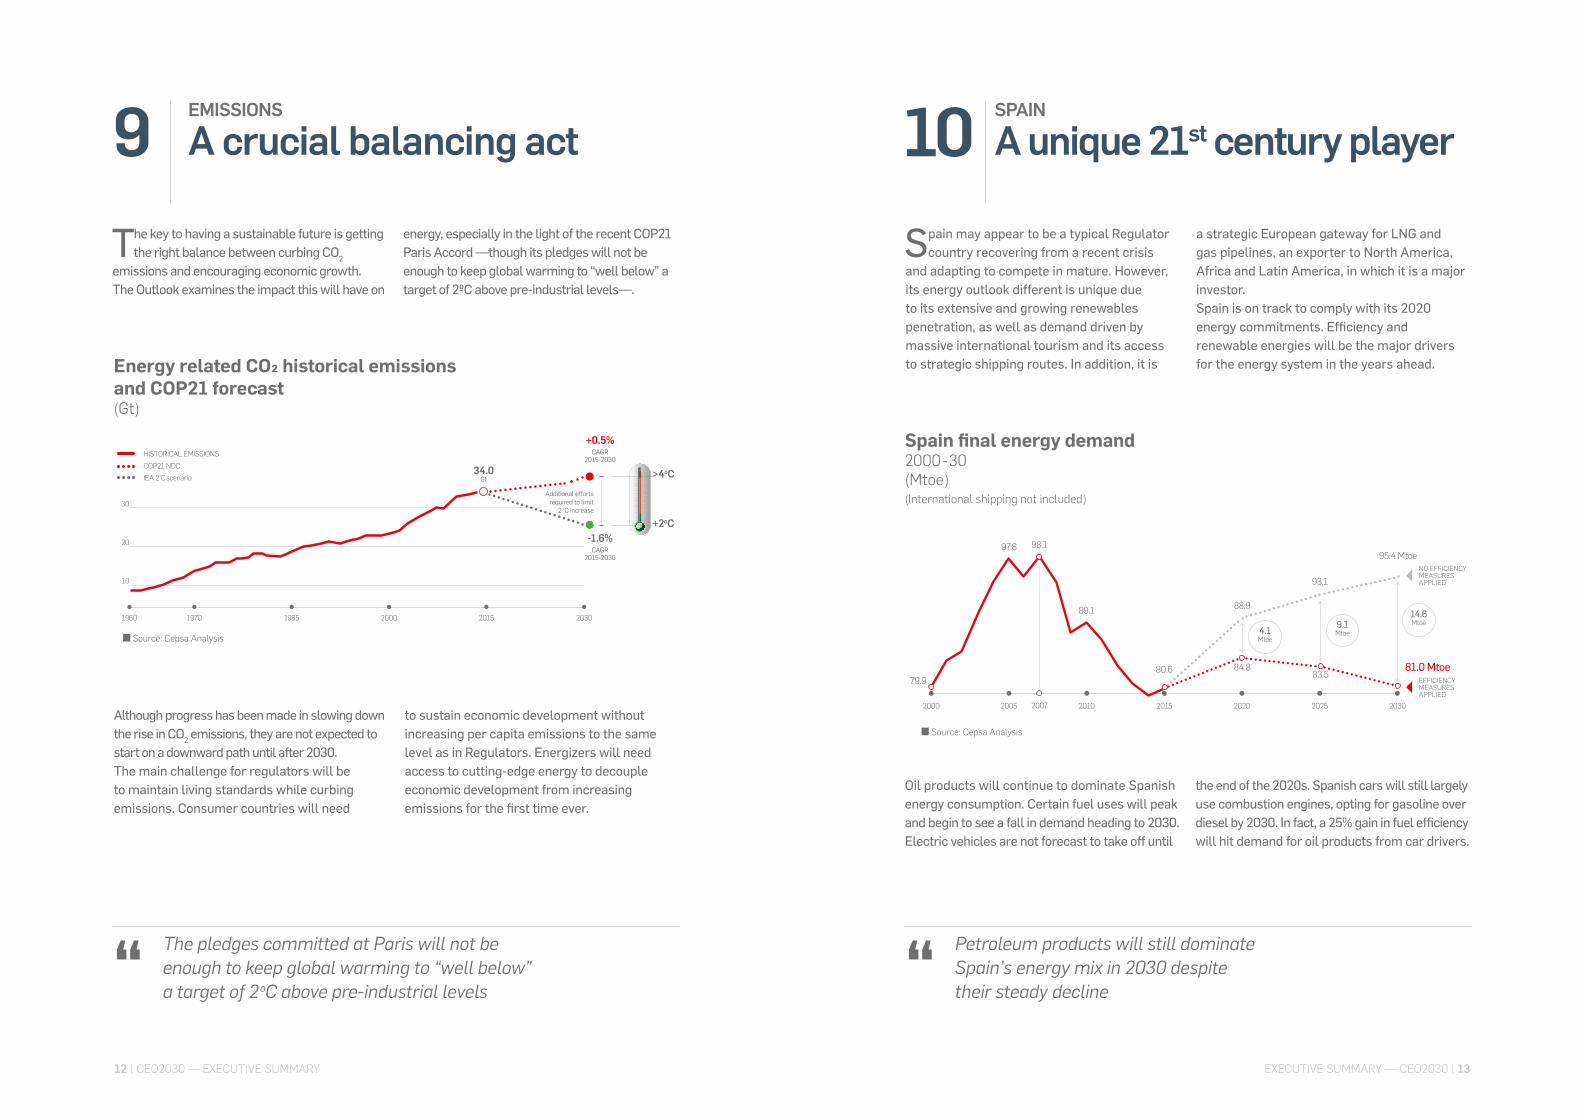
The key to having a sustainable future is getting the right balance between curbing CO2
emissions and encouraging economic growth. The Outlook examines the impact this will have on
energy, especially in the light of the recent COP21 Paris Accord —though its pledges will not be enough to keep global warming to “well below” a target of 2ºC above pre-industrial levels—.
9
The pledges committed at Paris will not be enough to keep global warming to “well below” a target of 2oC above pre-industrial levels“
SPAIN
A unique 21st century player10
Petroleum products will still dominate Spain’s energy mix in 2030 despite their steady decline“
Spain may appear to be a typical Regulator country recovering from a recent crisis
and adapting to compete in mature. However, its energy outlook different is unique due to its extensive and growing renewables penetration, as well as demand driven by massive international tourism and its access to strategic shipping routes. In addition, it is
a strategic European gateway for LNG and gas pipelines, an exporter to North America, Africa and Latin America, in which it is a major investor. Spain is on track to comply with its 2020 energy commitments. Efficiency and renewable energies will be the major drivers for the energy system in the years ahead.
Oil products will continue to dominate Spanish energy consumption. Certain fuel uses will peak and begin to see a fall in demand heading to 2030.Electric vehicles are not forecast to take off until
the end of the 2020s. Spanish cars will still largely use combustion engines, opting for gasoline over diesel by 2030. In fact, a 25% gain in fuel efficiency will hit demand for oil products from car drivers.
Energy related CO2 historical emissions and COP21 forecast(Gt)
2000198519701960
HISTORICAL EMISSIONSCOP21 NDCIEA 2ºC scenario
10
20
30
20302015
+2oC
>4oC
o
+0.5%CAGR
2015-2030
-1.6%CAGR
2015-2030
34.0Gt
Additional efforts required to limit
2 C increase
Although progress has been made in slowing down the rise in CO2 emissions, they are not expected to start on a downward path until after 2030.The main challenge for regulators will be to maintain living standards while curbing emissions. Consumer countries will need
to sustain economic development without increasing per capita emissions to the same level as in Regulators. Energizers will need access to cutting-edge energy to decouple economic development from increasing emissions for the first time ever.
Spain final energy demand2000-30(Mtoe)(International shipping not included)
2000 2005 2010 2015 2020 2025 2030
NO EFFICIENCY MEASURES APPLIED
EFFICIENCY MEASURES APPLIED
98.1
88.9
93.1
95.4 Mtoe
84.883.5
81.0 Mtoe80.6
14.6Mtoe9.1
Mtoe4.1Mtoe
2007
79.9
97.8
89.1
■ Source: Cepsa Analysis
■ Source: Cepsa Analysis
EXECUTIVE SUMMARY — CEO2030 | 1312 | CEO2030 — EXECUTIVE SUMMARY

SCENARIOS
Alternate realities11
The CEO 2030 looks at how altering some base line estimates would affect
the related projections in order to provide a glimpse of black swan moments we might need to prepare for. For example: in the hypothetical case that all electricity is generated from renewable sources by
2030, emissions will plummet to 40% below Cepsa’s base case.If efficiency should improve twice as quickly as assumed in Cepsa’s base case, then emission would be 20% lower. If the global economy should grind to halt over the next 15 years, then oil demand will be curtailed by 20%.
The CEO 2030 includes a benchmark which compares other outlooks. What makes Cepsa stand out is its high forecast for renewables penetration which, coupled with a greater expected slowdown in energy demand, leads to a lower projection for emissions.
CEO 2030 MethodologyCepsa’s 2030 projection is based on a three dimensional analysis: end use sector (transport, industry, buildings and petrochemicals), energy source (liquid, gas, power, coal, biomass) and regional breakdown (Regulators, Energizers and Consumers). Together they comprise a compounded growth rate (2015-2030). To better understand how energy demand is evolving, the CAGR is comprised of three factors: activity factor, efficiency factor and substitution factor.
EXECUTIVE SUMMARY — CEO2030 | 1514 | CEO2030 — EXECUTIVE SUMMARY

For more information, please contact:
Cepsa - Communication Direction [email protected] Phone: (34) 91 337 62 02 Phone: (34) 91 337 60 00 www.cepsa.com
![Food security and nutrition: building a global narrative ... · EXECUTIVE SUMMARY EXECUTIVE SUMMARY EXECUTIVE SUMMARY EXECUTIVE SUMMAR Y [ 2 ] This document contains the Summary and](https://img.pdfslide.us/doc/110x75/5ff5433612d22125fb06e6b5/food-security-and-nutrition-building-a-global-narrative-executive-summary-executive.jpg)