Embed Size (px)
Citation preview

Executive OverviewRich Kruger, Chairman, President & CEO
Imperial │ 2017 │ 2
Cautionary statementStatements of future events or conditions in these materials, including projections, targets, expectations, estimates, and business plans, are forward-looking statements. Such statements are not
guarantees of future performance and involve a number of risks and uncertainties. Actual future results, including demand growth and energy source mix; production growth and mix; project plans,
dates, costs and capacities; first production dates; costs to develop; production rates, production life, and resource recoveries; cost savings; product sales; financing sources; and capital and
environmental expenditures could differ materially depending on a number of factors, such as changes in the price, supply of and demand for crude oil, natural gas, and petroleum and
petrochemical products; availability and allocation of capital by Imperial; currency exchange rates; political or regulatory events; project schedules; commercial negotiations; regulatory and third-
party approvals; unanticipated operational disruptions; unexpected technological developments; and other factors discussed in these materials and Item 1A of Imperial’s most recent Form 10-K
available at www.sedar.com and www.sec.gov. Imperial’s actual results may differ materially from those expressed or implied by its forward-looking statements and readers are cautioned not to
place undue reliance on them. Imperial undertakes no obligation to update any forward-looking statements contained herein, except as required by applicable law.
All financial information is presented in Canadian dollars, unless otherwise indicated.
In these materials, certain natural gas volumes have been converted to barrels of oil equivalent (BOE) on the basis of six thousand cubic feet (Mcf) to one barrel (bbl). BOE may be misleading,
particularly if used in isolation. A BOE conversion ratio of 6 Mcf to one bbl is based on an energy-equivalency conversion method primarily applicable at the burner tip and does not represent a
value equivalency at the wellhead. Given that the value ratio based on the current price of crude oil as compared to natural gas is significantly different than the energy equivalency ratio of 6 Mcf to
1 bbl, using a 6:1 conversion ratio may be misleading as an indication of value.
All reserves and contingent resources estimates provided in these materials are effective as of December 31, 2015, and based on definitions from the Canadian Oil and Gas Evaluation Handbook
and are presented in accordance with National Instrument 51-101, as disclosed in Imperial’s Form 51-101F1 for the fiscal year ending December 31, 2015.
Except as otherwise disclosed herein, reserves and contingent resource information are an estimate of the company’s working interest before royalties at year-end 2015, as determined by
Imperial’s internal qualified reserves evaluator.
Reserves are the estimated remaining quantities of oil and natural gas and related substances anticipated to be recoverable f rom known accumulations, from a given date forward, based on:
analysis of drilling, geological, geophysical and engineering data, the use of established technology, and specified economic conditions, which are generally accepted as being reasonable. Proved
reserves are those reserves which can be estimated with a high degree of certainty to be recoverable. Probable reserves are those additional reserves that are less certain to be recovered than
proved reserves.
Contingent resources do not constitute, and should not be confused with, reserves. Contingent resources are those quantities of petroleum considered to be potentially recoverable from known
accumulations using established technology or technology under development, but are currently not considered to be commercial ly recoverable due to one or more contingencies. Contingencies
that preclude the classification of Imperial’s contingent resources as reserves include, but are not limited to, the need for further design and the associated uncertainty in development costs and
timelines; regulatory approvals; need for internal approvals to proceed with development; lack of market access; and the need for further delineation analysis to improve certainty of resources.
Contingent resource volumes represented in these materials are technical best estimate volumes, considered to be a realistic estimate of the quantity that may actually be recovered; it is equally
likely that the actual quantities recovered may be greater or less than the technical best estimate. Estimates of contingent resources have not been adjusted for risk based on the chance of
development. There is uncertainty that it will be commercially viable to produce any portion of the resource, nor is there certainty as to the timing of any such development. Significant positive and
negative factors relevant to the estimate include, but are not limited to, the commodity price environment and regulatory and tax uncertainty.
The estimates of various classes of reserves (proved and probable) and of contingent resources in these materials represent arithmetic sums of multiple estimates of such classes for different
properties, which statistical principles indicate may be misleading as to volumes that may actually be recovered. Readers should give attention to the estimates of individual classes of reserves and
contingent resources and appreciate the differing probabilities of recovery associated with each class.
The term “project” as used in these materials can refer to a variety of different activities and does not necessarily have the same meaning as in any government payment transparency reports.

Imperial │ 2017 │ 3
Long-life, competitively advantaged assets
Disciplined investment and cost management
Value-chain integration and synergies
High-impact technologies and innovation
Operational excellence and responsible growth
Business model Deliver superior, long-term shareholder value
ExxonMobil relationship

Imperial │ 2017 │ 4
Company priorities Disciplined focus on performance, execution and creating value
Progressing growth opportunities
+ Developing enabling technologies
+ Creating optionality on scope and pace
Base business fundamentals
+ Maximizing asset performance
+ Capturing cost and organizational efficiencies
Promoting industry competitiveness
+ Advocating sound, science-based policies
+ Collaborating with stakeholders
Imperial │ 2017 │ 5
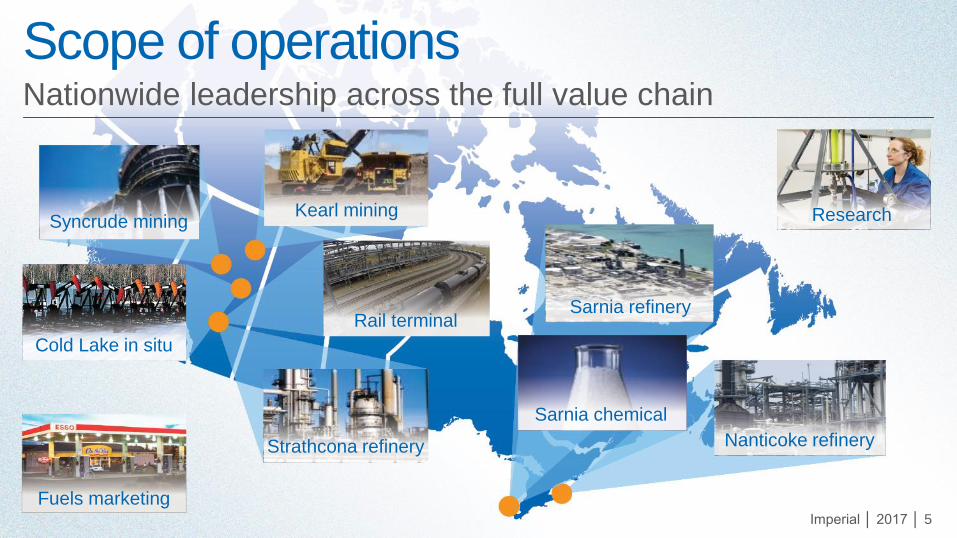
Scope of operations Nationwide leadership across the full value chain
Syncrude miningKearl mining
Cold Lake in situ
Rail terminal
Fuels marketing
Strathcona refinery
Sarnia chemical
Sarnia refinery
Nanticoke refinery
Research

Imperial │ 2017 │ 6
Integration & synergiesDelivering competitive advantage in all business lines
ChemicalCommodities & specialties
Equity crude placed in
highest netback markets
Cost-advantaged feedstocks
for refineries & chemical
Highest value sales channels
for petroleum products
Multiple and optimized
transportation networks
Access to industry-leading
technologies and know-how
IMO / XOM
value-added
capabilities
DownstreamRefining & marketing products
UpstreamOil & natural gas production
Imperial │ 2017 │ 7
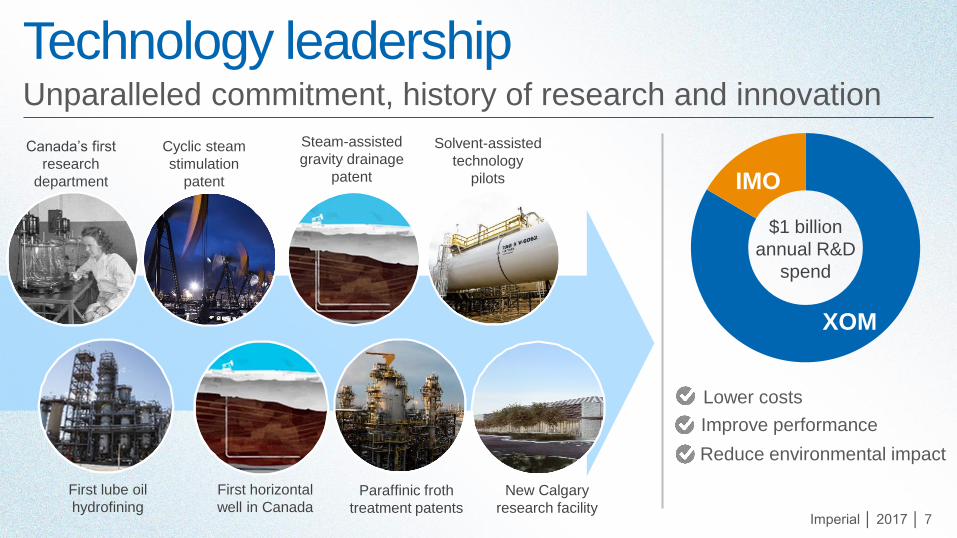
Technology leadershipUnparalleled commitment, history of research and innovation
IMO
XOM
$1 billion
annual R&D
spend
Canada’s first
research
department
Cyclic steam
stimulation
patent
First horizontal
well in Canada
Steam-assisted
gravity drainage
patent
Paraffinic froth
treatment patents
Solvent-assisted
technology
pilots
First lube oil
hydrofiningNew Calgary
research facility
Lower costs
Improve performance
Reduce environmental impact
Imperial │ 2017 │ 8
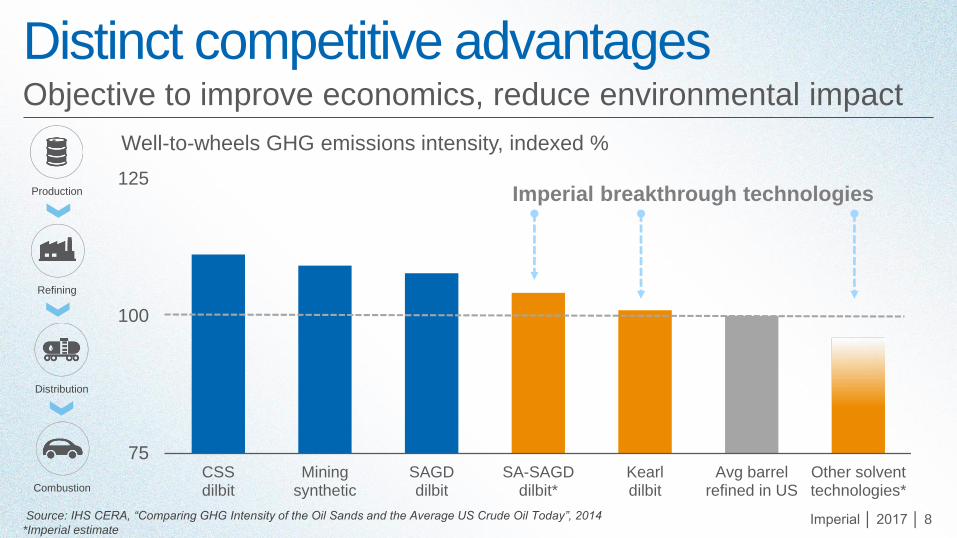
Distinct competitive advantagesObjective to improve economics, reduce environmental impact
Source: IHS CERA, “Comparing GHG Intensity of the Oil Sands and the Average US Crude Oil Today”, 2014
*Imperial estimate
75
100
125
CSSdilbit
Miningsynthetic
SAGDdilbit
SA-SAGDdilbit*
Kearldilbit
Avg barrelrefined in US
Other solventtechnologies*
Well-to-wheels GHG emissions intensity, indexed %
Imperial breakthrough technologies Production
Refining
Distribution
Combustion

Imperial │ 2017 │ 9
Core Upstream asset overviewFocus on large, long-life oil sands portfolio
Unconventional production, kbd
0
100
200
300
400
1985 1990 1995 2000 2005 2010 2015
KearlMining - PFT
71% interest
Cold Lake In situ – CSS
100% interest
Syncrude Mining - upgrader
25% interest
Highest liquids production since 1989
Highest total production since 1995
ResearchOil sands

Imperial │ 2017 │ 10
Cold Lake: world-class in situ operationBest-in-class operational performance
1IMO share, before royalties
bbls2P reserves1
1.7B
Highly efficient operation
Large, high quality bitumen resource
Significant, long-term growth potential
kbdaverage production1
165
100% IMO
owned
Producing
since 1985Cyclic steam
stimulation

Imperial │ 2017 │ 11
Achieving lower cost per barrelMature, lean asset continuing to see improvements
0
60
120
180
0
25
50
75
100
2014 2015 3Q16YTD
0 5 10 15 20
2015 industry unit cash opex, C$
Source: FirstEnergy Capital Corp.
Cold Lake
Production, kbdUnit cash opex, US$
indexed %

Imperial │ 2017 │ 12
Kearl: next generation oil sands miningDriving operational performance and synergies
Capturing economies of scale
Large, high-quality bitumen resource
Environmental leadership1IMO share, before royalties2Total IMO+XOM production, before royalties
71% IMO
owned
Producing
since 2013Mining without
upgrader
bbls2P reserves1
3.2Bkbd
targeted production2
220
Imperial │ 2017 │ 13
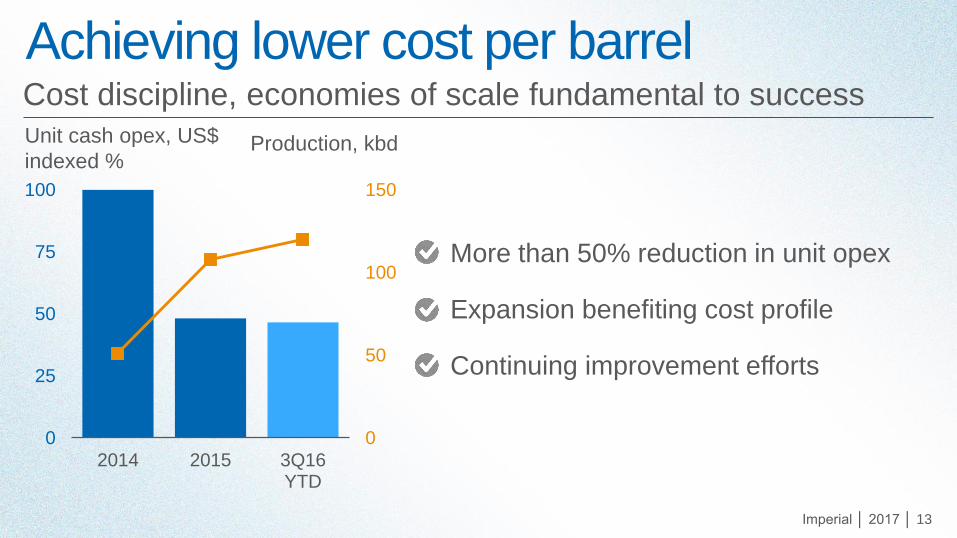
Achieving lower cost per barrelCost discipline, economies of scale fundamental to success
0
50
100
150
0
25
50
75
100
2014 2015 3Q16YTD
More than 50% reduction in unit opex
Expansion benefiting cost profile
Continuing improvement efforts
Unit cash opex, US$
indexed %Production, kbd

Imperial │ 2017 │ 14
Enhancement opportunities Activities focused on efficient capacity creep
Implementation of operational
learnings to enhance capacity
and optimize asset
Equipment upgrades and
utilities integration to enhance
volumes and efficiencies
Major additions to the mine and
plant that enhance Kearl’s
operational scope
Existing scope
Incremental scope
Major scope

Imperial │ 2017 │ 15
Syncrude: pioneer of oil sands miningImprovement underway to capture full potential
1IMO share, before royalties
Competitive mining performance
High value, synthetic crude production
Intense improvement focus
25% IMO
owned
Producing
since 1978Mining with
upgrader
bbls2P reserves1
1.1Bkbd
average production1
76

Imperial │ 2017 │ 16
Reliability improvementPerformance driven by execution of long-term strategic plan
Production1, kbd
0
30
60
90
2014 2015 1Q16 2Q16 3Q16
Impact of fire & turnarounds
Reliability risk management
Planning and execution excellence
Focus on upgrader performance
1IMO share, before royalties
Imperial │ 2017 │ 17
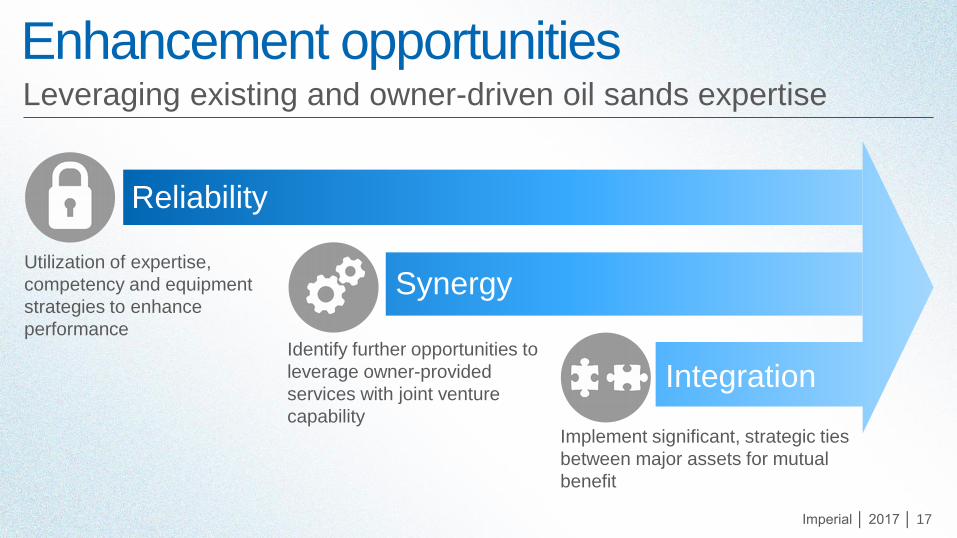
Enhancement opportunities Leveraging existing and owner-driven oil sands expertise
Utilization of expertise,
competency and equipment
strategies to enhance
performanceIdentify further opportunities to
leverage owner-provided
services with joint venture
capability Implement significant, strategic ties
between major assets for mutual
benefit
Reliability
Synergy
Integration

Imperial │ 2017 │ 18
In situ growth portfolioMultiple opportunities, development planning ongoing
Resource potential ~5 billion barrels bitumen1,2
Top-tier quality
Enabling technology SA-SAGD / other solvent technologies
Potential scope Multiple phases, 55-75 kbd per phase
Estimated cost Average ~$2B per phase
Regulatory process Aspen application in 2013
Cold Lake Expansion application in 2016
First production 2020+
1 IMO share, before royalties2 Resource potential consists of 0.8 billion bbls 2P Reserves, 1.7 billion bbls Contingent Resources
Development Pending and 2.9 billion bbls Contingent Resources On Hold

Imperial │ 2017 │ 19
In situ technology advancementsSA-SAGD provides step-change improvement opportunity
Pilot results, indexed %
0
25
50
75
100
Cumulative steam oilratio
Initial capital perflowing barrel
SAGD
SA-
SAGD
Economic, environmental gains
Ability to scale efficiently
Technology ready to apply
Industry
IMO
Imperial │ 2017 │ 20
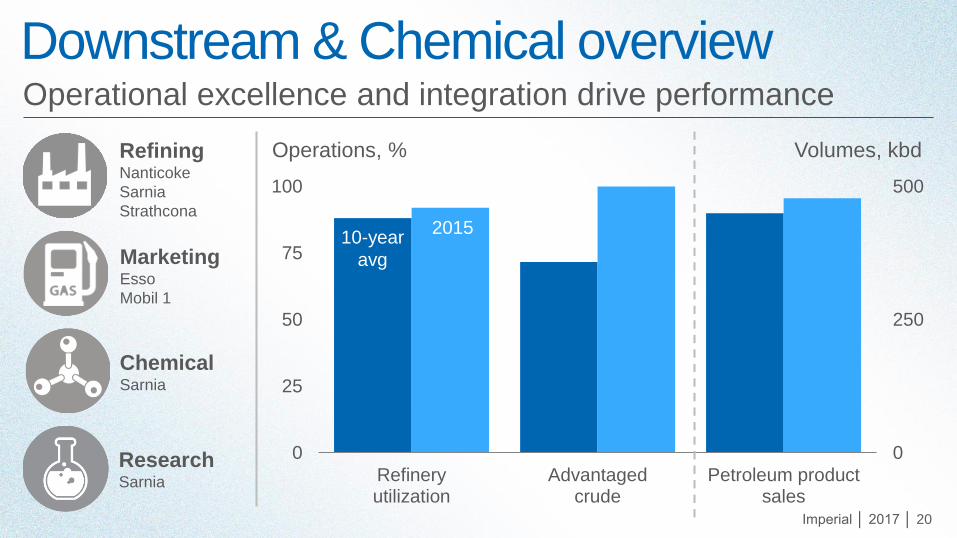
Downstream & Chemical overviewOperational excellence and integration drive performance
0
250
500
0
25
50
75
100
Refineryutilization
Advantagedcrude
Petroleum productsales
Operations, % Volumes, kbd
10-year
avg
2015
RefiningNanticoke
Sarnia
Strathcona
MarketingEsso
Mobil 1
ChemicalSarnia
ResearchSarnia

Imperial │ 2017 │ 21
Strong cash flow, selective investmentsMore than $10 billion net cash generated since 2011
Net cash, C$ billion
0
1
2
3
2011-15average
3Q16 YTD
Strong cash generating capabilities
Continued structural advantages
Low sustaining capital required
Retail sale proceeds

Imperial │ 2017 │ 22
Refining: efficient, value-driven business Integration elevates advantage in mature industry
Integrated, 100% advantaged feeds
Well-positioned, competitive assets
Leveraging global best practices
kbdrefining capacity
421percent
2015 utilization
92
Sarnia,
Ontario
Strathcona,
AlbertaNanticoke,
Ontario

Imperial │ 2017 │ 23
Continuous improvementGlobal leadership, ongoing competitive focus
2015 refinery utilization, %
IMO Canada* North America Global
70
80
90
100
Source: BP Statistical Review of World Energy 2016, company data
* Excludes IMO
» Improvement vs. 2010

Imperial │ 2017 │ 24
Rail terminalStrategic asset provides options to reach high value markets
Mitigation of apportionment impact
Equity crude flow assurance
Ability to reach new, less accessible markets
Location
advantage
Start-up April
2015Edmonton,
Alberta
venturewith Kinder
Morgan
Jointbbl/dgross
capacity
210K
Imperial │ 2017 │ 25
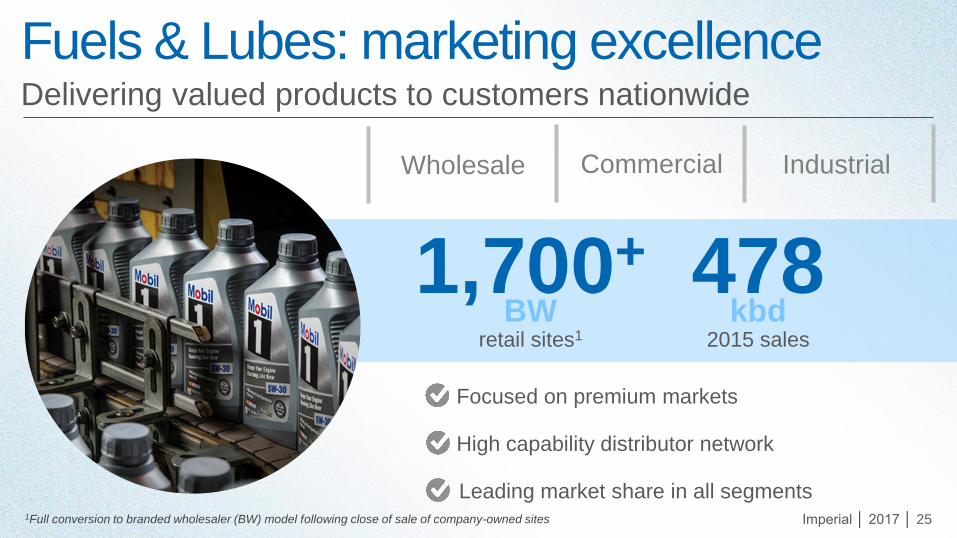
Fuels & Lubes: marketing excellenceDelivering valued products to customers nationwide
High capability distributor network
Focused on premium markets
Leading market share in all segments1Full conversion to branded wholesaler (BW) model following close of sale of company-owned sites
BWretail sites1
1,700+kbd
2015 sales
478
Commercial IndustrialWholesale
Imperial │ 2017 │ 26
Long-term supply
agreements
Commitment to grow
the Esso brand
Retail conversionCommitted to enhance retail offering and grow value
Existing, successful
partnerships
Customer experience
enhancements
Standardized
loyalty programs
Fuel technology
development

Imperial │ 2017 │ 27
Chemical: unique, commodity businessOne of Canada’s leading producers of chemical products
Integrated manufacturing facility
Top-tier asset, specialty customers
Leveraging proprietary technologies
kt2015 sales
945million
2015 record earnings
$287
Refinery
integration
Location
advantageSarnia,
Ontario

Imperial │ 2017 │ 28
Fully integrated with Sarnia refineryDiversified, low-cost feedstocks enhance profitability
Feedstock mix, %
0
50
100
2009-2014 2015+
Spot
Refinery
off gas
Midwest
ethane
Propane
Cost
advantaged
ethane
Refinery
off gas
0
50
100
150
200
250
2010 2011 2012 2013 2014 2015
Unit margin
Sales volume
Indexed %
Imperial │ 2017 │ 29
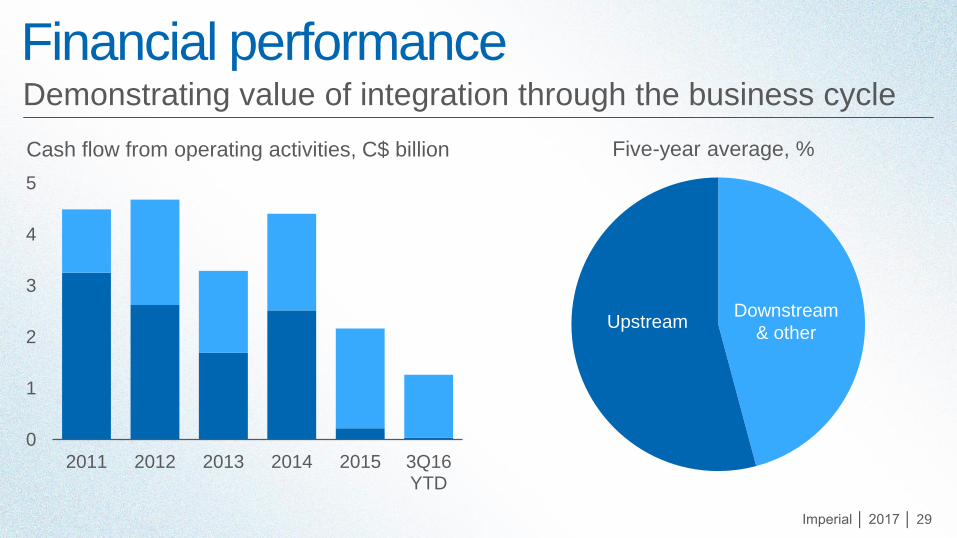
Cash flow from operating activities, C$ billion
Financial performanceDemonstrating value of integration through the business cycle
0
1
2
3
4
5
2011 2012 2013 2014 2015 3Q16YTD
Five-year average, %
UpstreamDownstream
& other

Imperial │ 2017 │ 30
Financial strengthStrong balance sheet, priority access to financial markets
3Q16 debt to capital, %
CNQ CVE SU HSE IMO
0
10
20
30
40
BBB+ BBB A- BBB+ AA+
Ratings1
1Based on S&P Global debt rating
Leverage XOM relationship
Borrow on most attractive terms
Optimize use of floating rate debt
Maintain capital structure flexibility

Imperial │ 2017 │ 31
Shareholder distributionsProven history of returning cash and preserving value
0.00
0.20
0.40
0.60
2005 2010 2015
1Adjusted for three-for-one stock splits (May 15, 1998 and May 23, 2006)
Dividend per share1, C$ 2006-15 average payout ratio1, %
0 5 10 15 20 25 30 35
CNQ
SU
CVE
HSE
IMO

Imperial │ 2017 │ 32
-5
5
15
25
IMO HSE SU CNQ CVE
Capital efficiencyMaximizing investment value and life cycle performance
Source: company publications
Return on capital employed, %
10-year average
3-year average

Imperial │ 2017 │ 33
Financial resilienceStrength provides flexibility under a range of oil prices
2016-20 annual average, C$ billion
$35
$55
$45
1Dividend at current rate
Assumptions: Oil prices are US$ Brent, nominal cash flow, inflation 2.5%, FX = US$0.75 to C$1.00,
continued industry production growth fundamentals
0
1
2
3
4
Dividendand capex
Cash flowfrom operations
Dividend1
Sustaining
Growth
Ability to meet highest priorities
Significant cash flow leverage
Options to pursue growth
Flexibility for new opportunities

Imperial │ 2017 │ 34
Why Imperial?Distinct competitive advantages that deliver long-term value
Asset base
High quality, high performing assets
across the portfolio
Operational excellence
Effective technical, operational and financial
risk management that enhances value
Value chain integration
Significant synergies across the full value
chain including ExxonMobil relationship
Growth opportunities
A large inventory of attractive opportunities
to support future upstream growth
Technology leadership
An unparalleled history of creating value
through research and innovation
Shareholder value
Demonstrated commitment to delivering
value in all business environments

Executive OverviewRich Kruger, Chairman, President & CEO