Embed Size (px)
Citation preview
University of Michigan Health System
UMH Performance Improvement
Measuring Clinical and Non-Clinical Care Time in Children’s Emergency Services
Final Project Report
To: Dr. Prashant Mahajan, MD, Vice-Chair of Emergency Medicine, Division Chief of Pediatric Emergency Medicine
Ms. Elizabeth Duffy, Administrative Manager, Healthcare Associate
Mr. Sam Clark, Industrial Engineer Lead, UMH Performance Improvement
Mr. Mustafa Mushtaq, Performance Improvement Engineering Fellow, UMH Performance Improvement
Dr. Mark Van Oyen, Ph.D., IOE 481 Professor
Ms. Mary Duck, Administrative Manager, UMH Performance Improvement
From: IOE 481 Project Team 5
Matthew Hoberman
Denise Jue
Josefina Moni
Date: 12 December 2017
Table of Contents
Executive Summary 5Background 5Key Issues 5Methods 5
Gemba Walk 6Time Studies 6Literature Search 6Historical Data 6Data Analysis 6
Findings & Conclusions 7Literature Review 7Time Studies 7Historical Data 7
Recommendations 7
Introduction 8
Background 8Current Situation 9Key Issues 9Goals and Objectives 9Project Scope 10
Methods 10Gemba Walk 10Time Studies 10Literature Search 11Historical Data 11Data Analysis 11
Design Methods, Constraints, and Standards 12Data Collection Sheet Tool 12Pugh Matrix Design and Selection 12
Findings and Conclusions 16Time Studies Data 16Value Stream Map 17Historical Data 18Literature Review 19
2
Recommendations 21Patient Fast-Track Implementation 21Documentation Procedure 22Handling Interruptions 22Future Data Collection 23
References 24
Appendices 25Appendix A. Discrete Events and Definitions 25Appendix B. Data Collection Sheet 26Appendix C. Current Value Stream Map 27Appendix D: Pugh Matrix for Data Collection Sheet Design 29Appendix E. Elaboration on Constraint and Standards Matrix 29Appendix F: General Distributions 30
Appendix F1. General Distribution for Evaluation 30Appendix F2. General Distribution for Initial Evaluation 31Appendix F3. General Distribution for Consult (Excluding Attendings) 31Appendix F4. General Distribution for Consult with Attending 31Appendix F5. General Distribution for Review Chart 32Appendix F6. General Distribution for General Charting 32Appendix F7. General Distribution for Write Orders 32Appendix F8. General Distribution for Disposition 33
Appendix G. Provider Distributions 33Appendix G1. Provider Distribution for Evaluation 33Appendix G2. Provider Distribution for Initial Evaluation 33Appendix G3. Provider Distribution for Consult (Excluding Attendings) 34Appendix G4. Provider Distribution for Consult with Attending 34Appendix G5. Provider Distribution for Review Chart 34Appendix G6. Provider Distribution for General Charting 35Appendix G7. Provider Distribution for Write Orders 35Appendix G8. Provider Distribution for Disposition 35
Appendix H. Patient Acuity Distributions 36Appendix H1. Patient Acuity Distribution for Evaluation 36Appendix H2. Patient Acuity Distribution for Initial Evaluation 36Appendix H3. Patient Acuity Distribution for Consult (Excluding Attending) 36Appendix H4. Patient Acuity Distribution for Consult with Attending 37Appendix H5. Patient Acuity Distribution for Review Chart 37Appendix H6. Patient Acuity Distribution for General Charting 37
3
Appendix H7. Patient Acuity Distribution for Write Orders 38Appendix H8. Patient Acuity Distribution for Disposition 38
Appendix I. Enhanced Value Stream Map - Provider Perspective 39Appendix J. Provider Level to Time from 1st Contact to Disposition for Admissions Patients 40Appendix K. Provider Level to Time from 1st Contact to Disposition for Discharge Patients 41
4
Executive SummaryThe University of Michigan’s Children’s Emergency Services (CES) provides unscheduled, emergency care for any individual under 21 years of age. Currently, the CES staff believes that large, unscheduled patient inflows lead to overwhelmed staff and increased patient length of stay (LOS). The current Vice Chair of Emergency Medicine and Division Chief of Pediatric Emergency Medicine believes improvements can be made in the last three stages of the patient throughput: doctor evaluations, diagnosis/treatment, and disposition. The IOE team was asked to look for more information about the time providers spend in the aforementioned stages, and the nature of the clinical and non-clinical time in those stages. The Vice Chair of Emergency Medicine has defined clinical time as any time spent with a patient, while non-clinical is time not spent with the patient. The primary goal of this project is to identify and record non-clinical and clinical time spent in stages from the initial doctor evaluation to final disposition, as well as to find the correlation of these times to the provider's experience level and patient's acuity.
Background
When patients enter the CES, they are triaged, evaluated by an initial provider, undergo testing approved by the attending, evaluated by the attending, and disposed. According to CES staff, the last three stages: evaluation, diagnosis/treatment, and disposition, are particularly time consuming. Ideally, the CES would receive, treat, and release patients in a timely manner with minimal non-clinical time and minimal LOS. However, the Vice Chair of Emergency Medicine observed that patients seem to be experiencing wait times exceeding 1 hour.
Key Issues
The following key issues led to the conception of this project: (1) lack of robust time measurements in stages from initial doctor review to disposition, (2) probable high ratio of non-clinical time to clinical time, and (3) variations in patient LOS due to provider level of experience and patient acuity.
Methods
To identify and address the key issues, the team performed a Gemba Walk and a literature search to gain a basic understanding of the project. The team performed time studies, historical data collection, and data analysis to create final recommendations.
5
Gemba WalkTo gain a better understanding of the CES patient process as a whole, the team conducted a purely observational walk through this process to understand the inner workings and flow of the system. The Gemba Walk was a necessary precursor to the time studies and interviews, allowing the team to familiarize themselves with the layout of the Children’s Emergency Department (ED). This also allowed the team to understand the inner workings of the Children’s ED and gather valuable information leading to the creation of the data collection tool and collection procedure.
Time Studies The team observed the patient flow through the CES and recorded data on the time providers spent performing non-clinical or clinical tasks, shown in Appendix A, such as evaluating patients, general charting, and filing for disposition. The data was collected through physical observation using the data collection sheet, shown in Appendix B, to standardize the collection process. The process to develop the data collection sheet is discussed in the “Design Methods, Constraints and Standards” section of this report.
Literature SearchThe team performed a literature search for peer reviewed articles pertaining to time studies, current issues, and process improvement in metropolitan hospital emergency departments. These findings are discussed in the “Findings and Conclusions” section of this report. All articles were reviewed within the context of the CES and inspired the team’s final recommendations.
Historical DataThe team collected and analyzed historical data gathered by the team coordinators from the Epic, Michigan Medicine’s Electronic Medical Record (EMR) between January 2016 and October 2017. Information acquired from this data included the following: time from initial provider evaluation to disposition, disposition order to patient dismissal from ED, and disposition type. This information was used to augment the data collected from conducted time studies and interviews to give a better understanding of the CES processes, allow the team to create a more accurate representation of the patient throughput, and validate time study findings.
Data AnalysisHistorical data was collected from Michigan Medicine’s EMR and observed data was gathered from informal interviews and time studies. All data was aggregated and analyzed using MATLAB R2017b, Microsoft Excel, and Microsoft Access. The team determined the percentage of clinical time, time spent with a patient, from non-clinical time and found no existing correlation between the provider level and event duration or the patient acuity and event duration. These findings were confirmed by the historical data.
6
Findings & Conclusions
After completing data collection and analysis, the team reported findings and final conclusions based on the following three methods: literature review, time studies, and historical data. Inspiration for potential findings also came from the previous Winter 2017 IOE 481 Team’s Final Report [1].
Literature ReviewSeveral articles served as the basis for the team’s recommendation. By reviewing best practices of other EDs, the team learned about potential teaching models as well as process flow improvement insights.
Time StudiesData was collected from October 2017 through November 2017 from shadowing mid-level providers (residents and PAs). The team found that a provider spends 35% of his/her time with patients in the room and 65% of the time performing other non-clinical tasks, such as charting, consulting other providers, reviewing charts, and writing orders. The mean and median for each discrete event time was found and compared to the provider's experience level and patient acuity, with no identifiable correlation. Distributions for these events are shown in Appendix I.
Historical DataData collected by the team coordinators from Michigan Medicine’s EMR was used to confirm the absence of correlations between provider level and time from provider first contact to disposition as well as patient acuity and time from provider first contact to disposition. The team used the number of admissions/discharges to approximate provider level and were unable to find any existing correlation.
Recommendations
From the recognition of a high percentage of high-acuity patients, the IOE team recommends implementation of a patient fast-track system expediting the treatment for patients with acuity 4 and 5. This system will decrease the average overall LOS for all CES patients. From personal observations and literature review findings, The team recommends a standard practice for managing interruptions during patient care and signage to stop interruptions from occurring, as a way of reducing cognitive burden and decreasing patient LOS. After finding that the most time-consuming non-clinical task was general charting, the team recommends a method of
7
documentation during patient evaluation, using a scribe or a personal laptop or tablet, eliminating rework time. Lastly, the team also recommends collecting 650 hours of data from the perspective of the attending, the nursing staff, and the patient.
IntroductionThe University of Michigan’s Children’s Emergency Services (CES) provides unscheduled, emergency care for any individual under 21 years of age. Currently, the CES staff believes that large, unscheduled patient inflows lead to overwhelmed staff and increased patient length of stay (LOS). The current Vice Chair of Emergency Medicine and Division Chief of Pediatric Emergency Medicine believes improvements can be made in the last three stages of the patient throughput: doctor evaluations, diagnosis/treatment, and disposition. The CES is looking for more information about the time providers spend in the aforementioned stages, and the nature of the clinical and non-clinical time in those stages. The Vice Chair of Emergency Medicine has defined clinical time as any time spent with a patient, while non-clinical is time not spent with the patient. The primary goal of this project is to identify and record non-clinical and clinical time spent in stages from the initial doctor evaluation to final disposition, as well as to find the correlation of these times to the doctor's workload/experience and patient's acuity.
The Vice Chair of Emergency Medicine asked a team of University of Michigan IOE 481 students to investigate these last three stages for non-clinical and clinical time. In order to identify clinical vs non-clinical time, the team performed time studies and interviewed medical staff to assess the impact of their workload, their level of experience, and patient acuity on the percent of clinical time spent with patients.
The purpose of this report is to identify the methods the team used to collect data, report the data analysis findings, and recommend final suggestions on reducing the average LOS of patients in the Emergency Department (ED) and increasing clinical time.
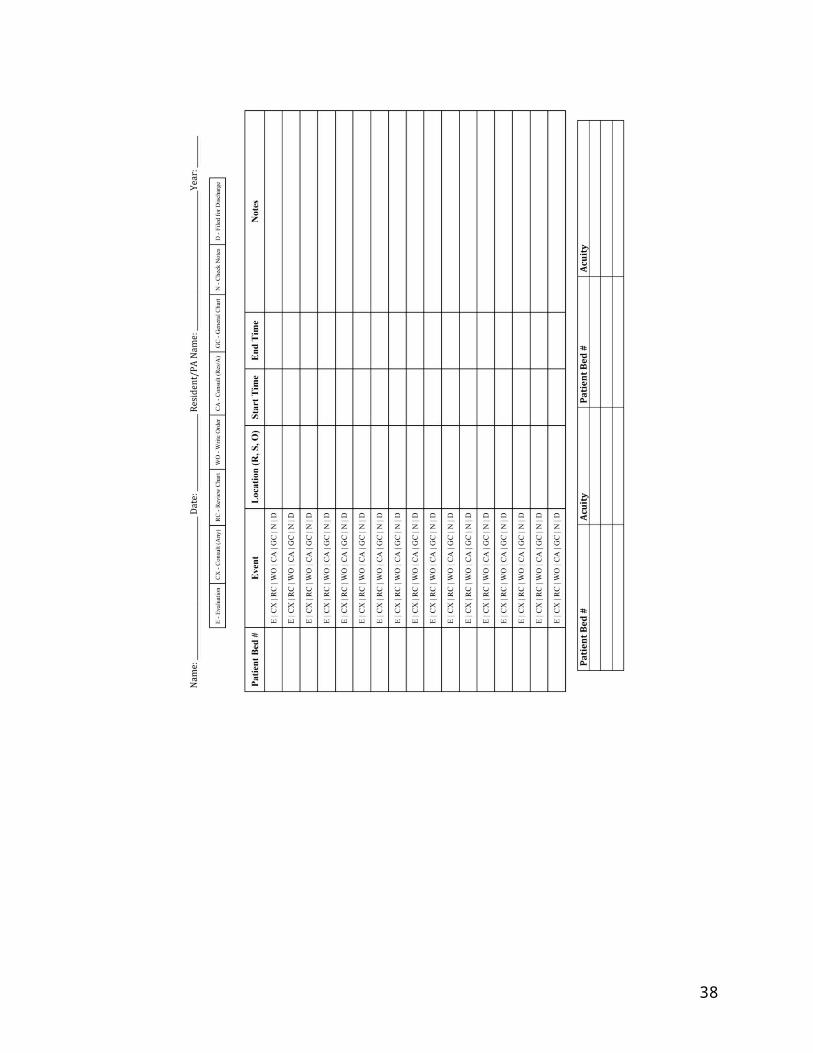
BackgroundThroughout their stay in the CES, patients follow the stages identified in the previous IOE 481 Winter 2017 Team’s Value Stream Map (VSM), shown in Appendix C. When patients enter the ED, they are triaged, evaluated by an initial provider, undergo testing approved by the attending, evaluated by the attending, and disposed. According to CES staff, the last three stages: evaluation, diagnosis/treatment, and disposition, are particularly time consuming. Provider evaluation is where a provider such as a resident or a physician’s assistant (PA) assess the patient’s condition and ask clarifying questions. Diagnosis and treatment are when the attending gathers all information regarding the patient condition and assigns a diagnosis to carry out the proper treatment. Disposition is how a patient is disposed from the ED which could be
8
observation, admit, or discharge where each of the disposition types have different durations. Ideally, the CES would receive, treat, and release patients in a timely manner with minimal non-clinical time and minimal LOS. However, the Vice Chair of Emergency Medicine observed that patients seem to be experiencing wait times exceeding 1 hour, specifically between disposition order and disposition. These wait times could be attributed to a high ratio of non-clinical to clinical time spent during the patient’s stay, according to the Vice Chair.
Current Situation
The University of Michigan IOE 481 Winter 2017 Team created a VSM, seen in Appendix C, detailing the average time spent within each stage of the patient process. However, these values included significant variability and are not robust. Additionally, other variables have not been considered in this initial model including specifics regarding the disposition process and the point-of-view of the provider.
As shown in the VSM in Appendix C, the diagnosis and treatment times are not included which could be attributed to the difficulty of identifying exact time of diagnosis and cessation of treatment. All other values are included with the average times for these processes and their respective standard deviations. Within the scope of the current project’s stages (initial doctor evaluation to disposition), the final stages have a high standard deviation/ standard error. From the current situation, the team decided to investigate a few key issues.
Key Issues
The following issues were addressed in this project:● Probable high ratio of non-clinical time to clinical time● Lack of robust time measurements in stages from initial doctor review to disposition● Variations in patient LOS due to provider level of experience, provider workload and
patient acuity
Goals and Objectives
The primary objective of this project was to record and analyze non-clinical and clinical time to improve resident/PA workflow which will be completed through the following goals:
● Characterize the working behavior and tasks of residents/PAs● Evaluate non-clinical tasks to find bottlenecks● Minimize the time from the point of initial doctor evaluation to disposition
With this information, the team will enhance the VSM with a Resident/PA Task Workflow VSM for a single patient instance. This will provide the resident/PA perspective and give more insight
9
into the inner workings of the ED. In addition to the enhanced VSM, the team will also provide recommendations based off of the results from the data analysis.
Project Scope
The IOE 481 team will study the initial provider evaluation through the disposition stages of the patient process. These observations will be limited to afternoon/evenings and nights of weekdays. All data collection will be limited to duration of the eight discrete events, in Appendix A, information gathered through provider interviews and historical data obtained from Epic, Michigan Medicine’s Electronic Medical Record (EMR).
This project scope excludes actions performed before the provider begins his/her initial evaluation, which include the stages of patient entry through triage. Additionally, the team’s observations will not be performed on the weekends or weekday mornings. Collection will not include information related to patient treatments, waiting room time, patient identifiers, or information acquired after patient release from CES.
Methods
The IOE 481 team completed the following tasks to identify and record non-clinical and clinical time spent in stages from resident evaluation to final disposition, as well as to explore a correlation of these times to the provider’s workload and experience as well as patient's acuity to provide recommendations to reduce the average patient LOS.
Gemba Walk
To gain a better understanding of the CES patient throughput as a whole, the team conducted a Gemba Walk. A Gemba Walk is a purely observational walk through a process to understand the inner workings and flow of the system being observed. The team was escorted through the ED by the research nursing staff. The staff explained standard procedures of the ED, such as identifying patients only by room number, the whiteboard system, and the floor layout. Then, the attendings brought the IOE students to patient interactions and explained the usual daily activity of the residents and attendings in the ED. The Gemba Walk was a necessary precursor to the time studies and interviews, allowing the team to study the CES efficiently with some prior knowledge of the patient process.
Time Studies
During October 2017 through November 2017, the team observed patient flow through the CES and recorded data on the duration of both non-clinical and clinical tasks such as evaluation,
10
diagnosis/treatment, charting notes, and disposition order. Through the guidance of the Vice Chair of Emergency Medicine, clinical time was defined as any time the provider spent with the patient which the team defined as an “Initial Evaluation” or subsequent “Evaluation” event. Data was collected through physical observation. The team developed a data collection sheet, shown in Appendix B, to standardize the collection process. The IOE 481 student team collected data for eight weeks, and performed around 58 hours of observation. During these observations, the team also recorded each patient’s acuity through the providers’ MiChart entries, calculated each provider’s workload by number of patients per hour, and provider experience level from the current status of resident year(1-4) or PA(5)..
Literature Search
The team performed a literature search for peer reviewed articles pertaining to time studies, current issues, and process improvement in metropolitan hospital emergency departments. Current issue reports from other EDs were compared with the CES to determine whether or not the possible implementations were feasible. Many of the reports involved process improvement techniques that were being developed or implemented within metropolitan hospital EDs. From those reports, the successful ones and the unsuccessful ones, the team created a few initial recommendations. These findings are discussed in the “Findings and Conclusions” section of this report. All articles were reviewed within the context of the CES and inspired the team’s final recommendations.
Historical Data
The team collected and analyzed historical data gathered by the team coordinators from the Epic, Michigan Medicine’s Electronic Medical Record (EMR) between January 2016 and October 2017, with information regarding 37,678 patients. Information acquired from this data included the following: time from initial provider evaluation to disposition, disposition order to patient dismissal from ED, and disposition type. This information was used to augment the data collected from conducted time studies and interviews to give a better understanding of the CES processes, allow the team to create a more accurate representation of the patient throughput, and validate time study findings.
Data Analysis
Historical data was collected from Michigan Medicine’s EMR and observed data was gathered from informal interviews and time studies. All time studies and historical data were aggregated and analyzed using MATLAB R2017b, Microsoft Excel, and Microsoft Access. The team determined the percentage of clinical time, time spent with a patient, from non-clinical time. Data collected from the interviews provided the IOE 481 team with the provider’s education
11
level and the workload to be correlated with the patient’s acuity and time from first provider contact to disposition.
From the historical data, the team received scatterplot graphs from the team coordinators that used number of admissions and number of discharges to approximate a provider’s level. These scatterplots were used to analyze any correlation between provider’s level to patient time spent from first contact with provider to filed for disposition, either discharge or admission.
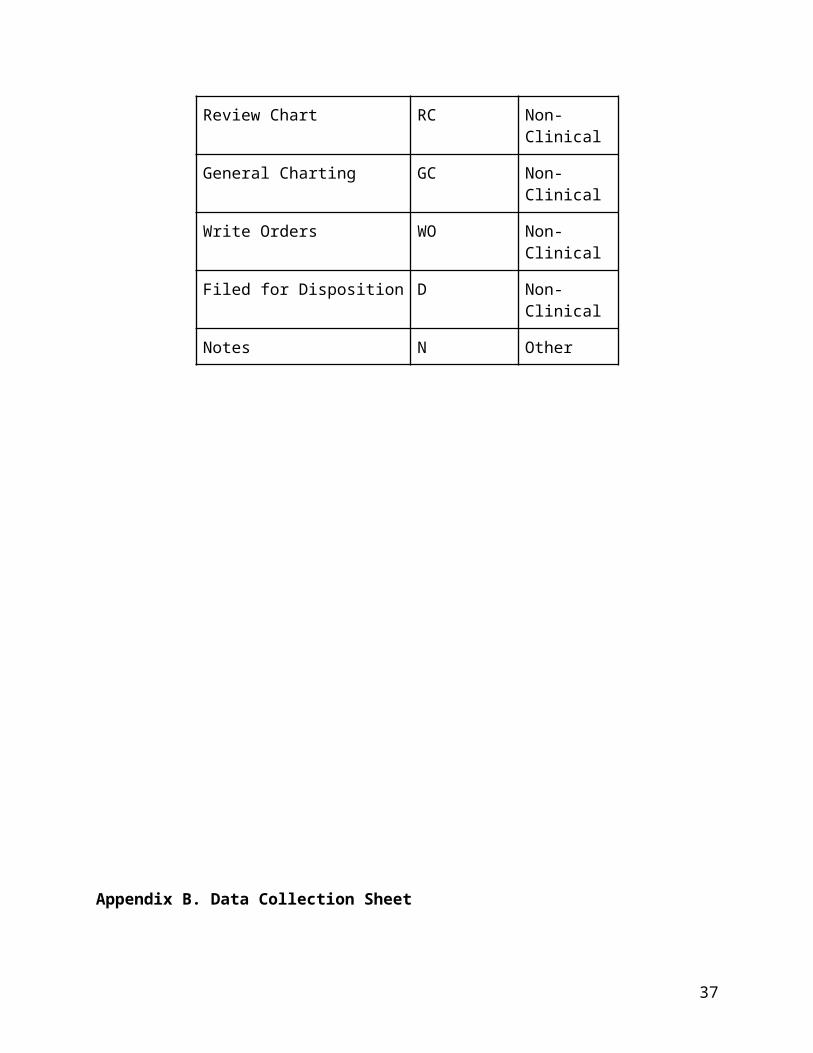
Design Methods, Constraints, and StandardsIn developing this project, the team created multiple versions of a data collection sheet to use during observations. Throughout the data collection process, the sheet was modified to fit the different needs and constraints that came up. The tool and its modification according to the constraints are described below.
Data Collection Sheet Tool
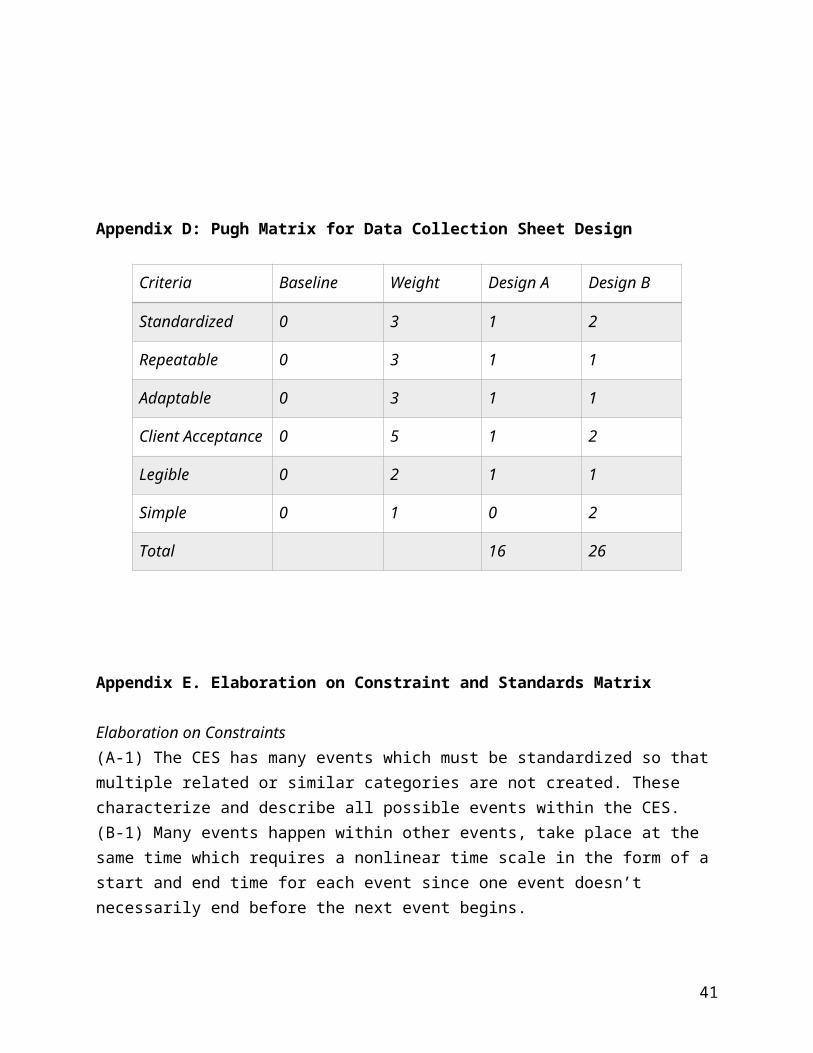
This project seeked to address the differences in provider levels and the time it takes the provider to complete certain tasks in the ED. This will ultimately help the IOE team in providing recommendations on how the CES department can reduce a patient’s LOS. Although information, such as the timestamps of each event, is available in Michigan Medicine’s EMR, the interaction of the provider with the attendings, as well as the provider’s time spent charting and writing orders is not available. In order to observe and record time spent, the IOE team designed a data collection sheet to be used by observers shadowing providers in the CES department, and can be adapted for future use. The team has created two types of possible data collection sheets, and decided on one final sheet, shown in Appendix B, for implementation using a Pugh Matrix.
Pugh Matrix Design and Selection
To choose the best data collection sheet, the IOE 481 Team used a Pugh Matrix, found in Appendix D, and found that the final design, shown in Appendix B was the better option. The Pugh Matrix weighs the client’s acceptance of the data collection sheet over all other criteria since future utility of this tool is a necessity. Overall, the data collection sheet should be standardized, leaving little room for variation for users so that tasks can be categorized into events. Given the client’s hope of using this data collection method after the project’s completion, the tool must be adaptable to changes or to new observation techniques. Lastly, the collection method should be legible and simple requiring little to no training for proper use.
Constraints
12
Before creating the data collection sheet, the team determined the following constraints to consider. These constraints would guide the team in producing the most efficient data collection tool for this time study observation task.
Constraint A. Defining Complex Events as a Discrete EventWhen collecting data on the complex events in the Emergency Department, there are multiple events that can happen within one timeframe. These events must be categorized as one of the following 9 categories in Appendix A.
For example, if a care provider is performing an examination (E) at the bedside of the patient, they may also review the chart (RC) and chart (GC) at the same time in addition to many other tasks such as grabbing a tool or talking to a parent. In order to get full, robust measurements for each of these events, the events must be separated into distinct categories and have no overlap. Ultimately, this is at the discretion of the researcher performing evaluations.
Constraint B. Continuity of TimeEvents within the ED may happen simultaneously and must be separated into discrete events. The data collection sheet must enable to evaluator to enter a new start and end time for each event that may not necessarily occur in a linear order. By providing two columns, one for start time and one for end time, the user has the option of including both if necessary to distinguish the time spent in one event from the time spent in another.
Constraint C. Patient Privacy and Compliance ConcernsWhen collecting patient-specific events, the patient must be identified on the data collection sheet for data analysis purposes. However, due to HIPPA and UMHS Compliance Codes, it would not be appropriate to include any Protected Health Information (PHI) as an identifier. Instead, the patient is referred to solely by the bed/room number. This way, an individual walking by would not be able to glean information from the collection sheet as the evaluator is collecting observations.
Constraint D. Page Size (8.5’’ x 11’’)The page size is a limiting factor in the design of the data collection sheet because these observations are taken in different locations. At every moment, the observer must be mobile and carry the collection sheet to each location to record information and take notes. Also, each instance (a patient event) should be contained to one line so that each event can be easily identified and recorded.
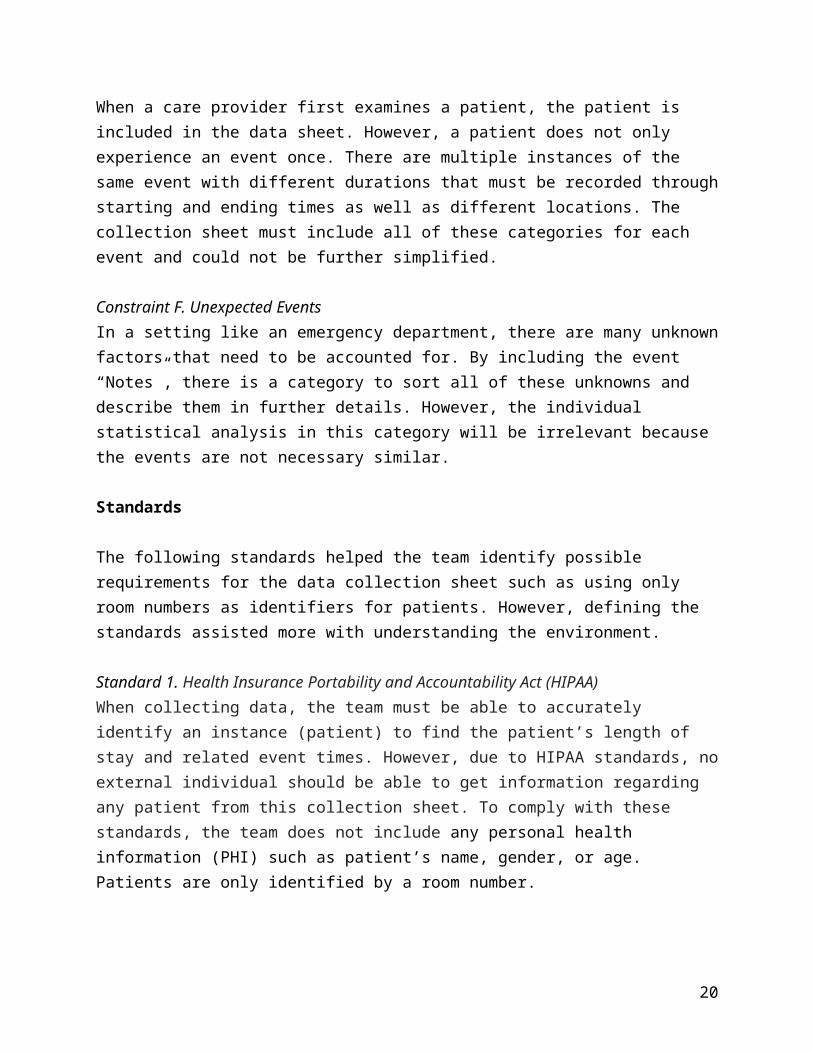
Constraint E. Multiple InstancesWhen a care provider first examines a patient, the patient is included in the data sheet. However, a patient does not only experience an event once. There are multiple instances of the same event with different durations that must be recorded through starting and ending times as well as
13
different locations. The collection sheet must include all of these categories for each event and could not be further simplified.
Constraint F. Unexpected EventsIn a setting like an emergency department, there are many unknown factors that need to be accounted for. By including the event “Notes”, there is a category to sort all of these unknowns and describe them in further details. However, the individual statistical analysis in this category will be irrelevant because the events are not necessary similar.
Standards
The following standards helped the team identify possible requirements for the data collection sheet such as using only room numbers as identifiers for patients. However, defining the standards assisted more with understanding the environment.
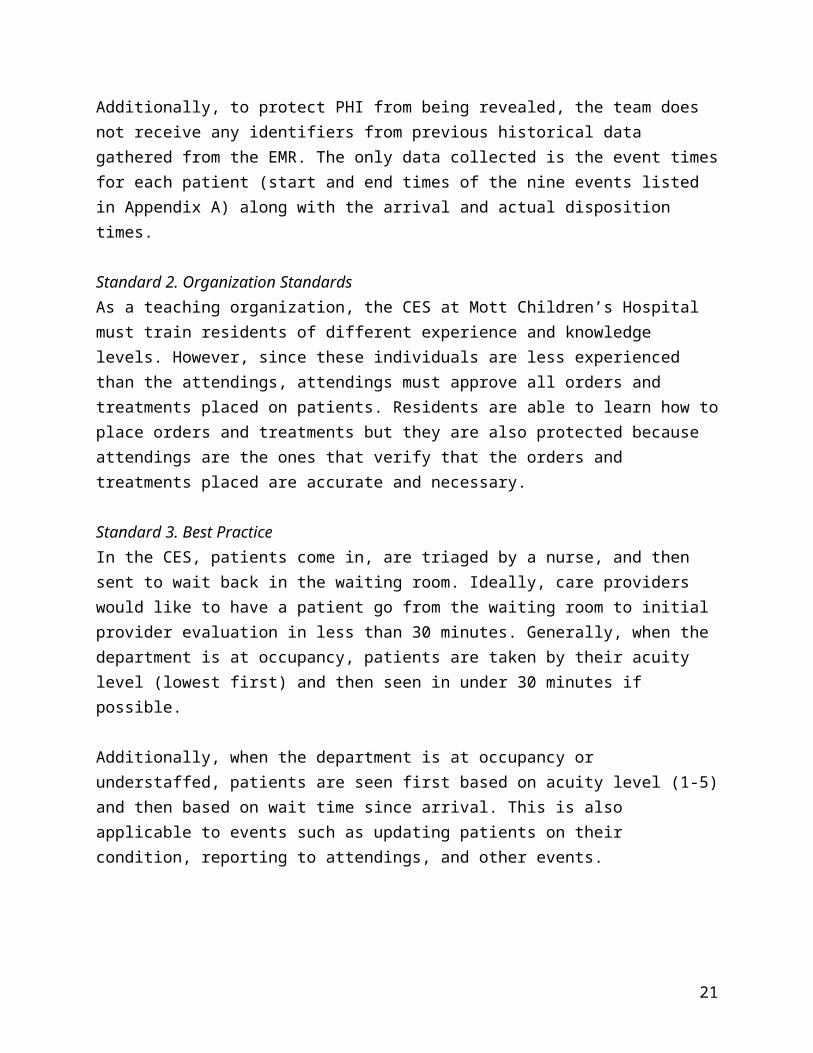
Standard 1. Health Insurance Portability and Accountability Act (HIPAA)When collecting data, the team must be able to accurately identify an instance (patient) to find the patient’s length of stay and related event times. However, due to HIPAA standards, no external individual should be able to get information regarding any patient from this collection sheet. To comply with these standards, the team does not include any personal health information (PHI) such as patient’s name, gender, or age. Patients are only identified by a room number.
Additionally, to protect PHI from being revealed, the team does not receive any identifiers from previous historical data gathered from the EMR. The only data collected is the event times for each patient (start and end times of the nine events listed in Appendix A) along with the arrival and actual disposition times.
Standard 2. Organization StandardsAs a teaching organization, the CES at Mott Children’s Hospital must train residents of different experience and knowledge levels. However, since these individuals are less experienced than the attendings, attendings must approve all orders and treatments placed on patients. Residents are able to learn how to place orders and treatments but they are also protected because attendings are the ones that verify that the orders and treatments placed are accurate and necessary.
Standard 3. Best PracticeIn the CES, patients come in, are triaged by a nurse, and then sent to wait back in the waiting room. Ideally, care providers would like to have a patient go from the waiting room to initial provider evaluation in less than 30 minutes. Generally, when the department is at occupancy, patients are taken by their acuity level (lowest first) and then seen in under 30 minutes if possible.
14
Additionally, when the department is at occupancy or understaffed, patients are seen first based on acuity level (1-5) and then based on wait time since arrival. This is also applicable to events such as updating patients on their condition, reporting to attendings, and other events.
The team could not find any standards relating to our design method when searching the websites of OSHA, MiOSHA, NIOSH, ASTM, ANSI, SAE, Milk-Specs, etc.
Constraints and Standards Matrix
Entry 1 2 3 4 5
A. Defining Complex Events as a Discrete Event
(A-1)
B. Continuity of Time (B-1)
C. Patient Privacy and Compliance Concerns
(C-1) (C-2)
D. Page Size (8.5’’ x 11’’) (D-1) (D-2)
E. Multiple Instances (E-1) (E-2) (E-3)
F. Unexpected Events (F-1) (F-2)
S1. HIPAA (S1-1) (S1-2)
S2. Organization Standards (S2-1)
S3. Best Practice (S3-1) (S3-2)
Standards that are not of consequence
OSHA IEEE ASE ASTM MiOSHA
Further elaboration on the constraints and standards matrix can be found in Appendix E.
Findings and ConclusionsAfter performing the methods, the team gathered enough data and performed the final data analysis. The analysis consisted of time study results, an addition to the VSM, validation through
15
Constraints
Standards
use of historical data gathered from the EMR, and a literature review to make further recommendations.
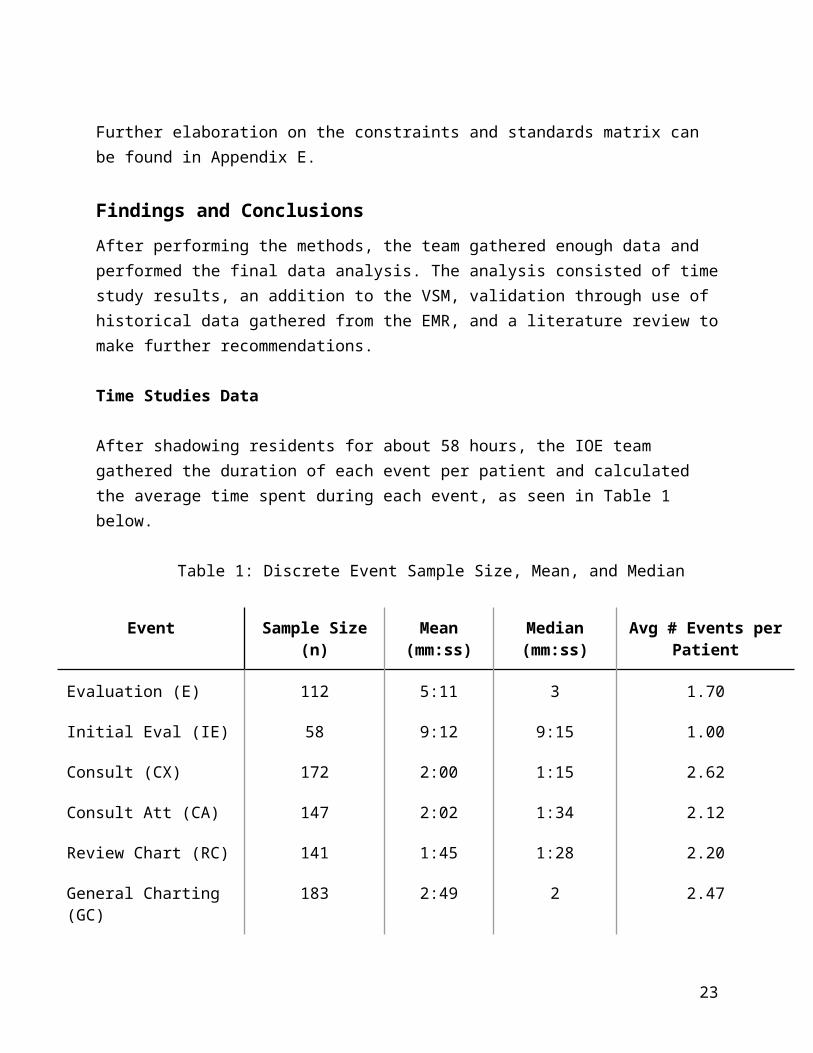
Time Studies Data
After shadowing residents for about 58 hours, the IOE team gathered the duration of each event per patient and calculated the average time spent during each event, as seen in Table 1 below.
Table 1: Discrete Event Sample Size, Mean, and Median
Event Sample Size (n) Mean (mm:ss)
Median (mm:ss)
Avg # Events per Patient
Evaluation (E) 112 5:11 3 1.70
Initial Eval (IE) 58 9:12 9:15 1.00
Consult (CX) 172 2:00 1:15 2.62
Consult Att (CA) 147 2:02 1:34 2.12
Review Chart (RC) 141 1:45 1:28 2.20
General Charting (GC) 183 2:49 2 2.47
Write Orders (WO) 82 1:38 1:12 1.73
Filed for Disposition (D) 44 2:15 1:55 1.39
Total 939 (~58 hours) -- -- --
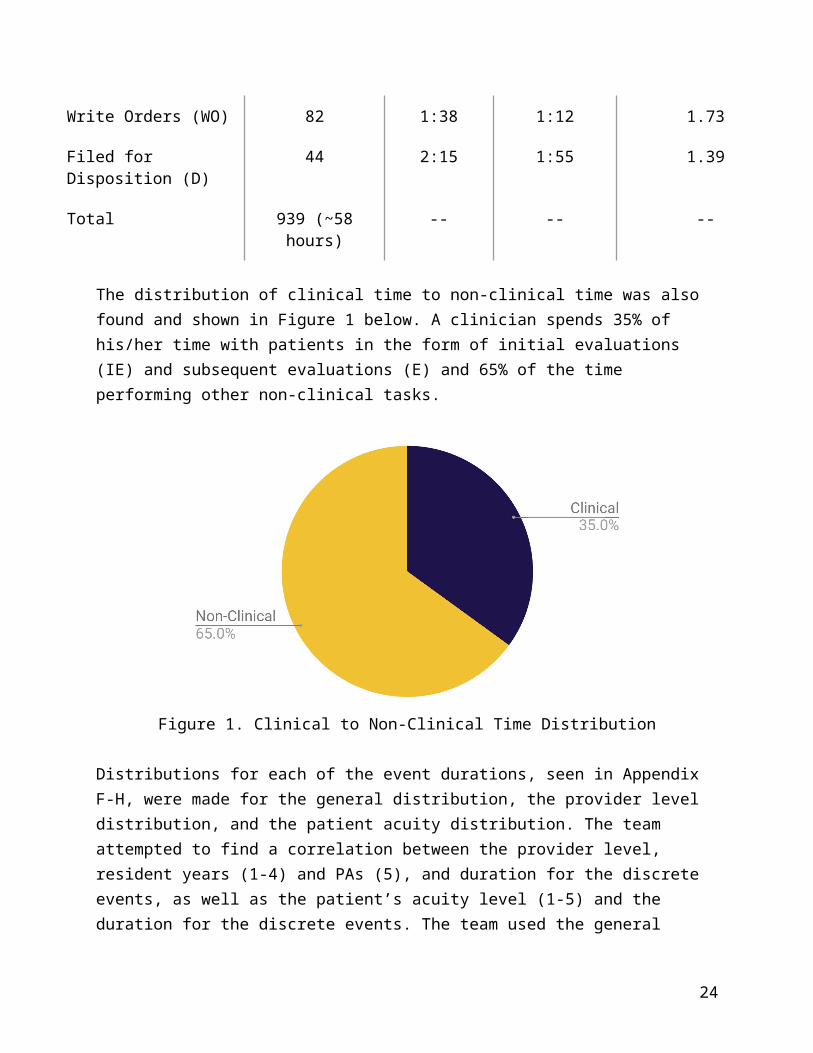
The distribution of clinical time to non-clinical time was also found and shown in Figure 1 below. A clinician spends 35% of his/her time with patients in the form of initial evaluations (IE) and subsequent evaluations (E) and 65% of the time performing other non-clinical tasks.
16
Figure 1. Clinical to Non-Clinical Time Distribution
Distributions for each of the event durations, seen in Appendix F-H, were made for the general distribution, the provider level distribution, and the patient acuity distribution. The team attempted to find a correlation between the provider level, resident years (1-4) and PAs (5), and duration for the discrete events, as well as the patient’s acuity level (1-5) and the duration for the discrete events. The team used the general distribution of each event, the provider level distribution, and the patient acuity distribution to determine whether these factors affected the duration of each event. However, since the distributions appeared the same for each of the discrete events, there seem to be no significant correlations.
Value Stream Map
Using the average time spent in each task gathered from the time studies data, the IOE team developed a Value Stream Map (VSM), Appendix I, to show a general process a provider goes through for each patient. This VSM is an enhancement to the existing VSM created by the Winter 2017 University of Michigan IOE 481 students [1] which focused on the patient perspective. This additional VSM shows a typical progression from initially reviewing a patient chart through putting in an order for their disposition. Many providers do not follow these steps in the particular order that is shown as many of these tasks are re-done and steps are repeated. However, this new addition provides more detail from the provider point of view giving insight into the entire patient process in the ED.
Historical Data
Data collected from the EMR was used to validate that there are no correlations between provider level and provider first contact to disposition. Historical data does not have information
17
regarding resident level, so the number of discharges and the number of admissions is used to approximate experience level. The team assumed that the higher the number of total discharges/admissions of the provider was positively correlated with provider’s level as he/she would have seen and disposed more patients than newer providers. However, this does not take into consideration new employees that have logged a considerable number of hours at other EDs and is not considered a completely accurate association. Appendix J and K, separated by disposition of admission and discharge, show the scatter plot result of the historical data analysis. This graph confirms the observed data analysis findings that there is no correlation between provider level and provider first contact to disposition duration since the R2 values are statistically insignificant in both cases.
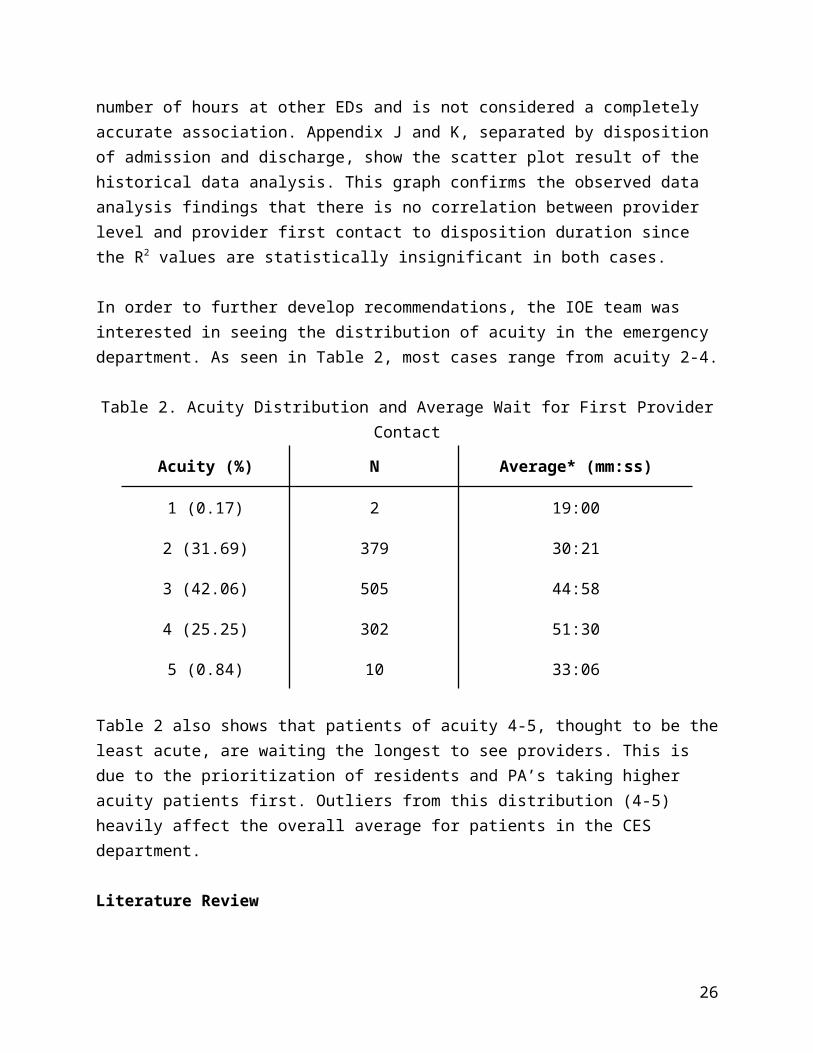
In order to further develop recommendations, the IOE team was interested in seeing the distribution of acuity in the emergency department. As seen in Table 2, most cases range from acuity 2-4.
Table 2. Acuity Distribution and Average Wait for First Provider Contact
Acuity (%) N Average* (mm:ss)
1 (0.17) 2 19:00
2 (31.69) 379 30:21
3 (42.06) 505 44:58
4 (25.25) 302 51:30
5 (0.84) 10 33:06
Table 2 also shows that patients of acuity 4-5, thought to be the least acute, are waiting the longest to see providers. This is due to the prioritization of residents and PA’s taking higher acuity patients first. Outliers from this distribution (4-5) heavily affect the overall average for patients in the CES department.
Literature Review
Multiple streams of literature related to issues found in a busy, complex emergency departments (ED). The purpose of this search was to find related best practices and insights to aid in the development of recommendations.
Clinical Teaching in a Busy Emergency Department: Strategies for Success. [1]
18
This article addresses the issues seen in an emergency department (ED) that could cause teaching to falter. In the ED, there is no guide on how to teach or how to be efficient in a dynamic and chaotic environment. The response is to follow four strategies that are set up to find the optimal way to teach in the ED.
1. Get to know the trainee and plan the shift together2. Identify the teaching point of every case that both addresses the patient’s concerns and
the learner’s needs3. Wait at least 3 seconds for a response when using the Socratic Method4. Teach more than one trainee at a time when appropriate
This article suggests planning to optimize the use of time in the ED and with patients. Proper planning and knowledge of the current cases should be considered when identifying patient cases used for teaching. Also, knowing how to teach in an acute case by focusing on one issue could be of use for patients with acuity 1 or 2. Providing backgrounds on patients before entering the room could give the students more time to think about a diagnosis before they are asked for one during the patient evaluation.
The Effect of Low-Complexity Patients on Emergency Department Waiting Times. Health Policy and Clinical Practice/Original Research. [2]To reduce total Length of Stay (LOS) for all patients, this article considers the effect of low-complexity patients on Emergency Department (ED) waiting times. According to the article, low-complexity patients seem to be more frequent in each time frame investigated requiring treatment for other issues. This article investigates whether the low-complexity patients are delaying the time and treatment of high-complexity patients.
After the study was performed, the findings indicated that the low-complexity “patients have little impact on the timeliness of care for other ED patients”. These results could be because these patients have easily-treatable issues, the instruments are readily available, the patients are not placed in resuscitation bays (reserved for high-acuity patients), and other individuals such as nurses are trained to care for these patients.
In CES, patient arrival also begins at the initial provider evaluation and does not take into account when the patient arrives in the waiting room. Since the University of Michigan is a teaching hospital, it may take longer on average for patients to be seen especially when there is bedside teaching which could be optimized using suggestions from Aldeen and Penciner above. These findings help show that low-acuity patients do not affect the overall LOS of high-acuity patients.
Analysis of Factors Influencing Length of Stay in the Emergency Department. ED Administration. [3]
19
This article provides some reasoning behind the patient LOS in an ED. Although many internal and external factors are uncontrollable, some factors can be explained.
At the University of Alberta Hospital, the acuity levels are most acute (1) to least acute (5). After data analysis, they found that triage levels 1 and 5 had the shortest LOS while those in triage level 3 face the longest triage time since those cases are generally more ambiguous. They also found that ultrasound imaging, lab testing, x-rays, and arrival by ambulance add more time to the LOS along with other factors. Additionally, for disposition, there is an average of a 177 min wait with a range of 10 minutes to 17.8 hours. Delays to triage time are short for acuity 1 and 2 but significantly longer in 4 and 5, which reflect the urgency of the case. Overall, non-urgent and critically ill patients spend the shortest time due to lower investigation and consultation times.
The findings from the University of Alberta Hospital apply to the Mott Children’s Hospital. Based on this finding, it is important to look at the acuity 3 patients that are considered ambiguous. These cases may increase the overall LOS of patients in the Children’s ED and should be evaluated independently. Since this is also a teaching hospital, these acuity 3 cases may be beneficial to have students or researchers review because they are generally waiting for a long time and they are not straightforward.
Do Admitted Patients Held in the Emergency Department Impact the Throughput of Treat-and-release Patients?[4]Since most hospital wards have full beds, patients that require a bed come into the emergency room (ER) and wait for a bed to open up. This study evaluates the use of a short-stay inpatient unit to hold these patients apart from the ER so that there is less overcrowding and patients in the ER will have a shorter overall length of stay (LOS). In addition to overcrowding, this study emphasizes prolonged wait times due to physician availability and test results.
This study showed that the short-stay unit did decrease the number of patients in the ER, which allowed for a shorter LOS for other patients. However, financially, the new ward cost a significant amount of money since it was staffed with physicians and residents 24 hours a day. One explanation may be that since the patients admitted to this short-stay unit had to fall into one of 4 categories, it was too exclusive and therefore did not reach full capacity.
Interruptions and Distractions in Healthcare: Review and Reappraisal [6]There currently exists a large problem with interruptions and distractions during patient care in hospitals. This study evaluates how often this issue is occurring and possible ways to remedy the issue. It displays the results of three different proposed solutions and what the main interruptions seem to be, while also exploring the effect of these interruptions on the quality of patient care and the error rate.
20
Different studies that were reviewed in this paper had different results for percentage of tasks being interrupted. These values stated that 19%, 45%, 47% and 62% of the time, direct-patient contact tasks were interrupted and forced the care provider to stop the task and return to it after the interruption was over. The paper also found that there was a statistical correlation between interruptions and error rates, showing that they can be detrimental to quality of care. The only intervention that was shown to be statistically successful in lowering the rate of interruptions was visible signage to try and reduce interruptions for care providers when they were with their patients.
RecommendationsBased on team observations, time studies data, historical data, and literature reviews, the IOE team was able to develop some recommendations for the CES Department. These recommendations could improve the LOS for patients as well as improve the provider workflow.
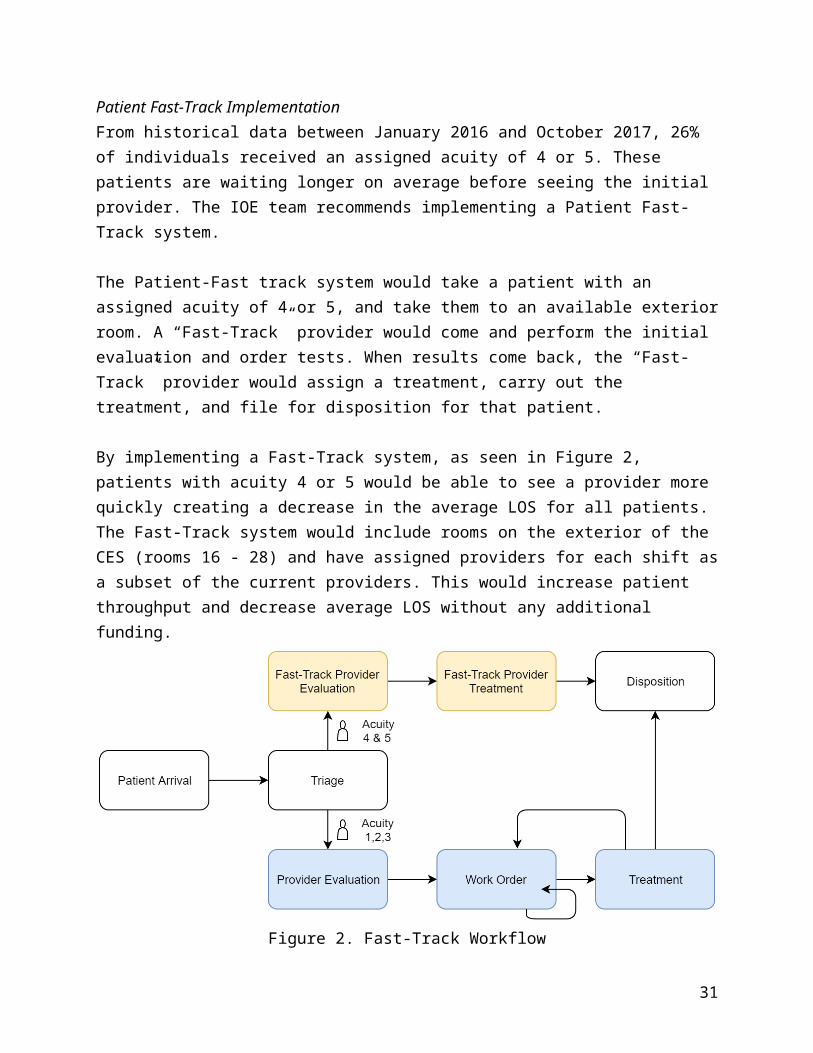
Patient Fast-Track ImplementationFrom historical data between January 2016 and October 2017, 26% of individuals received an assigned acuity of 4 or 5. These patients are waiting longer on average before seeing the initial provider. The IOE team recommends implementing a Patient Fast-Track system.
The Patient-Fast track system would take a patient with an assigned acuity of 4 or 5, and take them to an available exterior room. A “Fast-Track” provider would come and perform the initial evaluation and order tests. When results come back, the “Fast-Track” provider would assign a treatment, carry out the treatment, and file for disposition for that patient.
By implementing a Fast-Track system, as seen in Figure 2, patients with acuity 4 or 5 would be able to see a provider more quickly creating a decrease in the average LOS for all patients. The Fast-Track system would include rooms on the exterior of the CES (rooms 16 - 28) and have assigned providers for each shift as a subset of the current providers. This would increase patient throughput and decrease average LOS without any additional funding.
21
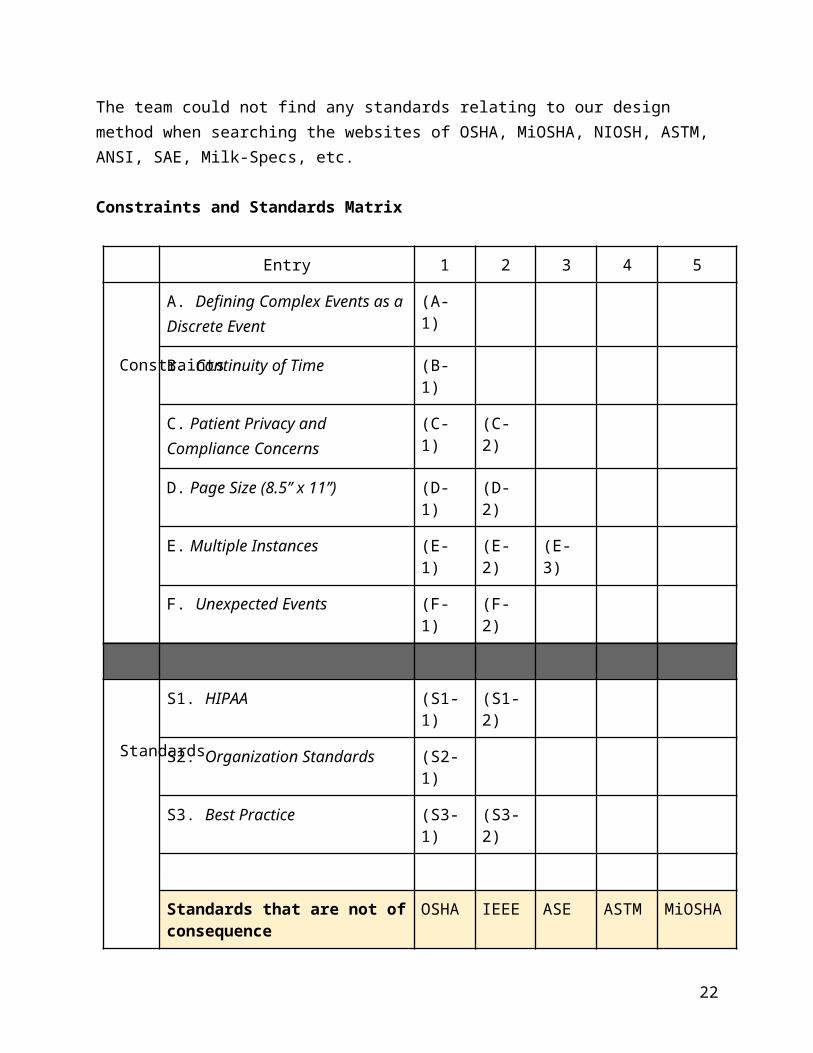
Figure 2. Fast-Track Workflow
This flow would be “active” when there is a patient of acuity 4 or 5. If there are no patients with these acuities, the “Fast-Track” providers would work with the general population (patients with acuity 1 - 3) and rooms would be available to this population as well. If this system is implemented, there should be a guideline established for the “Fast-Track” providers based on current ED capacity, current waiting room capacity, and availability of other providers.
Documentation ProcedureAs shown in the findings section, provider documentation and charting accounted for 31.5% of the non-clinical time. This is the highest percentage, with the next highest being 21% for consulting. There are many options available to allow charting and documentation to take place in the patient’s room during the provider evaluation. Whether this is hiring an additional person, such as a scribe, or having a tablet or laptop that providers can document while evaluating with the patient. A documentation device that eliminates this unnecessary and time-consuming activity would free up a lot of time for care providers. The extra time that the documentation would free up for the care providers could be used to hasten the treatment and discharge of patients and shorten LOS. The IOE team recommends experimenting with the implementation of one of these documentation options, as well as further investigating the tradeoffs that come with in-room evaluation, such as a perceived decrease in patient provider interaction.
Handling InterruptionsThrough the team’s observations, it was realized that many providers are constantly interrupted during each event, requiring them to step away from the task, switch to another one, and then switch back. This creates a heavy cognitive burden on the provider and is shown to decrease efficiency and patient safety [6]. In the literature search described in the findings section of the report, the team found a recommended solution to this issue that has been reported as being
22
successful in previous studies. This solution is visible signage in the department that warns staff against interrupting care providers when they are performing tasks that involve direct patient contact [6]. In addition to the signage, the team recommends talking to care providers and informing them on best practices regarding phone calls or pages when with a patient. The team further recommends evaluating the current procedures put in place and studying this concept of a defined strategy of handling interruptions and determining a standardized procedure. These recommendations will reduce the amount of interruptions and the cognitive burden that comes with them, which could increase the quality of patient care and provider workflow while simultaneously reducing patient LOS.
Future Data CollectionThe physical observations and time studies performed by the IOE team are not enough to create a reliable statistical report of the events that take place in the ED. The team spent about 58 hours tracking event durations from the provider’s point-of-view. To get a better sense of the event distributions, and correlations, if any, the team recommends gathering at least 650 more hours of observations. This number is obtained from the necessary hours for each provider level.
The residents’ and PA’s view of the patient throughput process is limited in terms of assessing clinical time spent with the patient. It does not account for the time a patient spends with the nursing staff or the attending physician. With this in mind, the team recommends more data be collected from the perspective of the nurse, the attending, and the actual patients. This will give a more holistic sense of the patient process and what is happening at all times from every perspective.
23
References
[1] G. Gupta, A. Shermon, E. Smith, and H. Willet(2017). “Using Lean Tools to Identify Opportunities for Improvement in the Michigan Medicine Children’s Emergency Services,” Ann Arbor, MI, 2017
[1] Penciner, R. (2002). Clinical Teaching in a Busy Emergency Department: Strategies for Success. Education, 4(4), pp.286-288.
[2] Schull, M., Kiss, A., and Szalai, J. (2007). The Effect of Low-Complexity Patients on Emergency Department Waiting Times. Health Policy and Clinical Practice/Original Research, 49(3), pp.257-264.
[3] Yoon, P., Steiner, I., and Reinhardt, G. (2003). Analysis of Factors Influencing Length of Stay in the Emergency Department. ED Administration, 5(3), pp.155-161.
[4] Bazarian, J., Schneider, S., Newman, V., and Chodosh, J. (1996). Do Admitted Patients Held in the Emergency Department Impact the Throughput of Treat-and-release Patients? Education and Practice, 3, pp. 1113-1118.
[6] Rivera-Rodriguez, A. J., and B.-T. Karsh. “Interruptions and Distractions in Healthcare: Review and Reappraisal.” Quality and Safety in Health Care, vol. 19, no. 4, Aug. 2010, pp. 304–312., doi:10.1136/qshc.2009.033282.
24
Appendices
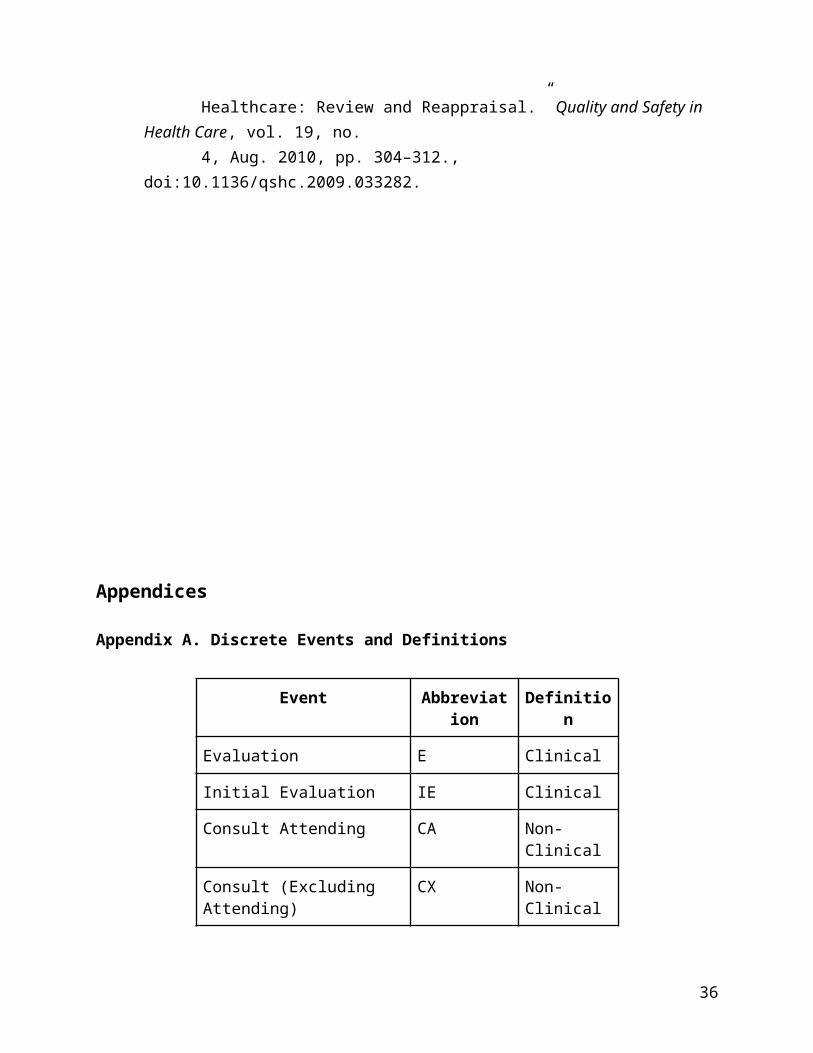
Appendix A. Discrete Events and Definitions
Event Abbreviation Definition
Evaluation E Clinical
Initial Evaluation IE Clinical
Consult Attending CA Non-Clinical
Consult (Excluding Attending) CX Non-Clinical
Review Chart RC Non-Clinical
General Charting GC Non-Clinical
Write Orders WO Non-Clinical
Filed for Disposition D Non-Clinical
Notes N Other
25
Appendix B. Data Collection Sheet
26
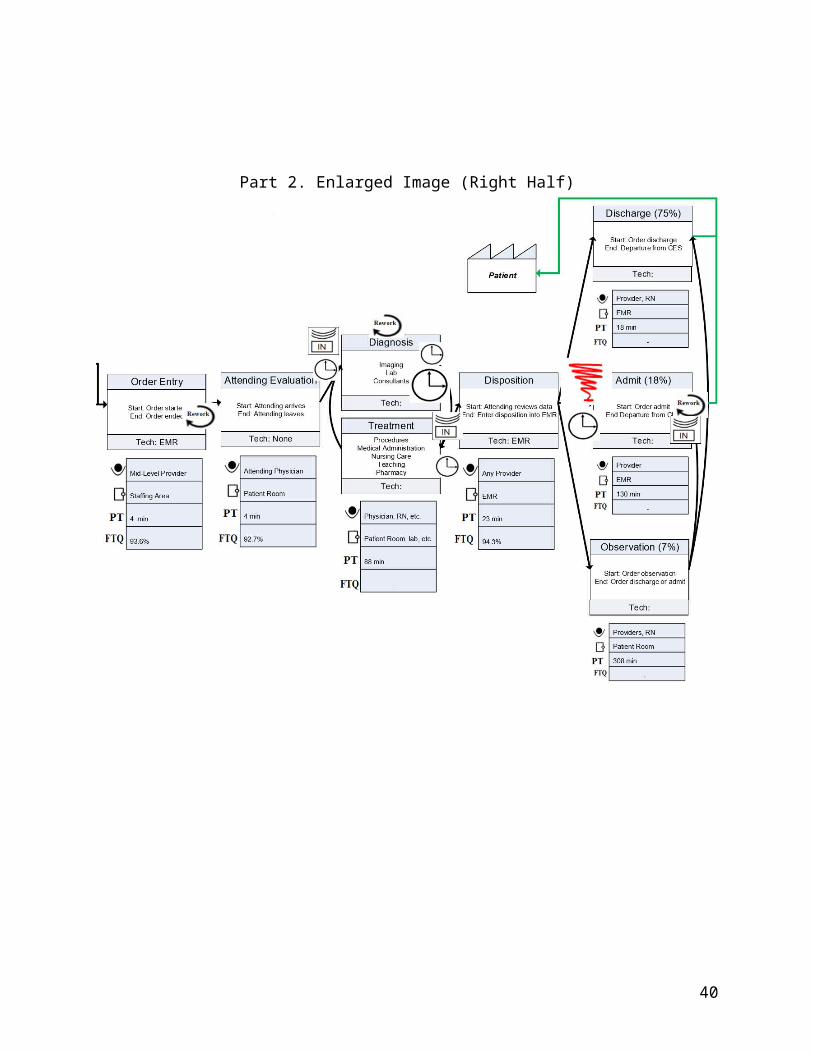
Appendix C. Current Value Stream MapCurrent Value Stream Map of CES Patient Throughput [1]
27
Taken from University of Michigan Winter 2017 IOE 481 Student’s Final Report
Part 1. Enlarged Image (Left Half)
Part 2. Enlarged Image (Right Half)
28
Appendix D: Pugh Matrix for Data Collection Sheet Design
29
Criteria Baseline Weight Design A Design B
Standardized 0 3 1 2
Repeatable 0 3 1 1
Adaptable 0 3 1 1
Client Acceptance 0 5 1 2
Legible 0 2 1 1
Simple 0 1 0 2
Total 16 26
Appendix E. Elaboration on Constraint and Standards Matrix
Elaboration on Constraints(A-1) The CES has many events which must be standardized so that multiple related or similar categories are not created. These characterize and describe all possible events within the CES.(B-1) Many events happen within other events, take place at the same time which requires a nonlinear time scale in the form of a start and end time for each event since one event doesn’t necessarily end before the next event begins.(C-1) PHI is not included on the data form due to compliance standards. Patients are identified with room number only on the forms.(C-2) For historical data, patient room numbers, providers, and time of observation are aggregated to identify the patient. Data is extracted without any PHI.(D-1) Observers using this data collection sheet must be mobile and have a sheet large enough to write information on but small enough to transport.(D-2) Most printers only take 8.5”x11” paper or 11”x17” tabloid paper. The tabloid paper is too large so the 8.5”x11” paper seems to be the best size.(E-1) Patients are not only referred to once on the sheet and they are also not referred to in order (meaning a provider would only see one patient in a time frame).(E-2) Patient events can happen multiple times. For example, a provider can perform a patient evaluation multiple times during the patient stay.(E-3) Provider events can happen multiple times. For example, a provider may need to ask a nurse for a camera to take a picture of a patient reported issue.
30
(F-1) Unexpected events such as incoming trauma to the resuscitation bays have multiple events and multiple providers performing tasks at one time. These events are unexpected and cannot be thoroughly examined due to the chaotic nature of these events.(F-2) Other unexpected events could be a provider searching for another supply because the one in the room that their patient was in broke and they needed a new supply to properly examine their patient.
Elaboration on Standards(S1-1) Learning HIPAA standards are required by all staff and volunteers of Michigan Medicine(S1-2) Training and testing on HIPAA standards are provided by MLearning to ensure compliance and staff awareness(S2-1) Organizational Standards suggest that attendings must receive reports and approve all resident orders. This is shown through the CA event in Appendix A.(S3-1) Best Practice dictates that patients arriving to the ED should be seen within 30 minutes of arrival.(S3-2) When patients are not able to be seen within 30 minutes of arrival, providers should prioritize the lower acuity patients (1 - 3) above the higher acuity patients (4-5) and should prioritize the longer wait times over the higher wait times.
Appendix F: General Distributions
Appendix F1. General Distribution for Evaluation
31
Appendix F2. General Distribution for Initial Evaluation
Appendix F3. General Distribution for Consult (Excluding Attendings)
Appendix F4. General Distribution for Consult with Attending
32
Appendix F5. General Distribution for Review Chart
Appendix F6. General Distribution for General Charting
Appendix F7. General Distribution for Write Orders
33
Appendix F8. General Distribution for Disposition
Appendix G. Provider Distributions
Appendix G1. Provider Distribution for Evaluation
Appendix G2. Provider Distribution for Initial Evaluation
34
Appendix G3. Provider Distribution for Consult (Excluding Attendings)
Appendix G4. Provider Distribution for Consult with Attending
Appendix G5. Provider Distribution for Review Chart
35
Appendix G6. Provider Distribution for General Charting
Appendix G7. Provider Distribution for Write Orders
Appendix G8. Provider Distribution for Disposition
36
Appendix H. Patient Acuity Distributions
Appendix H1. Patient Acuity Distribution for Evaluation
Appendix H2. Patient Acuity Distribution for Initial Evaluation
Appendix H3. Patient Acuity Distribution for Consult (Excluding Attending)
37
Appendix H4. Patient Acuity Distribution for Consult with Attending
Appendix H5. Patient Acuity Distribution for Review Chart
Appendix H6. Patient Acuity Distribution for General Charting
38
Appendix H7. Patient Acuity Distribution for Write Orders
Appendix H8. Patient Acuity Distribution for Disposition
39
Appendix I. Enhanced Value Stream Map - Provider Perspective
40
Appendix J. Provider Level to Time from 1st Contact to Disposition for Admissions Patients
41
Appendix K. Provider Level to Time from 1st Contact to Disposition for Discharge Patients
42