Embed Size (px)
Citation preview

www.pwc.pl
Stabilisation of both level and structure of the executive remuneration
Non-aggressive approach towards structuring the executive remuneration package
LTIPs offered in less than half of the largest listed companies
Executive compensation at keylisted companies in 2013How does executive compensation change?


1.PwC, August 2014
Introduction 3.
About the survey 4.
Summary 5.
Changes in the remuneration paid to top management 7.
Remuneration package components 9.
Remuneration levels 14.
Appendix 27.
Survey methodology 28.
Important acronyms, terms and definitions 30.
Contact 32.
Table of contents


I do hope that it will bring an inspiration and support for the process of designing remuneration policies for executive teams in your companies.
A comprehensive look at companies listed on the Warsaw Stock Exchange indicates a stabilisation of remuneration of the executives. Furthermore, it is apparent that increasingly often compensation reflects the companies’ performance, which is a highlypositive trend, in particular for shareholders. It means that the compensation systemsare flexible and allow for adjusting compensation levels of Management Board members to variable performances of a company.
Moreover, the fact that remuneration in companies with a significant State Treasuryownership may be determined in accordance with the market practice (or as close to market practice as possible) allows the compensations to match business results.
Taking into account current trends, I would not expect significant changes in both levels and structure of the executive compensation package, unless we will face the unexpected, significant changes in the economic situation in Poland.
I hope you will find this report interesting.
Kind regards,
I am pleased to present you with the fourth edition of PwC survey on executive compensationat key listed companies.
3.PwC, August 2014
Introduction
Tomasz Barańczyk
Managing Partner, PwC Tax and Legal Department

The survey covered companies from the three following Warsaw Stock Exchange indices: WIG20, mWIG40 and sWIG80 (according to the composition of the indices as at 31 December 2013)2. The comparisons with 2012 are based on data relating to the remuneration of the Management Board members of those companies in 2012.All pay data were extracted from financial statements and directors’ reports on the company’s activity for the analysed years. PwC experts, with executive compensationbackground, commented on the data.
Depending on the quality of available data, the analyses presented in the report covered the entire sample or only its fragment (refer to the section ‘Survey methodology’in the appendix for detailed information about the approach applied).
The report consists of the following three main parts:
1. Changes in executive compensation – covering executive compensation market changes against previous year and future trends;
2. Compensation package – covering the outcome of PwC’s analysis of typical executive package components;
3. Pay levels – covering the results of various PwC analyses on executive compensation package value depending on different differentiating factors.
The report1 summarises a survey conducted by PwC on executive compensation at key listed companies in 2013. Its key findings cover trends in executive compensation and changes in both the structureand level of the remuneration package that occurred between2012 and 2013.
4. Executive compensation at key listed companies in 2013
About the survey
1 The report is available at: http://www.pwc.pl/en/publikacje/wynagrodzenia_zarzadow_2013.jhtml
2 Effectively, the survey covered 136 companies. From among 140 analysed companies, three companies did not disclosed remunerationof the individual Management Board members; one company failed to publish a report for 2013 as at the date of finalising the survey(detailed information may be found in the ‘Survey methodology’ section in the appendix). Those companies were excluded from the survey.

In 2013, CEOs of these companies earned on average ca. 1% less than in 2012. The average remuneration of Management Board members (other than CEOs) decreased by ca. 2%. This means that, in line with the economic situation and companies’ performance, executives’ compensation levels have stabilised as well.
Such stabilisation, observed already in 2012, concerns not only the level but also thestructure of the executive compensation package. The share of base salary and bonusesin the short-term remuneration has remained stable at ca. 55% and 30%, respectively.
The relatively non-aggressive approach towards the structure of executive remuneration is in line with remuneration-related risk reducing trend, which can be observed in public companies. In Poland, it concerns mainly companies from the financial sector (banks and brokerage houses), which results from regulatory requirements introduced in the previous years3. Such an approach to structuring the package of executives’ remuneration corresponds to their expectations. In great majority of cases, executives are not willing to take risk when it comes to their own remuneration.
Still less than half of companies offer their executives participation in long-term incentive plans (LTIP). In 2013, the popularity of such plans amounted to ca. 40%, i.e. similarly to previous years. This may raise concerns of the shareholders,as a well-structured LTIP limits the risks brought about by the annual bonus, e.g. therisk of focusing on the current year at the expense of long-term, sustainable growth of the company.
The regulations covering banking sector (mentioned above) have increased the frequency of application of phantom shares in long-term incentive plans among key listed companies from 2% in 2012 to 15% in 2013. However, managerial stock options are still the most popular payment vehicle, applied in ca. 60% of such plans.
Alike previous editions of the PwC survey, this one confirms that on average larger companies offer higher remuneration to their executives. It concerns mainly base salaries,which correlate with the companies’ market capitalisation to the greatest extent.
The level of remuneration of Management Board members of key listed companies vary as to the company’s ownership structure as well. Until recently, the highest impactof the ownership structure could have been observed in companies with a significantshare of the State Treasury in the shareholding structure. In 2012, WIG20 companieswith a significant State Treasury ownership offered on average remuneration lower by ca. 10% than other companies included in this index. This difference was even biggeramong mWIG4o companies, and in 2012 it amounted to c.a. 30%. However, in 2013 the difference between remuneration of executives of companies with a significant share of the State Treasury in the shareholding structure and of private sector companiesdecreased significantly, and among WIG20 companies it virtually ceased to exist.
5.PwC, August 2014
Summary
A year-to-year comparison of executive compensation of major companies listed on theWarsaw Stock Exchange indicatesthat its dynamics decreases.
3 Resolution No 258/2011 of the Polish Financial Supervision Authority of 4 October 2011 on (...) the principles of establishing the policy for variable components of remunerations of executives at banks and Regulation of the Minister of Finance of 2 December2011 on the principles of establishing brokerage houses’ policy for variable components of remuneration of executives.
30%bonus
55%base salary
Share of base salary and bonus has stabilised at ca.55% and 30% respectively
The impact of the ownership structure on the remuneration of top executives in organisations with a private majority shareholder is worth noting as well. The CEOs who at the same time are the owners of the companies they hold office at receive higher remuneration (ca. 8% among mWIG40 companies and ca. 30% among sWiG80 companies) than their counterparts without majority stock in the companies presided by them.
The top ten best paying industries in 2013 covers practically the same sectors as in theprevious years. Media industry has remained a leader as to the average short-term remuneration of Management Board members (this year it is formally second to the insurance sector, which is, however, represented by a single company only). Also the banking sector was again present among the industries offering the highest average remuneration. Interestingly, the fuel sector was the one to record one of thehighest increases of remuneration in 2013 compared to 2012 (ca. 32%) and ranked 5th,up from the 9th position. Such a change results from the payment of bonuses related to the improved companies’ performance. The most noticeable decrease of the averageremuneration level in 2013 was reported in the metal sector. Here the remuneration of Management Board members decreased by about 47% compared to 2012 and the industry dropped by 8 places in the ranking, landing at the 13th position (as comparedto the 5th in 2012).
The annual short-term remuneration of the ten best paid CEOs in 2013 was within a range of approximately PLN 3.4 million to approximately PLN 8.1 million, with the average amounting to approximately PLN 5.2 million. Average remuneration in this group was almost identical to the one in 2012.
The average annual short-term remuneration of a Management Board member of ten companies offering the highest pay in 2013 was within a range of approximately PLN 1.7 million to approximately PLN 3.1 million, with the average amounting to approximately PLN 2.1 million (similar to the one in 2012). This average is over twotimes higher than the average among Management Board members (excluding CEOs)in the whole survey sample.
6. Executive compensation at key listed companies in 2013
media
banking sector
The best paying industries in 2013
32%increase
The most noticeable increase of remuneration in 2013 was reported in the fuel sector (ca. 32%)

Changes in the remuneration level
In 2013, the average level of remuneration of top executives was practically the same as in 2012. This marks continuation of the trend already observed in the previous edition of the PwC survey4.
In 2013, the total short-term remuneration of Management Board members decreasedon average by 2% compared to the previous year. The CEOs of analysed companiesearned on average ca. PLN 1.5 million each, i.e. by ca. 1% less than in 2012. The level of short-term remuneration of other Management Board members decreasedby 2%, from ca. PLN 1.08 million in 2012 to ca. PLN 1.06 million in 2013. The growthrate of remuneration, almost identical for CEOs and other Management Board members, results in a steady difference of remuneration levels at those positions at ca. 40% for yet another year.
Although in previous editions of PwC survey the remuneration of Management Boardmembers grew faster than those of other employees, in 2013 a reverse trend was observed.It may result from a closer link of executives’ remuneration with the companies’ performance, which is less of an issue at positions lower in the organisational structure.These are in turn strongly associated with the economic situation on national and locallevel. It is worth noting that performance of the companies, after reaching its lowest in 2009, has been growing systematically for the past two years. Similar changes may be noted in the case of the remuneration of Management Board members of key listedcompanies. The recent stabilisation of the companies’ performance resulted in a lack of significant growth or decrease of executive remuneration. At the same time, the costsof remuneration in the analysed companies increased by ca. 5% (faster than in 2012),while the market remuneration indices – by ca. 3%-3.5% (similar to the ones in 2012).
7.PwC, August 2014
Changes in the remuneration paid to top management
4 Previous edition of the survey available at the PwC website:http://www.pwc.pl/pl/publikacje/wynagrodzenia_zarzadow_2012.jhtml
Table 1. Comparison of changes in the average remuneration of executives in 2012 and 2013 according to position held
Average annual remuneration of executives
Position 2013 (PLN) 2012 (PLN) Change in 2013 as compared to 2012
CEO 1,510,000 1,520,000 -1%
Management Board member 1,060,000 1,080,000 -2%
Total 1,170,000 1,190,000 -2%
Source: PwC analysis based on financial statements and reports of Management Boards on the analysed companies’ activities for the years 2012 and 2013.
Table 2. Comparison of changes in values of remuneration indices
Index Change of the value comparing with 2012
Costs of remuneration in analysed companies 5.1%
Average monthly gross remuneration in the enterprise sector 2.9%
Average monthly remuneration in the national economy 3.6%
Source: PwC analysis based on financial statements and reports of Management Boards on the analysed companies’ activities for 2012-2013 and Communiques and announcements of the President of the Central Statistical Office (GUS) in 2012 and 2013.
This year’s edition of PwC survey on executive compensation at key listed companies confirms that its dynamics decreases.

8. Executive compensation at key listed companies in 2013
5 Directive 2013/36/EU of the European Parliament and of the Council of 26 June 2013 on access to the activity of credit institutions and the prudential supervision of credit institutions and investment firms, amending Directive 2002/87/EC and repealing Directives2006/48/EC and 2006/49/EC.
Based on previous changes in the remuneration of top executives and economic growthforecast for Poland, in the years to come we can expect stabilisation of both the levels and the structure of remunerationof Management Board members of key listed companies.
Trends
Ca. 3%-5% growth of base salary and an unchanged level of the target variable pay may also be expected. Hence, the actual share of the bonus paid in the short-term remuneration package in the following years will depend not on the change in the approach to executives’ motivation, but on the actual performance achieved by the companies.
In the near future, trends observed over the past few years are likely to intensify. In particular, grater interest in application of strictly defined performance conditionslinked to company’s strategy for the purposes of determining the amount of bonuses of Management Board members, along with the decrease of popularity of purely discretionary incentive plans. Such solutions are more and more commonly preferredby both Supervisory Boards and Management Boards.
In a short term, the popularity of long-term incentive plans is not likely to change in any significant manner. Larger changes in this respect may result from the extensionof regulatory requirements in the area of remuneration policy to non-financial sectors (which should not take place in the nearest future) and the gradual diffusion of remuneration-related practices from the mature markets to the Polish one. Furthermore, it can be expected that the management stock options will remain themost popular payment vehicle in such plans. Further growth of popularity of phantomshares is rather unlikely.
In case of current cash-based incentive plans, a growing interest in derivative financialinstruments (which link level of the award with the financial measures achieved) may be expected.
In the long term, more women are expected to hold positions in Management Boards of key listed companies. Even now, the European Union is drawing banks’ attention to this issue. The CRD45 Directive, implemented in June 2013, orders Member States to promote diversity in management bodies of financial institutions. Although at thismoment the share of women in Management Boards of banks is higher than in othersectors, the implementation of the diversity policy may still prove to be a challenge.

Package structure
Stabilisation of top executives’ remuneration, observed already in 2013, concerns not only the level but also the structure of the short-term remuneration package of the Management Board members of key listed companies.
In 2013, base salary amounted to ca. 56% of the short-term remuneration package. The share of bonuses amounted to ca. 32%, i.e. within the range considered permanentfor the Polish market for several years now (30%-40%). The remaining part (i.e. ca. 12%) comprised benefits and remuneration for holding positions in subsidiariesand related entities.
9.PwC, August 2014
Remuneration package components
Graph 1. Changes in the structure of short-term remuneration package of executives in 2013 as compared to 2012
Stanowisko 2013 (zł) 2012 (zł) Zmiana 2013 w stosunku do 2012
It should be noted that the above analysis is based on data for 35 companies for 2012 and for 36 companies for 2013, which disclosed the value of remuneration of Management Board members divided into particular package components in their financial reports.
Financial statements and directors’ reports on the company's activity of the vast majority(75%) of the analysed companies do not contain information on the distribution of total remuneration among its major components (fixed part and variable part), not to mention the remuneration policy or the parameters which the variable remuneration is subject to.
The low level of remunerationdata disclosure may disturbshareholders.
2012 2013
60%
100%
Base pay
4%
Annual bonus and rewards
Other benefits
80%
40%
20%
0%
56%
33%
8%
5%
56%
32%
7%
Compensation from subsidiaresand related entities
Source: PwC’s analysis based on financial statements and directors’ reports on the analysed companies’ activity for 2012 and 2013.

10. Executive compensation at key listed companies in 2013
6 This applies to 3 banks which provided information on remuneration divided into particular components and paid out bonuses, and which were included in the analysed indices in 2013.
For the past few years, the relatively non-aggressive approach towards motivating executives among WSE listed companies remains unchanged. This is typical for manycountries in our region. For instance, in Hungary the share of the base salary in the remuneration package of CEOs amounts on average to ca. 60%, and for other Management Board members even to ca. 70%. Similarly, in Romania fixed remunerationamounts to ca. 70% of the salary executive package, and bonuses – to ca. 20%. In Russia, the base salary typically comprises 50% of the short-term remuneration package. Conversely, on the Western markets, the variable remuneration stands for a much larger share in the total remuneration package than in Poland.
In this context, a slowdown in the growth of companies’ performance in 2012 and 2013compared to 2011, should be noted. Also for this reason (next to the non-aggressive approach to structuring the remuneration packages of Management Board members),the level of bonuses and the share of the variable component in the total remunerationhave remained unchanged since 2011.
This is also is in line with remuneration-related risk reducing trend, which can be observed in public companies. For instance, for the banking sector, the European Unionrecommends a cap on the variable remuneration amounting to the annual base salary.However, for Polish banks, such a limit is usually a strictly theoretical one. In 2012, the average level of bonus expressed as a percentage of annual base salary at the bankslisted on the three major WSE indices amounted to about 60%6. Only several people received variable remuneration exceeding the annual base salary.

This resulted, however, from additional payments provided under additional incentive schemes, e.g. the so-called transaction bonus. A similar situation took place in the analysed period. However, in 2013 for the first time we witnessed the results of the implementation the Polish Financial Supervision Authority’s requirements as to the variable remuneration policy, which apply to, among other, banks’ ManagementBoard members. Those requirements imposed i.a. partial deferral of the bonus, which means that remuneration data for 2013 for bankers may cover only a part of the variable pay they have actually been granted.
The relatively non-aggressive approach towards structuring the remuneration packageis likely to be maintained on the Polish market in the coming years, which is consistentwith the expectations of executives. In vast majority, they are unwilling to take risk with regard to their remuneration7. In this context, the increase in the share of variableremuneration (at risk) in the total package is not necessarily leading to increased satisfaction of executives.
Long-term incentive Plans
This year’s edition of PwC survey indicates that still less than half of companies offerlong-term incentives to their executives. In 2013, the popularity of the long-term incentive plans (LTIPs) amounted to ca. 40%, i.e. similarly to previous years.
11.PwC, August 2014
Graph 2. Companies offering LTIP in 2012 and 2013 and popularity of different forms of awards
Stanowisko 2013 (zł) 2012 (zł) Zmiana 2013 w stosunku do 2012
2012 2013
60%
100%
SharesCompanies offering LTIP
80%
40%
20%
0%
34%
66%
Phantom shares
69%11%
18%
Companies not offering LTIP Share options/Warrants
41%
63%
2%
Other
58%
15%
14%
12%
Source: PwC’s analysis based on financial statements and directors’ reports on the analysed companies’ activity for 2012 and 2013.
7 Research paper by PwC and the London School of Economics and Political Science: “Making executive pay work. The psychology of incentives”. Report available at the PwC website http://www.pwc.pl/pl/publikacje/making-executive-pay-work.jhtml
Regulatory requirements introduced in 20118, imposing on selected financial institutions an obligation to pay a part of variable remuneration in a financial instrument and to defer that payment in time, have, so far, not led to a significant increase in the popularity of LTIP. This is mainly due to the fact that the banks listed in the three analysed WSE indices, being i.a. subject to this regulation, have previously applied other long-term incentives. Hence, the above regulation did not increase the popularity of LTIP.
Limited popularity of long term incentive plans may raise concerns of the shareholders.In more developed financial markets such mechanisms are applied in practically all public companies. On the other hand, as compared to other countries of the CEE region,LTIPs are relatively popular in Poland. For instance, in the Czech Republic, Russia, Romania or Hungary, the percentage of companies offering long-term incentive plans to their executives does not exceed 30%. However, it should be noted that long termplans are not without certain limitations. For example, the PwC research on the psychology of incentives shows that executives perceive deferred payments as havingconsiderably lower value than their real economic or accounting value and thus appreciate participation in such plans as a recognition rather than motivation. However, resignation from such plans is not beneficial for shareholders, as a well-structured LTIP limits the risks brought about by the annual bonus, e.g. the risk of focusing on the current year at the expense of long-term, sustainablegrowth of the company.
Although this aspect of the long-term incentive plans is not the most important one, it should be noted that in the case of plans based on financial instruments (e.g. shares)or derivatives (share options, phantom shares, instruments based on financial measures,etc.), there is a possibility of taxing such remuneration at the 19% rate as for capitalgains instead of progressive rate up to 32% applicable to employment income.
In this context, banks have resigned from LTPIs based on shares of foreign parent companies, mostly in favour of phantom plans based on own shares. This resulted in increased popularity of phantom share-based LTIPs among key listed companies from 2% in 2012 to 15% in 2013. Similarly in the Czech Republic, also as a result of regulatory requirements under CRD39, an increase of phantom share schemes was observed, form ca. 10% in 2012 to ca. 16% in 2013.
However, as to the choice of the LTIP payment vehicle, Polish companies still differmuch from the Western markets, where performance shares plans are typically applied.The most popular form of long-term incentives among companies from the analysedWSE indices are still share options schemes (usually for shares of a new issue), whichare applied in about 60% of such incentives. Although in the Czech Republic the marketpractice is vastly similar to the Polish one (i.e. share options are applied in ca. 64%LTIPs), in Russia only ca. 15% of companies applied share option schemes. Phantomshare plans and cash plans (ca. 30% of plans each) are much more popular there. In Romania, along share options, restricted stock units (RSU) are also popular – both instruments are applied in ca. 30% of LTIPs.
12. Executive compensation at key listed companies in 2013
An evident effect of the implementation of the regulatory requirements mentioned above is a change in payment vehicle applied in long-term incentives.

For the last several years, the set of the most popular performance conditions, on the achievement of which the level of reward depends, has solidified. Net profit and Earnings before Interest, Taxes, Depreciation and Amortization (EBITDA)10 werethe most popular long-term measures. It should be noted that in most cases those performance criteria were supplemented by other financial measures, such as shareprice or Earnings per Share (EPS). It is also worth mentioning that individual objectives, particularly related to gaining a vote of acceptance for the duties fulfilled,are becoming increasingly important. Supervisory Boards also use long-term plans as a helpful tool to retain top management. Besides the achievement of performanceconditions, the payment of reward is usually subject to continuous employment.
13.PwC, August 2014
8 Resolution No 258/2011 of the Polish Financial Supervision Authority of 4 October 2011 on detailed principles of operation of the risk management system and internal control system and detailed requirements for assessing internal capital by banks and conducting reviews of the process of assessing and maintaining internal capital and the principles of establishment of the policy for variable components of remuneration of banks’ executives.
9 Directive of the European Parliament and of the Council 2010/76/EU of 24 November 2010, amending Directive 2006/48/EC and 2006/49/EC in the scope of capital requirements pertaining to the trading portfolio and resecuritisation and supervisory review of remuneration policy.
10 Applies to 40 companies which provided data on performance criteria used in long-term incentive plans for Management Board members.
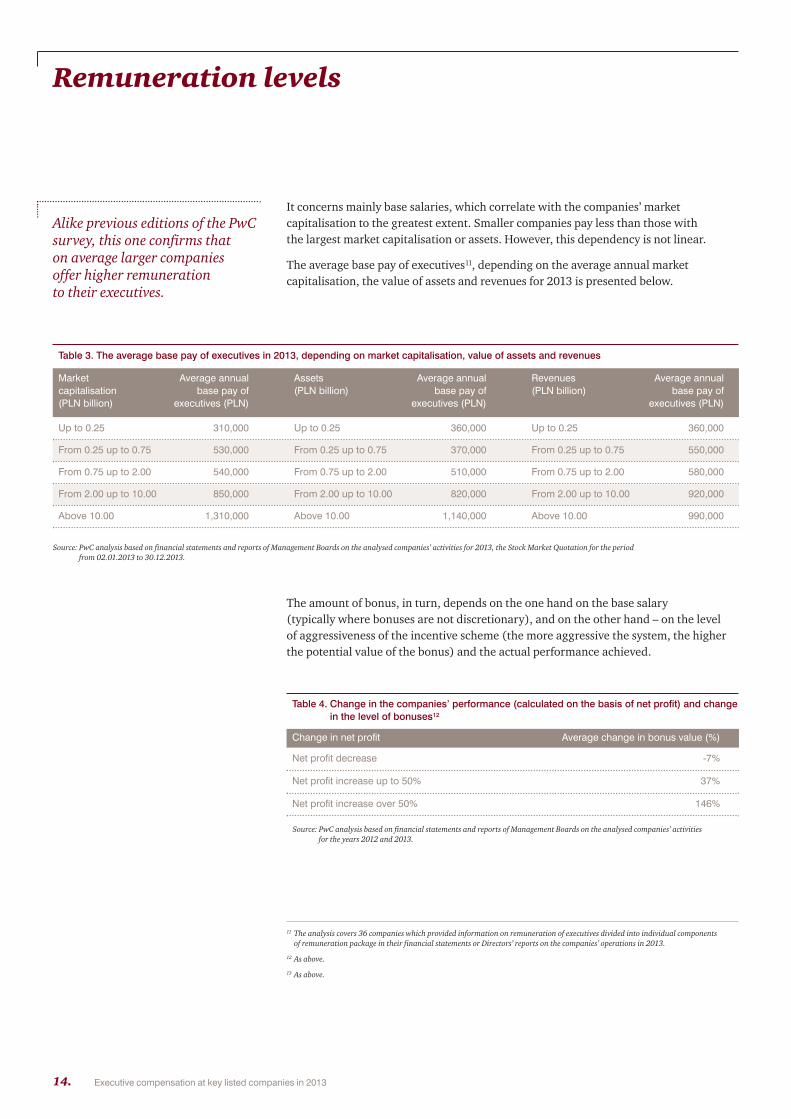
It concerns mainly base salaries, which correlate with the companies’ market capitalisation to the greatest extent. Smaller companies pay less than those with the largest market capitalisation or assets. However, this dependency is not linear.
The average base pay of executives11, depending on the average annual market capitalisation, the value of assets and revenues for 2013 is presented below.
The amount of bonus, in turn, depends on the one hand on the base salary (typically where bonuses are not discretionary), and on the other hand – on the level of aggressiveness of the incentive scheme (the more aggressive the system, the higherthe potential value of the bonus) and the actual performance achieved.
Alike previous editions of the PwCsurvey, this one confirms that on average larger companies offer higher remuneration to their executives.
14. Executive compensation at key listed companies in 2013
Remuneration levels
Table 3. The average base pay of executives in 2013, depending on market capitalisation, value of assets and revenues
Stanowisko 2013 (zł) 2012 (zł) Zmiana 2013 w stosunku do 2012Market Average annual Assets Average annual Revenues Average annual capitalisation base pay of (PLN billion) base pay of (PLN billion) base pay of (PLN billion) executives (PLN) executives (PLN) executives (PLN)
Up to 0.25 310,000 Up to 0.25 360,000 Up to 0.25 360,000
From 0.25 up to 0.75 530,000 From 0.25 up to 0.75 370,000 From 0.25 up to 0.75 550,000
From 0.75 up to 2.00 540,000 From 0.75 up to 2.00 510,000 From 0.75 up to 2.00 580,000
From 2.00 up to 10.00 850,000 From 2.00 up to 10.00 820,000 From 2.00 up to 10.00 920,000
Above 10.00 1,310,000 Above 10.00 1,140,000 Above 10.00 990,000
Source: PwC analysis based on financial statements and reports of Management Boards on the analysed companies’ activities for 2013, the Stock Market Quotation for the period from 02.01.2013 to 30.12.2013.
Table 4. Change in the companies’ performance (calculated on the basis of net profit) and changein the level of bonuses12
Change in net profit Average change in bonus value (%)
Net profit decrease -7%
Net profit increase up to 50% 37%
Net profit increase over 50% 146%
Source: PwC analysis based on financial statements and reports of Management Boards on the analysed companies’ activities for the years 2012 and 2013.
11 The analysis covers 36 companies which provided information on remuneration of executives divided into individual components of remuneration package in their financial statements or Directors’ reports on the companies’ operations in 2013.
12 As above.
13 As above.

In absolute values, in 2013 average base pay of Management Board members increasedon average by ca. 4% compared to the previous year, while the average level of bonusdecreased by ca. 9%13. The decrease of the variable pay of top management is strictly related to the economic situation and the financial performance of companies. In 2013,stable performance of companies resulted in the decrease of the average level of bonusesas compared to the previous years, when it was justified by improved performance afterthe recession.
15.PwC, August 2014
5%
Annual bonus and rewards
10%-10% -5% 0%
4%
Base pay
-9%
Source: PwC’s analysis based on financial statements and directors’ reports on the analysed companies’ activity for 2012 and 2013.
Graph 3. Change in the growth rate of particular components of the short-term remuneration package of executives in 2013 compared to 2012
Stanowisko 2013 (zł) 2012 (zł) Zmiana 2013 w stosunku do 2012

Remuneration of Management Board Members in particularstock exchange indices
The size of a company on the WSE is reflected in the stock index it’s assigned to. The analysis of the remuneration of Management Board members depending on WSEindex confirms that the level of remuneration is linked to the size of the company.
In 2013, WIG20 companies (ca. 6 times larger than mWIG40 companies and 30 timeslarger than sWIG80 companies as to their market capitalisation and the value of theirassets) paid their Management Board members on average ca. PLN 1.78 million a yearper one Member, i.e. 1.4 times more than mWIG40 companies (where the average annual short-term remuneration of a Management Board member in 2013 amounted to ca. PLN 1.24 million) and about 2 times more than the analysed sWIG80 companies (where the average annual short-term remuneration in 2013 amounted to ca. PLN 0.89 million). It is worth noting that proportions in levels of remuneration of executives depending on the company size measured with the allocation to a givenstock exchange index have remained almost unchanged over the past several years.
16. Executive compensation at key listed companies in 2013
-5 5 10 15 20
10
20
30
40
50
60
Market capitalisation (PLN billion)
Asse
ts (P
LN b
illio
n)
70
25
Size of the sphere reflects the value of the average annual executive short-term remuneration in 2013.
WIG201,78 mln
mWIG401,24 mln
sWIG800,89 mln
0
Source: PwC’s analysis based on financial statements and directors’ reports on the analysed companies’ activity for 2013, Stock Market Quotation for the period from 02.01.2013 to 30.12.2013.
Graph 4. Average annual short-term remuneration of executives in 2013 versus value of market capitalisation and assets depending on the WSE index
Stanowisko 2013 (zł) 2012 (zł) Zmiana 2013 w stosunku do 2012
Table 5. Comparison of average value of market capitalisation, assets and short-term remuneration in mWIG40 and sWIG80 indices with the values in WIG20 index in 2013 (multiplicity)
WSE indices compared Market capitalisation Assets Remuneration
WIG20 versus mWIG40 6.7 5.9 1.4
WIG20 versus sWIG80 33.3 33.4 2.0
Source: PwC analysis based on financial statements and reports of Management Boards on the analysed companies’ activities for 2013,the Stock Market Quotation for the period from 02.01.2013 to 30.12.2013.
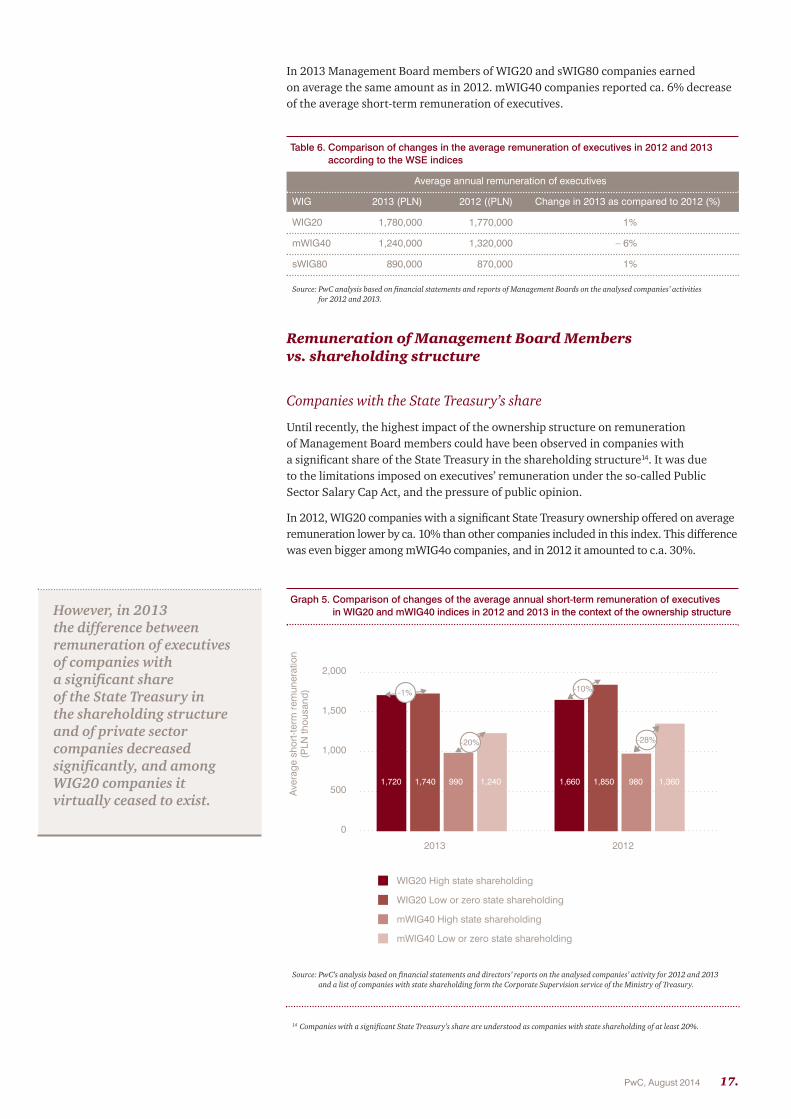
In 2013 Management Board members of WIG20 and sWIG80 companies earned on average the same amount as in 2012. mWIG40 companies reported ca. 6% decreaseof the average short-term remuneration of executives.
Remuneration of Management Board Members vs. shareholding structure
Companies with the State Treasury’s share
Until recently, the highest impact of the ownership structure on remuneration of Management Board members could have been observed in companies with a significant share of the State Treasury in the shareholding structure14. It was due to the limitations imposed on executives’ remuneration under the so-called Public Sector Salary Cap Act, and the pressure of public opinion.
In 2012, WIG20 companies with a significant State Treasury ownership offered on averageremuneration lower by ca. 10% than other companies included in this index. This differencewas even bigger among mWIG4o companies, and in 2012 it amounted to c.a. 30%.
17.PwC, August 2014
2013 2012
1,500
2,000
1,000
500
0
Aver
age
shor
t-ter
m re
mun
erat
ion
(PLN
thou
sand
)
1,720 1,740 990 1,240 1,660 1,850 980 1,360
-1%
-20%
-10%
-28%
mWIG40 Low or zero state shareholding
mWIG40 High state shareholding
WIG20 Low or zero state shareholding
WIG20 High state shareholding
Source: PwC’s analysis based on financial statements and directors’ reports on the analysed companies’ activity for 2012 and 2013 and a list of companies with state shareholding form the Corporate Supervision service of the Ministry of Treasury.
Graph 5. Comparison of changes of the average annual short-term remuneration of executives in WIG20 and mWIG40 indices in 2012 and 2013 in the context of the ownership structure
Stanowisko 2013 (zł) 2012 (zł) Zmiana 2013 w stosunku do 2012
Source: PwC analysis based on financial statements and reports of Management Boards on the analysed companies’ activities for 2012 and 2013.
Table 6. Comparison of changes in the average remuneration of executives in 2012 and 2013 according to the WSE indices
Average annual remuneration of executives
WIG 2013 (PLN) 2012 ((PLN) Change in 2013 as compared to 2012 (%)
WIG20 1,780,000 1,770,000 1%
mWIG40 1,240,000 1,320,000 – 6%
sWIG80 890,000 870,000 1%
However, in 2013 the difference between remuneration of executives of companies with a significant share of the State Treasury in the shareholding structure and of private sector companies decreased significantly, and among WIG20 companies it virtually ceased to exist.
14 Companies with a significant State Treasury’s share are understood as companies with state shareholding of at least 20%.

This decrease is due to increasing popularity of management contracts in companieswith the significant state shareholding. This was encouraged directly by the Ministry of Treasury, which, noting the need to determine remuneration of executives in companies controlled by the State in accordance with the market practice, publishedin April 2013 the “Best Practices for determining executive remuneration levels andcomponents in case of concluding management contracts with members of managementboards of selected companies with Treasury shareholding”. According to these “Best Practices”, remuneration based on management contracts should be motivationalin nature and should not deviate, in terms of its level and structure, from the marketpractice. This resulted in a gradual replacement of discretionary awards with incentiveschemes based on performance conditions. Such a change creates good environment for the growth of companies which are key to the Polish economy.
CEO as the majority shareholder
Another dimension of ownership structure which affects the level of remunerations of executives is the owner holding an office in the Management Board. It could seemthat the CEO who at the same time is the majority shareholder, he/she would have a lower remuneration for holding the office in the Management Board (and would benefit from the majority shareholding and dividends) as compared to CEOs who are not owners. However, it turns out that among key listed companies, the situation is quite different.
In 2013, the CEOs of mWIG40 companies, being owners of the companies they holdtheir offices in, received remuneration higher by ca. 8% than their counterparts without majority shareholding the companies they managed. At the same time, theyheld shares of the average value of PLN 550 million15 (three times more than shares held by mWIG40 CEOs who do not own presided companies).
In the case of sWIG80 companies, those differences are even more pronounced. The average level of remuneration of “CEOs-owners” was by ca. 30% higher, and the stock owned by them worth 5 times more than in the case of “CEOs-non-owners”from this index.
18. Executive compensation at key listed companies in 2013
Source: PwC analysis based on financial statements and reports of Management Boards on the analysed companies’ activities for 2013.
Table 7. Comparison of the amounts of short-term remunerations and the value of stock held by CEOs who are not majority shareholders, as per WSE indices
WIG CEO who is a majority CEO who is not a Differenceshareholder majority shareholder
Average annual 2,040,000 1,890,000 8%short-term remuneration
Average value 552,370,000 120,550,000 358%of shares held
Average annual 1,370,000 1,060,000 29%short-term remuneration
Average value 95,560,000 14,100,000 578%of shares held
mWIG40
sWIG80
15 Calculated as the product of the number of shares held by a CEO and the share price as at the balance sheet date.

Remuneration of Management Board Members in particular industries
The average annual short-term remuneration of executives depending on the industry is presented below.
The top ten best paying industries in 2013 covers practically the same sectors as in theprevious years. Some distortions in the ranking may be caused by sectors representedon the WSE by individual companies only, which means that e.g. an exceptionally highbonus may move the entire industry upwards by a few ranks.
19.PwC, August 2014
010 15
20
40
60
80
100
Market capitalisation (PLN billion)
Asse
ts (P
LN b
illio
n)
Fuel
Insurance
Banks
20
Resources
Size of the sphere reflects the value of the average annual executive short-term remuneration in 2013.
25 30 3550
Media
Telecommunications
Energy
40 45-5
Wood & Paper
Source: PwC’s analysis based on financial statements and directors’ reports on the analysed companies’ activity for 2013, Stock Market Quotation for the period from 02.01.2013 to 30.12.2013.
Graph 6. Average annual short-term remuneration of executives in 2013 versus value of marketcapitalisation and assets depending on industry
Stanowisko 2013 (zł) 2012 (zł) Zmiana 2013 w stosunku do 2012

20. Executive compensation at key listed companies in 2013
Table 8. Comparison of changes in the average executive remuneration in 2012 and 2013 per particular industries16
insurance 1 1 4 3 2,300 1,700 36%
media 4 2 1 -1 2,200 2,600 -16%
wood & paper 2 3 7 4 2,000 1,400 40%
banks 12 4 2 -2 1,900 2,000 -4%
fuel 4 5 9 4 1,800 1,300 32%
telecommunications 1 6 3 -3 1,400 1,700 -18%
IT 10 7 6 -1 1,300 1,400 -8%
retail trade 6 8 12 4 1,200 1,000 21%
resources 3 9 10 1 1,200 1,000 16%
energy 4 10 8 -2 1,100 1,400 -20%
developers 7 11 15 4 900 900 2%
automotive 4 12 18 6 900 700 23%
metals 6 13 5 -8 900 1,700 -47%
hotels & restaurants 3 14 16 2 800 900 -9%
constructions 5 15 17 2 800 800 5%
food 7 16 11 -5 800 1,000 -22%
chemical 3 17 13 -4 800 1,000 -19%
capital market 4 18 14 -4 800 1,000 -19%
electro engineering 8 19 19 0 800 700 8%
wholesale trade 7 20 20 0 700 600 23%
plastic materials 1 21 24 3 600 400 58%
building materials 3 22 23 1 600 500 32%
services other 6 23 21 -2 600 600 13%
finance other 3 24 22 -2 500 500 13%
pharmaceutical 2 25 25 0 400 400 7%
light 2 26 26 0 200 300 -31%
Source: PwC analysis based on financial statements and reports of Management Boards on the analysed companies’ activities for 2012 and 2013.
Sector Number of companies analysed in the
given sector
Place in ranking
2013 2012 Change 2013 (PLN ‘000) 2012 (PLN ‘000) Change (%)
Average annual remuneration of executives
16 The top five in the industry ranking is in bold, excluding industries represented by less than 4 companies.

21.PwC, August 2014
17 More details on the report available at http://www.pwc.com/outlook.
Media industry has remained a leader as to the average short-term remuneration of Management Board members (this year it is formally second to the insurance sector,which is, however, represented by a single company only). It should be noted that themedia industry retained its rank despite a ca. 16% decrease of the average short-termremuneration in this sector compared to 2012.
The high level of executive remuneration in media is largely a result of the high degree of complexity of the business carried out by the Management Board membersand its growth rate. According to the PwC “Global Entertainment and Media Outlook2012-2016”17 report, the Polish media market will grow by 3.7% per annum in the next 5 years, reaching the value of USD 12.6 billion in 2018. Traditional media will continueto have the major share in revenues, however, the growth will be fostered by digitalmedia and online advertising. To quote the authors of the above mentioned report: “In the years to come, the condition of the entertainment and media market will be affectedby two main factors: ongoing digitalisation and the growing importance of mobile devices”.The growing level of business complexity will help media industry maintain its leadership among best-paying industries in the future editions of PwC survey.
Also the banking sector, with the average short-term remuneration amounting to ca. PLN 1.9 million, i.e. a decrease by ca. 4% compared to 2012, was again presentamong the industries offering the highest average remuneration (ranked fourth thisyear as wood & paper industry, represented by 2 companies only, has moved upward).This decrease is a result of introducing the deferred bonus schemes, under which bonuswill be paid out over the next 3 years. In real terms, remuneration is this sector is likelyto have increased, however, it is hard to estimate the scale of this change.
Interestingly, the fuel sector was the one to record one of the highest increases of remuneration in 2013 compared to 2012 (ca. 32%) and ranked 5th, up from the 9thposition. This sector, despite its size, has so far offered relatively low remuneration to executives. Some of the analysed companies in the fuel industry have a significantshare of the State Treasury in the shareholder structure. This determined the relativelylow level of remuneration of Management Board members, compared to other industriesand in the context of the value of market capitalisation and assets of the companies in this sector. Such a significant increase of executive remuneration in the fuel companiesresults from the payment of bonuses related to the improved companies’ performance.
The most noticeable decrease of the average remuneration level in 2013 was reported in the metal sector. Here the remuneration of Management Board members decreasedby about 47% compared to 2012 and the industry dropped by 8 places in the ranking,landing at the 13th position (as compared to the 5th in 2012). High decreases were also observed in the energy and food sectors.

Level of remunerations depending on the position in the Management Board
Executive remuneration shows differences depending on the area supervised by the individual Management Board members.
In 2013, Management Board members responsible for finance and investment banking received the highest (after CEOs) average annual short-term remuneration as compared to remuneration of Management Board members who supervised other areas. Relatively lowest remuneration received Management Board members responsible for operations and organisational and legal matters.
Level of remunerations and demography
The level of remunerations of Management Board members varies also as to demography.In 2013, in the key companies listed on the WSE with both men and women in theirManagement Boards, the average short-term remuneration of men was higher by ca. 25%. This difference is much higher in this sample than the average difference indicated in a report by the European Commission20 for Poland and all EU countries (i.e. 6.4% and 16.4%, respectively). However, it should be pointed out that womencomprised only 8% of the analysed sample in 2013.
Among companies which employed both foreign and local managers in their Management Boards, the average remuneration of foreign executives (excluding CEOs) in 2013 was higher by ca. 40% as compared to the remuneration of their Polish counterparts. Remunerations of the so-called expats often include a re-assignmentpackage, which covers e.g. rental of apartment, costs of removals, international flightsand costs of child education. This results in on average 3 times higher remuneration due to additional benefits than in the case of Polish managers.
In companies with “mixed” Management Boards, it happens that foreign executives earn less than the Polish ones. This may result from expats receiving remuneration from parent companies. However, definitely more often Management Board members re-assigned to work in Poland earn more than their Polish peers. In 2013, this differencereached maximum of ca. 200%.
22. Executive compensation at key listed companies in 2013
TTable 9. Relative level of average annual short-term remuneration depending on the area of responsibility
Management Board member Ratio of average remuneration as comparedresponsible for the area of: to other Management Board positions18
Finance 48%
Investment banking19 42%
Risk19 26%
Retail banking19 8%
Sales 2%
Corporate banking19 -5%
Operations -12%
Organisational and Legal -25%
Source: PwC analysis based on financial statements and reports of Management Boards on the analysed companies’ activities for 2013.
18 Calculated only for the Management Boards which in 2013 had a Member responsible for such position and for whom the areas of responsibility of all Management Board members were listed.
19 Applies to banks only.
20 Annual Report of the European Commission on Gender Equality of 2014, data according to Eurostat 2012.

Top 10
Among 140 analysed companies, 10 best remunerated CEOs and 10 companies that paid the highest remuneration to other Management Board members (excludingthe CEO) were selected. The analysis took account of short-term remuneration paid in 2013. The remuneration was given in amounts rounded to the nearest PLN 10,000.
Best remunerated CEOs
The graph below presents 10 best remunerated CEOs from WIG20, sWIG40 and mWIG80index companies in 2013.
23.PwC, August 2014
Jan
usz
Fil
ipia
ksW
IG80
, IT
CO
MA
RC
H
Ma
rku
s Te
llen
ba
chW
IG20
, med
iaT
VN
Ma
ciej
Wit
uck
iW
IG20
, tel
ecom
mun
icat
ions
TPSA
Luig
i Lo
vagl
ioW
IG20
, ban
ksPE
KA
O
Da
riu
sz O
rło
wsk
isW
IG80
, foo
dW
AWEL
Mo
she
J. G
reid
inge
rm
WIG
40, m
edia
CC
INT
Ma
teu
sz M
ora
wie
cki
mW
IG40
, ban
ksB
ZWB
K
Do
min
ik L
ibic
ki
mW
IG40
, med
iaC
YFR
PLSA
T
Cez
ary
Sty
pu
łko
wsk
iW
IG20
, ban
ksM
BAN
K
Tim
oth
y M
. Ell
iott
mW
IG40
, fue
lSE
RIN
US
1,000
2,000
6,000
5,000
4,000
3,000
8,100
6,6006,370
5,880
5,130 5,020
4,100 4,0903,660
3,430
Place in ranking in 2012
New persons in “Top 10” ranking
Annu
al s
hort-
term
rem
uner
atio
n in
201
3 (P
LN th
ousa
nd)
1 4 2 15 5 3 9 7
Persons from “Top 10” ranking in 2012
7,000
6 29
Change 2013/2012 - 4,260 2,040 -30 3,070 750 -100 590 -190 -640 1,350
Annual short-term remuneration in 2012
12,360 4,560 6,400 2,810 4,380 5,120 3,510 4,280 4,300 2,080
0
8,000
9,000
Graph 7. Ten best remunerated CEOs in 2013
Stanowisko 2013 (zł) 2012 (zł) Zmiana 2013 w stosunku do 2012
Source: PwC’s analysis based on financial statements and directors’ reports on the analysed companies’ activity for 2012 and 2013.

This average (for 2013) is ca. three and a half times higher than the average amongCEOs in the whole survey sample. The maximum remuneration paid to a CEO, i.e. PLN 8.1 million in 2013, decreased compared to 2012 by ca. 35% (ca. PLN 12.3 million in 2012).
8 from among 10 persons from the “Top 10” ranking were again included in the list of the best remunerated CEOs. A relatively permanent group of companies consequentlyremunerates their CEOs higher compared to other companies from the analysed indices.
Five more CEOs, whose remuneration in 2013 exceeded PLN 3 million (i.e. the limit of USD 1 million), were placed outside the “Top 10” ranking. In total, 73CEOs received in 2013 short-term remuneration exceeding PLN 1 million (as in 2012).
It is worth noting that the remuneration level allowing to place a CEO among ten bestremunerated CEOs was not an effect of a severance payment. In most cases the highlevel of CEOs remuneration was a result of an increase in companies’ performance. This was reflected in the levels of bonuses paid.
It’s worth mentioning that 5 out of the 10 best remunerated CEOs at analysed companies were covered by long-term incentive plans, which also increase their level of remuneration package. However, none of the awards was granted under LTIP in 2013 (only plans implemented in the previous years were carried out).
The ranking of best remunerated CEOs confirmed the discrepancies between remuneration levels in different industries. Among industries the representation of media and banks was the largest on this list (3 out of 10 companies).
24. Executive compensation at key listed companies in 2013
The short-term remuneration of ten best paid CEOs in 2013was within the range from approximately PLN 3.4 million to approximately PLN 8.1 million, with the averageamounting to approximately PLN 5.2 million. The average remuneration in this group was almost identical to the one in 2012.
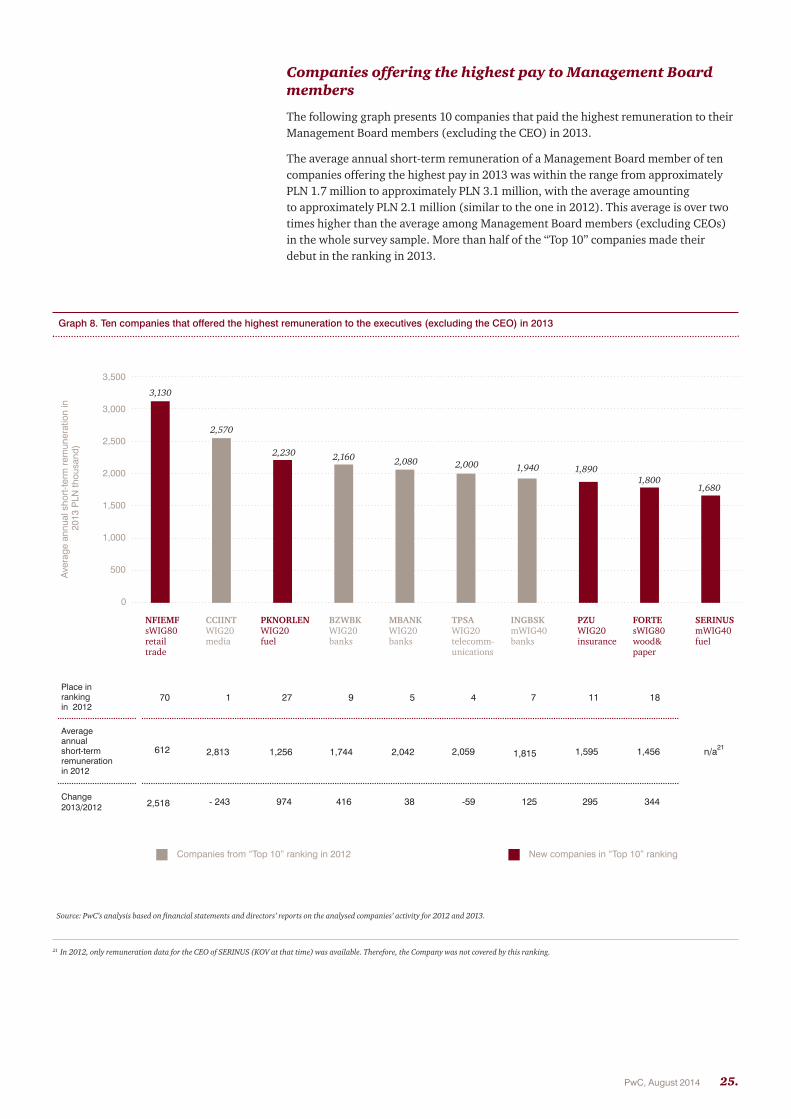
Companies offering the highest pay to Management Boardmembers
The following graph presents 10 companies that paid the highest remuneration to theirManagement Board members (excluding the CEO) in 2013.
The average annual short-term remuneration of a Management Board member of tencompanies offering the highest pay in 2013 was within the range from approximatelyPLN 1.7 million to approximately PLN 3.1 million, with the average amounting to approximately PLN 2.1 million (similar to the one in 2012). This average is over twotimes higher than the average among Management Board members (excluding CEOs)in the whole survey sample. More than half of the “Top 10” companies made their debut in the ranking in 2013.
25.PwC, August 2014
FORTEsWIG80wood&paper
500
3,000
3,500
3,130
2,570
2,230 2,160 2,0801,940 1,890
1,8001,680
Place in rankingin 2012
New companies in “Top 10” ranking
Aver
age
annu
al s
hort-
term
rem
uner
atio
n in
201
3 PL
N th
ousa
nd)
Average annualshort-term remuneration in 2012
1 27 9 5 4 11
Companies from “Top 10” ranking in 2012
2,500
2,000
1,500
1,000
NFIEMFsWIG80retailtrade
CCIINTWIG20media
PKNORLENWIG20fuel
BZWBKWIG20banks
MBANKWIG20banks
TPSAWIG20telecomm-unications
INGBSKmWIG40banks
PZUWIG20insurance
SERINUSmWIG40fuel
18
0
7
612
Change 2013/2012 - 243 974 416 38 -59 295 344125
2,813 1,256 1,744 2,042 2,059 1,456 n/a211,5951,815
2,000
70
2,518
Graph 8. Ten companies that offered the highest remuneration to the executives (excluding the CEO) in 2013
Stanowisko 2013 (zł) 2012 (zł) Zmiana 2013 w stosunku do 2012
Source: PwC’s analysis based on financial statements and directors’ reports on the analysed companies’ activity for 2012 and 2013.
21 In 2012, only remuneration data for the CEO of SERINUS (KOV at that time) was available. Therefore, the Company was not covered by this ranking.
It should be noted that less than 10% of Management Board members at the best-payingcompanies have not been holding their functions throughout the whole financial year.This means that the average remuneration level in this group should not be inflated by severance payments or those related to non-competition agreements, but is rather a result of remuneration policies for Management Board members in place.
It is worth mentioning that 5 out of 10 best paying companies in 2013 had LTIPs, which also increase the level of the total remuneration package for Management Board members. However, in none of these companies awards were granted under LTIP in 2013 (only plans implemented in the previous years were carried out).
The aforesaid list included companies from all analysed stock exchange indices and various industries. The group represented in the largest number in the “Top 10” are WIG20 companies (5 out of 10 companies per index). Among industries, the representation of banks was the largest on this list (3 out of 10 companies). The top ten best paying companies ranking included also companies from other sectors being the best paying ones in 2013, i.e. media, insurance and the fuel sector.
26. Executive compensation at key listed companies in 2013
In 2013, 37 companies in total paid short-term average remuneration to their Management Board members exceeding PLN 1 million. In the group of analysed companies, in 2012 such an amount was paid by 38 companies.

27.PwC, August 2014
Appendix
The following data sources were used in the analysis:
1. Data concerning remuneration of the Management Boards members, the value of assets and revenues: Financial statements and directors’ reports on the company’sactivity for 2012 and 2013;
2. Data concerning the value of market capitalisation: Stock Market Quotation for the period from 2 January 2013 to 30 December 2013 and
3. Data concerning state shareholding: Corporate Supervision service of the Ministry of Treasury.
• In case of foreign companies, which presented remunerations of their executives in foreign currencies, the remunerations were converted into PLN, according to Table A of NBP average exchange rates as at balance sheet date of a given company.
• Data presented in the report were analysed based on the following assumptions:
−Due to the level of disclosure of remuneration data in financial statements of the analysed companies, all numerical analysis presented in this report covershort-term remunerations only. These analysis do not include remunerations resulting from the participation of executives in long- term incentive plans.
−Individuals who did not receive remuneration in 2013 were excluded from the analyses.
−A ranking of ten CEOs who received the highest remuneration in 2013 and of ten companies which paid the highest remuneration to their ManagementBoard members in 2013, takes into account the short-term remunerations of all executives from analysed companies.
−All other analyses, takes account of short-term remunerations of those executivesonly who held their functions for the entire 2013.
−The analyses concerning the components of the short-term remuneration packagecovered part of the study sample only. Four companies were excluded from the analyses (refer to the point below). Another 100 companies failed to disclose components of the package for individual members of the Management Board and presented remuneration as a total amount only or executives from these companies were granted remuneration from subsidiaries and associated entitiesonly. Therefore, the analysis of the short-term remuneration package structurewas based on data for just 36 companies.
The survey covered companies from three Warsaw Stock Exchange indices: WIG20, mWIG40 and sWIG80, according to the composition of the indices as at 31 December2013. All comparisons with 2012 are based on data relating to the remuneration of the Management Board members of those companies in 2012.
28. Executive compensation at key listed companies in 2013
Survey methodology
−The analyses do not cover remunerations of the executives in the following four companies:
i. AUTOMOTIVE COMPONENTS EUROPE S.A., in the financial statement, disclosed the total amount of remuneration of the executive team for 2013,amounting to EUR 1,200 thousand (approximately PLN 4,977 thousand according to Table A of NBP average exchange rates as at December 31, 2013).Since the amount refers to the Management Board and directors of the company, estimating remuneration of individual Management Board members of the Company was not possible.
ii. INDUSTRIAL MILK COMPANY S.A., in the financial statement, disclosed the total amount of remuneration of the executive team for 2013, amounting to USD 445 thousand (approximately PLN 1,349 thousand according to Table Aof NBP average exchange rates as at December 31, 2013). Since the amountrefers to the executive team (6 persons) and not the Management Board members only, estimating remuneration of individual Management Board members of the Company was not possible.
iii. KERNEL HOLDING S.A., in the financial statement, disclosed the total amount of remuneration of the executive team for 2013, amounting to USD 1,817 thousand (approximately PLN 6,026 thousand according to Table A of NBP average exchange rates as at December 31, 2013). Since the amount refers to the executive team of the Group (14 persons) and not the Management Board members only, estimating remuneration of individual Management Board members of the Company was not possible.
iv. NARODOWY FUNDUSZ INWESTYCYJNY KREZUS S.A. failed to publish a report for 2013 as at the date of finalising the survey (i.e. June 25, 2013).
• Companies in which the state shareholding amounted to at least 20% were consideredas in which the State Treasury has a significant share.
• Abbreviated names of companies used in the report and the allocation of particularcompanies to industries and names of industries are consistent with the names usedby the Warsaw Stock Exchange.
• Remuneration levels presented on charts are rounded to the nearest PLN 10,000 (unless stated otherwise).
29.PwC, August 2014
Survey methodology
30. Executive compensation at key listed companies in 2013
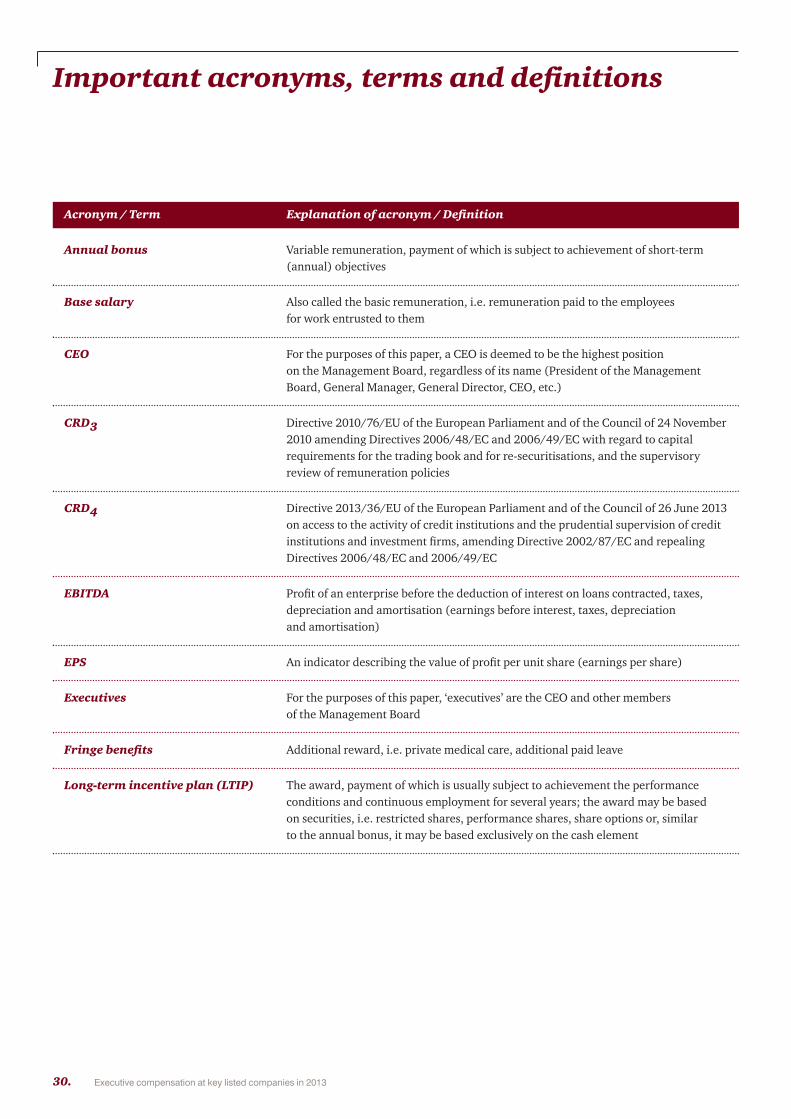
Important acronyms, terms and definitions
Acronym / Term Explanation of acronym / Definition
Annual bonus Variable remuneration, payment of which is subject to achievement of short-term (annual) objectives
Base salary Also called the basic remuneration, i.e. remuneration paid to the employees for work entrusted to them
CEO For the purposes of this paper, a CEO is deemed to be the highest position on the Management Board, regardless of its name (President of the Management Board, General Manager, General Director, CEO, etc.)
CRD3 Directive 2010/76/EU of the European Parliament and of the Council of 24 November2010 amending Directives 2006/48/EC and 2006/49/EC with regard to capital requirements for the trading book and for re-securitisations, and the supervisory review of remuneration policies
CRD4 Directive 2013/36/EU of the European Parliament and of the Council of 26 June 2013on access to the activity of credit institutions and the prudential supervision of credit institutions and investment firms, amending Directive 2002/87/EC and repealing Directives 2006/48/EC and 2006/49/EC
EBITDA Profit of an enterprise before the deduction of interest on loans contracted, taxes, depreciation and amortisation (earnings before interest, taxes, depreciation and amortisation)
EPS An indicator describing the value of profit per unit share (earnings per share)
Executives For the purposes of this paper, ‘executives’ are the CEO and other members of the Management Board
Fringe benefits Additional reward, i.e. private medical care, additional paid leave
Long-term incentive plan (LTIP) The award, payment of which is usually subject to achievement the performance conditions and continuous employment for several years; the award may be based on securities, i.e. restricted shares, performance shares, share options or, similar to the annual bonus, it may be based exclusively on the cash element

31.PwC, August 2014
Important acronyms, terms and definitions
Acronym / Term Explanation of acronym / Definition
LTIP Long-term incentive plan
Management Board member For the purposes of this paper, it is a person included in the Management Board (CEO and other Management Board members), unless it is stated that the person is the Member of the Management Board other than the CEO.
mWIG40 Stock exchange index for medium companies listed at the Warsaw Stock Exchange, including 40 companies
Phantom schemes/plans An incentive scheme under which, after the vesting period, an employee receives the cash equivalent of share vested or of difference between the price of the share onthe vesting day and the price determined on the date on which the reward is granted
Stock/Share A security giving an employee tangible and intangible rights, rising from participation(in the context of LTIP) in a joint share company. After the vesting period, an employee automatically becomes
the legitimate owner of share without performing any action.
Stock options / Share options Instruments that convey the right, but not the obligation, to acquire shares (in the context of LTIP) at a predefined exercise price. An employee, in order to become the owner of shares,
must execute this option, i.e. purchase shares at the exercise price.
Subscription warrants A reward providing the employee with the right to purchase share at the agreed (in the context of LTIP) price or the right to subscribe future issues of bonds of the same issuer.
In the context of LTIP, they have a similar effect as share options
sWIG80 Stock exchange index for small companies listed at the Warsaw Stock Exchange, including 80 companies
WIG20 Stock exchange index for the 20 largest joint share companies listed at the WarsawStock Exchange
WSE Warsaw Stock Exchange

32. Executive compensation at key listed companies in 2013
If you would like to discuss details of the report, please contact the following individuals:
Contact
Katarzyna SerwińskaDirector, HR Services
[email protected].: (22) 746 47 94mobile: +48 502 18 47 94
Robert KujothManager, HR Services
[email protected].: (22) 746 72 22mobile: +48 519 50 72 22
Dominika JędrzejewskaSenior Consultant, HR Services
[email protected].: (22) 746 72 27mobile: +48 519 50 72 27


This publication has been prepared for general guidance on matters of interest only, and does not constitute professional advice. You should not act upon the information contained in this publication without obtaining specific professional advice. No representation or warranty (express or implied) is given as to the accuracy or completeness of the information contained in this publication, and, to the extent permitted by law, PricewaterhouseCoopers does not accept or assume any liability, responsibility or duty of care for any consequences of you or anyone else acting, or refraining to act, in reliance on the information contained in this publication or for any decision based on it.
© 2014 PwC. International Limited (PwCIL), or, as the context requires, individual member firms of the PwC network. Each member firm is a separate legal entity and does not act as agent of PwCIL or any other member firm. PwCIL does not provide any services to clients. PwCIL is not responsible or liable for the acts or omissions of any of its member firms nor can it control the exercise of their professional judgment or bind them in any way. No member firm is responsible or liable for the acts or omissions of any other member firm nor can it control the exercise of another member firm’s professional judgment or bind another member firm or PwCIL in any way.
www.pwc.pl