Embed Size (px)
Citation preview

NYSE listed company
“Execution in a Challenging Environment”
Jefferies Global Energy Summit
& Investor Conference
December 1-2, 2010
Houston TX
NYSE listed company

NYSE listed company
Overview
Introduction: Stacked pay targets in the rich East Texas Basin
HB Shale: Confirmation through basin-wide cores, modeling, geo-
mechanics, upgraded completion schemes
Cotton Valley Sands: Offset Operators de-risking and validating Hz
development
Hidden underlying value: Oil in the shallow intervals
Reserve Bookings: New outside Reserve Engineers on HB
2

NYSE listed company
Operates 85% of 42,400 net Haynesville/Bossier (“H/B”) acres
– More than 800 Hz producers in basin since 2008
– GMXR has 28 H/B producers(1); 264 additional net potential H/B
horizontal (“Hz”) drilling locations in Capital Core
– Net potential acreage is already de-risked
– Virtually all acreage held by production
Operates 84% of 62,500 gross Cotton Valley Sand (“CVS”) acres
– Over 10,000 CVS producers and several thousand TP in basin
– GMXR has 325 CVS & 45 TP producers
– 290 CVS PUDs plus 1,092 net potential locations
Q3 2010 Proved reserves of 442.3 Bcfe
– H/B Hz 34% of PDP and 22% of PUD reserves(2)
– H/B Hz 68% proved developed (PV-10)
– H/B Hz ≈ 66% of production currently
– Total reserves include 12% NGLs & Oil
Endeavor Gathering, LLC
– 105 miles of pipeline, both high and low pressure
– 25,000 horsepower of compression
– Current estimated enterprise value of $95-100 million (3)
– Value appreciation based on production growth
Key Company Assets Focused on Top 2 Reservoirs
(1) As of 11-30-10
(2) As of 09-30-10
(3) Using 10X 2011 Forecast EBITDA
0.9 TCF Upside
1.35 TCF Upside
East TX: Mature Producing Basin with Vast Infrastructure
20+ Reservoirs
Throughout
Basin
Producers
Natural Gas
Oil
H/B HZ
Cott
on
Va
lley
Hayn
esvill
e B
ossie
r
3
NYSE listed company
GMXR Historical Reserves & Resource
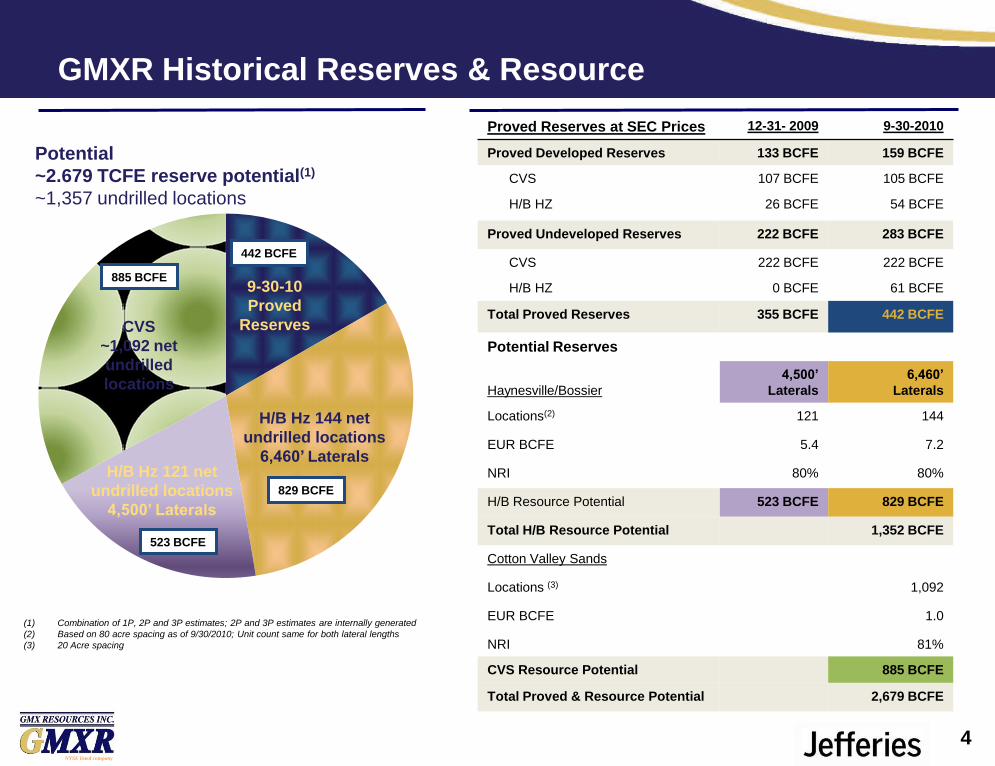
Potential
~2.679 TCFE reserve potential(1)
~1,357 undrilled locations
(1) Combination of 1P, 2P and 3P estimates; 2P and 3P estimates are internally generated
(2) Based on 80 acre spacing as of 9/30/2010; Unit count same for both lateral lengths
(3) 20 Acre spacing
Proved Reserves at SEC Prices 12-31- 2009 9-30-2010
Proved Developed Reserves 133 BCFE 159 BCFE
CVS 107 BCFE 105 BCFE
H/B HZ 26 BCFE 54 BCFE
Proved Undeveloped Reserves 222 BCFE 283 BCFE
CVS 222 BCFE 222 BCFE
H/B HZ 0 BCFE 61 BCFE
Total Proved Reserves 355 BCFE 442 BCFE
Potential Reserves
Haynesville/Bossier
4,500’
Laterals
6,460’
Laterals
Locations(2) 121 144
EUR BCFE 5.4 7.2
NRI 80% 80%
H/B Resource Potential 523 BCFE 829 BCFE
Total H/B Resource Potential 1,352 BCFE
Cotton Valley Sands
Locations (3) 1,092
EUR BCFE 1.0
NRI 81%
CVS Resource Potential 885 BCFE
Total Proved & Resource Potential 2,679 BCFE
CVS
~1,092 net
undrilled
locations
H/B Hz 121 net
undrilled locations
4,500’ Laterals
9-30-10
Proved
Reserves
4
829 BCFE
442 BCFE
523 BCFE
885 BCFE
H/B Hz 144 net
undrilled locations
6,460’ Laterals
NYSE listed company
5
BCFEPV-10(1)
($ in Millions)
PV 10 %
Total Proved
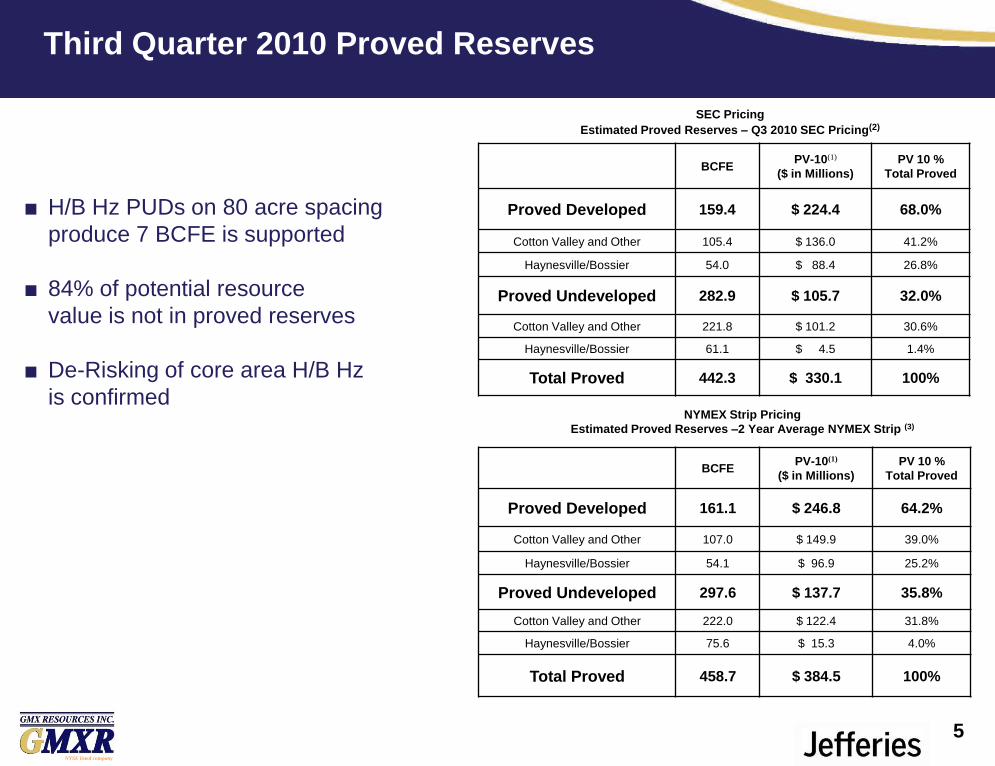
Proved Developed 159.4 $ 224.4 68.0%
Cotton Valley and Other 105.4 $ 136.0 41.2%
Haynesville/Bossier 54.0 $ 88.4 26.8%
Proved Undeveloped 282.9 $ 105.7 32.0%
Cotton Valley and Other 221.8 $ 101.2 30.6%
Haynesville/Bossier 61.1 $ 4.5 1.4%
Total Proved 442.3 $ 330.1 100%
BCFEPV-10(1)
($ in Millions)
PV 10 %
Total Proved
Proved Developed 161.1 $ 246.8 64.2%
Cotton Valley and Other 107.0 $ 149.9 39.0%
Haynesville/Bossier 54.1 $ 96.9 25.2%
Proved Undeveloped 297.6 $ 137.7 35.8%
Cotton Valley and Other 222.0 $ 122.4 31.8%
Haynesville/Bossier 75.6 $ 15.3 4.0%
Total Proved 458.7 $ 384.5 100%
SEC Pricing
Estimated Proved Reserves – Q3 2010 SEC Pricing(2)
NYMEX Strip Pricing
Estimated Proved Reserves –2 Year Average NYMEX Strip (3)
■ H/B Hz PUDs on 80 acre spacing
produce 7 BCFE is supported
■ 84% of potential resource
value is not in proved reserves
■ De-Risking of core area H/B Hz
is confirmed
Third Quarter 2010 Proved Reserves

NYSE listed company
6
BCFEPV-10(1)
($ in Millions)
PV 10 %
Total Proved
Proved Developed 161.1 $ 261.9 64.2%
Cotton Valley and Other 107.00 $ 157.4 38.6%
Haynesville/Bossier 54.1 $ 104.5 25.6%
Proved Undeveloped 297.6 $ 146.3 35.8%
Cotton Valley and Other 222.0 $ 122.9 30.1%
Haynesville/Bossier 75.6 $ 23.4 5.7%
Total Proved 458.7 $ 408.2 100%
(1) PV-10 represents the present value, discounted at 10% per annum, of estimated future net revenue before income tax of the Company’s estimated proved reserves. The
PV-10 value is different than the standardized measure of discounted estimated future net cash flows which is calculated after income taxes. The Company believes the
PV-10 is a useful measure for evaluating the relative monetary significance of their proved reserves. Investors may use the PV-10 as a basis for comparison of the relative
size and value of the Company’s reserves to its peers.
(2) The proved reserves as of September 30, 2010 are calculated based on current SEC guidelines. The commodity prices used in the estimate were based on the 12-month
unweighted arithmetic average of the first-day-of-the-month price during the period from October 2009 through September 2010. For natural gas volumes, the average
Henry Hub spot price of $4.41 per million British thermal units (MMBTU) was adjusted for energy content, transportation fees, regional price differences, and system
shrinkage. For crude oil, the average West Texas Intermediate posted price of $73.85 per barrel was adjusted for quality, transportation fees, and regional price differentials.
(3) The 2 Year Average NYMEX Strip Pricing Case scenario was based on the average of the 2011 and 2012 NYMEX strip price as of September 30, 2010 for both oil and
natural gas. For oil, the average of the 2011 and 2012 NYMEX price was $85.96 and was adjusted for quality, transportation fees, and regional price differentials. For
natural gas volumes, the average of the 2011 and 2012 NYMEX price of $4.76 per MMBTU was adjusted for energy content, transportation fees, regional price differences,
and system shrinkage.
(4) The Revenue Floors plus 2 Year Average NYMEX Strip Pricing Case scenario was based on the average of the 2011 and 2012 NYMEX strip price as of September 30,
2010 for both oil and natural gas as listed in footnote (3). However, the average natural gas price used for 2010, 2011, and 2012 was $5.35, $5.32, and $5.61, respectively,
to account for the Company’s current natural gas hedges.
Hedge Plus NYMEX Strip Pricing
Estimated Proved Reserves -Revenue Floors Plus 2 Year
Average NYMEX Strip (4)
Third Quarter 2010 Proved Reserves, continued
NYSE listed company
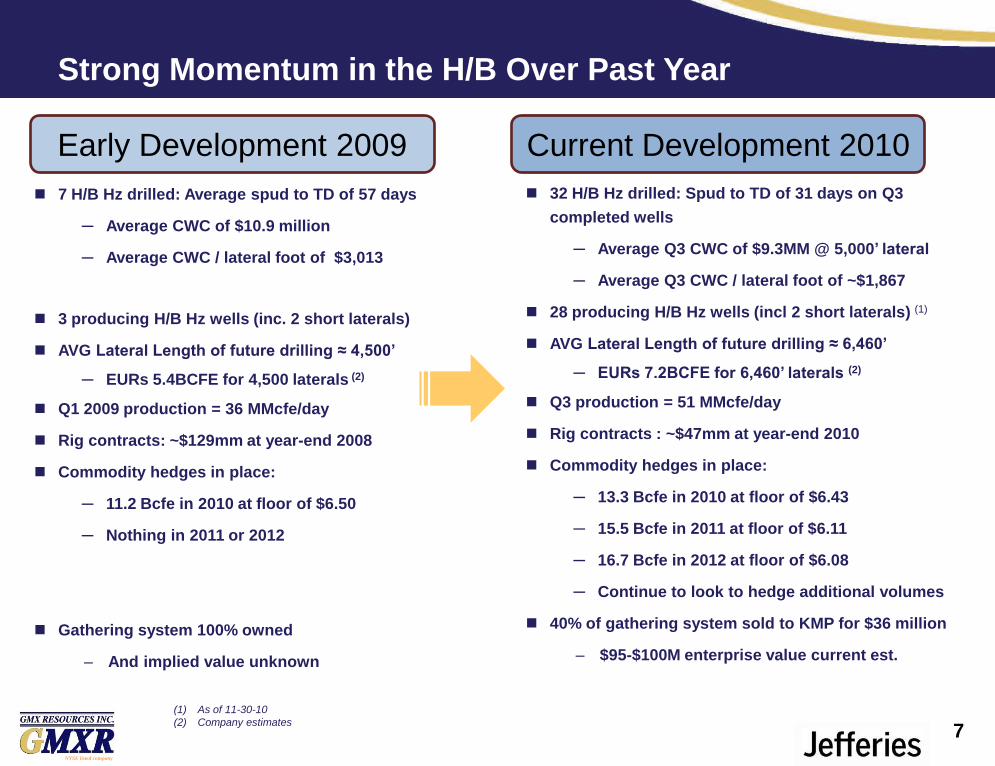
Strong Momentum in the H/B Over Past Year
7
Early Development 2009
7 H/B Hz drilled: Average spud to TD of 57 days
─ Average CWC of $10.9 million
─ Average CWC / lateral foot of $3,013
3 producing H/B Hz wells (inc. 2 short laterals)
AVG Lateral Length of future drilling ≈ 4,500’
─ EURs 5.4BCFE for 4,500 laterals (2)
Q1 2009 production = 36 MMcfe/day
Rig contracts: ~$129mm at year-end 2008
Commodity hedges in place:
─ 11.2 Bcfe in 2010 at floor of $6.50
─ Nothing in 2011 or 2012
Gathering system 100% owned
– And implied value unknown
32 H/B Hz drilled: Spud to TD of 31 days on Q3
completed wells
─ Average Q3 CWC of $9.3MM @ 5,000’ lateral
─ Average Q3 CWC / lateral foot of ~$1,867
28 producing H/B Hz wells (incl 2 short laterals) (1)
AVG Lateral Length of future drilling ≈ 6,460’
─ EURs 7.2BCFE for 6,460’ laterals (2)
Q3 production = 51 MMcfe/day
Rig contracts : ~$47mm at year-end 2010
Commodity hedges in place:
─ 13.3 Bcfe in 2010 at floor of $6.43
─ 15.5 Bcfe in 2011 at floor of $6.11
─ 16.7 Bcfe in 2012 at floor of $6.08
─ Continue to look to hedge additional volumes
40% of gathering system sold to KMP for $36 million
– $95-$100M enterprise value current est.
Current Development 2010
(1) As of 11-30-10
(2) Company estimates
NYSE listed company
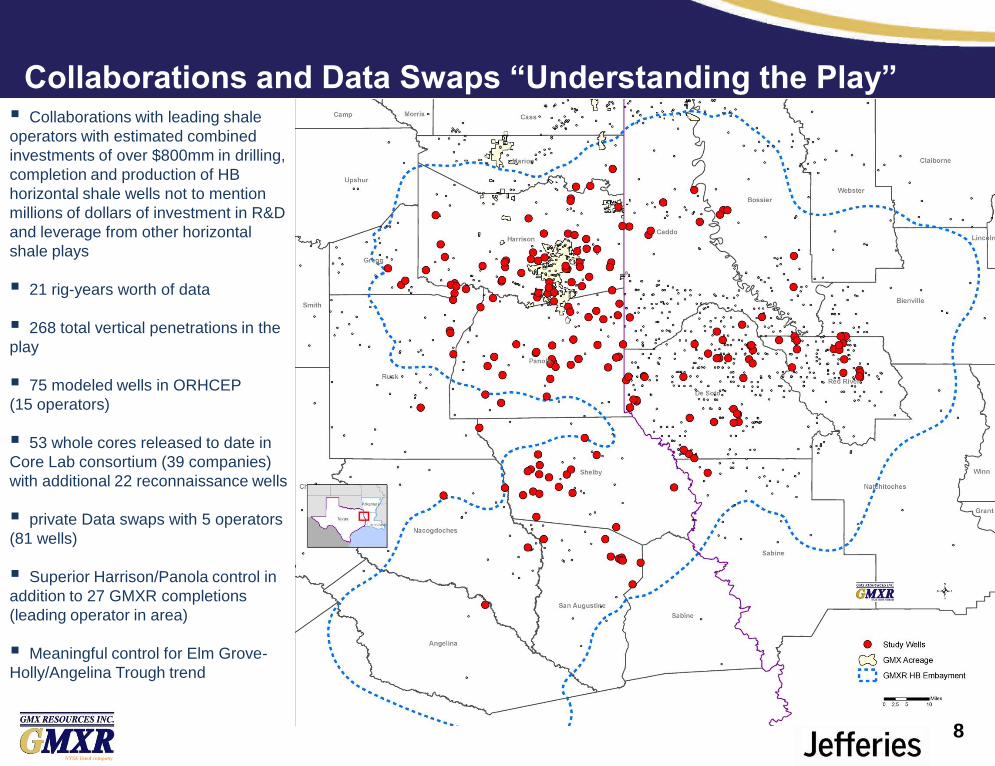
Collaborations and Data Swaps “Understanding the Play” Collaborations with leading shale
operators with estimated combined
investments of over $800mm in drilling,
completion and production of HB
horizontal shale wells not to mention
millions of dollars of investment in R&D
and leverage from other horizontal
shale plays
21 rig-years worth of data
268 total vertical penetrations in the
play
75 modeled wells in ORHCEP
(15 operators)
53 whole cores released to date in
Core Lab consortium (39 companies)
with additional 22 reconnaissance wells
private Data swaps with 5 operators
(81 wells)
Superior Harrison/Panola control in
addition to 27 GMXR completions
(leading operator in area)
Meaningful control for Elm Grove-
Holly/Angelina Trough trend
8

NYSE listed company
New Long-Lateral Development Plan
Better capital efficiency for reserve growth
Consolidated acreage position offers competitive advantages
Improved well economics
D&M guidance
9

NYSE listed company
0
2000
4000
6000
8000
10000
12000
0 200 400 600 800 1000 1200
MC
F/D
Cumulative MMCF
Mercer 11H (Perforated Lateral = 4851')
PUD 7.2 (Perforated Lateral = 6460')
Mia Austin 1H (Perforated Lateral = 4468')
Blocker Ware 8H (Perforated Lateral = 4171')
Verhalen F 1H (Perforated Lateral = 5286')
Blocker Heirs 20H (Perforated Lateral = 4378')
Bosh 19H (Perforated Lateral = 2751')
5.4 Business Model, Jan 2009
(1) Proppant values in excess of 1,250 lbs per foot
(2) GMXR current long lateral business model
Note: Information updated 10/10/1010
(1)
(2)
(1)
(1)
2nd Generation Completion Scheme – Long Lateral Future
Future Drilling/144 wells ≈ 6,460’ Laterals
7.2 EUR
Old Business Model Jan 09
Improved Performance

NYSE listed company
Why We Can Move to One (1) Rig Program
Modified from: EOG 2010 Analyst Conference, 4/7/2010, PowerPoint Presentation.
-
1,000
2,000
3,000
4,000
5,000
6,000
7,000
8,000
9,000
10,000
11,000
12,000
13,000
14,000
15,000
16,000
17,000
18,000
- 10 20 30 40 50 60 70 80
Dep
th
Drilling days
EOG Drill Times 2/2009 to 2/2010
Latest EOG Competitor Offset (2/10)
Holt 2H (6/10)
Blocker Heirs 21H (6/10)
Verhalen A 5H (6/10)
Blocker Ware 23H (7/10)
Mia Austin 6H (8/10)
Bosh 17H (8/10)
Mia Austin 3H (9/10)
Hamilton 1H (10/10)
•Faster drilling began
when FlexRigs came into
fleet
•Faster drilling continued
w/ testing of different
techniques and drill bits
•Recurring Spud to TD
days are below 30 days
11

NYSE listed company
12
012345
0
2
4
6
Jan-08
Feb-08
Mar-0
8
Apr-0
8
May-0
8
Jun-08
Jul-0
8
Aug-0
8
Sep-08
Oct-0
8
Nov-0
8
Dec-0
8
Jan-09
Feb-09
Mar-0
9
Apr-0
9
May-0
9
Jun-09
Jul-0
9
Aug-0
9
Sep-09
Oct-0
9
Nov-0
9
Dec-0
9
Jan-10
Feb-10
Mar-1
0
Apr-1
0
May-1
0
Jun-10
Jul-1
0
Aug-1
0
Sep-10
Oct-1
0
Nov-1
0
Net Rigs Drilling
Number of H/B Completions / Fracs
GMXR StoryGrowing Production w/ Fewer Rigs/Completions & Less CAPEX
20,000
25,000
30,000
35,000
40,000
45,000
50,000
55,000
60,000
GM
XR
Net
MC
FE
Dail
y P
rod
ucti
on
Total MCFE/d Production
(1)
(1) Through November 30, 2010

NYSE listed company
Proactively maintain liquidity
– Rig Subleases reduce remaining obligations
• YE 2010 - $47MM; YE 2011 - $23MM; YE 2012 $1MM
– Capex of $152 million in 2011
– 15 wells using 1 to 2 rigs drilled in 2011 (10 wells per rig)
– Relaxed covenants under credit facility
• Debt to EBITDA 4X → 4.5X
– Several additional debt alternatives
Maintain an active commodity hedging program
– Protected 60 – 80% of estimated production based on market conditions; rolling 36 months
Proactive Financial Management
13

NYSE listed company
Reduce 2011 CAPEX/Harmonize Drilling with Frac Schedule
– Sublease 3 rigs – run 1 rig until mid year 2011 (1) Contract Expiration
• Rig 1: Continuous Drilling March 2012
• Rig 2: Sublease January 2011 thru June 2011 (2) October 2012
• Rig 3: Subleased thru February 2012 (2) January 2013
• Rig 4: Already Subleased for life of contract March 2013
Minimizing Future Obligations
14(1) Company business model
(2) Pending Sublease
$129
$121
$47
$23
$1
YE 2008A YE 2009A YE 2010E YE 2011E YE 2012E
Rig contracts over time ($MM)

NYSE listed company
0
5
10
15
20
25
30
2010
Excellent Cash Flow Protection Due to Revenue Floors
(1) Weighted average prices are based on current bought and sold puts, and NYMEX strip on October 29, 2010.
(2) Oil and NGLs are approximately 13% of total production in 2010
Actively hedge to reduce price risk
– Maintain target of 60% - 80% of rolling 3 year natural gas
production protected
– Use deferred finance puts to match operating income and
cash flow
Gas protection in future years includes:
– 2010: 13.3 Bcf at $6.37/Mmbtu
– 2011: 15.5 Bcf at $6.11/Mmbtu
– 2012: 16.7 Bcf at $6.08/Mmbtu
Sold Puts help offset cost of Bought Puts
– As PUDs become PDP, GMXR will sell calls to recover
any put spread cost & create 3-way collars
– Cost of 2010 Bought Puts already fully recovered
Counterparty: BNP Paribas
Weighted-average Natural Gas price (1)
$6.18
Bcfe
of P
rod
uctio
n
Protected Natural Gas
Unprotected Natural Gas
Oil and NGLs(2)
84% of
Natural Gas
Production
Protected
15
NYSE listed company
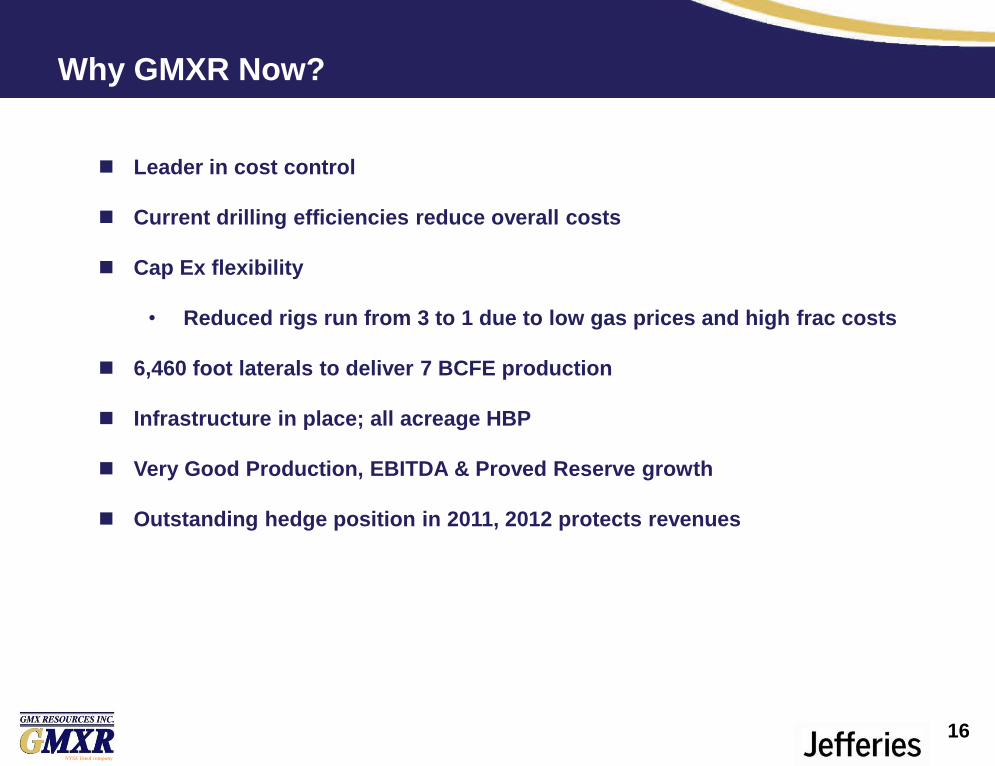
Leader in cost control
Current drilling efficiencies reduce overall costs
Cap Ex flexibility
• Reduced rigs run from 3 to 1 due to low gas prices and high frac costs
6,460 foot laterals to deliver 7 BCFE production
Infrastructure in place; all acreage HBP
Very Good Production, EBITDA & Proved Reserve growth
Outstanding hedge position in 2011, 2012 protects revenues
Why GMXR Now?
16

NYSE listed company
Historical Financial Summary
18
Nine Months
2007 2008 2009 2010
Statement of Operations
Oil and natural gas sales $68 $126 $94 $69
EBITDA 48 90 66 45
Net income (loss) applicable to common stock 12 (129) (185) 3
Statement of Cash Flows
Cash provided by operating activities $52 $83 $49 $41
Cash used in investing activities (195) (318) (181) (132)
Cash provided by financing activities 144 236 161 59
Capitalization
Cash $6 $7 $36 $4
Long-term debt, including current portion 126 224 190 259
Minority interest – – 22 22
Preferred stock 50 50 50 50
Shareholders' equity 159 194 196 215
Total Capitalization $335 $468 $459 $546
Production
Oil (MBbls) 127 190 119 71
Natural gas (Bcf) 8 12 13 12
Total production (Bcfe) 9 13 14 12
Average daily (MMcfe) 24 35 37 45
Net Proved Reserves
Natural gas (Bcf) 406 435 333 420
Oil (MMbls) 5 5 4 4
Total (Bcfe) 435 465 355 442
Proved Developed (Bcfe) 155 162 133 159
% Proved Developed 36% 35% 38% 36%
Credit Statistics
EBITDAX / Interest expense 11.7x 6.6x 4.1x 3.4x
Total debt / EBITDAX 2.6x 2.5x 2.9x 4.3x
Total debt / Total capitalization 38% 48% 44% 47%
Total debt / Proved developed reserves ($/Mcfe) $0.81 $1.38 $1.43 $1.63
Year ended December 31,
(1)
(1) Amount represents Kinder Morgan’s investment in Company’s gathering assets
(2) Annualized EBITDA for the nine months ended September 30, 2010 to calculate ratio
(3) Calculated using the trailing twelve month interest expense divided by 2010 annualized EBITDA
(3)
(2)

NYSE listed company
19
Analysis of Net Income Applicable to Common Shareholders For the Three Months ended September 30, 2010
Earnings per
Adjustments to Share
Note Income/(Expense) Reconciliation
Net income applicable to common shareholders (GAAP) $ 2,168,000 $ 0.08
Add back non-operating charges:
Non-cash Expenses
Deferred income tax provision 1 (2,934,000) 0.10
Ineffectiveness of cash flow hedges 2 116,000 -
Mark to market on non-hedge derivatives 3 (10,000) -
Amortization of fair value of share-lending agreement 4 179,000 0.01
Amortization of deferred premiums on derivative instruments 5 197,000 0.01
Amortization of 5.00% Convertible Bonds - 2013 6 721,000 0.03
Amortization of 4.50% Convertible Bonds - 2015 6 516,000 0.02
Net income applicable to common shareholders after non-operating charges (Non-GAAP) $ 953,000 $ 0.03
Weighted average diluted common shares for the three months ended September 30, 2010 28,267,781
Notes:
1 – Decrease in deferred tax valuation allowance due to an increase in deferred tax liabilities associated with an increase in unrealized gains on the Company’s hedges
2 – Unrealized loss on cash flow hedges recognized in oil and gas sales which is the result of a difference in the fair value of the Company’s hedges and the fair value of the
projected cash flows of a hypothetical derivative based on the Company’s expected sales point.
3 – Unrealized gains from changes in market values for non-hedge derivative contracts.
4 – Amortization of the value of the share-lending agreement which was required to be valued and recorded under new accounting guidance (FASB ASU 2009-15) beginning
in 1Q 2010
5 – Accretion expense related to the liability for deferred premiums on derivative instruments.
6 – Accretion expense related to the Company’s convertible bonds as required by accounting guidance (FASB ASC 470-20). Amount is additional interest above the cash
interest paid to the bond holders.
Analysis of Net Income Applicable to Common Shareholders

NYSE listed company
Discretionary cash flow represents cash provided by operating activities before changes in assets and liabilities less preferred dividends and net income attributable to
noncontrolling interests. . Discretionary cash flow is presented because we believe it is a useful additional consideration along with net cash provided by operating activities
under accounting principles generally accepted in the United States ("GAAP"). Discretionary cash flow is widely accepted as a financial indicator of a natural gas and oil
company's ability to generate cash that is used to internally fund exploration and development activities and to service debt. This measure is widely used by investors in the
valuation, comparison and investment recommendations of companies within the natural gas and oil exploration and production industry. Discretionary cash flow is not a
measure of financial performance under GAAP and should not be considered as an alternative to cash flows from operating, investing or financing activities as an indicator of
cash flows, or as a measure of liquidity. The manner in which we calculate discretionary cash flow may differ from that utilized by other companies. Discretionary cash flow is
reconciled to each of net income and net cash provided by operating activities as follows:
Non-GAAP Reconciliations – Discretionary Cash Flow
20
Three Months Ended September 30, Nine Months Ended September 30,
2009 2010 2009 2010
(as adjusted) (1) (as adjusted) (1)
(In thousands)
Net Income (Loss) $ (1,381) $ 4,504 $ (133,601) $ 8,586
Non cash charges:
Depreciation, depletion, and amortization 7,752 9,602 23,252 24,704
Impairment of oil and natural gas properties and property and equipment - - 138,078 -
Deferred income taxes 3,068 (2,934) 3,594 (6,324)
Non cash compensation expense 1,376 1,115 3,658 4,660
Other 2,909 2,462 6,239 8,378
Preferred stock dividends - (1,156) (2,313) (3,469)
Net income attributable to noncontrolling interest - (1,180) - (2,111)
Non-GAAP discretionary cash flow $ 13,724 $ 12,413 $ 38,907 $ 34,424
Reconciliation of GAAP "Net cash provided by
operating activities" to Non-GAAP
"discretionary cash flow"
Net cash provided by operating activities $ 20,831 $ 18,502 $ 41,409 $ 40,972
Adjustments:
Changes in operating assets and liabilities (7,107) (3,753) (189) (968)
Preferred stock dividends - (1,156) (2,313) (3,469)
Net income attributable to noncontrolling interest - (1,180) - (2,111)
Non-GAAP discretionary cash flow $ 13,724 $ 12,413 $ 38,907 $ 34,424
(1) Adjusted for retrospective application of FASB ASU 2009-15 “Accounting for Own-Share Lending Arrangements in
Contemplation of Convertible Debt Issuance or Other Financing,” now codified under FASB ASC Topic 470 “Debt”.
NYSE listed company
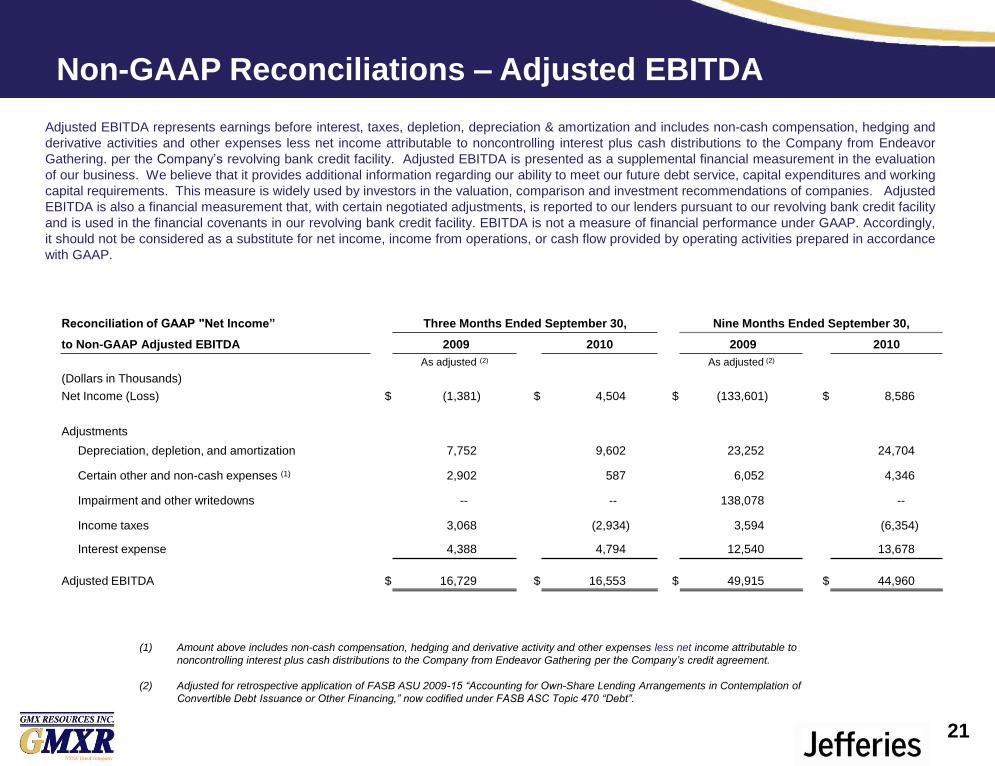
Reconciliation of GAAP "Net Income” Three Months Ended September 30, Nine Months Ended September 30,
to Non-GAAP Adjusted EBITDA 2009 2010 2009 2010
As adjusted (2) As adjusted (2)
(Dollars in Thousands)
Net Income (Loss) $ (1,381) $ 4,504 $ (133,601) $ 8,586
Adjustments
Depreciation, depletion, and amortization 7,752 9,602 23,252 24,704
Certain other and non-cash expenses (1) 2,902 587 6,052 4,346
Impairment and other writedowns -- -- 138,078 --
Income taxes 3,068 (2,934) 3,594 (6,354)
Interest expense 4,388 4,794 12,540 13,678
Adjusted EBITDA $ 16,729 $ 16,553 $ 49,915 $ 44,960
(1) Amount above includes non-cash compensation, hedging and derivative activity and other expenses less net income attributable to
noncontrolling interest plus cash distributions to the Company from Endeavor Gathering per the Company’s credit agreement.
(2) Adjusted for retrospective application of FASB ASU 2009-15 “Accounting for Own-Share Lending Arrangements in Contemplation of
Convertible Debt Issuance or Other Financing,” now codified under FASB ASC Topic 470 “Debt”.
Non-GAAP Reconciliations – Adjusted EBITDA
Adjusted EBITDA represents earnings before interest, taxes, depletion, depreciation & amortization and includes non-cash compensation, hedging and
derivative activities and other expenses less net income attributable to noncontrolling interest plus cash distributions to the Company from Endeavor
Gathering. per the Company’s revolving bank credit facility. Adjusted EBITDA is presented as a supplemental financial measurement in the evaluation
of our business. We believe that it provides additional information regarding our ability to meet our future debt service, capital expenditures and working
capital requirements. This measure is widely used by investors in the valuation, comparison and investment recommendations of companies. Adjusted
EBITDA is also a financial measurement that, with certain negotiated adjustments, is reported to our lenders pursuant to our revolving bank credit facility
and is used in the financial covenants in our revolving bank credit facility. EBITDA is not a measure of financial performance under GAAP. Accordingly,
it should not be considered as a substitute for net income, income from operations, or cash flow provided by operating activities prepared in accordance
with GAAP.
21

NYSE listed company
This presentation includes certain statements that may be deemed to be “forward-looking statements” within the meaning of
Section 27A of the Securities Act of 1933 and Section 21E of the Securities Exchange Act of 1934, as amended. All
statements, other than statements of historical facts, included in this presentation that address activities, events or
developments that the Company expects, believes or anticipates will or may occur in the future are forward-looking statements.
They include statements regarding the Company’s financing plans and objectives, drilling plans and objectives, related
exploration and development costs, number and location of planned wells, reserve estimates and values, statements regarding
the quality of the Company’s properties and potential reserve and production levels. These statements are based on certain
assumptions and analysis made by the Company in light of its experience and perception of historical trends, current
conditions, expected future developments, and other factors it believes appropriate in the circumstances, including the
assumption that there will be no material change in the operating environment for the Company’s properties. Such statements
are subject to a number of risks, including but not limited to commodity price risks, drilling and production risks, risks relating to
the Company’s ability to obtain financing for its planned activities, risks related to weather and unforeseen events,
governmental regulatory risks and other risks, many of which are beyond the control of the Company. Reference is made to
the Company’s reports filed with the Securities and Exchange Commission for a more detailed disclosure of these risks. For all
these reasons, actual results or developments may differ materially from those projected in the forward-looking statements.
Any forward-looking statement speaks only as of the date on which such statement is made and the Company undertakes no
obligation to correct or update any forward-looking statement, whether as a result of new information, future events or
otherwise, except as required by applicable law.
Forward-Looking Statements & Disclaimer
22