Embed Size (px)
Citation preview


Exclusive summary
www.leadingbrandsinc.com/media/lbix-2001.pdf

Part A. IntroductionChief executive officer: Ralph D. McRae Location: Leading Brands Inc.
160-7400 River Road
Richmond, BC Canada V6X 1X6
Latest fiscal year: Feb. 28, 2002

Part A. Introduction cont. Leading Brands Inc. principal operations are
comprised of an integrated bottling and distributing system for beverages, water and snack foods.
As shown on the bottom left. The Geographic area mainly consists of The United States of America & Southern parts of Canada.

Part A. Audit Report Independent auditors: /s/ BDO Dunwoody LLP In the audit Report the auditors found that the
consolidated financial statements were present fairly, in all respects. The financial position of the company generally accepts accounting principals.

Part A. Stock Market Information Most recent price of the company’s stock: Dec.
31, 2003 $2.00 12 month range: $1.75 to Dec. 31, 2002
$2.00 to Dec. 31, 2003 Dividends per share: 4414 Date of Information: Feb. 28, 2002 & 2001 The company stock seems to be steady
although the price of stock does not seem to increase much.

Part B. Industry Situation and Company Plans On www.globeinvertor.com I found that the Leading Brands plans
to expand their selection. They believe that the more beverages on the market the greater their income.
www.bevnet.com writes on Leading Brands announcement of their new release of 2 new drinks.
http://www.freeedgar.com/EdgarConstruct/Data/1062993/03-611/exhibit99b.htm wrote For the financial year ended February 28, 2003, compensation for executive officers of the Company consisted of a fixed base salary and long term compensation in the form of stock options. Bonuses may be allocated by the Compensation Committee. Salary levels will be reviewed periodically and adjustments may be made, if warranted, after an evaluation of executive and company performance, salary trends in the Company’s business sector, and any increase in responsibilities assumed by the executive.
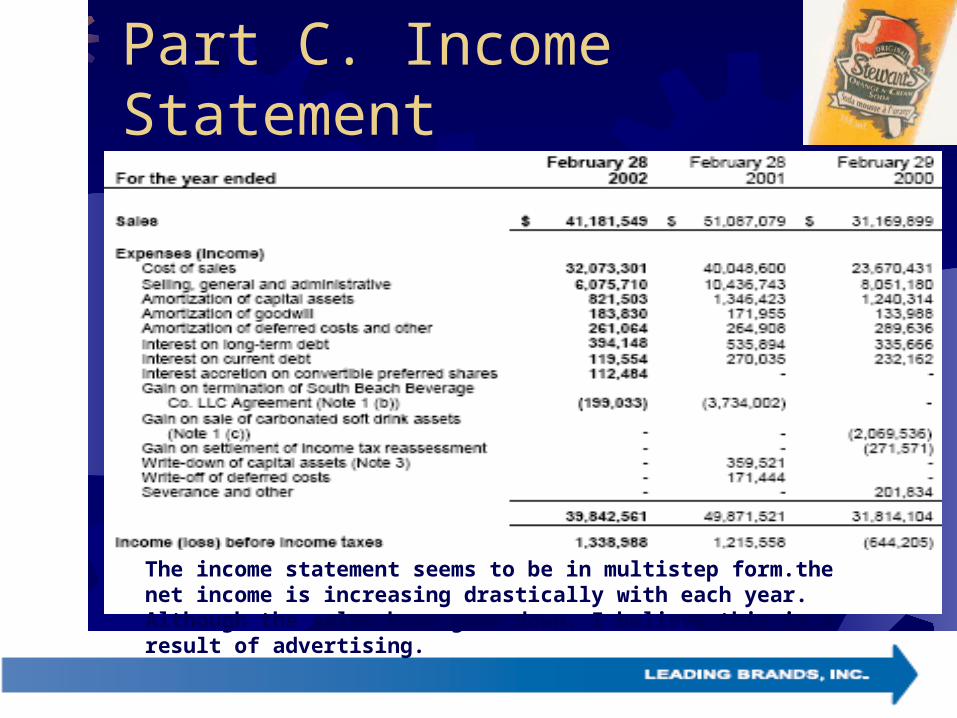
Part C. Income Statement
The income statement seems to be in multistep form.the net income is increasing drastically with each year. Although the sales have gone down. I believe this is a result of advertising.

Part C. Balance SheetAssets

Part C. Balance SheetLiabilities

Part C. Balance SheetIncreases or DecreasesBy looking at the balance sheets shown
on the two previous slides, I found that both the assets and liabilities tended to decrease from 2001 to 2002.
Some of the major changes were: Capital assets- ($2,335,138)
A/P – ($3,201,398)
Long term investment- $986,090
Bank dept.- ($2,951,198)

Part C. Statement of Cash Flows
The cash flow from operations are less than the net income form the years before.
The company is growing through investing activities.
The company’s primary source of financing is long term loans
Overall the cash had increased over the past two years.

Part D. Accounting Policies

Part D. Accounting PoliciesTopics of notes to the Financial statements:
Acquisitions and DispositionsInventoryCapital AssetsTrademarks and RightsGoodwillDeferred CostsLong term Investment
and AdvancesBank IndebtednessLong term DebtConvertible Preferred Shares Share CapitalCommitments
Contingencies
Income taxes
Changes in Non-cash Operating Working Items
Related Party Transactions
Fair Value of Financial Instruments
Credit Risk and Interest Rate Risk
Segmented Information
Differences between Canadian and US Generally Accepted
Accouting Principals

Part E. Financial Analysis Liquidity Ratios
Working Capital: -208,400 -481132 Current Raito: .9649 .9607 Receivable Turnover: 10.6 13.17 Average Days
Sales Uncollected: 33.96 27.33 Inventory turnover: 11.85 14.79 Avg. days inventory
on hand: 30.38 24.34

Part E. Financial Analysis Profitability Ratios
Profit margin: .0325 .0237Asset turnover:1.56 1.93Return on assets: .05 .046Return on equity: .068 .062

Part E. Financial Analysis Solvency Ratio
Debt to equity: 1.686 2.4

Part E. Financial Analysis Market Strength Ratios
Price/ Earning
per share: 4.12 times6.2 times
Dividend yield: .097 .0645


![APPLICATION A1019 EXCLUSIVE USE OF ... 23 September 2009 [16-09] APPLICATION A1019 EXCLUSIVE USE OF PHYTOSTEROL ESTERS IN REDUCED-FAT CHEESE PRODUCTS ASSESSMENT REPORT Executive Summary](https://img.pdfslide.us/doc/110x75/5b0cd6e67f8b9a952f8ca100/application-a1019-exclusive-use-of-23-september-2009-16-09-application-a1019.jpg)