Embed Size (px)
Citation preview

DECEMBER 2009
03 Explosive Growth, Untapped Potential
04 Understanding ETFs
07 Benefits Drive Growth
09 Changing ETF Regulations
11 A Strategic Tool for Institutional Investors
13 Measuring Up
15 A Bright Future
Exchange Traded Funds: Maximizing the Opportunities for Institutional InvestorsAround the world, exchange traded funds (ETFs) are becoming an increasingly important component of institutional investors’ portfolios. Yet despite this pervasiveness, even the savviest investors often fail to maximize the benefits these flexible investment tools can offer. Fully understanding ETFs, and how to best use them in their portfolios, is critical to institutional investors’ ability to take full advantage of this growing market.

This is State Street
With $17.9 trillion in assets under custody and $1.7 trillion in assets under management,*
State Street is one of the world’s leading providers of financial services to institutional investors.
Our broad and integrated range of services spans the entire investment spectrum, including
research, investment management, trading services and investment servicing. By using any
combination of these services, our customers can deliver more value to their clients, control
costs, launch new products and expand globally.
With operations in 27 countries serving customers in more than 100 markets, State Street
delivers the tools and services that global institutional investors need to be successful.
*As of September 30, 2009
State Street’s Vision Series distills our unique research, perspective and opinions into
publications for our customers around the world.

EXCHANGE TRADED FUNDS • 3
The number of exchange traded funds (ETFs) has exploded over the past
two decades, a trend that shows no signs of abating even in the face of recent
market turmoil. Through the first three quarters of 2009, ETFs accounted for
33 percent of all US stock trading volume and, as of the end of September 2009,
global ETF assets under management (AUM) had grown 31 percent year-to-date
to $933 billion spread across 1,819 products.1
Explosive Growth, Untapped Potential
Institutional investors have embraced ETFs, capitalizing
on their diversification benefits, reasonable expense
ratios, tax efficiency and liquidity. In fact, 17 of the 20
largest mutual fund complexes and 15 of the 20 biggest
hedge funds invest in ETFs. All of the largest university
endowments include ETFs in their top-10 holdings
as well.
However, despite the rising popularity of ETFs world-
wide, many institutions still fail to leverage these flexible
investment tools to their full potential. Although most
investment managers plan on expanding their use of
ETFs, lack of familiarity with all of the new products
and confusion over how best to use ETFs in their port-
folios is causing some hesitation. To get the most out of
this burgeoning market, institutional investors need to
understand how to maximize the full range of benefits
that ETFs can offer.
1 Deborah Fuhr, “ETF Landscape Industry Review,” ETF Research and Implementation Strategy, Barclays Global Investors, October 2009.
Understanding ETFs
In 1993, State Street Global Advisors partnered with
the American Stock Exchange to launch the first ETF
— the Standard & Poor’s Depository Receipt Trust or
SPDR (SPY), which replicates the S&P 500 Index. Other
index-tracking funds soon followed, allowing investors
to gain broad market exposure with the purchase of a
single ETF share. These funds either replicated indices
by holding the underlying assets of a specific index or
attempted to mimic index performance through opti-
mization or, in some instances, the use of derivatives.
Today, investors can also target sector and style subin-
dices, as well as country-specific, regional, developed,
emerging market, fixed income, currency, commodity
and real estate exchange traded products.
While the US pioneered such niche ETFs, others will
likely follow as the global ETF market is just begin-
ning to grow. With 721 ETF products and $631 billion
in assets, the US exchange traded funds market is
the largest, although Europe has a greater breadth of
products — 783 in all, totaling $204 billion in assets.
European ETF assets are growing faster, up more than
43 percent year to date as of September 30, 2009,
compared to a 27 percent rise in the US over the same
period.2 Considering that ETFs currently represent just
2 percent of the European mutual fund market and 6
percent of the US market, there is still plenty of room
for expansion.3
The Asia-Pacific region, although less mature with only
180 products and $62 billion in ETF assets, is also
ripe for growth. Excluding Japan, assets in Asia-Pacific
have grown by almost 50 percent this year. While ETF
markets are still in their nascent stages of development
in many countries throughout the region, ETFs are
taking hold. Japan’s market is the largest with $27 billion
in ETF AUM, and Hong Kong is the second largest with
$18 billion in AUM.4
By the end of 2011, global ETF assets may well reach
as high as $2 trillion. As the ETF market matures, ETFs
will likely become an investment staple for all institu-
tional investors.
Regional Differences in ETF Markets
Europe
Cross-border investing through US subsidiaries makes
assessing the European ETF market a challenge. Despite
the region’s many exchanges, there is a plethora of
available ETF products and restrictions on European
investments in US-based funds. State Street estimates
that approximately 10 percent of US-listed ETF assets
are from European investors.
2 Fuhr, October 2009.3 Ruth Sulllivan, “HSBC Joins European Scramble to Provide ETFs,” Financial Times, August 23, 2009.4 Fuhr, October 2009 and “ETF Landscape Industry Review,” ETF Research and Implementation Strategy, Barclays Global Investors, September 2009.
4 • VISION FOCUS
Because ETFs in Europe tend to be listed across
many exchanges, the visible daily volume on any one
exchange is splintered. When viewed in aggregate, one
can see the MSCI- and FTSE-based ETFs are the most
popular. The most active ETF exchanges in Europe tend
to be the Deutsche Börse and the Borsa Italiana.
Regulation has historically stifled rapid ETF adoption
in Europe as the non-harmonized nature of European
markets has meant that achieving scale in funds was
difficult. This has been changing over the past 10
years, and sales and marketing activities have picked
up across borders. While multiple listings in Europe are
not a technical requirement for distribution in any one
country, they are typically offered to ensure access and
visibility to retail investors, who for the most part, can
only access ETFs through individual brokerage accounts
linked to their local exchanges.
Unfortunately, there are serious challenges to intro-
ducing ETFs into mainstream retail distribution in
Europe (unlike in the US where some brokers are selling
ETFs alongside mutual funds). This has meant that ETFs
have an overall lower penetration in European client
portfolios than in the US. Once these barriers come
down, as is currently forecast, the European ETF market
should grow above average global rates.
There are other differences between the US and
European markets. For example, the market for lending
and borrowing ETFs is less developed in Europe than
in the US. But, with a limited number of liquid futures
contracts, the practice of borrowing and shorting ETFs
on difficult-to-access market segments is likely to expand
as it helps to optimize portfolios and streamlines imple-
mentation for asset managers. Style-specific investing is
also less pronounced in Europe than in the US market.
That may soon change, however, as European investors
recognize the benefits of shifting assets from value to
growth stocks and from large-cap to small- and mid-cap
indices in anticipation of the next bull market.
The Asia-Pacific Region
Local ownership requirements have slowed growth in
some areas of the Asia-Pacific region. In China and
Malaysia, for example, global ETF providers need a local
partner and must forego majority stakes. Consequently,
fewer providers have offerings in these countries and
some funds in the region are still not sufficiently liquid
for large-scale trading.
ETF investment trends also vary by region. In Japan,
retail banks hold the majority of ETF assets. In Australia,
however, the ETF market is dominated by asset gath-
erers, and in Hong Kong, individuals are the primary
investors. Banks, mutual funds, asset managers and
qualified domestic institutional investors have all taken
to ETF investing in China.
Investors in the Asia-Pacific region currently tend to
invest by region, not sectors. ETFs that track the local
market indices such as the Nikkei 225, the Tokyo Stock
Price Index (TOPIX), the Hang Seng, FTSE/Xinhua China
50 and the S&P/ASX 200 are the area’s primary listings.
As more markets open and Asian indices become more
granular, sector investing will likely gain in popularity.
Cross-listed products should continue to grow, even
though large institutional investors based in the Asia-
Pacific region, as in Europe, do not need to use less
liquid local products if they can buy what they need
in New York through their local subsidiary and invest
directly. For this reason, Asia-Pacific investments in ETF
assets may already be higher than local markets indicate.
EXCHANGE TRADED FUNDS • 5

6 • VISION FOCUS
Where the Dollars Are Flowing
As the ETF market continues to grow, investment dollars
are flowing into fixed income, commodity, international
and specialty ETFs, as illustrated in Figure 1 above. With
stock markets in Brazil, China, South Korea and Taiwan
showing some of the greatest gains this year, there has
been a significant resurgence in demand for emerging
market ETFs in particular. Gold has also been a market
favorite in 2009.
Fixed income captured the attention of investors this year.
Representing various maturity ranges, bond ratings and
liquidity characteristics, 15 new fixed income ETFs have
been introduced in the US in 2009 alone. Fixed income
ETFs now account for 13 percent of the ETF market and
may be poised to draw assets from fixed income mutual
funds, which currently account for a considerably larger
28 percent of the mutual fund market.
Though investment in inverse and leveraged prod-
ucts boomed at the beginning of the year, flows have
tapered off as regulatory concerns mounted. The surge
of interest in ETFs has brought on increased scrutiny
by regulators, who are paying particular attention to
commodity and inverse and leveraged products. (See
Changing ETF Regulations on page 9.)
Figure 1: US ETF and Exchange Traded Products,* Assets by Category
September August Change YTD Change
Current Asset AssetCategory No.ofETFs Assets(MM) No.ofETFs Assets(MM) Change(%) No.ofETFs Assets(MM) Change(%)
Broad 10 $17,672 — $599 3.5 — $3,350 23.4
Commodity 22 $59,072 1 $4,527 8.3 — $26,218 79.8
Currency 20 $4,358 — $247 6 1 $965 28.4
Dividend/ Fundamental 88 $13,195 — $963 7.9 -18 $3,613 37.7
Fixed Income 68 $90,988 4 $5,143 6 15 $34,448 60.9
Global 24 $5,147 2 $436 9.3 1 $1,304 33.9
International 124 $162,570 1 $12,655 8.4 -6 $58,635 56.4
Inverse/Leveraged 128 $29,307 1 $533 1.9 24 $7,596 35
Sector 115 $67,565 — $3,590 5.6 -3 $17,197 34.1
Size 34 $169,811 1 $1,628 1 1 $(5,589) -3.2
Specialty 86 $13,081 1 $804 6.5 3 $5,873 81.5
Style 49 $61,754 2 $2,503 4.2 3 $7,378 13.6
Totals 768 $694,520 13 $33,628 5.1 21 $160,988 30.2
*Includes exchange traded notes (ETNs). Source: SSgA Strategy & Research, as of September 2009.

EXCHANGE TRADED FUNDS • 7
Benefits Drive Growth
Increased demand for inexpensive broad market access
has triggered a rush of consumers to the ETF market.
While ETFs have been around since 1993, they really
just began taking off in the last few years. Today, growing
numbers of investors are seeking low-cost index-based
investments like ETFs for their diversification, liquidity,
transparency and tax advantages.
In an era marked by increasing correlation of returns
among asset classes, the breadth of ETF offerings
supply an efficient way to manage risk through diversifi-
cation, giving investors access to previously inaccessible
markets, asset classes, sectors and investment styles.
ETFs’ diverse product offerings help investors reach
deeper into new and expanding markets.
Beyond diversification, institutions have begun using
ETFs for tactical asset allocation. Sector plays or an
overweight to a specific country can be easily managed
with a simple ETF investment.
With ETFs accounting for 33 percent of US equity dollar
volume traded year-to-date, many ETFs are incredibly
liquid. When investors want to buy or sell, they can
readily make the trade. With a more than 30 percent
increase in ETF assets in 2009 alone, even the newer
and smaller ETFs, which do not enjoy the abundant
liquidity of the markets’ frontrunners, may provide better
liquidity over time.
Transparency is another appealing quality of ETFs. Unlike
mutual funds, ETFs report their holdings on a continuous
basis, giving investors a comprehensive view of their
position. Short sales and hedging strategies can then
be employed.
ETF prices are also quoted continuously and the funds
are available for purchase and sale throughout the day.
In volatile times when markets can move as much as
5 percent in a single day, the ability to trade intraday
creates yet another significant advantage for ETFs over
mutual funds.
ETFs also allow for efficient trading, as they can be
purchased on margin and included in stock lending
programs. They can trade like stocks with market
orders, limit orders, stop-loss orders and spread
trades. But unlike stocks, ETFs allow investors to use
net asset value (NAV) orders, spread-to-NAV orders,
and low-cost in-kind creations and redemptions. The
creation-redemption process is facilitated by registered
broker-dealers, better known as Authorized Participants
(APs), who deliver the specified basket of underlying
constituent securities to an ETF provider in exchange
for blocks of 50,000, 100,000 or 200,000 ETF share
lots, known as creation units. These in-kind transactions
are not taxable and therefore help lower costs, improve
ETFs’ tax efficiency* and help keep funds trading at or
near their NAV. Trading efficiencies such as these may
offer additional opportunities for potential growth and to
save on transaction costs.
*Passive management and the creation/redemption process can help minimize capital gains distributions.
8 • VISION FOCUS
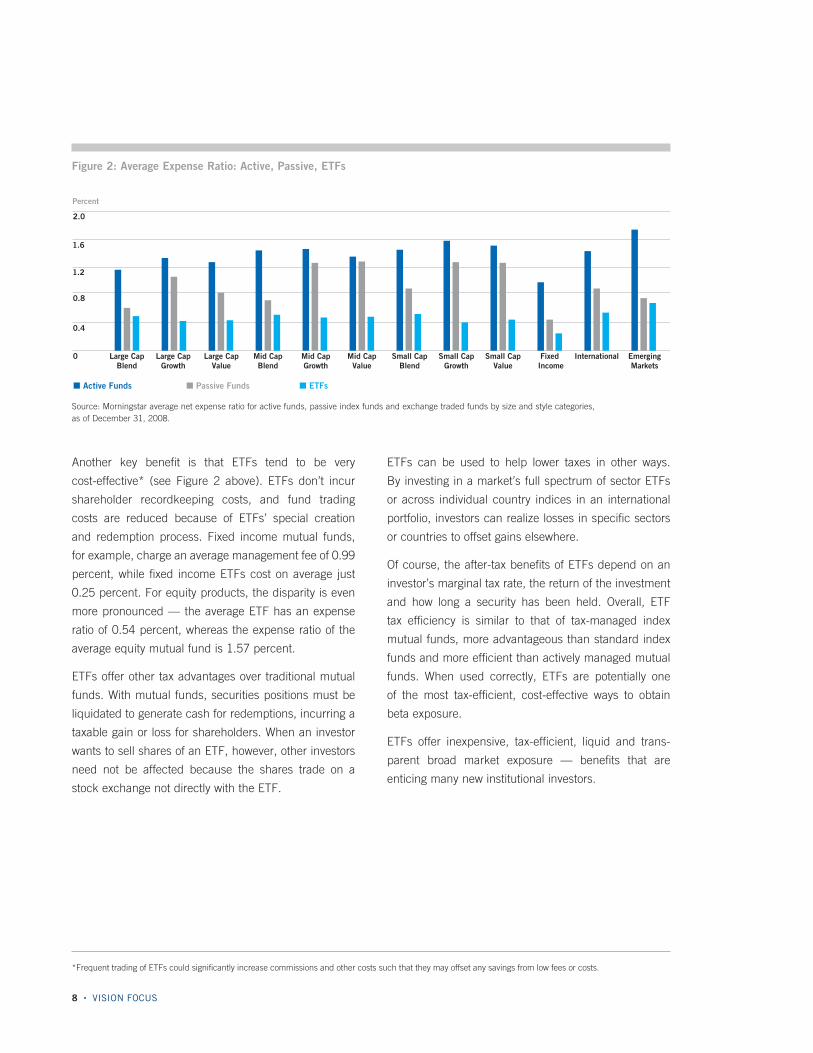
Another key benefit is that ETFs tend to be very
cost-effective* (see Figure 2 above). ETFs don’t incur
shareholder recordkeeping costs, and fund trading
costs are reduced because of ETFs’ special creation
and redemption process. Fixed income mutual funds,
for example, charge an average management fee of 0.99
percent, while fixed income ETFs cost on average just
0.25 percent. For equity products, the disparity is even
more pronounced — the average ETF has an expense
ratio of 0.54 percent, whereas the expense ratio of the
average equity mutual fund is 1.57 percent.
ETFs offer other tax advantages over traditional mutual
funds. With mutual funds, securities positions must be
liquidated to generate cash for redemptions, incurring a
taxable gain or loss for shareholders. When an investor
wants to sell shares of an ETF, however, other investors
need not be affected because the shares trade on a
stock exchange not directly with the ETF.
ETFs can be used to help lower taxes in other ways.
By investing in a market’s full spectrum of sector ETFs
or across individual country indices in an international
portfolio, investors can realize losses in specific sectors
or countries to offset gains elsewhere.
Of course, the after-tax benefits of ETFs depend on an
investor’s marginal tax rate, the return of the investment
and how long a security has been held. Overall, ETF
tax efficiency is similar to that of tax-managed index
mutual funds, more advantageous than standard index
funds and more efficient than actively managed mutual
funds. When used correctly, ETFs are potentially one
of the most tax-efficient, cost-effective ways to obtain
beta exposure.
ETFs offer inexpensive, tax-efficient, liquid and trans-
parent broad market exposure — benefits that are
enticing many new institutional investors.
Figure 2: Average Expense Ratio: Active, Passive, ETFs
Source: Morningstar average net expense ratio for active funds, passive index funds and exchange traded funds by size and style categories, as of December 31, 2008.
2.0
1.6
1.2
0.8
0.4
0 Large CapBlend
Large CapGrowth
Large CapValue
Mid CapGrowth
Mid CapBlend
Mid CapValue
Small CapBlend
Small CapGrowth
Fixed Income
Small CapValue
EmergingMarkets
International
■ Active Funds ■ Passive Funds ■ ETFs
0.0
0.4
0.8
1.2
1.6
2.0
Percent
*Frequent trading of ETFs could significantly increase commissions and other costs such that they may offset any savings from low fees or costs.

EXCHANGE TRADED FUNDS • 9
Commodity ETFs
Some commodity funds hold tangible assets with shares
representing fractional ownership of the actual under-
lying commodity. Most commodity exchange traded
products (ETPs), however, trade in futures. Responsible
for the majority of the global commodity market, US regu-
lators have begun to give this asset class more attention.
Specifically, fears about speculative activity could lead
regulators to take action. Since ETFs are governed
by the Securities and Exchange Commission (SEC)
and commodities are the domain of the Commodities
Futures Trading Commission (CFTC), it is likely that
both agencies will consider proposals in the near future.
Reports indicate that the CFTC may propose putting
caps on ETF asset size or market share, so that no single
player can control the market.
Sometimes regulatory actions can cause ETFs to
liquidate or stop new share issuance. Recently, the
CFTC withdrew exemptions from limits on corn and
wheat futures issued to Deutsche Bank. Soon there-
after, Deutsche Bank announced it would liquidate its
PowerShares DB Crude Oil Double Long ETN. Other
funds, such as United States Natural Gas Fund and
iShares S&P GSCI Commodity Indexed Trust, have
discontinued issuing new shares.
As a result, the development of the futures-based
commodity ETF market remains uncertain. For now,
however, commodity ETFs offer investors easy exposure
to a notoriously hard-to-access asset class. In time, ETFs
that replicate asset price movements by holding actual
commodities may become the industry’s gold standard.
Leveraged and Inverse ETFs
Leveraged products seek to produce a multiple of the
performance of the underlying benchmark. For example,
a leveraged ETF may seek to achieve two or three times
an index’s daily return. Inverse products are designed
to generate a mirror-image performance, one, two or
three times the opposite performance of a benchmark.
If the S&P dropped 1 percent one day, for example,
a series of inverse ETFs would hope to generate plus
1 percent, 2 percent and 3 percent, respectively.
While inverse and leveraged ETFs were just approved
by the SEC in 2008, SEC Chairman Mary Schapiro has
indicated that an additional regulatory review may be
complete by year’s end. The reason: While ETFs are
held predominantly by institutional investors, retail
investors constitute the majority of owners for the
top-three inverse and leveraged products. However,
according to the Financial Industry Regulatory Authority,
the largest independent regulator for US securities
companies, inverse and leveraged ETFs are not typi-
cally suitable for longer-term retail investors. Inverse
and leveraged ETF products reset daily. With the effect
of compounding, this can produce returns that diverge
widely from benchmarks over time. During periods of
high volatility, like in the fourth quarter of last year when
the Chicago Board Options Exchange Volatility Index
(VIX) spiked to over 80, tracking error is likely to be
especially pronounced.5
Some US ETF providers have yet to enter this market
and some brokerage firms are halting sales efforts
until regulation of these products becomes clearer. For
Changing ETF Regulations
5 ETF Profit Strategy Newsletter, April 2009.

10 • VISION FOCUS
example, UBS AG recently suspended the sale of lever-
aged, inverse and inverse-leveraged ETFs, and Morgan
Stanley Smith Barney has placed stringent restrictions
on the sale of these ETFs.
In Europe, where relatively few retail investors use
ETFs, regulators have yet to comment on inverse and
leveraged products. Europe’s inverse and leveraged
products are different from their US counterparts in that
they track specially calculated indexes, instead of using
daily swaps to hedge the returns of underlying indexes.
Regulatory developments and structural incongruities
will likely accentuate the differences between the US
and European ETF markets.
Active ETFs
In 2008, the SEC authorized the creation of actively
managed ETFs, and a couple of such funds have just
come to the US market. By contrast, Europe has had a
few active ETFs for years now.
Regulations and reporting processes must evolve to
address structural problems. For example, investors need
to know the components of a fund to actively hedge it, but
fund managers don’t want to reveal their holding for fear
of front-running or copycatting. In Europe, fund managers
announce their holdings to market makers on a two-day
lag and to the general public on a two-month lag, so
no one can front-run the ETF. Short-performance track
records also present a challenge for this class of ETFs.
Hedge Fund ETFs
Whereas regular hedge funds receive minimal federal
oversight, hedge fund ETFs are well-regulated under the
SEC. At least 15 hedge fund ETFs have filed for approval
and should be hitting the US market soon.
Because they track an index, these ETF products are
more like a fund of hedge funds rather than any single
hedge fund offering. While the performance of particular
hedge funds cannot be exactly replicated, investors may
participate in some of this asset class’ returns without
the associated concentrated risk of a single manager.
Hedge fund ETFs offer several other advantages over
traditional hedge funds. In stark contrast to traditional
hedge fund holdings, which are considered proprietary
information, the holdings of hedge fund ETFs are trans-
parent. Fees of 75 basis points compare favorably to
the “2 and 20” fee structure of hedge funds, which can
translate into annual fees of between 2 and 10 percent.
In addition, investors can trade holdings at any time and
pay only a broker transaction fee instead of dealing with
redemption fees and trading restrictions.
Hedge fund ETFs also have no investment minimums,
which opens this asset class to smaller institutions and
retail investors who have largely been excluded from
participation in this market.
Mutual Fund ETFs and 401(k) Plans
Mutual funds of ETFs are in the earliest stages of devel-
opment. Their primary use may be in 401(k) plans;
however, regulations governing 401(k)s were designed
to accommodate mutual funds, not ETFs.
As a result, logistical and legal asymmetries must be
resolved. Some areas where 401(k) requirements differ
dramatically from ETF offerings include pricing, market
access and reporting procedures. Besides these issues,
pension managers are hesitant to allow employees to
use the brokerage window for ETF inclusion due to fidu-
ciary concerns. This is particularly the case with inverse
and leveraged positions. But, while the 401(k) market
may be largely off limits for now, mutual funds of ETFs
may open the flood gates to retail investors.
While many ETFs may grow exponentially in the years
ahead, the future is less certain for some, including
inverse and leveraged products. However, given the
enormous growth in ETFs to date, we can be sure that
institutional investors will continue to drive new product
growth and influence regulatory actions for years to come.

A Strategic Tool for Institutional Investors
Investment managers have found various ways to use
ETFs, making them an ever-increasing staple in insti-
tutional portfolios. Below are some typical examples of
how the industry now uses ETFs for optimal effect:
CASH EQUITIZATION For investors who must keep a
certain portion of their assets liquid, ETFs can be used
to minimize cash drag. For example, mutual fund
managers who need to raise cash quickly to meet
redemption demands can avoid benchmark risk by
keeping 3 percent to 5 percent of their assets in a highly
liquid ETF. Outperforming managers may also pull some
assets out of more risky investments and preserve good
relative performance with an ETF benchmarked to their
target index.
COMPLETION STRATEGIES Investors may want to comple-
ment the holdings of their external managers, who
collectively tilt the portfolio in inadvertent and unwelcome
ways. For example, with the use of a small-cap fund, an
endowment can negate the large-cap overweighting of
its aggregate portfolio. ETFs can be exploited to manage
asset class, sector or style exposures.
DIVERSIFYING* CONCENTRATED PORTFOLIOS If a manager
expects a stock to decline but cannot sell the holding
due to selling restrictions or tax considerations, shorting
the corresponding sector or industry ETF as a tempo-
rary hedge may provide cost savings. Hedging an ETF
is usually considerably less costly than hedging an
individual security, given ETFs’ enhanced liquidity and
lower volatility.
CORE-SATELLITE STRATEGIES This management approach
divides portfolios into two parts — the core holdings,
which offer benchmark-like returns, and satellite hold-
ings, where investors seek outperformance. ETFs can be
employed as either. As core holdings, ETFs offer inex-
pensive access to multiple asset classes. Managers can
then add value with their personal management of the
satellite holdings — ancillary asset classes or country-,
sector- or stock-specific picks. Conversely, managers
can use ETFs to cover satellite holdings in market areas
where they are not that knowledgeable or have limited
resources to cover, such as emerging markets and inter-
national fixed income.
SHORTING† AND HEDGING Cheaper than futures with none
of the counterparty risk or rollover hassles, shorting ETFs
allows hedge funds and long/short investors to tactically
adjust exposures or fine-tune short positions.
TRANSITION MANAGEMENT When portfolios are being
transitioned from one manager to another, ETFs can be
used to keep fully invested and participating in market
returns, rather than allowing assets to sit idle in cash.
The following are examples of more sophisticated strate-
gies that are gaining traction:
DYNAMIC RISK-ADJUSTED PORTFOLIO MANAGEMENT
TECHNIQUES Used in conjunction with a core-satellite
approach, dynamic risk-adjusted portfolio management
techniques manage allocations to the core, or risk-
free benchmark holdings, and the satellite portions
of the portfolio, where tracking error and risk are
EXCHANGE TRADED FUNDS • 11
*Neither diversification nor asset allocation ensure a profit or guarantee against loss.
†The use of short selling entails a high degree of risk, may increase potential losses and is not suitable for all investors. Please assess your financial circumstances and risk tolerance prior to short selling.

introduced. This dynamic approach sets risk limits, typi-
cally a constant fraction of benchmark value, a capital
guarantee floor, maximum drawdown floor or trailing
performance floor. When risk limits are approached,
allocations shift to core holdings, limiting downside risk.
When good performance creates room for increased
risk-taking, satellite holdings can be overweighted to
take advantage of further outperformance. Conversely,
outperforming managers may pull some assets out of
more risky investments to preserve good relative perfor-
mance with a benchmark index ETF. ETFs’ liquidity and
tradability allows for such fluid risk-sensitive instruments.
LONG/SHORT MARKET-NEUTRAL STRATEGIES ETFs can
help make long/short strategies nimble. If a hedge fund
manager has identified securities he wants to go long on,
but isn’t sure which securities to short, he can sell short
an industry or sector ETF to keep the overall portfolio in
line. ETFs can also be employed when futures contracts
are not available or when derivatives are not allowed,
as with registered investment advisors. ETFs offer the
added benefits of helping to avoid counterparty risk and
the need to roll over positions.
SECURITIES LENDING Investors can earn revenue from
lending ETFs. Lending revenue may even compensate
for an ETF’s annual management and transaction fees.
While this is rare, investors can be assured that lending
ETFs can help to reduce already reasonable ETF costs.
STRATEGIC ASSET ALLOCATION ETFs offer opportunities
to align holdings with macroeconomic forecasts. If an
institutional investor wants to make a strategic alloca-
tion to emerging Europe, but would like to underweight
and overweight certain countries within the region, a
collection of ETFs can be designed to take advantage of
return expectations.
TACTICAL ASSET ALLOCATION/ACTIVE SECTOR ROTATION/
BUSINESS-CYCLE INVESTING ETFs can be utilized to
bolster weightings in particular asset classes, sectors
or styles to take an active stance on market rotation.
For example, many pension funds recently sought out
emerging market, fixed income and commodities when
recessionary and then inflationary fears took hold.
ETFs allow for managers to quickly gain exposure,
buying them time to do further research on specific
securities, if they so choose. ETFs offered both diversi-
fication benefits and pincer-like precision when market
granularity is preferred.
TAX MANAGEMENT ETFs’ low turnover, creation and
redemption process and ability to parse out markets
offer key tax advantages. In addition to the tax benefits
enumerated earlier, large taxable institutions can pass
along appreciated securities through ETF in-kind trans-
actions, thereby avoiding capital gains.
ETFs have fundamentally changed the way institutional
investors construct portfolios. As demand for new prod-
ucts continues, the most successful ETF investors will
be those who take full strategic advantage of the myriad
uses that these vehicles offer.
12 • VISION FOCUS

EXCHANGE TRADED FUNDS • 13
The best ETFs share many positive attributes —
reasonable spreads, sufficient liquidity, relatively
low expenses, acceptable tracking error and well-
constructed underlying benchmark indices.
While an ETF’s AUM may reveal a fund’s popularity, it
is not always a good indicator of quality. As many of the
most innovative products have come to market in the
last two years, the majority of these ETFs’ AUMs are still
low. More than half of US ETFs have less than $100
million in assets. Together, these 454 ETFs hold only 2
percent of total ETF assets. With the break-even point for
most ETFs at $80 million to $100 million, many smaller
ETFs are unprofitable and face uncertain futures unless
they grow. Though quite a few of these ETFs may have
bright futures, in 2008, 50 ETFs shut down, tying up
uninformed investors’ funds as they were dismantled.
Investors need to look beyond AUM to decipher which
products offer the best long-term prospects.
Late market entrants and ETFs with limited investor
interest generate funds with paltry asset levels, poor
liquidity and wide spreads. Average daily volume can
be a good indicator of an ETF’s tradability, but it only
represents liquidity on the secondary market.
Some newer or more niche ETFs may have limited
assets and low trading volume, but still offer decent
liquidity through APs. To get an accurate sense of an
ETF’s true liquidity, investors must also consider the
liquidity of a fund’s underlying securities. For example, a
thinly traded ETF that comprises liquid underlying secu-
rities can be efficiently utilized by clients who work with
APs who are able to create or redeem shares of the ETF.
When analyzing tracking error, it’s best to measure
the difference between a fund’s NAV — not ETF share
price — and the total return of the underlying index.
Regardless of an investor’s time horizon, funds with
lower tracking error are typically better choices. Funds
that replicate their indices, rather than optimize or
sample, tend to have the lowest tracking error. It is
important to note, however, that less liquid, more exotic
asset classes such as emerging markets and high-yield
bonds will typically produce benchmark indices that
are difficult or even impossible to replicate. An investor
must assume that there will be some level of tracking
error relative to the benchmark and must decide if that
trade-off is sufficient to get the desired exposure. It may
be the case that an ETF with a relatively high amount
of tracking error may still be an attractive option when
compared to similar, actively managed alternatives.
Expenses are one of the most important factors in
evaluating prospective funds. Figure 3 on page 14 high-
lights tracking error and expense ratios of some of the
industry leaders.
ETF performance will depend a great deal on the
underlying index it tracks. Investors need to carefully
examine the index weighting methodology used by
the index. Market capitalization (S&P 500, Russell
1000), price-weighted (DJIA), fundamentally weighted
(S&P High-Yield Dividend Aristocrats Index, FTSE/
RAFI US 1000 Index) and equal-weighted indices (S&P
Homebuilders Index, KBW Regional Banking Index)
may appear to be similar, but can have dramatically
different performance and risk/return characteristics.
Measuring Up

14 • VISION FOCUS
With so many products flooding the market, investors
should beware. Many may not be around next year and
some ETF sponsors may not have the wherewithal to
support all their offerings. As such, the ETF provider is
another important factor to consider.
Selecting an ETF Provider
It should come as no surprise that the best ETF providers
are those with scale. Market leaders have the resources
and expertise to design and manage superior products.
Strong execution skills and well-developed financial
advisor relationships help to create liquidity, enhancing
an ETF’s tradability. Proper vigilance is implied when
dedicated staff is assigned to monitor spreads and
trading volumes. Some providers even offer trade and
execution client support. With 44 different order types
on the New York Stock Exchange (NYSE) Arca, for
example, figuring out how to trade can be as important
as what to trade.
As spreads comprise a number of variable costs —
the fixed fee charged by ETF providers for creation or
redemption orders, the cost of gathering underlying
securities in an ETF basket and the risk premium passed
along by APs — ETF providers’ local expertise in foreign
markets can help, especially with niche products.
Better providers also have expertise in managing index
funds. Experience with product development and strong
portfolio management skills enable the delivery of high-
quality products. Experienced providers offer better
research and client service to help investors incorporate
new ETF products into existing strategies.
The largest ETF providers already have the sales,
marketing and distribution capabilities necessary to
launch new products with minimal start-up time. If an
ETF provider is large enough, any early investments
to support the promotion of new funds can be offset by the
revenues produced by older, more established funds. This
gives newer funds sufficient time to reach critical mass.
Inexperience with ETFs creates a substantial hurdle
for many investors. With numerous product choices
and providers, making an investment decision can be
overwhelming. ETF products sometimes venture into
unknown, untested indices and novel asset classes.
New portfolio management techniques further compli-
cate the landscape.
All of these factors speak to the need for comprehensive
client service and dedicated resources. With the right
provider, institutional investors can achieve investment
goals and stay ahead of the curve.
Figure 3: 2008 Average Tracking Error and Expense Ratio by ETF Provider
Issuer WeightedAvg. AverageTracking AverageExpense ETFIndustryAssets(%) TrackingError(bps)* Error(bps)* Ratio(bps)*
State Street Global Advisors 16 49 33 29.0
Fidelity Management & Research 18 18 30 0.0
The Vanguard Group 21 41 16 9.9
DB Commodity Services LLC/USA 36 25 66 0.8
PowerShares Capital 38 58 57 4.6
First Trust Advisors 42 43 65 0.1
WisdomTree 43 31 49 0.6
United States Commodity Funds LLC 44 66 68 0.9
Rydex Investments 46 43 42 0.3
Claymore Advisors LLC 48 74 61 0.2
Barclays Global Investors 53 48 40 52.5
Van Eck Associates 84 67 56 1.0
XShares Advisors LLC 148 147 65 0.0
London & Capital Asset Management 223 225 85 0.0
*Absolute Value Source: Morgan Stanley Research, ETF Providers and Trustees, Bloomberg.
EXCHANGE TRADED FUNDS • 15
Against a backdrop of market turbulence and increas-
ingly correlated global asset classes, ETFs have proved
worthy portfolio diversifiers and risk management tools.
No longer covering just the major market indices, ETFs
now offer inexpensive passive exposure to virtually all
global market segments. Liquid and cost-efficient, they
possess attributes that are highly sought after by today’s
institutional investors.
These enticing characteristics have helped ETFs gain
a global foothold. Their popularity will unquestionably
continue to climb in the months and years ahead.
The burgeoning market has drawn many new providers
offering ever more exotic products. Although the regu-
latory picture for some ETFs remains cloudy, there’s
pressure to get quick resolution on structural issues.
Despite regulatory uncertainty for some of the newer
products, ETFs will continue to gain adherents because
of their many benefits and numerous applications.
When choosing which ETFs will best fit an institution’s
unique risk profile and return objectives, asset class,
index and product design will likely be of paramount
concern. Next, a comparative study of ETF expenses,
liquidity, spreads and tracking error will offer insight into
the most appropriate ETF products. Finally, a review of
ETF providers should include asset levels, index manage-
ment experience, global reach and client support.
Sponsor education and comprehensive client services
are key to ensuring that institutional investors are
familiar with the new products and their widening array
of uses. With the help of ETF providers’ research, port-
folio construction, and trading and execution guidance,
investors can select and manage ETFs best suited to
meet their individual investment objectives.
A Bright Future

XX%
Cert no. XXX-XXX-000
State Street Corporation
State Street Financial Center
One Lincoln Street
Boston, Massachusetts 02111–2900
+1 617 786 3000
www.statestreet.com
NYSE ticker symbol: STT
For questions or comments about our Vision series,
e-mail us at [email protected].
Contact Information
If you have questions regarding State Street’s services and
capabilities for exchange traded funds, please contact:
Vin Bhattacharjee
+44 20 3395 6767
Richard Clairmont
+81 3 4530 7388
Anthony Rochte
+1 617 664 2966
Sammy Yip
+852 2103 0168
Design and production by State Street Global Marketing CORP-0035 ©2009 STATE STREET CORPORATION 09-STT04131209
FOR INVESTMENT PROFESSIONAL USE ONLY. Not for use with the public.
ETFs trade like stocks, are subject to investment risk and will fluctuate in market value. The investment return and principal value of an investment will fluctuate in value, so that when shares are sold or redeemed, they may be worth more or less than when they were purchased. Although shares may be bought or sold on an exchange through any brokerage account, shares are not individually redeemable from the fund. Investors may acquire shares and tender them for redemption through the fund in large aggregations known as creation units. Please see the fund prospectus for more details.
This material is for your private information. The views expressed are the views of State Street and are subject to change based on market and other conditions. The opinions expressed may differ from those with different investment philosophies. The information we provide does not constitute investment advice and it should not be relied on as such. It should not be considered a solicitation to buy or an offer to sell a security. It does not take into account any investor’s particular investment objectives, strategies, tax status or investment horizon. We encourage you to consult your tax or financial advisor. All material has been obtained from sources believed to be reliable, but its accuracy is not guaranteed. There is no representation or warranty as to the current accuracy of, nor liability for, decisions based on such information. Past performance is no guarantee of future results. This communication is directed at Professional Clients (this includes Eligible Counterparties as defined by the Financial Services Authority) who are deemed both Knowledgeable and Experienced in matters relating to investments. The products and services to which this communication relates are only available to such persons and persons of any other description (including Retail Clients) should not rely on this communication. The information contained within this marketing communication has not been prepared in accordance with the legal requirements of Investment Research. As such this document is not subject to any prohibition on dealing ahead of the dissemination of Investment Research.
State Street Global Markets is the distributor for all SPDR ETFs.
ETFs are not insured by the FDIC; are not deposits or other obligations of State Street Bank and Trust Company and are not guaranteed by the institution; and are subject to invest-ment risks, including possible loss of the principal invested.