Embed Size (px)
Citation preview
BIS Papers No 57 37
Exchange rates and monetary policy frameworks in EMEs
Andrew Filardo, Guonan Ma and Dubravko Mihaljek1
1. Introduction
Financial integration has reshaped monetary policy frameworks and transmission channels in emerging markets over the past few years. Both short-term and long-term interest rates in emerging market economies (EMEs) have become more responsive to foreign financial conditions. One important channel for the transmission of external factors on monetary policy is the exchange rate. The current environment of rising inflation and currency appreciation pressures in many EMEs poses a particular challenge, as monetary policy now faces a more difficult trade-off between price stability and exchange rate stability. Indeed, many central banks highlight the increased influence of external shocks in formulating domestic monetary policy in their contributions to this meeting.
Against this background, this paper discusses the motives for stabilising nominal exchange rates in emerging markets; how far central banks can sustain a target for the real exchange rate over the medium term; how the notions of long-run equilibrium exchange rates influence monetary policy strategies; and how monetary policy frameworks and actual decisions could incorporate exchange rate movements. The discussion is based on central bank papers published in this volume and questionnaire responses prepared for this meeting, as well as our own analysis, with a focus on the period from 2007 to early 2011.
The main findings of our paper are as follows. First, at least since 2009, central banks in emerging markets have been managing the value of their currencies more actively via some combination of reserve accumulation, policy interest rates and administrative measures. Second, motives for influencing exchange rates vary across jurisdictions, reflecting concerns about large capital flows, undesired spillovers from swings in global risk aversion and long-run external competitiveness. Third, more active currency management puts a premium on our understanding of equilibrium exchange rates, notions of which are still difficult to define conceptually and empirically. Finally, policy rates and exchange rate flexibility are critical tools in addressing the challenges facing EME central banks today, but there is no consensus yet on how best to incorporate exchange rate movements into monetary policy frameworks.
The remainder of the paper consists of five parts. Section 2 highlights key motives for stabilising nominal exchange rates. Section 3 discusses practical limitations for central banks that aim to sustain a target for the real exchange rate over the medium term. Section 4 reviews various notions of long-run equilibrium exchange rates used by central banks, and how they influence monetary policy strategies. Section 5 presents a simple analytical framework for discussing how monetary policy frameworks and actual decisions could incorporate exchange rate movements. Section 6 concludes.
1 The authors thank Stephen Cecchetti, Philip Turner and participants in the meeting for valuable comments,
and Jakub Demski, Lillie Lam and Agne Subelyte for outstanding research assistance.
38 BIS Papers No 57
2. Motives for stabilising nominal exchange rates
Why do central banks in emerging markets try to stabilise exchange rates of the currencies they issue? And how valid are these motives on theoretical and empirical grounds?
Whether central banks in emerging markets aim to stabilise nominal exchange rates depends in the first instance on the monetary policy framework and exchange rate regime they have adopted.2 Thus, central banks that operate a currency board or a fixed exchange rate regime, such as the Hong Kong Monetary Authority or the Saudi Arabian Monetary Authority, have a legal mandate to keep the external value of the domestic currency stable. Accordingly, they tailor their policy instruments to manage the exchange rate against a benchmark – exchange rate stability is simply the overriding goal of monetary policy.
For other exchange rate arrangements, the motives for stabilising exchange rates fall into roughly two broad categories: concerns about the short-term impact on macroeconomic and financial stability; and concerns about the medium- to long-term impact on resource allocation.
Short-term motives. All central banks naturally incorporate issues of exchange rate fluctuations into their respective monetary policy strategies. As noted in the National Bank of Poland paper in this volume, central banks are ultimately concerned about exchange rate movements even in a floating regime because these movements influence inflation. Ideally, floating exchange rates play a macroeconomic stabilisation role by absorbing various shocks. However, experience in emerging markets has shown all too often that significant short-term exchange rate movements that deviate from fundamentals can also affect macroeconomic performance.
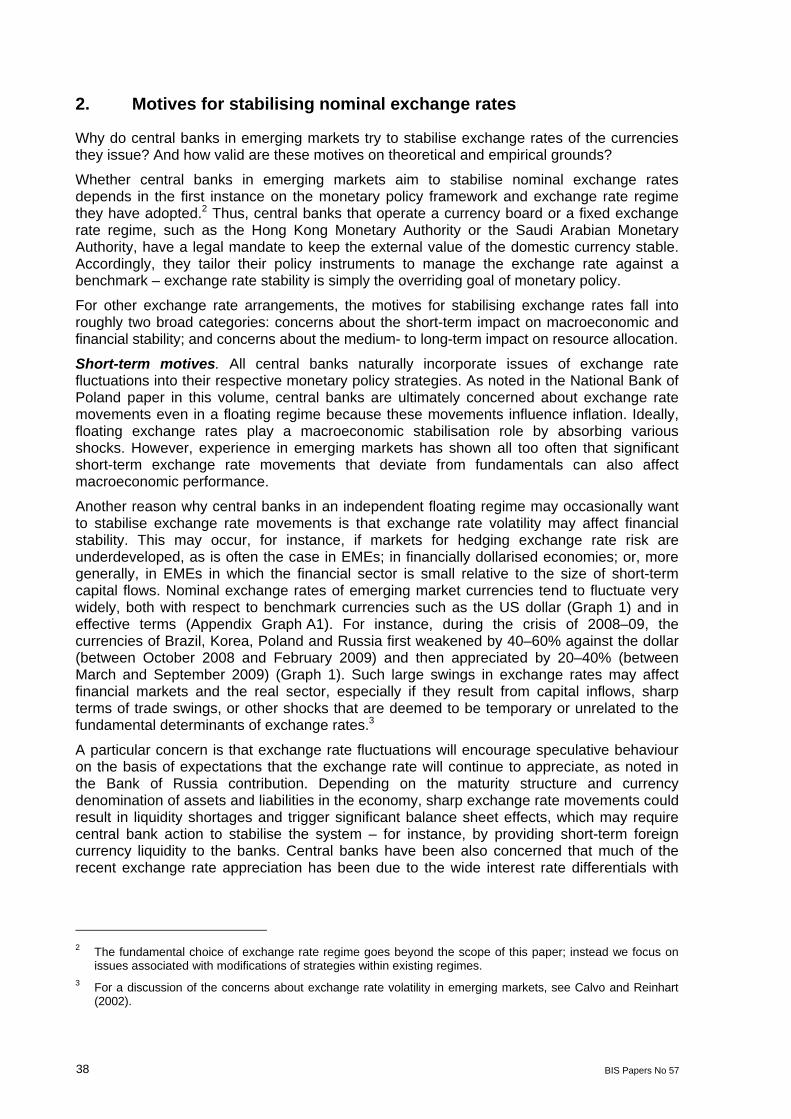
Another reason why central banks in an independent floating regime may occasionally want to stabilise exchange rate movements is that exchange rate volatility may affect financial stability. This may occur, for instance, if markets for hedging exchange rate risk are underdeveloped, as is often the case in EMEs; in financially dollarised economies; or, more generally, in EMEs in which the financial sector is small relative to the size of short-term capital flows. Nominal exchange rates of emerging market currencies tend to fluctuate very widely, both with respect to benchmark currencies such as the US dollar (Graph 1) and in effective terms (Appendix Graph A1). For instance, during the crisis of 2008–09, the currencies of Brazil, Korea, Poland and Russia first weakened by 40–60% against the dollar (between October 2008 and February 2009) and then appreciated by 20–40% (between March and September 2009) (Graph 1). Such large swings in exchange rates may affect financial markets and the real sector, especially if they result from capital inflows, sharp terms of trade swings, or other shocks that are deemed to be temporary or unrelated to the fundamental determinants of exchange rates.3
A particular concern is that exchange rate fluctuations will encourage speculative behaviour on the basis of expectations that the exchange rate will continue to appreciate, as noted in the Bank of Russia contribution. Depending on the maturity structure and currency denomination of assets and liabilities in the economy, sharp exchange rate movements could result in liquidity shortages and trigger significant balance sheet effects, which may require central bank action to stabilise the system – for instance, by providing short-term foreign currency liquidity to the banks. Central banks have been also concerned that much of the recent exchange rate appreciation has been due to the wide interest rate differentials with
2 The fundamental choice of exchange rate regime goes beyond the scope of this paper; instead we focus on
issues associated with modifications of strategies within existing regimes. 3 For a discussion of the concerns about exchange rate volatility in emerging markets, see Calvo and Reinhart
(2002).
BIS Papers No 57 39
respect to advanced economies, which is seen to result largely from the continuation of the near zero policy rates in advanced economies.
Graph 1
Nominal exchange rates against the US dollar1 2000–07 = 100
60
80
100
120
140
2008 2009 2010
ChinaIndiaKorea
Japan (memo)
60
80
100
120
140
2008 2009 2010
IndonesiaMalaysiaPhilippines
SingaporeThailand
40
70
100
130
160
190
2008 2009 2010
Argentina BrazilChile
ColombiaMexicoPeru
Nominal effectiverate of the UnitedStates (memo)
60
90
120
150
180
210
2008 2009 2010
Czech RepublicHungaryIsrael
PolandRussiaTurkeySouth Africa
Euro area(memo)
1 US dollars per unit of local currency. An increase indicates appreciation of local currency.
Sources: Bloomberg; Datastream; national data. A comparison of the pre- and post-crisis periods provides some support to concerns about the increased volatility in foreign exchange markets. The implied volatility (derived from foreign exchange options) of emerging market exchange rates has been generally higher since the start of the recovery in March 2009 than it was before September 2008 – the notable exception was the Thai baht (Graph 2). This suggests greater market uncertainty about exchange rates in the near term, a concern for policymakers in emerging market economies.
Graph 2
Implied volatility of exchange rates against the US dollar1 Average of the period
0
5
10
15
20
25
PLN ZAR HUF COP CZK KRW MXN CLP BRL TRY RUB IDR INR ILS PHP MYR SGD ARS PEN THB CNY HKD
January 2005 - August 2008March 2009 - December 2010
1 Implied volatility is derived from spot at-the-money exchange rate against US dollar options.
Sources: JPMorgan Chase; BIS calculations.
40 BIS Papers No 57
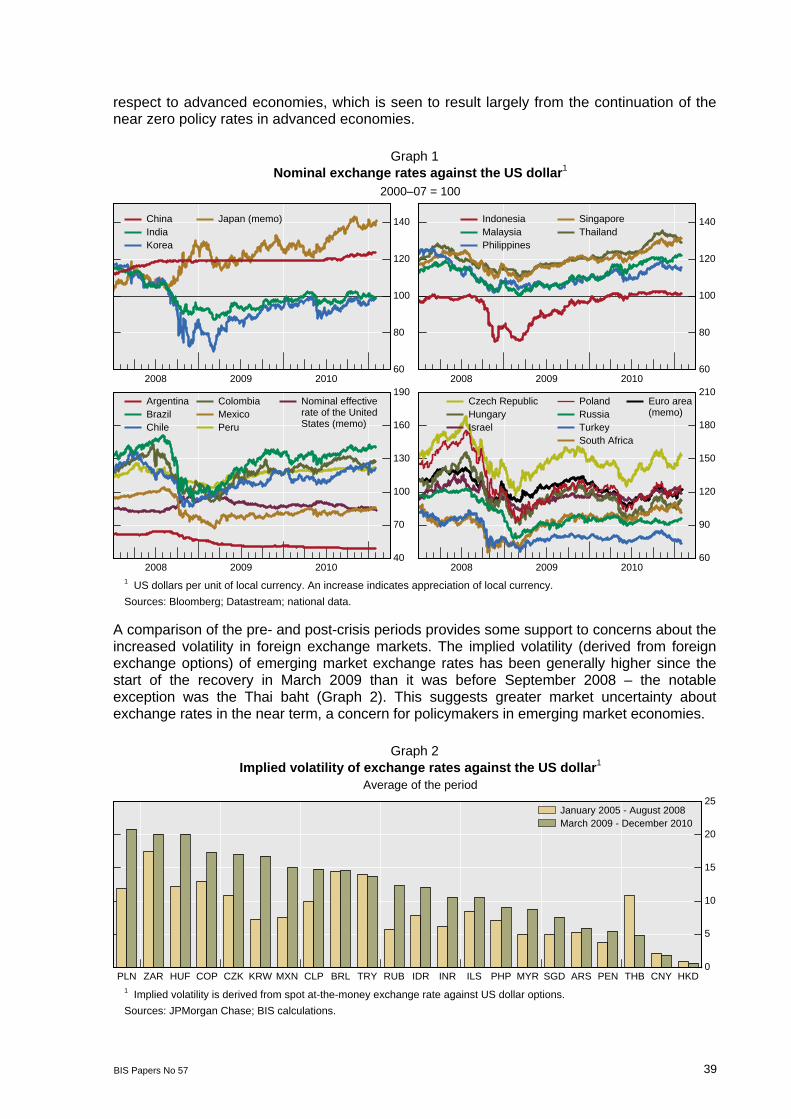
Recent policy discussions have highlighted one related motive for stabilising nominal exchange rates: in recent years, the demand for EME currencies has proved sensitive to changes in risk aversion in international markets. Thus, during the global financial market boom from 2003 to 2007, key emerging market currencies strengthened: the Brazilian real by 150%; the Indian rupee by almost 30%; the renminbi and other widely traded emerging market currencies by 15–20% (Graph 3). The Lehman bankruptcy and its aftermath led to a flight from emerging market assets, and the dollar value of most EME currencies plunged. The renminbi was an exception: it did not fall against the dollar and rose sharply against other emerging market currencies (green line in Graph 3). A significant recovery in the exchange rates of EMEs other than the renminbi did not start until the end of the period of extreme volatility in global financial asset prices around March/April 2009.
Graph 3
Nominal exchange rates of major emerging market currencies Against the US dollar, 2000–07 average = 100
60
80
100
120
140
160
2001 2002 2003 2004 2005 2006 2007 2008 2009 2010 2011
BrazilChinaIndiaOther emerging economies1
The vertical line marks 15 September 2008 (the Lehman Brothers bankruptcy). 1 Weighted average of four widely traded currencies – the Korean won, the Mexican peso, the South African rand and the Turkish lira, based on 2005 GDP and PPP exchange rates; an increase indicates appreciation of the local currency; monthly averages.
Sources: Thomson Reuters; BIS calculations.
Over the past year, developments in major international currencies have again strongly affected movements in emerging market exchange rates. Following a brief period of downward pressure triggered by the sovereign debt crisis in Greece in May 2010, key emerging market currencies appreciated against the US dollar until October (Graph 1). In Brazil, Chile, Korea, Poland, South Africa and Turkey, the nominal exchange rates appreciated by 13–23%. However, since early November 2010, the dollar has partly recovered against some major currencies, as the outlook for the US economy improved and a new round of sovereign debt problems emerged in Europe. Reflecting these developments – and not necessarily the economic performance of emerging markets, which was fairly stable throughout the year – the appreciation trend of emerging market currencies has reversed since November 2010 (notably in central and eastern Europe (CEE) and Korea), flattened in others (Brazil, Mexico and many Asian EMEs) and continued among major commodity exporters (including Chile and South Africa) (Graph 1).
Longer-term motives. For central banks operating managed exchange rate regimes, the additional motives for exchange rate stabilisation include the impact of exchange rate fluctuations on external competitiveness and the impact of possible exchange rate misalignment on resource allocation in the long term.
At a theoretical as well as empirical level, one can find some justification for concerns about the impact of exchange rates on external competitiveness. The demand for many emerging market exports is fairly price elastic. This may result in the loss of market share even in the short run. Furthermore, exchange rate appreciation puts the tradable sector at a
BIS Papers No 57 41
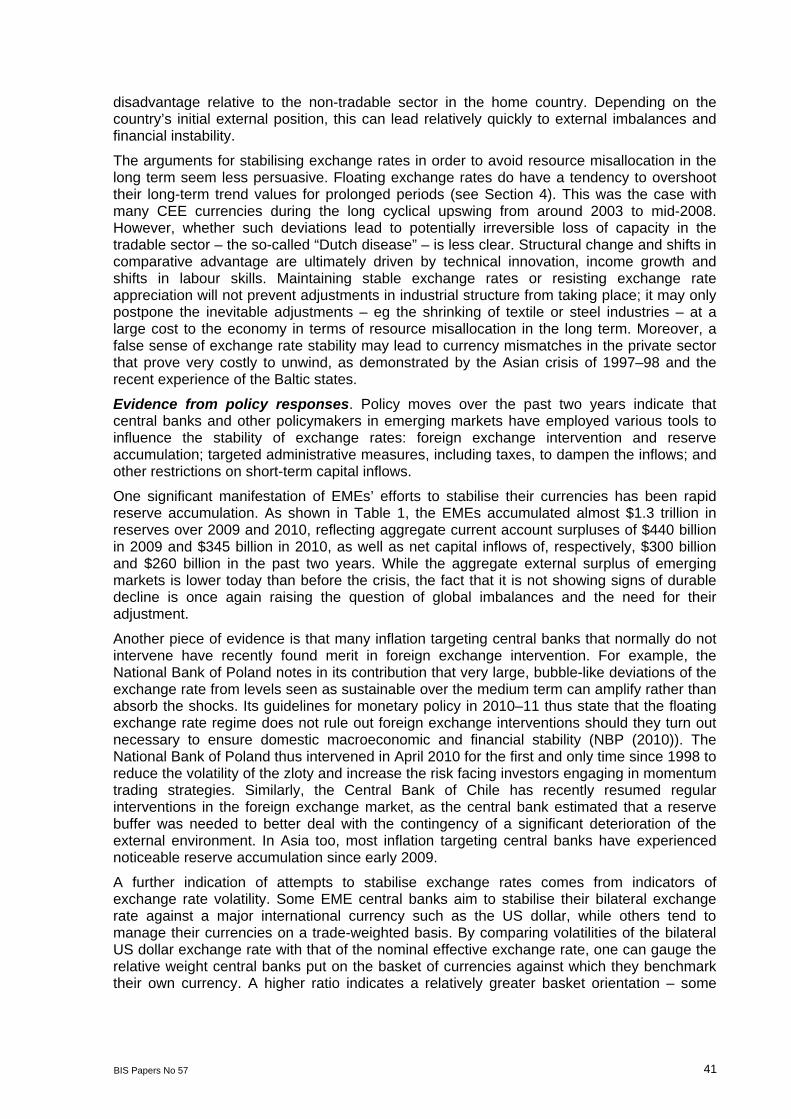
disadvantage relative to the non-tradable sector in the home country. Depending on the country’s initial external position, this can lead relatively quickly to external imbalances and financial instability.
The arguments for stabilising exchange rates in order to avoid resource misallocation in the long term seem less persuasive. Floating exchange rates do have a tendency to overshoot their long-term trend values for prolonged periods (see Section 4). This was the case with many CEE currencies during the long cyclical upswing from around 2003 to mid-2008. However, whether such deviations lead to potentially irreversible loss of capacity in the tradable sector – the so-called “Dutch disease” – is less clear. Structural change and shifts in comparative advantage are ultimately driven by technical innovation, income growth and shifts in labour skills. Maintaining stable exchange rates or resisting exchange rate appreciation will not prevent adjustments in industrial structure from taking place; it may only postpone the inevitable adjustments – eg the shrinking of textile or steel industries – at a large cost to the economy in terms of resource misallocation in the long term. Moreover, a false sense of exchange rate stability may lead to currency mismatches in the private sector that prove very costly to unwind, as demonstrated by the Asian crisis of 1997–98 and the recent experience of the Baltic states.
Evidence from policy responses. Policy moves over the past two years indicate that central banks and other policymakers in emerging markets have employed various tools to influence the stability of exchange rates: foreign exchange intervention and reserve accumulation; targeted administrative measures, including taxes, to dampen the inflows; and other restrictions on short-term capital inflows.
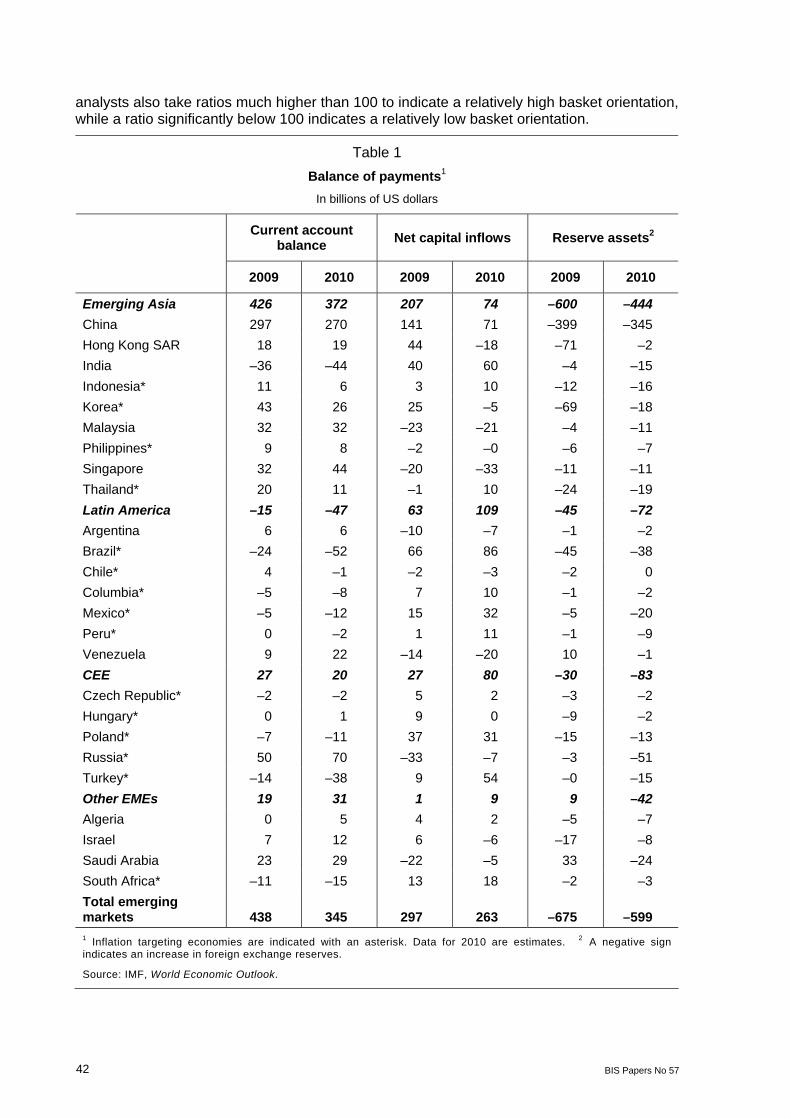
One significant manifestation of EMEs’ efforts to stabilise their currencies has been rapid reserve accumulation. As shown in Table 1, the EMEs accumulated almost $1.3 trillion in reserves over 2009 and 2010, reflecting aggregate current account surpluses of $440 billion in 2009 and $345 billion in 2010, as well as net capital inflows of, respectively, $300 billion and $260 billion in the past two years. While the aggregate external surplus of emerging markets is lower today than before the crisis, the fact that it is not showing signs of durable decline is once again raising the question of global imbalances and the need for their adjustment.
Another piece of evidence is that many inflation targeting central banks that normally do not intervene have recently found merit in foreign exchange intervention. For example, the National Bank of Poland notes in its contribution that very large, bubble-like deviations of the exchange rate from levels seen as sustainable over the medium term can amplify rather than absorb the shocks. Its guidelines for monetary policy in 2010–11 thus state that the floating exchange rate regime does not rule out foreign exchange interventions should they turn out necessary to ensure domestic macroeconomic and financial stability (NBP (2010)). The National Bank of Poland thus intervened in April 2010 for the first and only time since 1998 to reduce the volatility of the zloty and increase the risk facing investors engaging in momentum trading strategies. Similarly, the Central Bank of Chile has recently resumed regular interventions in the foreign exchange market, as the central bank estimated that a reserve buffer was needed to better deal with the contingency of a significant deterioration of the external environment. In Asia too, most inflation targeting central banks have experienced noticeable reserve accumulation since early 2009.
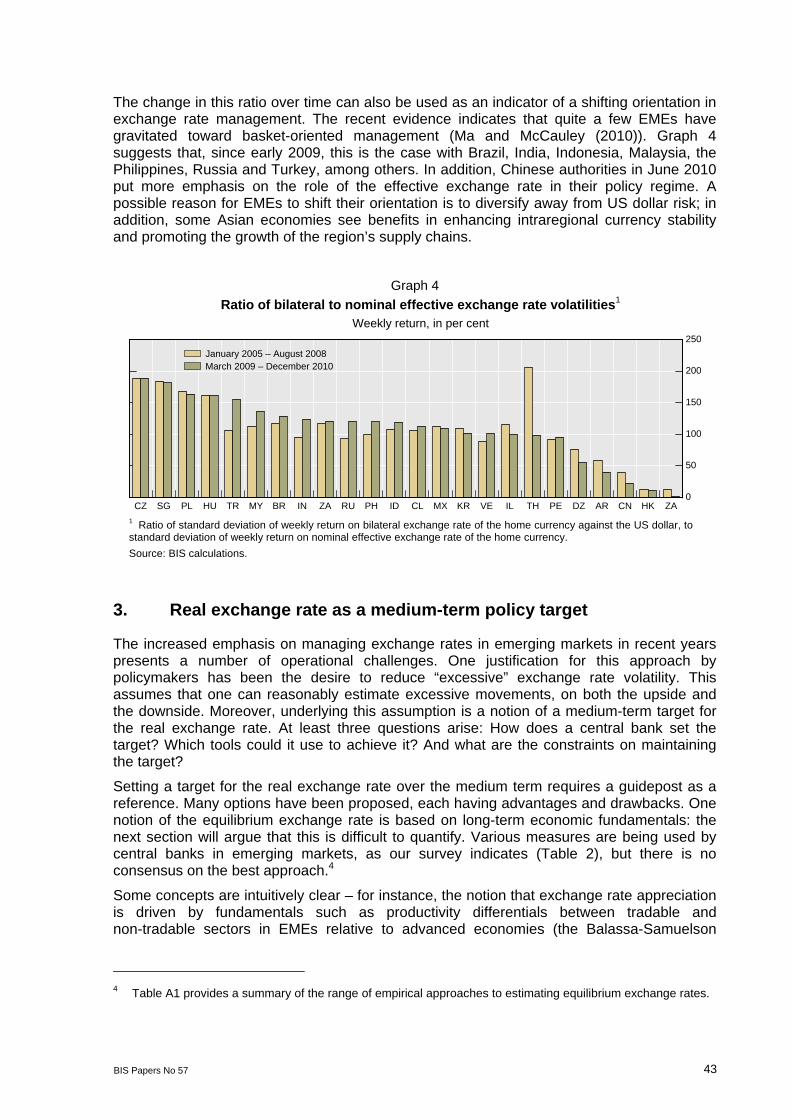
A further indication of attempts to stabilise exchange rates comes from indicators of exchange rate volatility. Some EME central banks aim to stabilise their bilateral exchange rate against a major international currency such as the US dollar, while others tend to manage their currencies on a trade-weighted basis. By comparing volatilities of the bilateral US dollar exchange rate with that of the nominal effective exchange rate, one can gauge the relative weight central banks put on the basket of currencies against which they benchmark their own currency. A higher ratio indicates a relatively greater basket orientation – some
42 BIS Papers No 57
analysts also take ratios much higher than 100 to indicate a relatively high basket orientation, while a ratio significantly below 100 indicates a relatively low basket orientation.
Table 1
Balance of payments1 In billions of US dollars
Current account balance Net capital inflows Reserve assets2
2009 2010 2009 2010 2009 2010
Emerging Asia 426 372 207 74 –600 –444 China 297 270 141 71 –399 –345
Hong Kong SAR 18 19 44 –18 –71 –2
India –36 –44 40 60 –4 –15
Indonesia* 11 6 3 10 –12 –16
Korea* 43 26 25 –5 –69 –18
Malaysia 32 32 –23 –21 –4 –11
Philippines* 9 8 –2 –0 –6 –7
Singapore 32 44 –20 –33 –11 –11
Thailand* 20 11 –1 10 –24 –19
Latin America –15 –47 63 109 –45 –72 Argentina 6 6 –10 –7 –1 –2
Brazil* –24 –52 66 86 –45 –38
Chile* 4 –1 –2 –3 –2 0
Columbia* –5 –8 7 10 –1 –2
Mexico* –5 –12 15 32 –5 –20
Peru* 0 –2 1 11 –1 –9
Venezuela 9 22 –14 –20 10 –1
CEE 27 20 27 80 –30 –83 Czech Republic* –2 –2 5 2 –3 –2
Hungary* 0 1 9 0 –9 –2
Poland* –7 –11 37 31 –15 –13
Russia* 50 70 –33 –7 –3 –51
Turkey* –14 –38 9 54 –0 –15
Other EMEs 19 31 1 9 9 –42 Algeria 0 5 4 2 –5 –7
Israel 7 12 6 –6 –17 –8
Saudi Arabia 23 29 –22 –5 33 –24
South Africa* –11 –15 13 18 –2 –3
Total emerging markets 438 345 297 263 –675 –599 1 Inflation targeting economies are indicated with an asterisk. Data for 2010 are estimates. 2 A negative sign indicates an increase in foreign exchange reserves.
Source: IMF, World Economic Outlook.
BIS Papers No 57 43
The change in this ratio over time can also be used as an indicator of a shifting orientation in exchange rate management. The recent evidence indicates that quite a few EMEs have gravitated toward basket-oriented management (Ma and McCauley (2010)). Graph 4 suggests that, since early 2009, this is the case with Brazil, India, Indonesia, Malaysia, the Philippines, Russia and Turkey, among others. In addition, Chinese authorities in June 2010 put more emphasis on the role of the effective exchange rate in their policy regime. A possible reason for EMEs to shift their orientation is to diversify away from US dollar risk; in addition, some Asian economies see benefits in enhancing intraregional currency stability and promoting the growth of the region’s supply chains.
Graph 4 Ratio of bilateral to nominal effective exchange rate volatilities1
Weekly return, in per cent
0
50
100
150
200
250
CZ SG PL HU TR MY BR IN ZA RU PH ID CL MX KR VE IL TH PE DZ AR CN HK ZA
January 2005 – August 2008March 2009 – December 2010
1 Ratio of standard deviation of weekly return on bilateral exchange rate of the home currency against the US dollar, to standard deviation of weekly return on nominal effective exchange rate of the home currency.
Source: BIS calculations.
3. Real exchange rate as a medium-term policy target
The increased emphasis on managing exchange rates in emerging markets in recent years presents a number of operational challenges. One justification for this approach by policymakers has been the desire to reduce “excessive” exchange rate volatility. This assumes that one can reasonably estimate excessive movements, on both the upside and the downside. Moreover, underlying this assumption is a notion of a medium-term target for the real exchange rate. At least three questions arise: How does a central bank set the target? Which tools could it use to achieve it? And what are the constraints on maintaining the target?
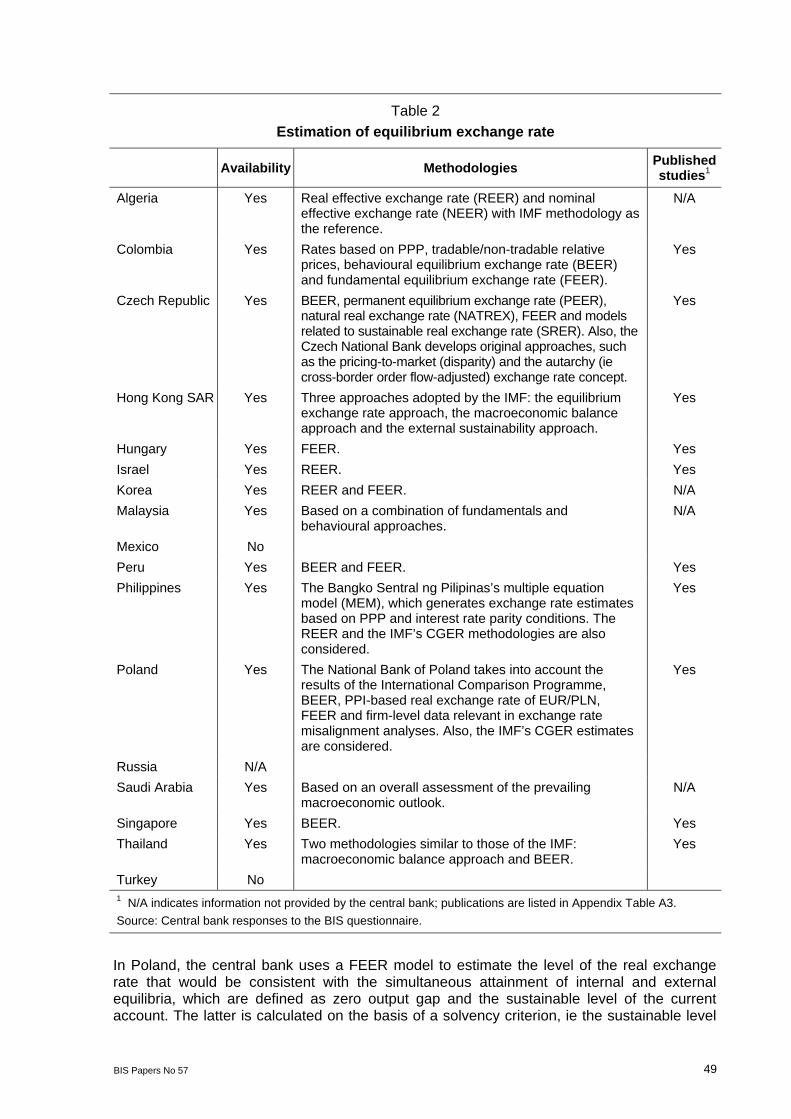
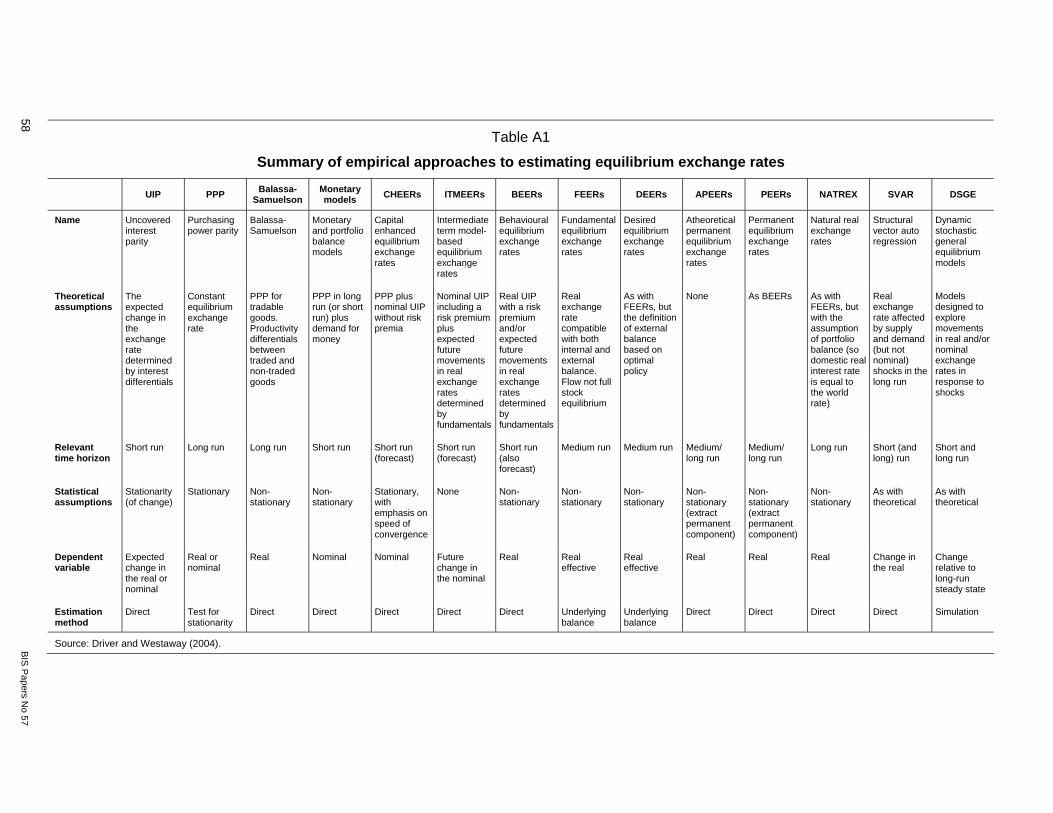
Setting a target for the real exchange rate over the medium term requires a guidepost as a reference. Many options have been proposed, each having advantages and drawbacks. One notion of the equilibrium exchange rate is based on long-term economic fundamentals: the next section will argue that this is difficult to quantify. Various measures are being used by central banks in emerging markets, as our survey indicates (Table 2), but there is no consensus on the best approach.4
Some concepts are intuitively clear – for instance, the notion that exchange rate appreciation is driven by fundamentals such as productivity differentials between tradable and non-tradable sectors in EMEs relative to advanced economies (the Balassa-Samuelson
4 Table A1 provides a summary of the range of empirical approaches to estimating equilibrium exchange rates.
44 BIS Papers No 57
effect).5 Even these well known concepts are difficult to operationalise. Calculating “permissible” real exchange rate appreciation within the Balassa-Samuelson framework requires a large amount of high-quality data that are not always available in emerging market economies. One measure of the challenge is that emerging market central banks have yet to solve the simpler problem of correctly measuring wage and price changes when calculating real exchange rates.
Regarding the tools used to achieve a targeted exchange rate, central banks in emerging markets traditionally rely on foreign exchange intervention (to influence the nominal exchange rate) and sterilisation (to offset the increase in banking system liquidity resulting from intervention). These techniques are well known, and central banks in emerging markets generally view them as effective (Mihaljek (2005)). However, the literature on intervention and sterilisation finds that such actions entail various risks and costs that eventually affect both the ability and the willingness of central banks to resist exchange rate movements. These include valuation losses, sterilisation costs and, in particular, increased commercial bank lending resulting from partial or ineffective sterilisation.6 Prolonged intervention can also result in the perception by the markets of a one-sided exchange rate bet. In such conditions, carry trade dynamics easily arise. Where one-sided bets accumulate, central banks may have an incentive to trade in a discretionary fashion on the other side. This may help to balance the order flows, but it may also lead to losses for the central bank.
Apart from the costs of intervention and sterilisation, general macroeconomic developments can also constrain the willingness of central banks to sustain a target for the exchange rate. Since late 2010, for instance, growing domestic inflationary pressures have complicated trade-offs associated with intervention, measures to dampen capital inflows and conventional monetary policy. The recent monetary policy environment in China illustrates this point: even though foreign exchange intervention and capital controls have been successful in limiting the pace and extent of nominal currency appreciation, they may not be able to succeed in alleviating inflationary pressures arising from the expansion of banking sector balance sheets. The policy alternatives are also problematic at this stage. Higher interest rates would help to rein in inflationary pressures but could wind up attracting additional capital inflows. And, an unchanged policy mix would mean that the costs and risks associated with foreign reserve accumulation would rise further.
Finally, controversy remains over the role of prolonged foreign exchange interventions by emerging market central banks in the face of persistent global current account imbalances. One perspective is that such actions impede global readjustments and even push down yields on very liquid international assets, which in turn compresses risk premia, inflates asset prices and lowers the perceived imperative for fiscal consolidation in advanced economies. Another perspective is that large fiscal deficits, easy monetary policy and quantitative easing in advanced economies aggravate global current account imbalances, prompting capital flows to emerging markets that result in EME central banks undertaking foreign exchange interventions. These two perspectives are not mutually exclusive.
5 The Balassa-Samuelson effect starts from the observation that productivity growth in the traded goods sector
has historically been faster than in the non-traded goods sector. By the law of one price, the prices of tradables tend to get equalised across countries, while the prices of non-tradables do not. Higher productivity in the tradable goods sector will bid up wages in that sector and, with labour being mobile, wages in the entire economy will rise. Producers of non-tradables will be able to pay the higher wages only if the relative price of non-tradables rises. This will lead to an increase in the overall price level and hence real exchange rate appreciation.
6 See, for instance, the accompanying background paper on intervention and central bank balance sheets, and Mohanty and Turner (2006).
BIS Papers No 57 45
4. Equilibrium exchange rates and monetary policy strategies in EMEs
How do notions of equilibrium exchange rates influence monetary policy strategies in emerging markets? As discussed in several central bank contributions to this volume, many emerging market central banks have concluded that recent capital inflows and real effective exchange rate appreciation are to a considerable extent due to sounder fundamentals in their countries. This is one of the conclusions in the central bank papers from the Czech Republic, Israel, the Philippines, Poland, South Africa and Thailand, among others. Several central banks also view the sizeable growth differential between the EMEs as a whole and the advanced economies as permanent, not cyclical. Similarly, some central banks (eg the South African Reserve Bank) now consider increased foreign investment in emerging market debt as structural in nature. These considerations would imply that the equilibrium real exchange rate of many EMEs has appreciated over the past few years and, hence, that the observed real effective exchange rate appreciation is consistent with equilibrium dynamics.
Nevertheless, commodity exporters, small open economies, and the EMEs that are closely integrated with advanced economies – such as Israel, Mexico and central European countries – remain more dependent on exports and growth in developed countries than the large economies of Brazil, China and India. For these smaller EMEs, large real appreciation can imply a palpable decline in external competitiveness. As noted by the Bank of Israel, real exchange rate misalignments that are due to medium-term deviations of the actual exchange rate from the equilibrium real exchange rate could result in inefficient resource allocation over the cycle, including underutilisation of factors of production in some periods and overutilisation in others.
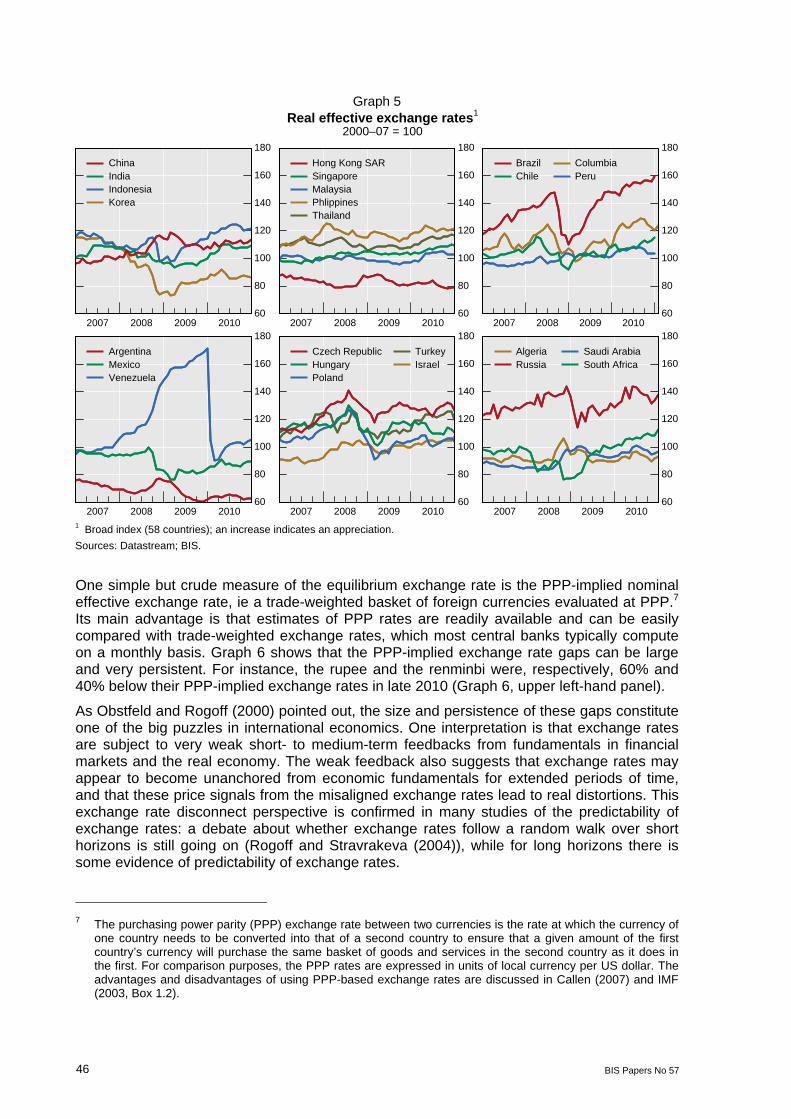
More solid evidence on where the equilibrium exchange rate might be at a point in time would enhance the ability of central banks to assess the implications of exchange rate fluctuations for policymaking. To illustrate this point, note that real effective exchange rates have fluctuated considerably over the past few years. If we compare the situation in early 2011 with the long-term average for the pre-crisis period from 2000 to 2007, the picture that emerges is one of very diverse developments across EMEs (Graph 5):
– strong real appreciation (40–60%) in Brazil and Russia;
– substantial appreciation (20–40%) in Indonesia, the Philippines, the Czech Republic, and Turkey;
– moderate appreciation (10–20%) in China, India, Singapore, Thailand, Chile, Hungary, Poland and South Africa;
– strong real depreciation (almost 40%) in Argentina;
– substantial real depreciation (10–20%) in Hong Kong SAR, Korea and Mexico; and
– stable real exchange rates compared to the 2000–07 average in Algeria, Israel, Poland, Saudi Arabia, Malaysia, Peru and Venezuela.
These very different developments suggest that the determinants of equilibrium real exchange rates are likely to be fairly country-specific. No generalisations are possible and each central bank needs to feel its way to what the equilibrium exchange rate of its currency might be at a given point in time.
46 BIS Papers No 57
Graph 5 Real effective exchange rates1
2000–07 = 100
60
80
100
120
140
160
180
2007 2008 2009 2010
ChinaIndiaIndonesiaKorea
60
80
100
120
140
160
180
2007 2008 2009 2010
Hong Kong SARSingaporeMalaysiaPhlippinesThailand
60
80
100
120
140
160
180
2007 2008 2009 2010
BrazilChile
ColumbiaPeru
60
80
100
120
140
160
180
2007 2008 2009 2010
ArgentinaMexicoVenezuela
60
80
100
120
140
160
180
2007 2008 2009 2010
Czech RepublicHungaryPoland
TurkeyIsrael
60
80
100
120
140
160
180
2007 2008 2009 2010
AlgeriaRussia
Saudi ArabiaSouth Africa
1 Broad index (58 countries); an increase indicates an appreciation.
Sources: Datastream; BIS.
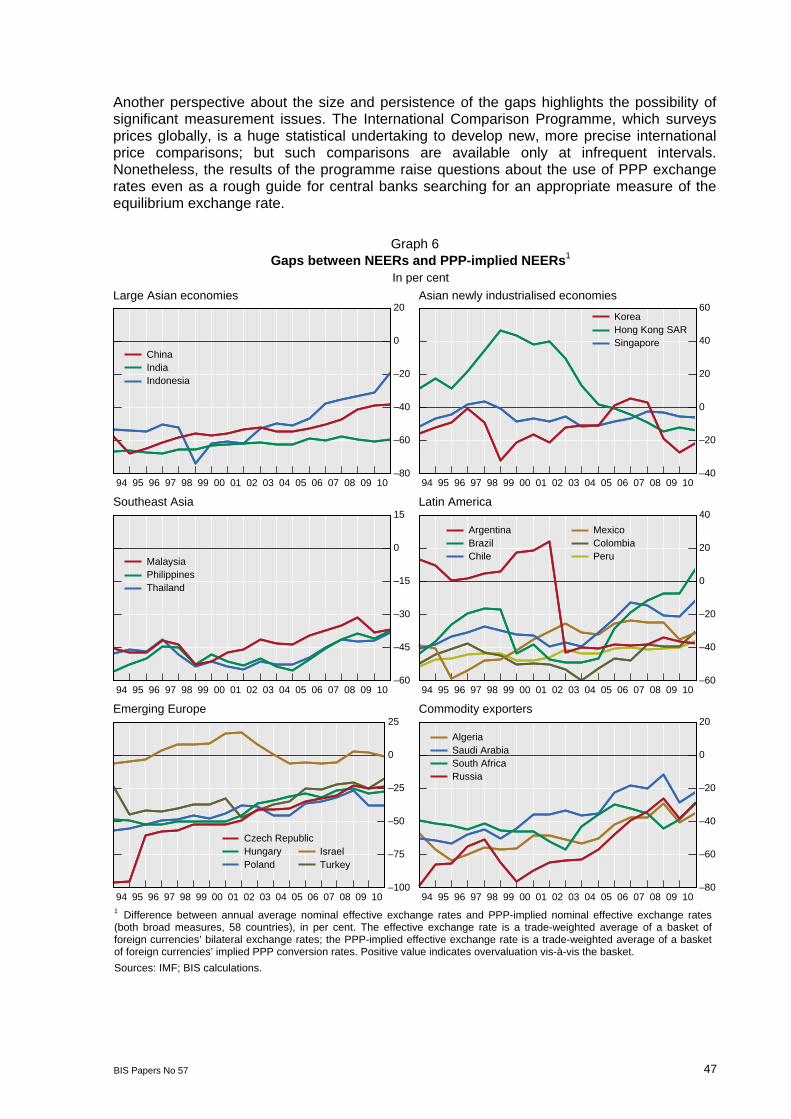
One simple but crude measure of the equilibrium exchange rate is the PPP-implied nominal effective exchange rate, ie a trade-weighted basket of foreign currencies evaluated at PPP.7 Its main advantage is that estimates of PPP rates are readily available and can be easily compared with trade-weighted exchange rates, which most central banks typically compute on a monthly basis. Graph 6 shows that the PPP-implied exchange rate gaps can be large and very persistent. For instance, the rupee and the renminbi were, respectively, 60% and 40% below their PPP-implied exchange rates in late 2010 (Graph 6, upper left-hand panel).
As Obstfeld and Rogoff (2000) pointed out, the size and persistence of these gaps constitute one of the big puzzles in international economics. One interpretation is that exchange rates are subject to very weak short- to medium-term feedbacks from fundamentals in financial markets and the real economy. The weak feedback also suggests that exchange rates may appear to become unanchored from economic fundamentals for extended periods of time, and that these price signals from the misaligned exchange rates lead to real distortions. This exchange rate disconnect perspective is confirmed in many studies of the predictability of exchange rates: a debate about whether exchange rates follow a random walk over short horizons is still going on (Rogoff and Stravrakeva (2004)), while for long horizons there is some evidence of predictability of exchange rates.
7 The purchasing power parity (PPP) exchange rate between two currencies is the rate at which the currency of
one country needs to be converted into that of a second country to ensure that a given amount of the first country’s currency will purchase the same basket of goods and services in the second country as it does in the first. For comparison purposes, the PPP rates are expressed in units of local currency per US dollar. The advantages and disadvantages of using PPP-based exchange rates are discussed in Callen (2007) and IMF (2003, Box 1.2).
BIS Papers No 57 47
Another perspective about the size and persistence of the gaps highlights the possibility of significant measurement issues. The International Comparison Programme, which surveys prices globally, is a huge statistical undertaking to develop new, more precise international price comparisons; but such comparisons are available only at infrequent intervals. Nonetheless, the results of the programme raise questions about the use of PPP exchange rates even as a rough guide for central banks searching for an appropriate measure of the equilibrium exchange rate.
Graph 6
Gaps between NEERs and PPP-implied NEERs1 In per cent
Large Asian economies Asian newly industrialised economies
–80
–60
–40
–20
0
20
94 95 96 97 98 99 00 01 02 03 04 05 06 07 08 09 10
ChinaIndiaIndonesia
–40
–20
0
20
40
60
94 95 96 97 98 99 00 01 02 03 04 05 06 07 08 09 10
KoreaHong Kong SARSingapore
Southeast Asia Latin America
–60
–45
–30
–15
0
15
94 95 96 97 98 99 00 01 02 03 04 05 06 07 08 09 10
MalaysiaPhilippinesThailand
–60
–40
–20
0
20
40
94 95 96 97 98 99 00 01 02 03 04 05 06 07 08 09 10
ArgentinaBrazilChile
MexicoColombiaPeru
Emerging Europe Commodity exporters
–100
–75
–50
–25
0
25
94 95 96 97 98 99 00 01 02 03 04 05 06 07 08 09 10
Czech RepublicHungaryPoland
IsraelTurkey
–80
–60
–40
–20
0
20
94 95 96 97 98 99 00 01 02 03 04 05 06 07 08 09 10
AlgeriaSaudi ArabiaSouth AfricaRussia
1 Difference between annual average nominal effective exchange rates and PPP-implied nominal effective exchange rates (both broad measures, 58 countries), in per cent. The effective exchange rate is a trade-weighted average of a basket of foreign currencies’ bilateral exchange rates; the PPP-implied effective exchange rate is a trade-weighted average of a basket of foreign currencies’ implied PPP conversion rates. Positive value indicates overvaluation vis-à-vis the basket.
Sources: IMF; BIS calculations.
48 BIS Papers No 57
Many emerging market central banks have therefore been developing more sophisticated empirical models of equilibrium exchange rates. Table A1 in the Appendix provides a summary of more than a dozen currently used approaches to estimating equilibrium exchange rates.8 One unresolved conceptual issue in this literature is the choice of the appropriate price index (CPI, tradable prices, unit labour costs, GDP deflators). Another is assumptions about the nature of adjustment mechanism in foreign exchange markets – is the main driver of adjustments uncovered interest rate parity over long horizons, or do internal and external imbalances in EMEs play a key role?
Among central banks attending this meeting, only India, Mexico, Russia, Saudi Arabia and Turkey do not prepare estimates of long-run equilibrium exchange rates (Table 2). Of those that do, Hungary, Korea and Malaysia do not publish their estimates because they consider them to be sensitive information that could be potentially disruptive to the foreign exchange market.
Most central banks report in answers to the BIS questionnaire that they use a combination of behavioural (BEER) and fundamental (FEER) equilibrium exchange rate methodologies (including the Czech Republic, Colombia, Malaysia, Peru and Poland) (Table 2). Singapore and Thailand combine estimates from macroeconomic balance and BEER approaches; and Hungary, Israel and Korea those from external sustainability and FEER approaches. Algeria, Hong Kong SAR and the Philippines rely on the IMF’s three major Consultative Group on Exchange Rates (CGER) methodologies. The Central Bank of Algeria, for instance, intervenes on the foreign exchange market on the basis of inflation differentials against the major trading partners and other fundamental indicators of the domestic economy. Several central banks also look at the PPP estimates of equilibrium exchange rates (eg Colombia, the Philippines and Poland). Overall, the methodology for estimating equilibrium exchange rates seems to be particularly well developed in Colombia, the Czech Republic, Israel and Poland.
Among the contributions to this volume, the paper by Bank of Israel analyses estimates of the equilibrium real exchange rate of the Israeli shekel and how they are used in deciding on FX interventions. The estimates based on a model derived from long-run fundamentals show that the Israeli currency was overvalued in early 2008. This prompted the central bank to start purchasing foreign currency, thereby probably contributing to a gradual realignment and some undervaluation in 2009, followed by convergence close to equilibrium in 2010. However, based on an alternative approach, the real exchange rate was still undervalued in 2010 due to the relatively large current account surplus.
In Colombia, the central bank staff routinely prepare estimates of long-run equilibrium exchange rates based on several methodologies: PPP, tradable/non-tradable relative prices (Balassa-Samuelson approach), BEER and FEER. The staff calculate estimates and confidence intervals for each methodology, and assess the probability of misalignment by examining the position of the current real exchange rate or nominal effective exchange rate with respect to the confidence intervals. This information is used to form a judgment on misalignments, which is in turn a key input in foreign exchange intervention decisions. Most methodologies are computed for a PPI-based, trade-weighted real exchange rate index, but the staff also examine other real exchange rate indices, including CPI-based indices and indices of competitiveness in third markets.
8 For literature reviews, see Égert (2003) and Égert et al (2006).
BIS Papers No 57 49
Table 2
Estimation of equilibrium exchange rate
Availability Methodologies Published studies1
Algeria Yes Real effective exchange rate (REER) and nominal effective exchange rate (NEER) with IMF methodology as the reference.
N/A
Colombia Yes Rates based on PPP, tradable/non-tradable relative prices, behavioural equilibrium exchange rate (BEER) and fundamental equilibrium exchange rate (FEER).
Yes
Czech Republic Yes BEER, permanent equilibrium exchange rate (PEER), natural real exchange rate (NATREX), FEER and models related to sustainable real exchange rate (SRER). Also, the Czech National Bank develops original approaches, such as the pricing-to-market (disparity) and the autarchy (ie cross-border order flow-adjusted) exchange rate concept.
Yes
Hong Kong SAR Yes Three approaches adopted by the IMF: the equilibrium exchange rate approach, the macroeconomic balance approach and the external sustainability approach.
Yes
Hungary Yes FEER. Yes
Israel Yes REER. Yes
Korea Yes REER and FEER. N/A
Malaysia Yes Based on a combination of fundamentals and behavioural approaches.
N/A
Mexico No
Peru Yes BEER and FEER. Yes
Philippines Yes The Bangko Sentral ng Pilipinas’s multiple equation model (MEM), which generates exchange rate estimates based on PPP and interest rate parity conditions. The REER and the IMF’s CGER methodologies are also considered.
Yes
Poland Yes The National Bank of Poland takes into account the results of the International Comparison Programme, BEER, PPI-based real exchange rate of EUR/PLN, FEER and firm-level data relevant in exchange rate misalignment analyses. Also, the IMF’s CGER estimates are considered.
Yes
Russia N/A
Saudi Arabia Yes Based on an overall assessment of the prevailing macroeconomic outlook.
N/A
Singapore Yes BEER. Yes
Thailand Yes Two methodologies similar to those of the IMF: macroeconomic balance approach and BEER.
Yes
Turkey No 1 N/A indicates information not provided by the central bank; publications are listed in Appendix Table A3.
Source: Central bank responses to the BIS questionnaire.
In Poland, the central bank uses a FEER model to estimate the level of the real exchange rate that would be consistent with the simultaneous attainment of internal and external equilibria, which are defined as zero output gap and the sustainable level of the current account. The latter is calculated on the basis of a solvency criterion, ie the sustainable level
50 BIS Papers No 57
of the current account that stabilises Poland’s net foreign debt at an exogenously set level. A particular feature of the National Bank of Poland (NBP) model is that it takes into account the supply side performance of the Polish economy, by incorporating firm-level data relevant in exchange rate misalignment analyses. The results of the model are updated quarterly and are presented to the Monetary Policy Council.9
The Czech National Bank paper in this volume discusses how measures of long-term equilibrium exchange rates have been used in assessing the timing of entry to the euro area. Because the long-term trend appreciation of the Czech koruna, which is driven by high productivity growth in its tradable sector, is expected to continue over the next decade, entering the euro area now would imply an expansionary shock to interest rates of 1½–3 percentage points. This could lead to the boom and bust cycle observed in countries such as Greece, Ireland, Portugal and Spain before they entered the euro area in the 1990s.
Many central banks in EMEs have faced a more pressing issue over the past year: How fast and how far can they allow exchange rates to appreciate before a potentially unhealthy dynamic in domestic asset markets develops? Here opinions clearly differ. One view, mentioned in the note by the Bank of Russia, is that allowing a sharp currency appreciation would create a two-way forex risk, limiting speculative inflows into domestic asset markets. A contrary view is that appreciation generates expectations of further appreciation, sparking increased carry trades and aggravating an overshooting of domestic asset prices.
In practice, it is often difficult for policymakers to be precisely guided in their decisions by estimates generated from models of equilibrium exchange rates. Concerns about the impact of exchange rate volatility on financial stability and fears about the loss of export revenue should exchange rates ultimately overshoot factor into decisions by policymakers to resist exchange rate appreciation by applying some combination of interest rate and exchange rate policies. This issue is addressed in the next section.
5. Exchange rates in monetary policy frameworks: tools, targets or both?
The preceding discussion indicated that the exchange rate can play two different roles in the monetary policy frameworks of emerging market economies. First, it can be used as a policy tool to help achieve the inflation target and output stabilisation. Second, it can be a separate target of monetary policy in a way similar to the inflation target. This section describes a simple conceptual framework that could be used to analyse these two roles of the exchange rate in monetary policy frameworks.
5.1 Exchange rate as a policy tool To the extent that central banks can control both the policy rate and the nominal exchange rate – for instance, in a managed floating regime with incomplete capital mobility – the exchange rate could be used as a tool of monetary policy. Other things being equal, letting the nominal exchange rate appreciate would lower domestic prices of imports and help lower the import components of production costs and consumer prices.
9 These are the results of an economic climate survey conducted each quarter among more than 1,000 Polish
enterprises. The indicator used most often is the median answer to the question “At which EUR/PLN rate does your export activity becomes unprofitable?” The results of the survey are posted on the NBP website and are presented to the Monetary Policy Council.
BIS Papers No 57 51
A special case of the use of the exchange rate as a monetary policy tool is that of Singapore. The Monetary Authority of Singapore (MAS) operates a managed floating regime with domestic interest rates largely determined by foreign interest rates and the expected future movements of the Singapore dollar. To achieve price stability, MAS targets a trade-weighted value of the Singapore dollar so that it appreciates when the economy is overheating and depreciates when the economy is weak.
One way to conceptualise this framework is to consider an exchange rate-augmented Taylor-type rule, following the approach of Ball (1999):
*1 1 1(1 ) ( ) ( )T
t t t t t tR f y y (1)
where the right-hand side of equation (1) includes three terms of a conventional Taylor-type rule: a constant α; an inflation gap (πt–1 – πT), defined as the deviation of inflation from its target; and the output gap (yt–1 – y*
t–1), defined as the deviation of output from potential.10 The left-hand side of the equation includes a weighted average of the policy interest rate, R, and the nominal exchange rate, f, with a weight ω that takes on values between zero and one.
We can think of the weight ω as characterising various types of exchange rate regimes: a freely floating regime would be consistent with ω = 1; while ω = 0 is consistent with a Singapore-type framework. Intermediate values of ω would represent managed floating regimes. Equation (1) thus highlights possible trade-offs between the policy interest rate and the exchange rate as monetary policy tools in EMEs. Historically, the central banking practice of focusing on an average of the policy interest rate and the exchange rate was formalised at several central banks (eg the Bank of Canada, the Reserve Bank of New Zealand and Sveriges Riksbank) as a monetary conditions index (MCI). In the past decade, formal MCI regimes have fallen out of fashion.
From a theoretical point of view, Ball (1999) emphasises that the optimal choice of ω arises from consideration of the role of exchange rates in determining both output and inflation dynamics, and of the policymakers’ preferences for output and inflation variability.11
In practice, EME policymakers rely on more pragmatic assessments when choosing the best mix of policy rates and exchange rate movements. In recent years, greater willingness to manage exchange rates raises questions about how central banks have been deciding this policy mix.
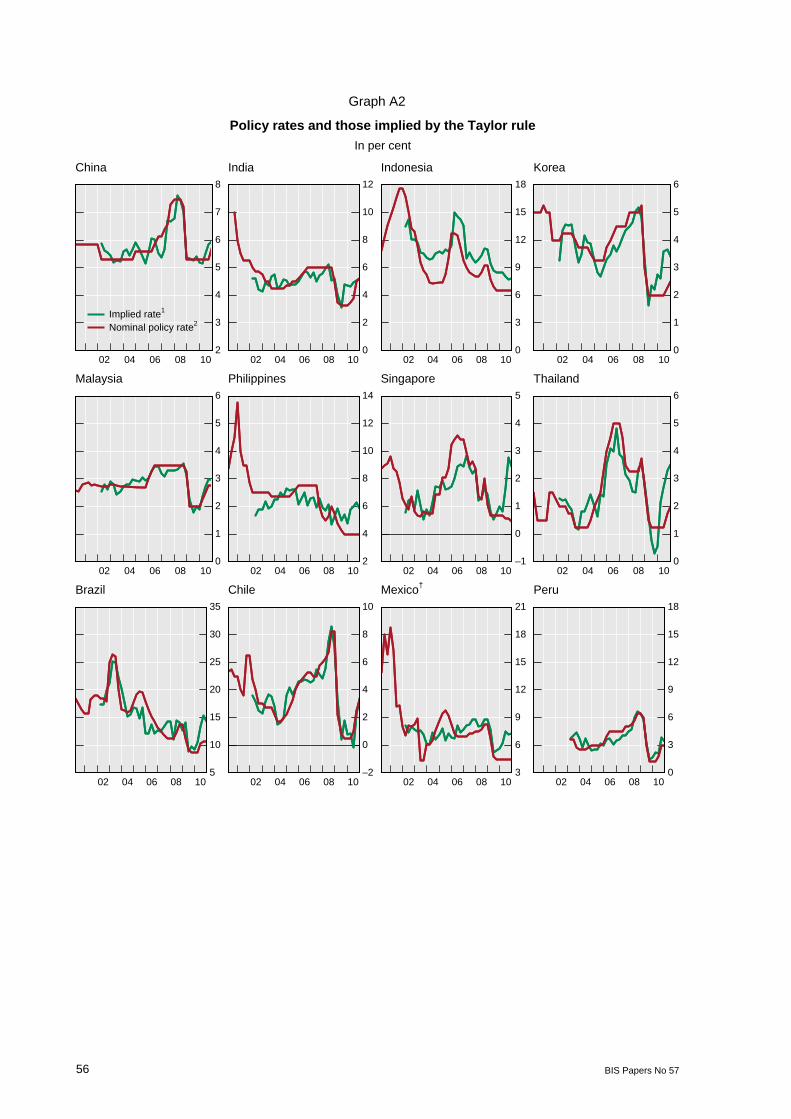
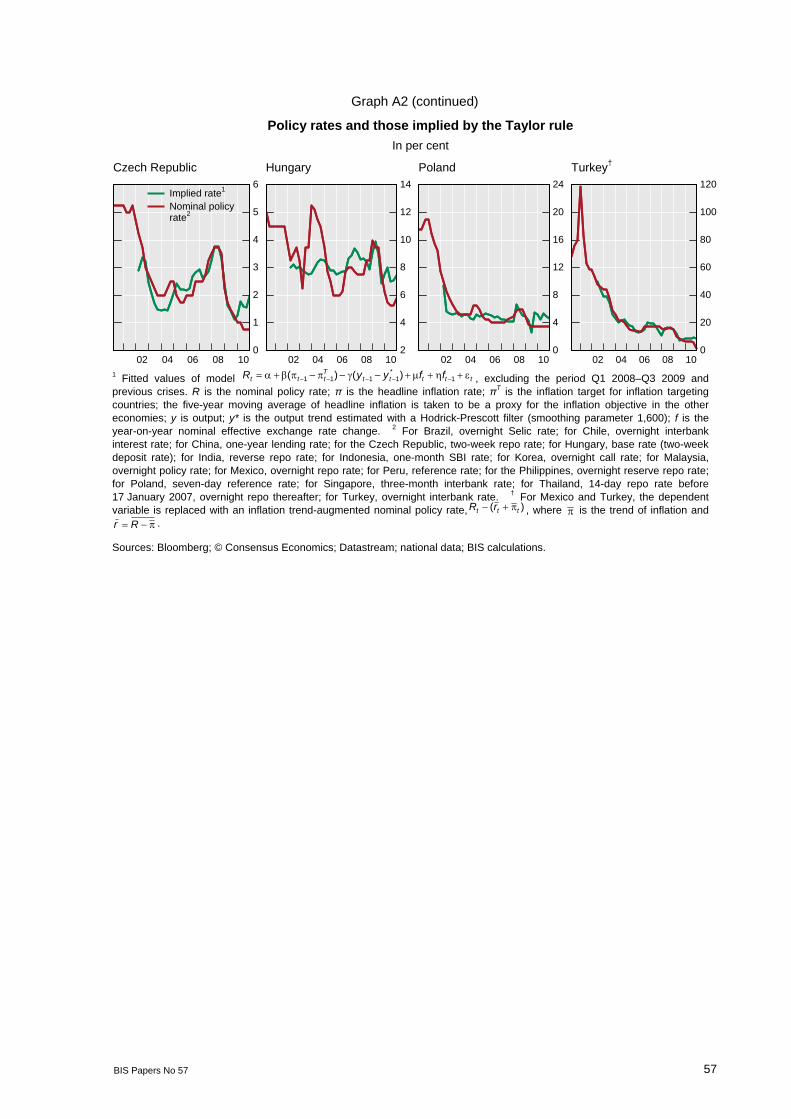
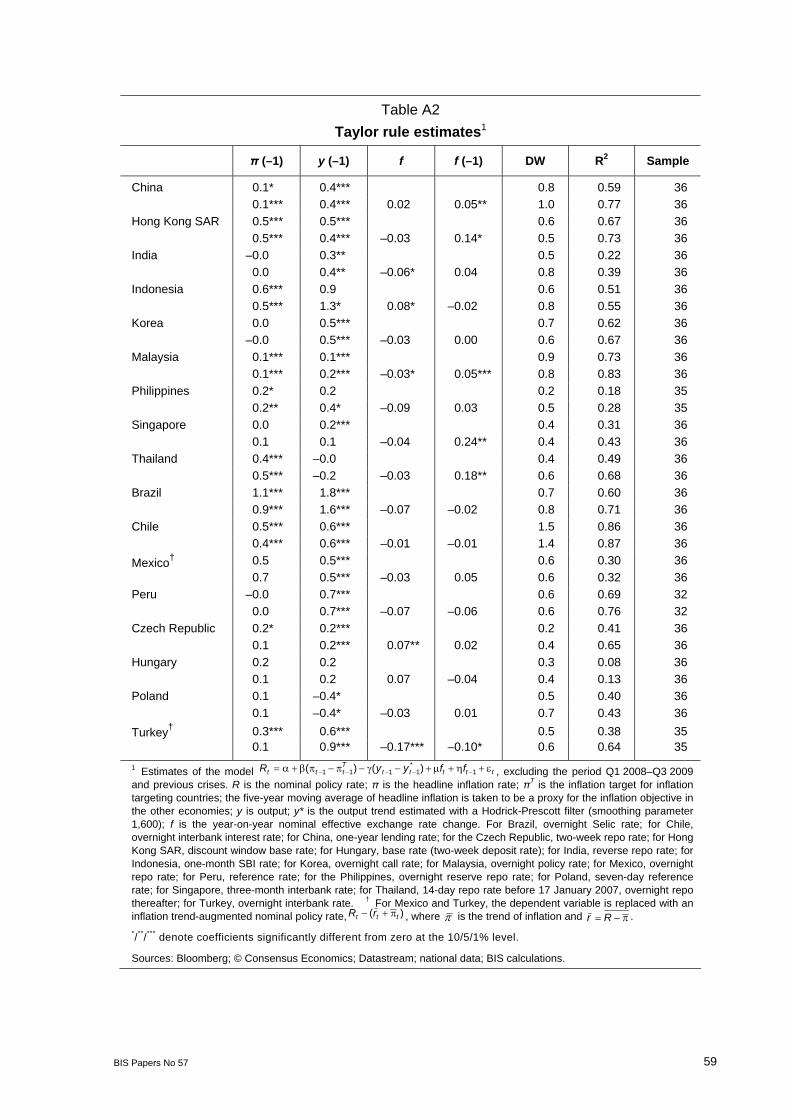
To inform the discussion of this issue, we estimated a version of equation (1) and plotted the fitted against the actual policy rates in the Appendix (Graph A2). Except for some end points, the estimated policy rates fit the actual policy rates fairly well in a number of countries, in particular Chile, India, Malaysia, Peru, Thailand and Turkey. For some of the others, the estimated policy rates can undershoot or overshoot the actual policy rates by a large margin at times, indicating the importance of factors other than inflation, output and exchange rates.
Table A2 presents the coefficient estimates and test statistics for the corresponding regressions. The coefficient estimates on inflation and output gaps generally have the correct signs and are statistically significant. The coefficients on the exchange rate are somewhat more diverse. The negative signs would be consistent with a trade-off between changing the exchange rate and policy interest rates in determining the policy setting.
10 Ball (1999) also includes a lagged value of the exchange rate on the left-hand side of the equation. For
expositional purposes, we drop this in equation (1), but include it when estimating the model. 11 Formally, the results are derived from a standard linear-quadratic optimal monetary policy setup with a set of
equations describing the macroeconomy and a standard quadratic loss function for the central bank in terms of a weighted average of inflation and output variability.
52 BIS Papers No 57
5.2 Rethinking currency misalignments and monetary policy Engel (2011) has recently argued that currency misalignments should play a bigger role in the setting of monetary policy. He derives this result from a fully optimising model of monetary policy and shows that the appropriate loss function in such an economy depends on the square of the inflation gaps, output gaps and the average currency misalignment. In other words, his research suggests that central banks should target currency misalignments (in addition to inflation gaps and output gaps) to reduce the inefficient resource allocations associated with violations of purchasing power parity across economies. Questions remain about how relevant this research is for emerging market central banks.
One simple way to think about this issue more formally is by adding a misalignment variable on the right-hand side of equation (1).12 Such a simple instrument rule captures the notion that a central bank would use its policy tools to stabilise inflation, output and exchange rates around the inflation target, potential output and an appropriate measure of the equilibrium exchange rate, respectively. In this sense, such a simple monetary policy rule captures the notion of “leaning against the wind” with respect to exchange rate misalignments.
It is important to note that this type of policy rule does not imply that central banks would narrowly focus on exchange rate deviations, as was the case with PPP-based exchange rate regimes in the 1980s and 1990s (Reinhart and Rogoff (2004)). Those regimes did not provide a strong nominal anchor for inflation expectations: in the face of an inflation shock, the nominal exchange rate would depreciate; this would raise import prices; and lead to further rounds of inflation via the pass-through effect, and so on. Over the past two decades, many EME central banks have gained credibility for achieving and maintaining price stability, so it is unlikely that the narrow PPP-based exchange rate regimes of the past would be seen as desirable today.
Instead, this approach highlights the multiple objectives that central banks would try to balance simultaneously. First and foremost, price stability is important. This does not suggest that central banks aim to keep inflation at the target every period; rather, central banks aim to reduce inflation deviations – on either the upside or the downside – over time in a way consistent with price stability. The record for this approach to targeting inflation has been commendable in both advanced and emerging market economies (see eg Filardo and Genberg (2010)).
Second, output stabilisation is also important. This objective can be explicit in the central bank’s preferences, as in the case of dual-mandate central banks such as the Federal Reserve. It can also reflect indirectly the important influence of the output gap on inflation dynamics, as is the case in many formal monetary policy models of inflation targeting.
Finally, as with inflation and output stabilisation, central banks would not strictly target a given level of the exchange rate at each point in time. Rather, a central bank would factor in its policy decisions the desired speed at which to reduce the misalignment of the exchange rate from its equilibrium rate, along with concerns about inflation and the stage of the business cycle. Technically, the speed of adjustment in general equilibrium would reflect the central bank’s preferences and the time series behaviour of output, inflation, exchange rates and other key macroeconomic variables.
A few other comments on policy horizons and measurement uncertainty deserve consideration.
12 It is important to note, as Engel (2011) does, that the proposed instrument rule is not unique under the
assumptions in the model. For a discussion of instrument rules and targeting rules in his model based on that of Clarida et al (2002), see Section 9 of Engel (2011).
BIS Papers No 57 53
Conventionally, the policy horizon for inflation and output stabilisation is one to two years. In cases where this is judged to be too short given the nature of shocks influencing the monetary policy environment – eg in the case of crises or other large and persistent macroeconomic shocks – the policy horizon can be appropriately extended. For exchange rates, the convergence to the equilibrium value may be much longer than for inflation and output. In part, this may be due to the fact that the determinants of exchange rates, such as inter-industry and international productivity differentials, take several years to adjust to their equilibrium values (Obstfeld and Rogoff (2000)). In such cases, central banks may prefer to allow the exchange rate to converge over a relatively long horizon and therefore avoid strong reactions to misalignments.
Uncertainties about the measurement of equilibrium real exchange rates may also influence the desired speed of adjustment. The greater the uncertainty, the smaller generally will be the desired reaction to exchange rate misalignments.13 Otherwise, spuriously measured deviations could result in undue volatility in policy actions.
If measurement uncertainty is very pronounced, one could adopt a more state-dependent approach to incorporating exchange rate deviations into monetary policy decisions.14 Algebraically, one can think of an indicator function that would turn on a misalignment term in an extended version of equation (1) only when the deviation of the equilibrium exchange rate was deemed very large. This “second pillar” approach would take account of the longer-term risks, ie the risk arising from long-term resource misallocations that might be associated with exchange rates deviating too far for too long from reasonable estimates of equilibrium exchange rates. In practice, this would mean that the central bank may need to adjust policy rates even though inflation and output forecasts at conventional horizons appear well behaved.
In sum, recent research puts a spotlight on the question of whether currency misalignments should play a role in monetary policy decisions generally and in EMEs particularly. The relevance of this research is likely to vary across economies. For relatively closed economies, this issue may be relatively minor. For open economies that face considerable deviations from the law of one price, this issue may be more important. Of course, difficulties in accurately measuring misalignments and in communicating with the public have to be factored in. Overall, this discussion raises issues of whether EME central banks that already target misalignments should do more, and whether those that do not should put greater emphasis on misalignments in the conduct of monetary policy.
6. Conclusion
Exchange rates have been playing an increasingly important role in the monetary policy decisions of emerging market economies in recent years. This has reflected not only the developments during the global financial crisis, but also features of the current conjuncture, including the impact on exchange rates of volatile capital flows, low global interest rates and spillovers from changes in risk aversion in global financial markets. Central banks have been concerned about the impact of heightened exchange rate volatility on macroeconomic and financial stability, as well as on external competitiveness and resource allocations. As a
13 Taylor and Williams (2010) point out that, in much of the literature on mismeasurement of variables such as
the output gap, the optimal coefficient on the mismeasured variable declines in the presence of errors. See Svensson and Woodford (2000) for a theoretical exception to this general statement.
14 For more details on this approach, see eg Svensson (2003) and Disyatat (2005).
54 BIS Papers No 57
result, many central banks are finding greater merit in stabilising exchange rates than in the past.
Greater attention to exchange rate stability puts a premium on central banks’ understanding of equilibrium exchange rates. However, notions of equilibrium exchange rates are difficult to define conceptually and empirically. In addition, analytical work that incorporates exchange rate stability considerations into standard monetary policy frameworks is still in its infancy. Nonetheless, having achieved and maintained price stability, many emerging market central banks seem likely to extend their policy frameworks to reflect the potential role that exchange rates can play as both a policy tool and a policy target.
BIS Papers No 57 55
Appendix
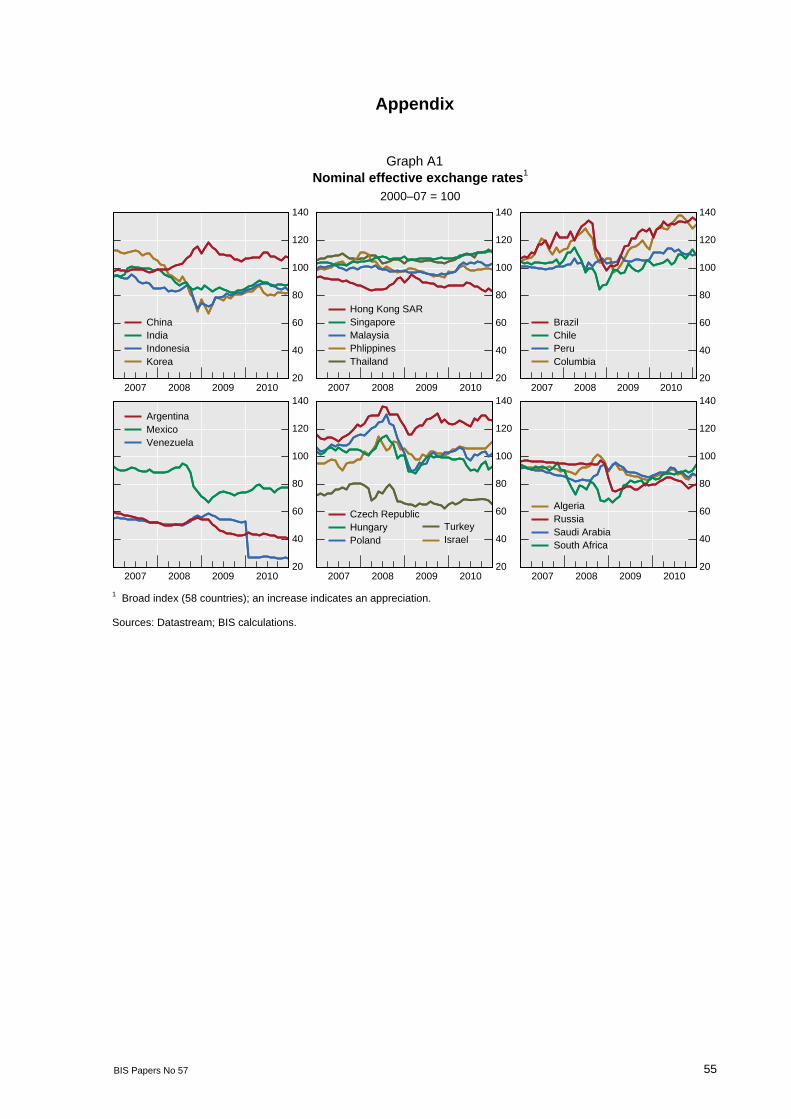
Graph A1 Nominal effective exchange rates1
2000–07 = 100
20
40
60
80
100
120
140
2007 2008 2009 2010
ChinaIndiaIndonesiaKorea
20
40
60
80
100
120
140
2007 2008 2009 2010
Hong Kong SARSingaporeMalaysiaPhlippinesThailand
20
40
60
80
100
120
140
2007 2008 2009 2010
BrazilChilePeruColumbia
20
40
60
80
100
120
140
2007 2008 2009 2010
ArgentinaMexicoVenezuela
20
40
60
80
100
120
140
2007 2008 2009 2010
Czech RepublicHungaryPoland
TurkeyIsrael
20
40
60
80
100
120
140
2007 2008 2009 2010
AlgeriaRussiaSaudi ArabiaSouth Africa
1 Broad index (58 countries); an increase indicates an appreciation.
Sources: Datastream; BIS calculations.
56 BIS Papers No 57
Graph A2
Policy rates and those implied by the Taylor rule In per cent
China India Indonesia Korea
2
3
4
5
6
7
8
02 04 06 08 10
Implied rate1
Nominal policy rate2
0
2
4
6
8
10
12
02 04 06 08 100
3
6
9
12
15
18
02 04 06 08 100
1
2
3
4
5
6
02 04 06 08 10
Malaysia Philippines Singapore Thailand
0
1
2
3
4
5
6
02 04 06 08 10
2
4
6
8
10
12
14
02 04 06 08 10–1
0
1
2
3
4
5
02 04 06 08 100
1
2
3
4
5
6
02 04 06 08 10
Brazil Chile Mexico† Peru
5
10
15
20
25
30
35
02 04 06 08 10
–2
0
2
4
6
8
10
02 04 06 08 103
6
9
12
15
18
21
02 04 06 08 100
3
6
9
12
15
18
02 04 06 08 10
BIS Papers No 57 57
Graph A2 (continued)
Policy rates and those implied by the Taylor rule In per cent
Czech Republic Hungary Poland Turkey†
0
1
2
3
4
5
6
02 04 06 08 10
Implied rate1
Nominal policyrate2
2
4
6
8
10
12
14
02 04 06 08 100
4
8
12
16
20
24
02 04 06 08 10
0
20
40
60
80
100
120
02 04 06 08 101 Fitted values of model ttttt
Tttt ffyyR 1
*1111 )()( , excluding the period Q1 2008–Q3 2009 and
previous crises. R is the nominal policy rate; π is the headline inflation rate; πT is the inflation target for inflation targeting countries; the five-year moving average of headline inflation is taken to be a proxy for the inflation objective in the other economies; y is output; y* is the output trend estimated with a Hodrick-Prescott filter (smoothing parameter 1,600); f is the year-on-year nominal effective exchange rate change. 2 For Brazil, overnight Selic rate; for Chile, overnight interbank interest rate; for China, one-year lending rate; for the Czech Republic, two-week repo rate; for Hungary, base rate (two-week deposit rate); for India, reverse repo rate; for Indonesia, one-month SBI rate; for Korea, overnight call rate; for Malaysia, overnight policy rate; for Mexico, overnight repo rate; for Peru, reference rate; for the Philippines, overnight reserve repo rate; for Poland, seven-day reference rate; for Singapore, three-month interbank rate; for Thailand, 14-day repo rate before 17 January 2007, overnight repo thereafter; for Turkey, overnight interbank rate. † For Mexico and Turkey, the dependent variable is replaced with an inflation trend-augmented nominal policy rate, )( ttt rR , where is the trend of inflation and
Rr .
Sources: Bloomberg; © Consensus Economics; Datastream; national data; BIS calculations.
58
BIS
Papers N
o 57
Table A1
Summary of empirical approaches to estimating equilibrium exchange rates
UIP PPP Balassa-Samuelson
Monetary models CHEERs ITMEERs BEERs FEERs DEERs APEERs PEERs NATREX SVAR DSGE
Name Uncovered interest parity
Purchasing power parity
Balassa-Samuelson
Monetary and portfolio balance models
Capital enhanced equilibrium exchange rates
Intermediate term model-based equilibrium exchange rates
Behavioural equilibrium exchange rates
Fundamental equilibrium exchange rates
Desired equilibrium exchange rates
Atheoretical permanent equilibrium exchange rates
Permanent equilibrium exchange rates
Natural real exchange rates
Structural vector auto regression
Dynamic stochastic general equilibrium models
Theoretical assumptions
The expected change in the exchange rate determined by interest differentials
Constant equilibrium exchange rate
PPP for tradable goods. Productivity differentials between traded and non-traded goods
PPP in long run (or short run) plus demand for money
PPP plus nominal UIP without risk premia
Nominal UIP including a risk premium plus expected future movements in real exchange rates determined by fundamentals
Real UIP with a risk premium and/or expected future movements in real exchange rates determined by fundamentals
Real exchange rate compatible with both internal and external balance. Flow not full stock equilibrium
As with FEERs, but the definition of external balance based on optimal policy
None As BEERs As with FEERs, but with the assumption of portfolio balance (so domestic real interest rate is equal to the world rate)
Real exchange rate affected by supply and demand (but not nominal) shocks in the long run
Models designed to explore movements in real and/or nominal exchange rates in response to shocks
Relevant time horizon
Short run Long run Long run Short run Short run (forecast)
Short run (forecast)
Short run (also forecast)
Medium run Medium run Medium/ long run
Medium/ long run
Long run Short (and long) run
Short and long run
Statistical assumptions
Stationarity (of change)
Stationary Non-stationary
Non-stationary
Stationary, with emphasis on speed of convergence
None Non-stationary
Non-stationary
Non-stationary
Non-stationary (extract permanent component)
Non-stationary (extract permanent component)
Non-stationary
As with theoretical
As with theoretical
Dependent variable
Expected change in the real or nominal
Real or nominal
Real Nominal Nominal Future change in the nominal
Real Real effective
Real effective
Real Real Real Change in the real
Change relative to long-run steady state
Estimation method
Direct Test for stationarity
Direct Direct Direct Direct Direct Underlying balance
Underlying balance
Direct Direct Direct Direct Simulation
Source: Driver and Westaway (2004).
BIS Papers No 57 59
Table A2
Taylor rule estimates1 π (–1) y (–1) f f (–1) DW R2 Sample
China 0.1* 0.4*** 0.8 0.59 36
0.1*** 0.4*** 0.02 0.05** 1.0 0.77 36
Hong Kong SAR 0.5*** 0.5*** 0.6 0.67 36
0.5*** 0.4*** –0.03 0.14* 0.5 0.73 36
India –0.0 0.3** 0.5 0.22 36
0.0 0.4** –0.06* 0.04 0.8 0.39 36
Indonesia 0.6*** 0.9 0.6 0.51 36
0.5*** 1.3* 0.08* –0.02 0.8 0.55 36
Korea 0.0 0.5*** 0.7 0.62 36
–0.0 0.5*** –0.03 0.00 0.6 0.67 36
Malaysia 0.1*** 0.1*** 0.9 0.73 36
0.1*** 0.2*** –0.03* 0.05*** 0.8 0.83 36
Philippines 0.2* 0.2 0.2 0.18 35
0.2** 0.4* –0.09 0.03 0.5 0.28 35
Singapore 0.0 0.2*** 0.4 0.31 36
0.1 0.1 –0.04 0.24** 0.4 0.43 36
Thailand 0.4*** –0.0 0.4 0.49 36
0.5*** –0.2 –0.03 0.18** 0.6 0.68 36
Brazil 1.1*** 1.8*** 0.7 0.60 36
0.9*** 1.6*** –0.07 –0.02 0.8 0.71 36
Chile 0.5*** 0.6*** 1.5 0.86 36
0.4*** 0.6*** –0.01 –0.01 1.4 0.87 36
Mexico† 0.5 0.5*** 0.6 0.30 36
0.7 0.5*** –0.03 0.05 0.6 0.32 36
Peru –0.0 0.7*** 0.6 0.69 32
0.0 0.7*** –0.07 –0.06 0.6 0.76 32
Czech Republic 0.2* 0.2*** 0.2 0.41 36
0.1 0.2*** 0.07** 0.02 0.4 0.65 36
Hungary 0.2 0.2 0.3 0.08 36
0.1 0.2 0.07 –0.04 0.4 0.13 36
Poland 0.1 –0.4* 0.5 0.40 36
0.1 –0.4* –0.03 0.01 0.7 0.43 36
Turkey† 0.3*** 0.6*** 0.5 0.38 35
0.1 0.9*** –0.17*** –0.10* 0.6 0.64 35
1 Estimates of the model tttttTttt ffyyR 1
*1111 )()( , excluding the period Q1 2008–Q3 2009
and previous crises. R is the nominal policy rate; π is the headline inflation rate; πT is the inflation target for inflation targeting countries; the five-year moving average of headline inflation is taken to be a proxy for the inflation objective in the other economies; y is output; y* is the output trend estimated with a Hodrick-Prescott filter (smoothing parameter 1,600); f is the year-on-year nominal effective exchange rate change. For Brazil, overnight Selic rate; for Chile, overnight interbank interest rate; for China, one-year lending rate; for the Czech Republic, two-week repo rate; for Hong Kong SAR, discount window base rate; for Hungary, base rate (two-week deposit rate); for India, reverse repo rate; for Indonesia, one-month SBI rate; for Korea, overnight call rate; for Malaysia, overnight policy rate; for Mexico, overnight repo rate; for Peru, reference rate; for the Philippines, overnight reserve repo rate; for Poland, seven-day reference rate; for Singapore, three-month interbank rate; for Thailand, 14-day repo rate before 17 January 2007, overnight repo thereafter; for Turkey, overnight interbank rate. † For Mexico and Turkey, the dependent variable is replaced with an inflation trend-augmented nominal policy rate, )( ttt rR , where is the trend of inflation and Rr .
*/**/*** denote coefficients significantly different from zero at the 10/5/1% level.
Sources: Bloomberg; © Consensus Economics; Datastream; national data; BIS calculations.
60 BIS Papers No 57
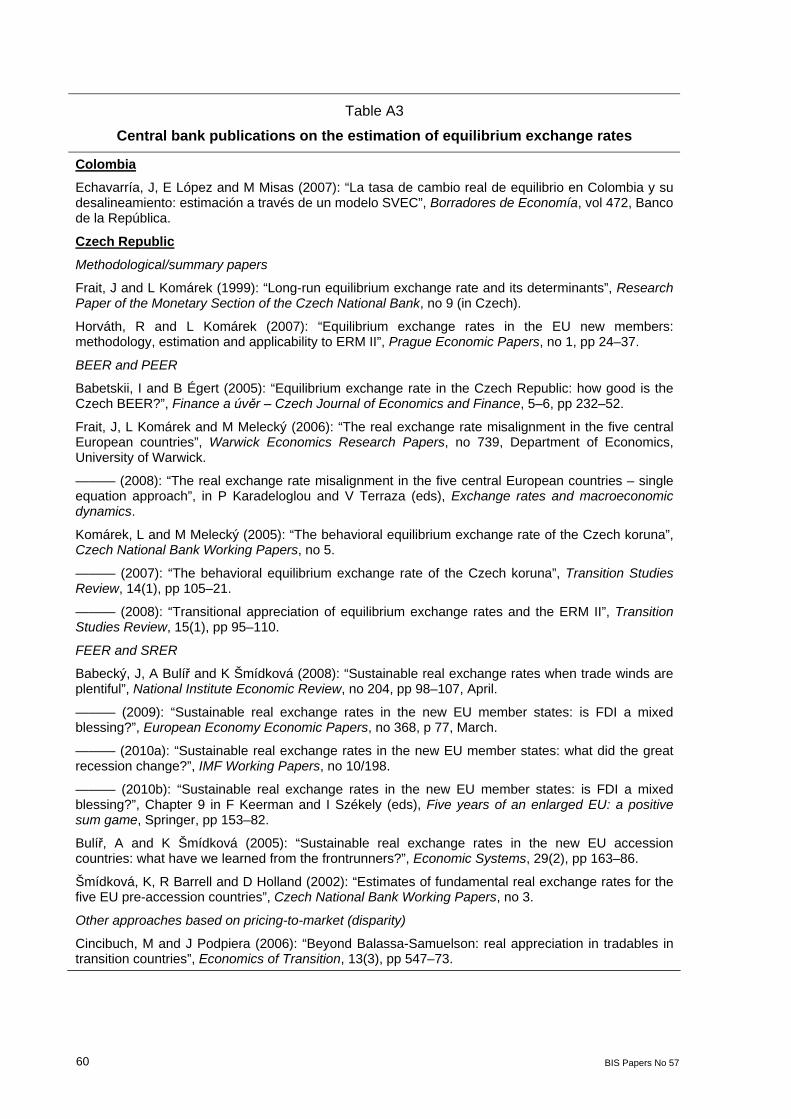
Table A3
Central bank publications on the estimation of equilibrium exchange rates
Colombia
Echavarría, J, E López and M Misas (2007): “La tasa de cambio real de equilibrio en Colombia y su desalineamiento: estimación a través de un modelo SVEC”, Borradores de Economía, vol 472, Banco de la República.
Czech Republic
Methodological/summary papers
Frait, J and L Komárek (1999): “Long-run equilibrium exchange rate and its determinants”, Research Paper of the Monetary Section of the Czech National Bank, no 9 (in Czech).
Horváth, R and L Komárek (2007): “Equilibrium exchange rates in the EU new members: methodology, estimation and applicability to ERM II”, Prague Economic Papers, no 1, pp 24–37.
BEER and PEER
Babetskii, I and B Égert (2005): “Equilibrium exchange rate in the Czech Republic: how good is the Czech BEER?”, Finance a úvěr – Czech Journal of Economics and Finance, 5–6, pp 232–52.
Frait, J, L Komárek and M Melecký (2006): “The real exchange rate misalignment in the five central European countries”, Warwick Economics Research Papers, no 739, Department of Economics, University of Warwick.
——— (2008): “The real exchange rate misalignment in the five central European countries – single equation approach”, in P Karadeloglou and V Terraza (eds), Exchange rates and macroeconomic dynamics.
Komárek, L and M Melecký (2005): “The behavioral equilibrium exchange rate of the Czech koruna”, Czech National Bank Working Papers, no 5.
——— (2007): “The behavioral equilibrium exchange rate of the Czech koruna”, Transition Studies Review, 14(1), pp 105–21.
——— (2008): “Transitional appreciation of equilibrium exchange rates and the ERM II”, Transition Studies Review, 15(1), pp 95–110.
FEER and SRER
Babecký, J, A Bulíř and K Šmídková (2008): “Sustainable real exchange rates when trade winds are plentiful”, National Institute Economic Review, no 204, pp 98–107, April.
——— (2009): “Sustainable real exchange rates in the new EU member states: is FDI a mixed blessing?”, European Economy Economic Papers, no 368, p 77, March.
——— (2010a): “Sustainable real exchange rates in the new EU member states: what did the great recession change?”, IMF Working Papers, no 10/198.
——— (2010b): “Sustainable real exchange rates in the new EU member states: is FDI a mixed blessing?”, Chapter 9 in F Keerman and I Székely (eds), Five years of an enlarged EU: a positive sum game, Springer, pp 153–82.
Bulíř, A and K Šmídková (2005): “Sustainable real exchange rates in the new EU accession countries: what have we learned from the frontrunners?”, Economic Systems, 29(2), pp 163–86.
Šmídková, K, R Barrell and D Holland (2002): “Estimates of fundamental real exchange rates for the five EU pre-accession countries”, Czech National Bank Working Papers, no 3.
Other approaches based on pricing-to-market (disparity)
Cincibuch, M and J Podpiera (2006): “Beyond Balassa-Samuelson: real appreciation in tradables in transition countries”, Economics of Transition, 13(3), pp 547–73.
BIS Papers No 57 61
Table A3 (continued)
Central bank publications on the estimation of equilibrium exchange rates
Czech Republic (continued)
Based on underlying factor decomposition in an extended international consumption-based CAPM (Kalman filter)
Brůha, J and A Derviz (2006): “Macroeconomic factors and the balanced value of the Czech koruna/euro exchange rate”, Finance a úvěr – Czech Journal of Economics and Finance, 56, 7–8, pp 318–43.
Derviz, A (2004): “Exchange rate risks and asset prices in a small open economy”, ECB Working Papers, no 314, March.
Hong Kong SAR
Leung, F and P Ng (2007): “Is the Hong Kong dollar real exchange rate misaligned?”, Hong Kong Monetary Authority Working Papers, no 21/2007, http://www.info.gov.hk/hkma/eng/research/working/pdf/HKMAWP07_21_full.pdf.
Hungary
Magyar Nemzeti Bank (2010): Analysis of the convergence process, Box 1–1 on p 6, http://english.mnb.hu/Kiadvanyok/mnben_konvergenciajelentes/mnben_konvjel_20100519.
Israel
Bank of Israel (2008): “The real appreciation in 2008 and the equilibrium real exchange rate”, Annual Report, Box 2.2 on pp 68–71.
Peru
BEER model Ferreyra, J and J Salas (2006): “The equilibrium real exchange rate in Peru: BEER models and confidence band building”, Banco Central de Reserva del Perú Working Papers, no 2006–06, http://www.bcrp.gob.pe/docs/Publicaciones/Documentos-de-Trabajo/2006/Documento-Trabajo-06-2006.pdf.
FEER model Rodríguez, D and M Vega (2008): “Incertidumbre en estimaciones del tipo de cambio real de equilibrio”, XXVI Encuentro de Economistas del Banco Central de Reserva del Perú, http://www.bcrp.gob.pe/docs/Proyeccion-Institucional/Encuentro-de-Economistas/XXVI-EE-2008/XXVI-EE-2008-S05-Rodriguez-Vega.pdf.
Philippines
Halikias, I (2009): “Workers’ remittances and external equilibrium: an application to the Philippines”, Bangko Sentral ng Pilipinas International Research Conference on Remittances, paper no 5.
Poland
International Comparison Programme: http://www.oecd.org/dataoecd/48/18/18598721.pdf.
Survey of firm-level data: http://www.nbp.pl/home.aspx?c=/ascx/koniunktura_prezentacja.ascx.
IMF’s CGER estimates: http://www.imf.org/external/pubs/ft/scr/2010/cr10118.pdf.
Bęza-Bojanowska, J (2009): “Behavioral and permanent euro/zloty equilibrium rate”, Central European Journal of Economic Modelling and Econometrics, no 1, pp 35–55.
Isard, P (2007): “Equilibrium exchange rates: assessment methodologies”, IMF Working Papers, no 296.
Kelm, R (2010): “Model behawioralnego kursu równowagi złoty/euro w okresie 1996:1–2009:2. Specyfikacja i szacunki”, Bank i Kredyt, 41(2), pp 21–42.
62 BIS Papers No 57
Table A3 (continued)
Central bank publications on the estimation of equilibrium exchange rates
Poland (continued)
Rubaszek, M (2009): “Economic convergence and the fundamental equilibrium exchange rate in Poland”, Bank i Kredyt, no 40(1), pp 7–23.
Rubaszek, M and Ł Rawdanowicz (2009): “Economic convergence and the fundamental equilibrium exchange rate in central and eastern Europe”, International Review of Financial Analysis, 18(5), pp 277–84.
Singapore
MacDonald, R (2004): “The long-run real effective exchange rate of Singapore: a behavioural approach”, Monetary Authority of Singapore Staff Papers, no 36, December, http://www.mas.gov.sg/publications/staff_papers/MAS_Staff_Paper_No_36_Dec_2004.html.
Thailand
International Monetary Fund (2006): “Methodology for CGER exchange rate assessments”.
Source: Central bank responses to the BIS questionnaire.
BIS Papers No 57 63
References Ball, L (1999): “Policy rules for open economies”, in J Taylor (ed), Monetary Policy Rules, University of Chicago Press.
Callen, T (2007): “PPP versus the market: which weight matters?”, Finance and Development, vol 44, March.
Calvo, G and C Reinhart (2002): “Fear of floating”, Quarterly Journal of Economics, no 117.
Committee on the Global Financial System (2009): “Capital flows and emerging market economies”, CGFS Papers, no 33, available at www.bis.org/publ/cgfs33.htm.
Disyatat, P (2005): “Inflation targeting, asset prices and financial imbalances: conceptualizing the debate”, BIS Working Papers, no 168, January.
Driver, R and P Westaway (2004): “Concepts of equilibrium exchange rates”, Bank of England Working Papers, no 248.
Égert, B (2003): “Assessing equilibrium exchange rates in CEE acceding countries: can we have DEER with BEER without FEER? A critical survey of the literature”, Focus on Transition, no 2.
Égert, B, L Halpern and R MacDonald (2006): “Equilibrium exchange rates in transition economies: taking stock of the issues”, Journal of Economic Surveys, vol 20, no 2.
Engel, C (2010a): “Exchange rate policies”, in The international financial crisis and policy challenges in Asia and the Pacific, BIS Papers, no 52, July.
——— (2010b): “Currency misalignments and optimal monetary policy: a re-examination”, University of Wisconsin, unpublished working paper, August.
Filardo, A and H Genberg (2010): “Targeting inflation in Asia and the Pacific: lessons from the recent past”, in Twenty years of inflation targeting: lessons learned and future prospects, Cambridge University Press.
International Monetary Fund (2003): World Economic Outlook, October.
Ma, G and R McCauley (2010): “The evolving renminbi regime and implications for Asian currency stability”, BIS Working Papers, no 321, September.
Mihaljek, D (2005): “Survey of central banks’ views on effects of intervention”, BIS Papers, no 24, May.
Mohanty, M and P Turner (2006): “Foreign exchange reserve accumulation in emerging markets: what are the domestic implications?”, BIS Quarterly Review, September.
National Bank of Poland (2010): Monetary Policy Guidelines for 2011.
Obstfeld, M and K Rogoff (2000): “The six major puzzles in international macroeconomics: is there a common cause?”, Macroeconomics Annual, NBER.
Reinhart, C and K Rogoff (2004): “The modern history of exchange rate arrangements: a reinterpretation”, Quarterly Journal of Economics, issue 1, February.
Rogoff, K and V Stravrakeva (2008): “The continuing puzzle of short horizon exchange rate forecasting”, Harvard University, unpublished manuscript, July.
Svensson, L (2003): “Monetary policy and real stabilization”, in Rethinking stabilization policy, a symposium sponsored by the Federal Reserve Bank of Kansas City, Jackson Hole, Wyoming, 29–31 August.
Svensson, L and M Woodford (2000): “Indicator variables for optimal monetary policy”, ECB Working Papers, no 12, February.
Taylor, J and J Williams (2010): “Simple and robust rules for monetary policy”, Federal Reserve of San Francisco Working Paper Series, no 2010–10, April.