Embed Size (px)
Citation preview
Exchange rate volatility spillovers and the
South African currency
L Raputsoane1
Sep 2008
Abstract
This paper examines the volatility spillovers between the South African currency and the currencies of selected markets in developed and emerging Europe as well as Asia and Latin America. Additionally, the exchange rate volatility spillovers are examined over one year window samples to determine the evolution of volatility spillovers between these currencies overtime. The empirical results show statistically significant negative exchange rate volatility spillover effects between the South African currency and the currencies in developed and emerging European markets, while no spillover effects can be established for the currencies in the Asian and Latin American markets. Moreover, the one year window samples results confirm the hypothesis of changing exchange rate volatility spillovers across currency markets overtime. JEL classification: F31, F41 Keywords: Foreign exchange rate, Volatility spillovers Corresponding author’s e-mail address: [email protected]
1 The views expressed are those of the author(s) and do not necessarily represent those of the South African Reserve Bank or Reserve Bank policy.
ii
Table of Contents 1 Introduction ..............................................................................................................1 2 Literature review.......................................................................................................2 3 Data description and methodology ........................................................................3
3.1 Data ..............................................................................................................3 3.2 Model............................................................................................................4
4 Empirical results ......................................................................................................7 5 Conclusion..............................................................................................................11 References ............................................................................................................................12 Appendix ...............................................................................................................................14 List of Figures Figure A1 Exchange rates indexes and log differences ...................................................15 List of Tables Table 2 The Exponential GARCH(1,1) volatility results ..................................................8 Table 3 The Exponential GARCH (1,1) volatility spillovers results ................................10 Table A1 Currencies’ description .....................................................................................14 Table A2 Descriptive statistics .........................................................................................14
1
1 Introduction
The international foreign exchange activity has accelerated in recent decades as a
result of the rapid globalisation of financial markets. Consistent with globalisation, the
rapid liberalisation of the goods and financial markets, together with the adoption of
freely floating exchange rate regimes have made cross border capital flows swift and
effortless. These developments have heralded an era of increased exchange rate
volatility in global currency markets given the role exchange rates play in
international transactions (Doong and Yang, 2004). They also imply increased
likelihood of foreign exchange rate volatility spillovers and contagion across currency
markets.
Exchange rate volatility spillovers or volatility co-movements between currencies
imply that the currency markets in different economies have achieved some level of
integration. It further suggests similarity in the underlying economic, institutional
structures and that the shocks faced by these economies and the transmission of
these shocks through the currency markets are analogous. It also insinuates market
psychology amongst markets participants, which is the segmentation of currency
markets in terms of their riskiness. As a result, common volatility across currency
markets implies greater bandwagon and contagion effects across these markets
(Pramor and Tamirasa, 2006).
This paper examines the exchange rate volatility spillovers between the South
African currency and the currencies of selected developed and emerging economies.
Of particular interest is the extent to which volatility in the selected currency markets
are comparable to that of the South African currency. Further, the exchange rate
volatility spillovers are examined over one year window samples to determine the
evolution of these volatility spillovers between the South African currency and the
currencies in the selected markets overtime. This study will enhance the
understanding of foreign exchange activity in the South African currency market
relative to the selected currency markets.
This paper is organised as follows: Section 2 is the literature review. Section 3 is
methodology and data, which discusses the model together with the volatility
spillover indexes. Section 4 is the empirical analysis and section 5 is the conclusion.
2
2 Literature review
Since the work of Engle, Ito and Lin (1990), there is limited empirical work on foreign
exchange rate volatility spillovers. Using dollar exchange rates for French franc,
Italian lira, German mark and British pound for the period 1974 to 1998, Black and
McMillan (2000) found evidence of significant volatility spillovers across European
currencies. McMillan (2001) went further to study the common trend and volatility in
the Deutschemark and French franc per dollar exchange rates using a multivariate
random walk stochastic volatility model. The study found high correlation between
the volatility innovations and suggests that they follow a common trend so that, in
essence, the volatilities are cointegrated.
Horvath (2005) analysed the exchange rate volatility for 20 Central and Eastern
European Countries (CEECs) over the period 1989-1998. The study found that the
CEECs encounter increased exchange rate volatility of approximately the same level
as the euro area countries before they adopted the Euro so that the countries fulfilling
the optimum currency area experience less exchange rate spillovers. Klassen (1999)
studied the time-dependence of exchange rate correlations using a multivariate
GARCH model for weekly data covering the period April 1974 to July 1997. Analysing
the correlations between eight developed countries U.S. dollar exchange rates (the
Canadian dollar, Japanese Yen, British pound, Belgian franc, French franc, German
mark, Italian lira and the Dutch guilder) in post- Bretton-Woods era, the study found
that the major U.S. dollar exchange rates have become more loosely instead of
closely tied since the eighties.
Melvin and Melvin (2003) studied the volatility spillovers of the Deutschemark and
Japanese yen per dollar exchange rates across regional markets in Asia, Europe and
America. They found the evidence of statistically significant effects for both own-
region and interregional spillovers, but that the magnitude of own-region spillovers
are more important than interregional spillovers. Pramor and Tamirasa (2006)
compared the long-run volatility trends in Central and East European as well as Euro
zone currencies over the period 1993 to 2005 using Component GARCH (CGARCH)
model. They find that the volatility trends are closely correlated and that the spillovers
of volatility across regional markets have moderated over time, with the exception of
the Hungarian forint.
3
In a benchmark study, Engle, Ito and Lin (1990) tested two competing hypotheses on
volatility clustering. These are the heat wave effects, which refer to volatility
clustering at a regional level and the meteor shower effects, which refer to volatility
clustering at a global level. Using the General autoregressive Conditional
Heteroscedacity (GARCH) model to analyse intra-daily market segments for the US
dollar per Japanese yen exchange rate for the period October 1985 to September
1986, their results generally support the hypothesis of the meteor shower suggesting
cross-regional volatility clustering.
In general, empirical studies support the exchange rate spillover paradigm,
particularly for currency markets in developed economies. In most cases, high
frequency data particularly intra-day, daily and weekly closing spot exchange rates is
used. The GARCH models are commonly used for analytical purposes, particularly
the Exponential GARCH (EGARCH) model. The CGARCH and multivariate GARCH
models are also popular to account for transitory and permanent effects as well as
cross-currency spillovers, respectively. Moreover, there are instances where the
long-run common volatility is tested, particularly in empirical works that estimate
cointegration in foreign exchange rate volatility trends such as in Black and McMillan
(2000) as well as Febrianm and Herwany (2007).
3 Data description and methodology
3.1 Data
The data set consists of daily closing spot exchange rates for 14 currency markets of
South Africa, Euro Area, Japan, United Kingdom, Canada, Poland, Russia, Turkey,
China, India, Korea, Argentina, Brazil and Mexico. Their selection is based on the
countries’ importance in terms of GDP size among the industrialised and emerging
economies. All foreign exchange rate data series are expressed as domestic
currency per US dollar. The sample covers period January 01, 1999 to April 25,
2008. This yields 2431 observations. The sample starting point coincides with the
introduction of the Euro in January 1999. The exchange rate data series are sourced
from the Bloomberg database.
The exchange rates data series is transformed into log differences, also referred to
as continuously compounded returns in financial economics. The log differenced data
series are computed as follows
⎟⎟⎠
⎞⎜⎜⎝
⎛=−=
−−
11 logloglog
t
tttt x
xxxy [1]
where, are the nominal exchange rate data series. The exchange rates like other
financial time series such as stock indices and share prices behave in a similar
manner after this transformation. As a result, they are said to exhibit ergodicity. They
also have the advantage that they can be modelled as a stationary stochastic
process. These reasons make it possible to compare the different exchange rates.
tx
Doong and Yang (2004) argue that high frequency data, denominated in daily and
intraday frequencies, contains too much noise. Nevertheless, it captures information
content of changes in exchange rates, while low frequency data, denominated in
monthly or quarterly frequencies, does not. As a result, daily denominated data is
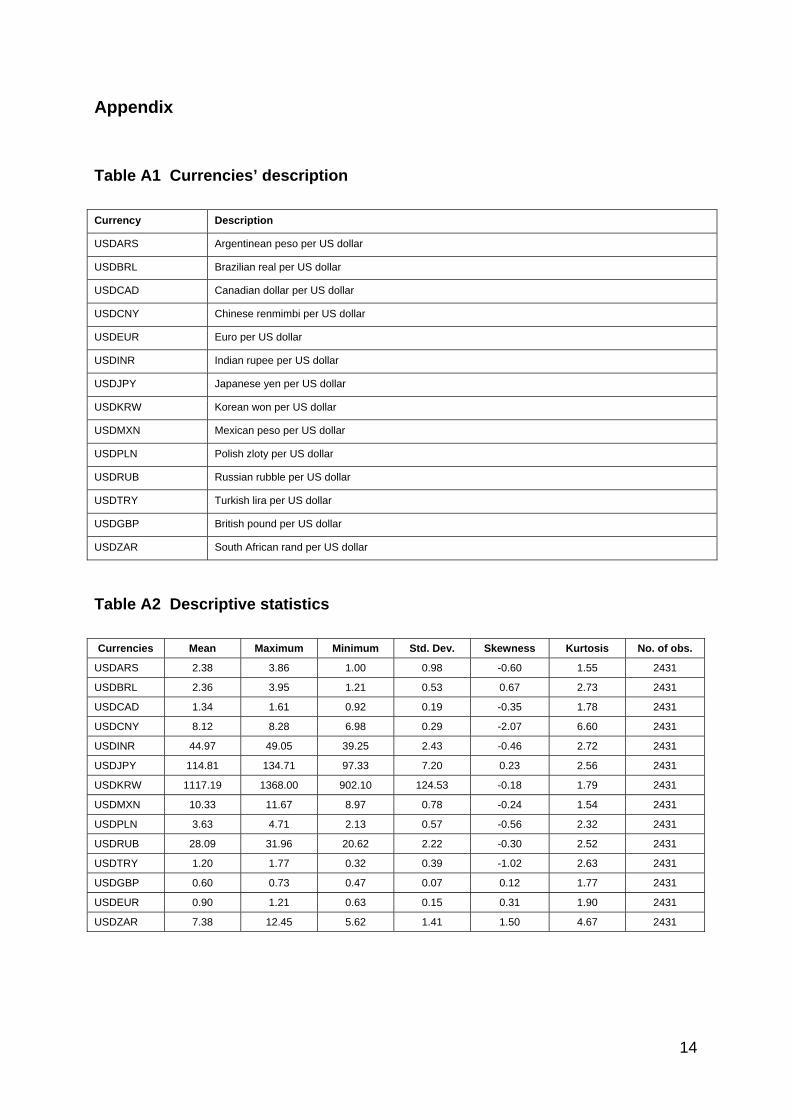
appropriate for the purpose of this study. The descriptive statistics of the U.S. dollar
denominated currencies are presented in table 1 and Table A1 in the appendix
details the currencies descriptions. Based on the standard deviation, the Korean won
and the Japanese yen are the most volatile, while the British pound and Euro are the
least volatile given the level of the currencies. Considering the mean of the
currencies, the Argentinean peso and the Turkish lira are the most volatile, while the
Chinese renmimbi and the Indian rupee are the least volatile. Figure A1 in the
appendix show the exchange rates indexes and log differences.
3.2 Model
The Exponential GARCH (EGARCH) model is used to estimate the volatility
spillovers between the South African currency and the selected currency markets.
This model is popularly used to estimate the conditional variance or volatility of high
frequency financial assets, stock market indexes and exchange rate data. The
EGARCH model was proposed Nelson (1991) as an extension of the Bollerslev’s
4
(1986) GARCH model. The GARCH model is the generalisation of Engle’s (1982)
autoregressive Conditional Heteroscedacity (ARCH) model. These models posses
useful properties for estimating volatility dynamics in a unified framework and are
consistent with the stylised facts in foreign exchange rate dynamics such as volatility
persistence and clustering (Guimaraes and Karacadag, 2004).
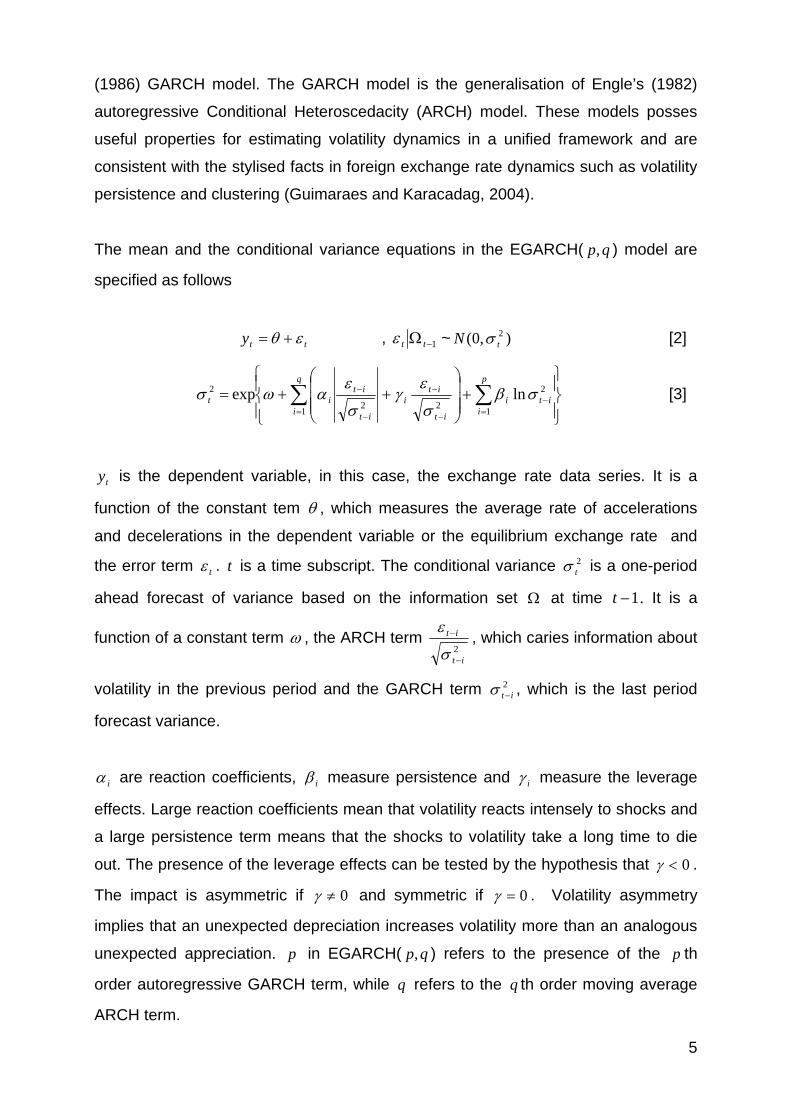
The mean and the conditional variance equations in the EGARCH( ) model are
specified as follows
qp,
tty εθ += , 1−Ω ttε ~ [2] ),0( 2tN σ
⎪⎭
⎪⎬⎫
⎪⎩
⎪⎨⎧
+⎟⎟⎟
⎠
⎞
⎜⎜⎜
⎝
⎛++= ∑ ∑
= =−
−
−
−
−q
i
p
iiti
it
iti
it
itit
1 1
2
22
2 lnexp σβσ
εγ
σ
εαωσ [3]
ty is the dependent variable, in this case, the exchange rate data series. It is a
function of the constant tem θ , which measures the average rate of accelerations
and decelerations in the dependent variable or the equilibrium exchange rate and
the error term tε . is a time subscript. The conditional variance is a one-period
ahead forecast of variance based on the information set
t 2tσ
Ω at time . It is a
function of a constant term
1−t
ω , the ARCH term 2
it
it
−
−
σ
ε, which caries information about
volatility in the previous period and the GARCH term , which is the last period
forecast variance.
2it−σ
iα are reaction coefficients, iβ measure persistence and iγ measure the leverage
effects. Large reaction coefficients mean that volatility reacts intensely to shocks and
a large persistence term means that the shocks to volatility take a long time to die
out. The presence of the leverage effects can be tested by the hypothesis that 0<γ .
The impact is asymmetric if 0≠γ and symmetric if 0=γ . Volatility asymmetry
implies that an unexpected depreciation increases volatility more than an analogous
unexpected appreciation. in EGARCH( ) refers to the presence of the th
order autoregressive GARCH term, while q refers to the th order moving average
ARCH term.
p qp, p
q
5
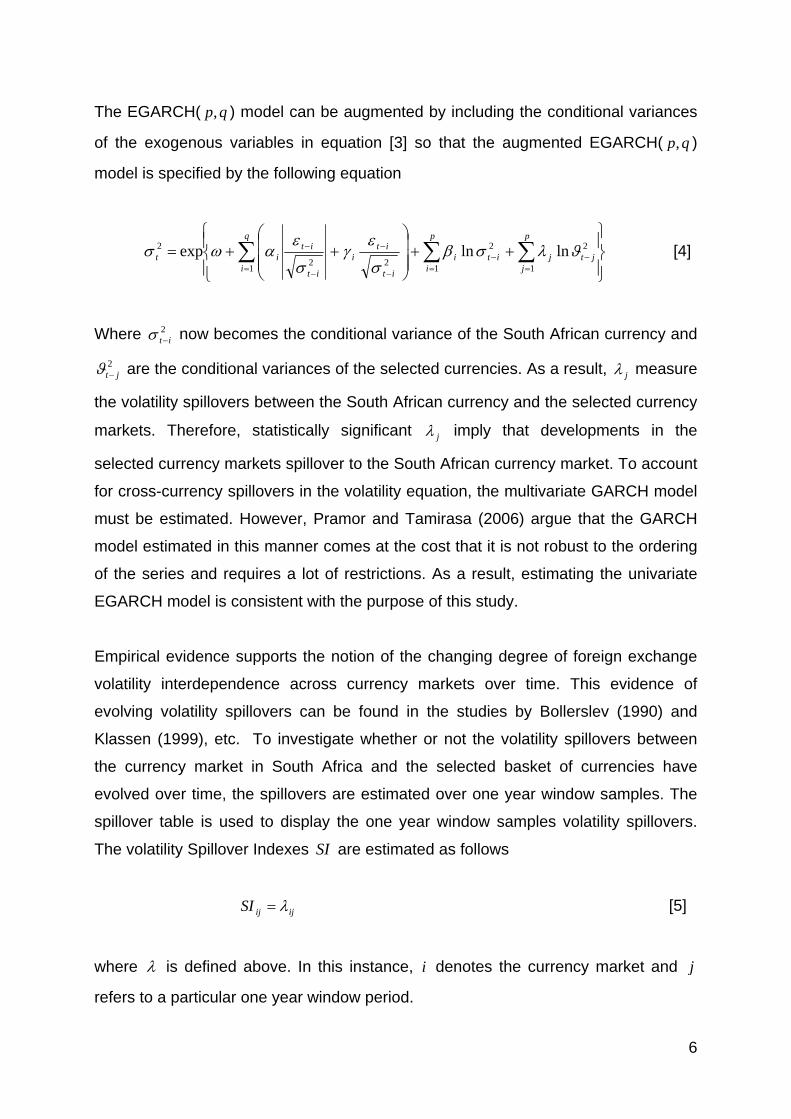
The EGARCH( ) model can be augmented by including the conditional variances
of the exogenous variables in equation [3] so that the augmented EGARCH(
qp,
qp, )
model is specified by the following equation
⎪⎭
⎪⎬⎫
⎪⎩
⎪⎨⎧
++⎟⎟⎟
⎠
⎞
⎜⎜⎜
⎝
⎛++= ∑ ∑∑
= =−
=−
−
−
−
−q
i
p
jjtj
p
iiti
it
iti
it
itit
1 1
2
1
2
22
2 lnlnexp ϑλσβσ
εγ
σ
εαωσ [4]
Where now becomes the conditional variance of the South African currency and
are the conditional variances of the selected currencies. As a result,
2it−σ
2jt−ϑ jλ measure
the volatility spillovers between the South African currency and the selected currency
markets. Therefore, statistically significant jλ imply that developments in the
selected currency markets spillover to the South African currency market. To account
for cross-currency spillovers in the volatility equation, the multivariate GARCH model
must be estimated. However, Pramor and Tamirasa (2006) argue that the GARCH
model estimated in this manner comes at the cost that it is not robust to the ordering
of the series and requires a lot of restrictions. As a result, estimating the univariate
EGARCH model is consistent with the purpose of this study.
Empirical evidence supports the notion of the changing degree of foreign exchange
volatility interdependence across currency markets over time. This evidence of
evolving volatility spillovers can be found in the studies by Bollerslev (1990) and
Klassen (1999), etc. To investigate whether or not the volatility spillovers between
the currency market in South Africa and the selected basket of currencies have
evolved over time, the spillovers are estimated over one year window samples. The
spillover table is used to display the one year window samples volatility spillovers.
The volatility Spillover Indexes are estimated as follows SI
ijijSI λ= [5]
where λ is defined above. In this instance, denotes the currency market and i j
refers to a particular one year window period.
6
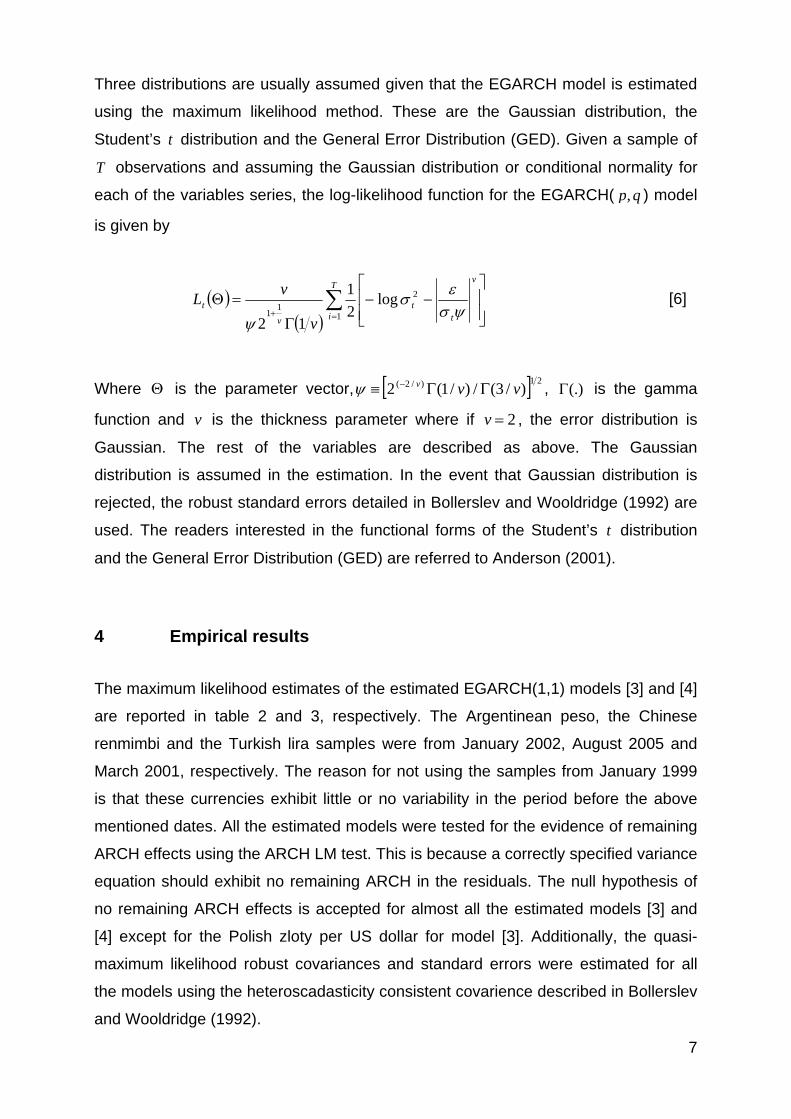
Three distributions are usually assumed given that the EGARCH model is estimated
using the maximum likelihood method. These are the Gaussian distribution, the
Student’s distribution and the General Error Distribution (GED). Given a sample of t
T observations and assuming the Gaussian distribution or conditional normality for
each of the variables series, the log-likelihood function for the EGARCH( qp, ) model
is given by
( )( )
∑=+ ⎥
⎥⎦
⎤
⎢⎢⎣
⎡−−
Γ
=ΘT
i
v
tt
v
t
v
vL1
211
log21
12ψσεσ
ψ [6]
Where is the parameter vector,Θ [ ] 21)/2( )/3(/)/1(2 vvv ΓΓ≡ −ψ , (.)Γ is the gamma
function and is the thickness parameter where if v 2=v , the error distribution is
Gaussian. The rest of the variables are described as above. The Gaussian
distribution is assumed in the estimation. In the event that Gaussian distribution is
rejected, the robust standard errors detailed in Bollerslev and Wooldridge (1992) are
used. The readers interested in the functional forms of the Student’s t distribution
and the General Error Distribution (GED) are referred to Anderson (2001).
4 Empirical results
The maximum likelihood estimates of the estimated EGARCH(1,1) models [3] and [4]
are reported in table 2 and 3, respectively. The Argentinean peso, the Chinese
renmimbi and the Turkish lira samples were from January 2002, August 2005 and
March 2001, respectively. The reason for not using the samples from January 1999
is that these currencies exhibit little or no variability in the period before the above
mentioned dates. All the estimated models were tested for the evidence of remaining
ARCH effects using the ARCH LM test. This is because a correctly specified variance
equation should exhibit no remaining ARCH in the residuals. The null hypothesis of
no remaining ARCH effects is accepted for almost all the estimated models [3] and
[4] except for the Polish zloty per US dollar for model [3]. Additionally, the quasi-
maximum likelihood robust covariances and standard errors were estimated for all
the models using the heteroscadasticity consistent covarience described in Bollerslev
and Wooldridge (1992).
7
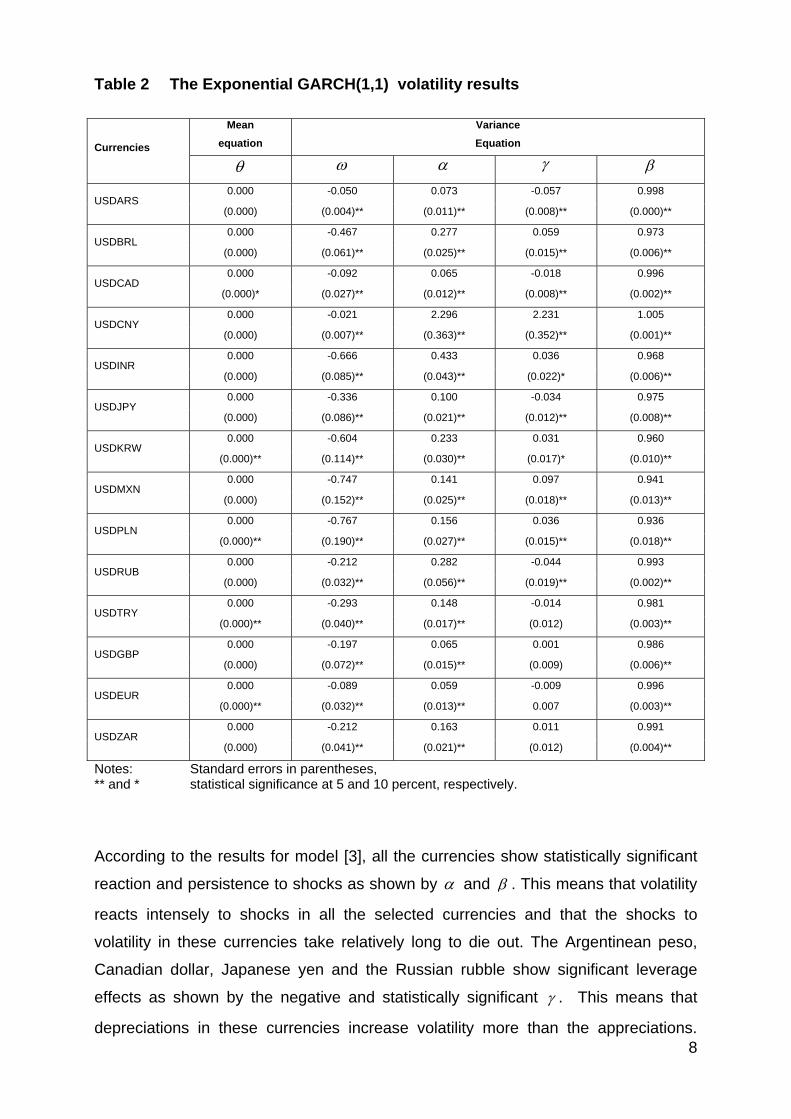
Table 2 The Exponential GARCH(1,1) volatility results
Mean equation
Variance Equation Currencies
θ ω α γ β
0.000 -0.050 0.073 -0.057 0.998 USDARS
(0.000) (0.004)** (0.011)** (0.008)** (0.000)**
0.000 -0.467 0.277 0.059 0.973 USDBRL
(0.000) (0.061)** (0.025)** (0.015)** (0.006)**
0.000 -0.092 0.065 -0.018 0.996 USDCAD
(0.000)* (0.027)** (0.012)** (0.008)** (0.002)**
0.000 -0.021 2.296 2.231 1.005 USDCNY
(0.000) (0.007)** (0.363)** (0.352)** (0.001)**
0.000 -0.666 0.433 0.036 0.968 USDINR
(0.000) (0.085)** (0.043)** (0.022)* (0.006)**
0.000 -0.336 0.100 -0.034 0.975 USDJPY
(0.000) (0.086)** (0.021)** (0.012)** (0.008)**
0.000 -0.604 0.233 0.031 0.960 USDKRW
(0.000)** (0.114)** (0.030)** (0.017)* (0.010)**
0.000 -0.747 0.141 0.097 0.941 USDMXN
(0.000) (0.152)** (0.025)** (0.018)** (0.013)**
0.000 -0.767 0.156 0.036 0.936 USDPLN
(0.000)** (0.190)** (0.027)** (0.015)** (0.018)**
0.000 -0.212 0.282 -0.044 0.993 USDRUB
(0.000) (0.032)** (0.056)** (0.019)** (0.002)**
0.000 -0.293 0.148 -0.014 0.981 USDTRY
(0.000)** (0.040)** (0.017)** (0.012) (0.003)**
0.000 -0.197 0.065 0.001 0.986 USDGBP
(0.000) (0.072)** (0.015)** (0.009) (0.006)**
0.000 -0.089 0.059 -0.009 0.996 USDEUR
(0.000)** (0.032)** (0.013)** 0.007 (0.003)**
0.000 -0.212 0.163 0.011 0.991 USDZAR
(0.000) (0.041)** (0.021)** (0.012) (0.004)**
Notes: Standard errors in parentheses, ** and * statistical significance at 5 and 10 percent, respectively.
8
According to the results for model [3], all the currencies show statistically significant
reaction and persistence to shocks as shown by α and β . This means that volatility
reacts intensely to shocks in all the selected currencies and that the shocks to
volatility in these currencies take relatively long to die out. The Argentinean peso,
Canadian dollar, Japanese yen and the Russian rubble show significant leverage
effects as shown by the negative and statistically significant γ . This means that
depreciations in these currencies increase volatility more than the appreciations.
Additionally, most of the currencies do not display any statistically significant
equilibrium rates except for the Korean won, Polish zloty, the Turkish lira and the
Euro as shown by the statistically insignificant θ .
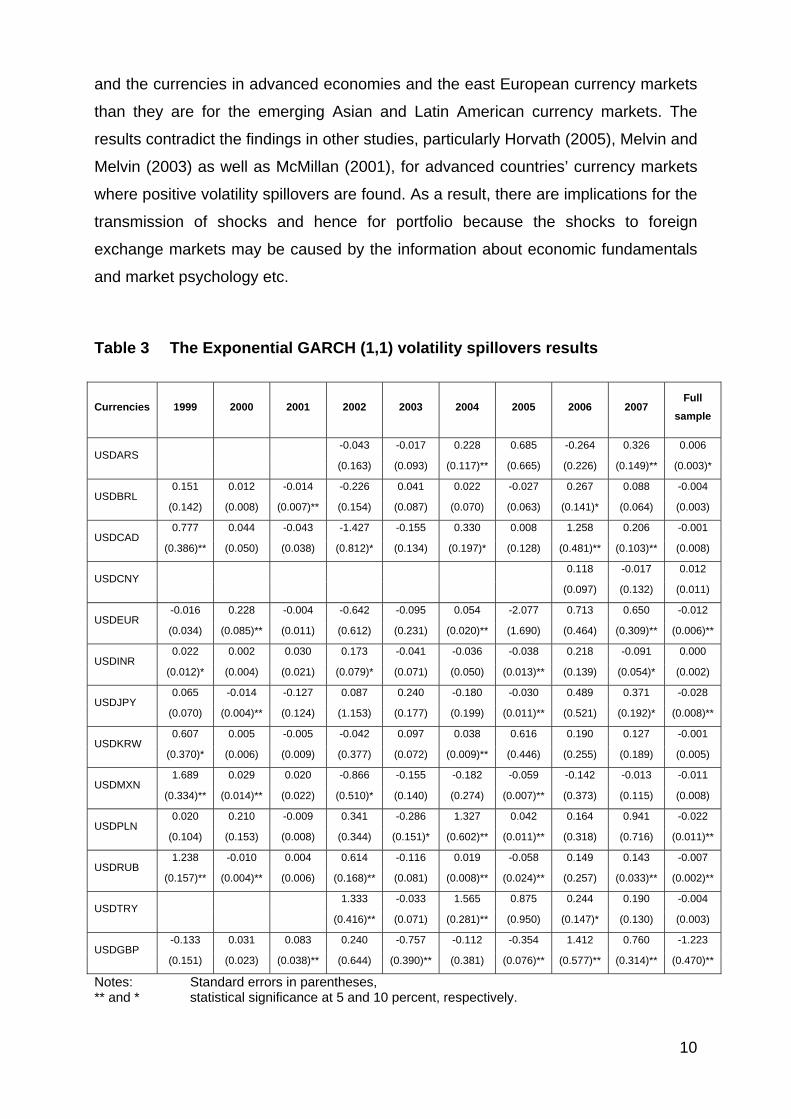
To examine the exchange rate volatility spillovers, the augmented Exponential
GARCH(1,1) model [4] is estimated for the full sample as well as over one year
rolling window periods for all the selected currencies. The estimated spillover indexes
are presented in table 3. For the full sample, the estimated results show statistically
significant negative spillover indexes between the South African rand and the euro,
Japanese yen, Polish zloty, Russian rubble and the British pound. This implies an
inverse volatility co-movement between the selected currencies and the South
African currency.
The results further show no statistically significant volatility spillover effects between
the South African rand and the currencies in selected emerging Asian and Latin
American markets. It is not surprising that the east European currencies have the
similar spillover effects on the South African currency as does the developed
European currencies. Horvath (2005) argues that the central and east European
currency markets are relatively well aligned with those in the euro area in relation to
openness and similar export commodity structures.
Over the one year window samples, there is evidence of common volatility in at least
one window period between the South African rand and all the currencies excluding
the Chinese renmimbi. Consistent with the full sample results, the common volatility
spillovers are mostly frequent between the South African rand and the Russian
rubble as well as the British pound, while they are less frequent between the South
African rand and the Brazilian real and the Korean won. The common volatility
spillovers are prevalent between 2004 and 2005 window periods and less prevalent
in the 2003 and 2006 rolling windows.
These results confirm the hypothesis of the changing degree of exchange rate
volatility spillovers across currency markets overtime. However, it is not clear from
the results whether or not the spillover effects have intensified overtime. Moreover,
the spillovers are random, unstable and change signs between successive window
periods. Generally, the spillovers are more prevalent between the South African rand 9
10
and the currencies in advanced economies and the east European currency markets
than they are for the emerging Asian and Latin American currency markets. The
results contradict the findings in other studies, particularly Horvath (2005), Melvin and
Melvin (2003) as well as McMillan (2001), for advanced countries’ currency markets
where positive volatility spillovers are found. As a result, there are implications for the
transmission of shocks and hence for portfolio because the shocks to foreign
exchange markets may be caused by the information about economic fundamentals
and market psychology etc.
Table 3 The Exponential GARCH (1,1) volatility spillovers results
Currencies
1999 2000 2001 2002 2003 2004 2005 2006 2007 Full
sample
-0.043 -0.017 0.228 0.685 -0.264 0.326 0.006 USDARS
(0.163) (0.093) (0.117)** (0.665) (0.226) (0.149)** (0.003)*
0.151 0.012 -0.014 -0.226 0.041 0.022 -0.027 0.267 0.088 -0.004 USDBRL
(0.142) (0.008) (0.007)** (0.154) (0.087) (0.070) (0.063) (0.141)* (0.064) (0.003)
0.777 0.044 -0.043 -1.427 -0.155 0.330 0.008 1.258 0.206 -0.001 USDCAD
(0.386)** (0.050) (0.038) (0.812)* (0.134) (0.197)* (0.128) (0.481)** (0.103)** (0.008)
0.118 -0.017 0.012 USDCNY
(0.097) (0.132) (0.011)
-0.016 0.228 -0.004 -0.642 -0.095 0.054 -2.077 0.713 0.650 -0.012 USDEUR
(0.034) (0.085)** (0.011) (0.612) (0.231) (0.020)** (1.690) (0.464) (0.309)** (0.006)**
0.022 0.002 0.030 0.173 -0.041 -0.036 -0.038 0.218 -0.091 0.000 USDINR
(0.012)* (0.004) (0.021) (0.079)* (0.071) (0.050) (0.013)** (0.139) (0.054)* (0.002)
0.065 -0.014 -0.127 0.087 0.240 -0.180 -0.030 0.489 0.371 -0.028 USDJPY
(0.070) (0.004)** (0.124) (1.153) (0.177) (0.199) (0.011)** (0.521) (0.192)* (0.008)**
0.607 0.005 -0.005 -0.042 0.097 0.038 0.616 0.190 0.127 -0.001 USDKRW
(0.370)* (0.006) (0.009) (0.377) (0.072) (0.009)** (0.446) (0.255) (0.189) (0.005)
1.689 0.029 0.020 -0.866 -0.155 -0.182 -0.059 -0.142 -0.013 -0.011 USDMXN
(0.334)** (0.014)** (0.022) (0.510)* (0.140) (0.274) (0.007)** (0.373) (0.115) (0.008)
0.020 0.210 -0.009 0.341 -0.286 1.327 0.042 0.164 0.941 -0.022 USDPLN
(0.104) (0.153) (0.008) (0.344) (0.151)* (0.602)** (0.011)** (0.318) (0.716) (0.011)**
1.238 -0.010 0.004 0.614 -0.116 0.019 -0.058 0.149 0.143 -0.007 USDRUB
(0.157)** (0.004)** (0.006) (0.168)** (0.081) (0.008)** (0.024)** (0.257) (0.033)** (0.002)**
1.333 -0.033 1.565 0.875 0.244 0.190 -0.004 USDTRY
(0.416)** (0.071) (0.281)** (0.950) (0.147)* (0.130) (0.003)
-0.133 0.031 0.083 0.240 -0.757 -0.112 -0.354 1.412 0.760 -1.223 USDGBP
(0.151) (0.023) (0.038)** (0.644) (0.390)** (0.381) (0.076)** (0.577)** (0.314)** (0.470)**
Notes: Standard errors in parentheses, ** and * statistical significance at 5 and 10 percent, respectively.
11
The absence of volatility spillover linkages between the South African currency
market and the currency markets in emerging Asian and Latin America means that
the exchange rate shocks affect these currency markets independently. On the
flipside, the presence of negative volatility spillover linkages between the South
African currency market and the currency markets in advanced economies and
eastern Europe means that high volatility in the South African currency market
coincides with low volatility in the these currency markets. Since foreign exchange
volatility is associated with risk, this is desirable for portfolio diversification and
investors’ risk aversion. Investors in these currency markets can rebalance their
portfolios in favour of less risky currency markets as implied by the inversely related
volatility dynamics.
5 Conclusion
This paper examined the exchange rate volatility spillovers or the co-movemetnt in
volatility of the South African currency and the currencies of selected developed and
emerging economies. The augmented EGARCH model was estimated for daily
closing spot exchange rates of the South African currency and the selected currency
markets in developed and emerging Europe as well as Asia and Latin America.
Additionally, one year window samples were estimated to examine whether volatility
spilllovers between the currencies have evolved overtime. The full sample results
show statistically significant negative exchange rate volatility spillover effects
between the South African currency and the currencies in developed and East
European currency markets, on the one hand.
On the other hand, the results do not show any statistically significant volatility
spillover effects between the South African currency and the currencies in emerging
Asian and Latin American currency markets. This result is further reinforced when
analysing the volatility spillovers over the one year window samples. The volatility
spillovers are more frequent between the South African currency and the currencies
in developed and east European currency markets, while they are less frequent for
the currencies in emerging Asian and Latin American currency markets. Moreover,
the results confirm the hypothesis of changing exchange rate volatility spillovers
across currency markets overtime.
12
References
Andersson, J., 2001 “On the normal inverse Gaussian stochastic volatility model,”
Journal of Business & Economic Statistics, Vol. 19, pp. 44-54.
Black, A J and McMillan D G. 2000. "Long Run Trends, Business Cycle Components and Volatility Spillovers in Daily Exchange Rates: Evidence for G7 Exchange Rates," Discussion Paper No. 0010, Department of Economics, University of St. Andrews. Bollerslev, T. 1986. “Generalised Autoregressive Conditional Heteroscedasticity,” Journal of Econometrics, Vol. 31, pp. 307-27 __________ 1990. “Modelling the Coherence in Short-Run Nominal Exchange Rates: A Multivariate Generalised ARCH Model,” Review of Economics and Statistics, Vol. 71, No. 3, pp. 498-505 _________ and Wooldridge J M. 1992. “Quasi-Maximum Likelihood Estimation and Inference in Dynamic Models with Time Varying Covariances,” Econometric Reviews, Vol. 11, pp. 143–172 Engle, R F. 1982. “Autoregressive Conditional Heteroscedasticity with Estimates for the Variance of United Kingdom Inflation,” Econometrica, Vol. 50, No. 4, pp. 987-1008 ________, Ito, T. and Lin W-L. 1990. “Meteor Showers or Heat Waves? Heteroscedastic Intra-Daily Volatility in the Foreign Exchange Market,” Econometrica, Vol. 58, No. 3, pp. 339-50 Doong, S-C. and Yang, S-Y. 2004. “Price and Volatility Spillovers between Stock Markets and Exchange Rates: Empirical Evidence from the G-7 Countries,” International Journal of Business and Economics, Vol. 3, No. 2, pp. 139-153 Febrianm, E. and Herwany, A, 2007. "Co-integration and Causality Among Jakarta Stock Exchange, Singapore Stock Exchange, and Kuala Lumpur Stock Exchange," MPRA Paper, No 9632, University Library of Munich, Germany. Guimaraes, R F. and Karacadag C. 2004. “The Empirics of Foreign Exchange Intervention in Emerging Market Countries: The Case of Mexico and Turkey,” IMF Working Paper, No. 04/123, Washington: International Monetary Fund Horvath, R. 2005. "Exchange Rate Variability, Pressures and Optimum Currency Area Criteria: Lessons for the Central and Eastern European Countries," Working Paper, No. 05/08, Czech National Bank, Research Department Klaassen, F. 1999. “Have Exchange Rates Become More Closely Tied?: Evidence from a New Multivariate GARCH Model,” Discussion Paper, No. 10, Tilburg University, Centre for Economic Research
13
McMillan, D G. 2001. “Common Stochastic Volatility Trend in European Exchange Rates,” Applied Economic Letters, Vol. 8, No. 9, September, pp605-08 Melvin, M. and Melvin, B. 2003. “The Global Transmission of Volatility in the Foreign Exchange Market,'' Review of Economics and Statistics, Vol. 85, pp670-679. Pramor M and Taramisa N T. 2006. “Common Volatility Trends in the Central and Eastern European Currencies and the Euro,” Working Paper, No. 06/206, Washington: International Monetary Fund
14
Appendix
Table A1 Currencies’ description
Currency Description
USDARS Argentinean peso per US dollar
USDBRL Brazilian real per US dollar
USDCAD Canadian dollar per US dollar
USDCNY Chinese renmimbi per US dollar
USDEUR Euro per US dollar
USDINR Indian rupee per US dollar
USDJPY Japanese yen per US dollar
USDKRW Korean won per US dollar
USDMXN Mexican peso per US dollar
USDPLN Polish zloty per US dollar
USDRUB Russian rubble per US dollar
USDTRY Turkish lira per US dollar
USDGBP British pound per US dollar
USDZAR South African rand per US dollar
Table A2 Descriptive statistics
Currencies Mean Maximum Minimum Std. Dev. Skewness Kurtosis No. of obs.
USDARS 2.38 3.86 1.00 0.98 -0.60 1.55 2431
USDBRL 2.36 3.95 1.21 0.53 0.67 2.73 2431
USDCAD 1.34 1.61 0.92 0.19 -0.35 1.78 2431
USDCNY 8.12 8.28 6.98 0.29 -2.07 6.60 2431
USDINR 44.97 49.05 39.25 2.43 -0.46 2.72 2431
USDJPY 114.81 134.71 97.33 7.20 0.23 2.56 2431
USDKRW 1117.19 1368.00 902.10 124.53 -0.18 1.79 2431
USDMXN 10.33 11.67 8.97 0.78 -0.24 1.54 2431
USDPLN 3.63 4.71 2.13 0.57 -0.56 2.32 2431
USDRUB 28.09 31.96 20.62 2.22 -0.30 2.52 2431
USDTRY 1.20 1.77 0.32 0.39 -1.02 2.63 2431
USDGBP 0.60 0.73 0.47 0.07 0.12 1.77 2431
USDEUR 0.90 1.21 0.63 0.15 0.31 1.90 2431
USDZAR 7.38 12.45 5.62 1.41 1.50 4.67 2431
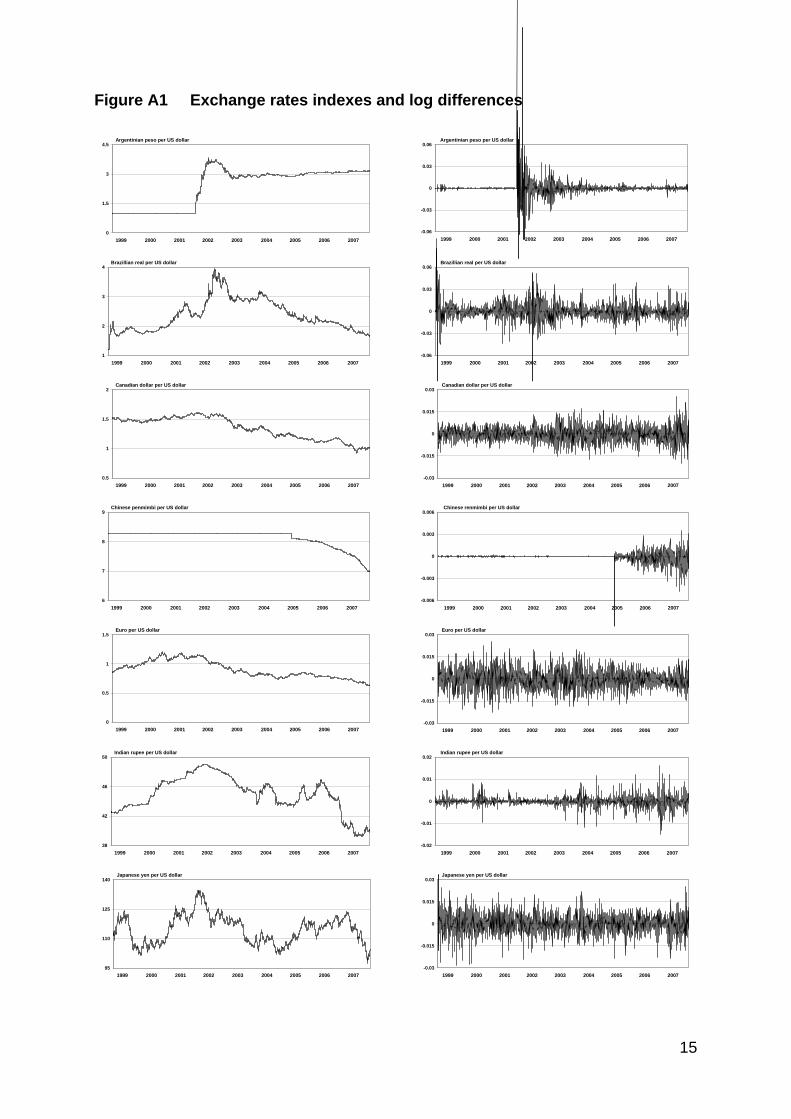
Figure A1 Exchange rates indexes and log differences
0
1.5
3
4.5
1999 2000 2001 2002 2003 2004 2005 2006 2007
Argentinian peso per US dollar
1
2
3
4
1999 2000 2001 2002 2003 2004 2005 2006 2007
Brazillian real per US dollar
0.5
1
1.5
2
1999 2000 2001 2002 2003 2004 2005 2006 2007
Canadian dollar per US dollar
6
7
8
9
1999 2000 2001 2002 2003 2004 2005 2006 2007
Chinese penmimbi per US dollar
0
0.5
1
1.5
1999 2000 2001 2002 2003 2004 2005 2006 2007
Euro per US dollar
38
42
46
50
1999 2000 2001 2002 2003 2004 2005 2006 2007
Indian rupee per US dollar
95
110
125
140
1999 2000 2001 2002 2003 2004 2005 2006 2007
Japanese yen per US dollar
-0.06
-0.03
0
0.03
0.06
1999 2000 2001 2002 2003 2004 2005 2006 2007
Argentinian peso per US dollar
-0.06
-0.03
0
0.03
0.06
1999 2000 2001 2002 2003 2004 2005 2006 2007
Brazillian real per US dollar
-0.03
-0.015
0
0.015
0.03
1999 2000 2001 2002 2003 2004 2005 2006 2007
Canadian dollar per US dollar
-0.006
-0.003
0
0.003
0.006
1999 2000 2001 2002 2003 2004 2005 2006 2007
Chinese renmimbi per US dollar
-0.03
-0.015
0
0.015
0.03
1999 2000 2001 2002 2003 2004 2005 2006 2007
Euro per US dollar
-0.02
-0.01
0
0.01
0.02
1999 2000 2001 2002 2003 2004 2005 2006 2007
Indian rupee per US dollar
-0.03
-0.015
0
0.015
0.03
1999 2000 2001 2002 2003 2004 2005 2006 2007
Japanese yen per US dollar
15
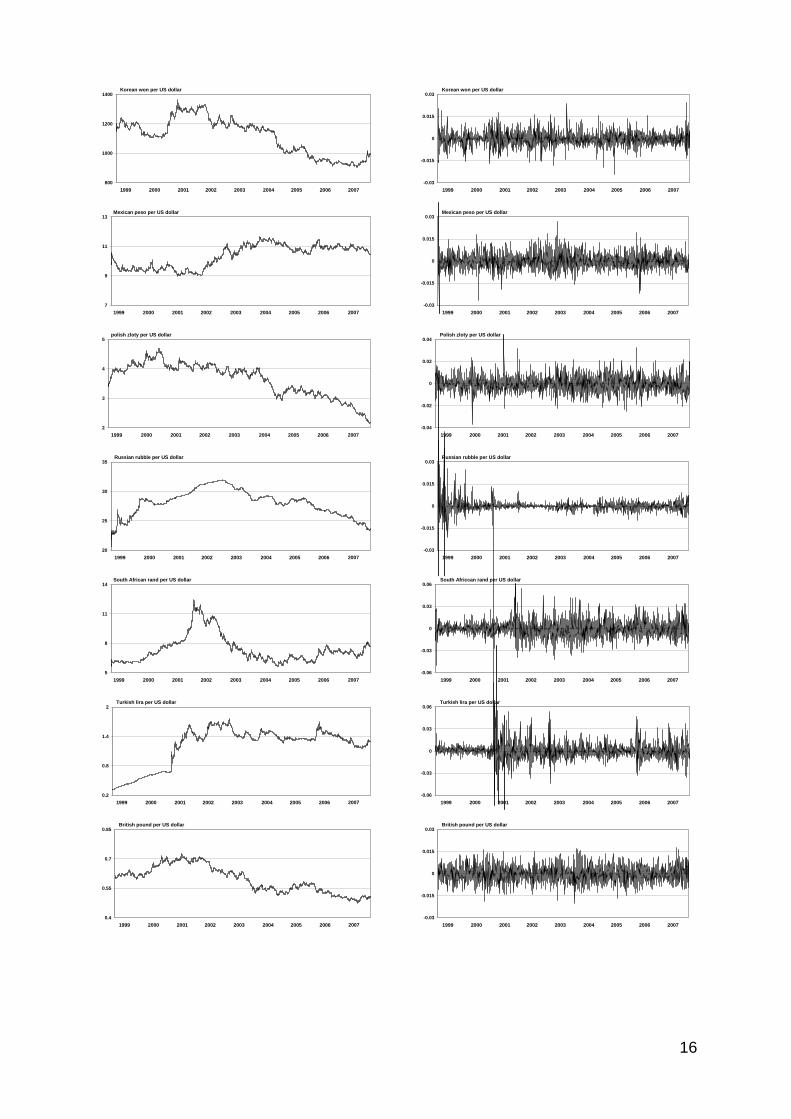
800
1000
1200
1400
1999 2000 2001 2002 2003 2004 2005 2006 2007
Korean won per US dollar
7
9
11
13
1999 2000 2001 2002 2003 2004 2005 2006 2007
Mexican peso per US dollar
2
3
4
5
1999 2000 2001 2002 2003 2004 2005 2006 2007
polish zloty per US dollar
20
25
30
35
1999 2000 2001 2002 2003 2004 2005 2006 2007
Russian rubble per US dollar
5
8
11
14
1999 2000 2001 2002 2003 2004 2005 2006 2007
South African rand per US dollar
0.2
0.8
1.4
2
1999 2000 2001 2002 2003 2004 2005 2006 2007
Turkish lira per US dollar
0.4
0.55
0.7
0.85
1999 2000 2001 2002 2003 2004 2005 2006 2007
British pound per US dollar
-0.03
-0.015
0
0.015
0.03
1999 2000 2001 2002 2003 2004 2005 2006 2007
Korean won per US dollar
-0.03
-0.015
0
0.015
0.03
1999 2000 2001 2002 2003 2004 2005 2006 2007
Mexican peso per US dollar
-0.04
-0.02
0
0.02
0.04
1999 2000 2001 2002 2003 2004 2005 2006 2007
Polish zloty per US dollar
-0.03
-0.015
0
0.015
0.03
1999 2000 2001 2002 2003 2004 2005 2006 2007
Russian rubble per US dollar
-0.06
-0.03
0
0.03
0.06
1999 2000 2001 2002 2003 2004 2005 2006 2007
South Africcan rand per US dollar
-0.06
-0.03
0
0.03
0.06
1999 2000 2001 2002 2003 2004 2005 2006 2007
Turkish lira per US dollar
-0.03
-0.015
0
0.015
0.03
1999 2000 2001 2002 2003 2004 2005 2006 2007
British pound per US dollar
16