Embed Size (px)
Citation preview

i
EXCHANGE RATE PASS-THROUGH TO IMPORT
AND CONSUMER PRICES IN NIGERIA: EVIDENCE
FROM THRESHOLD REGRESSION MODELS
BY
BASHIR ALIYU M.SC/SOC-SCI/15068/2011-2012
Being a Masters Thesis submitted to the School of Postgraduate Studies, Ahmadu Bello
University, Zaria in partial fulfillment of the requirements for the Award of Masters
Degree of Science in Economics.
Department of Economics,
Faculty of Social Sciences,
Ahmadu Bello University,
Zaria, Nigeria.
NOVEMBER, 2016
ii
DECLARATION
I hereby declare that this thesis titled, “Exchange Rate Pass-Through to Import and Consumer
Prices in Nigeria: Evidence from Threshold Regression Model (1986Q1 – 2014Q4)” was
done by me in the Department of Economics, Ahmadu Bello University Zaria, Nigeria under
the supervision of Dr. M. M. Usman and Dr. Jibrin S. Mohammed. All information in this
document has been obtained and presented in accordance with academic rules and ethical
conduct. I have fully cited and referenced all materials and results that are not original to this
work. Thus, this thesis is wholly my own work and has not been published or
submitted for another degree here or any other University.
Bashir Aliyu ............................................ ..............................
(Signature) (Date)

iii
CERTIFICATION
This thesis titled, “Exchange Rate Pass-Through to Import and Consumer Prices in Nigeria:
Evidence from Threshold Regression Model (1986 – 2014)” meets the regulation governing
the award of Masters Degree of Science of the Department of Economics of Ahmadu Bello
University Zaria, Nigeria and is approved for its contribution to knowledge and literary
presentation.
Dr. Muhammad Muttaka Usman .......................................... ................................
Chairman, Supervisory Committee (Signature) (Date)
Dr. Jibrin S. Mohammed ......................................... ...............................
Member, Supervisory Committee (Signature) (Date)
Dr. (Mrs.) Salamatu Isah .......................................... ..............................
Head of Deapartment (Signature) (Date)
Prof. Kabir Bala ......................................... ...............................
Dean, Postgraduate School (Signature) (Date)

iv
DEDICATION
This thesis is dedicated to my beloved parent, Mal. Aliyu Muhammad and Malama Aljannatu
Aliyu for their support, prayer and encouragement throughout the programme.

v
ACKNOWLEDGEMENTS
All gratitude are due to Almighty Allah for making this study a reality. I also wish to
acknowledge the unflinching support I received from my parents, Mal. Aliyu Muhammad and
Malama Aljannatu Aliyu; my beloved wife, Malama Zainab Shehu Sani; my sister, Malama
Jamila Aliyu; and my brothers, Shamsuddeen Aliyu and Muhammad Sani Aliyu throughout
the programme. To my two little children, Aliyu and Ahmad for their warm welcome
whenever I returned home from school, May Almighty Allah bless you all.
A special gratitude goes to my supervisors, Dr. Muttaka M. Usman and Dr. Jubrin S.
Mohammed for their scholarly contributions and guidance throughout the research period.
Your valuable contributions and guidance has, in no small measure, helped in making the
study a success. Equally, my appreciation goes to Dr. Sanusi Aliyu Rafindadi, who reviewed
my work and made useful suggestions therein. To all the lecturers in the Department, who
have taught me from my undergraduate to Masters, I appreciate your guidance. In addition, I
wish to thank my course mates, especially the class representative, Mr. Usman Adamu Bello,
for their support and assistance at various stages of the programme. May Almighty Allah
reward you all abundantly.
I must acknowledge the immeasurable support and encouragement of my boss, Dr. Aminu
Ladan Sharehu, the Director-General/Chief Executive, National Teachers‟ Institute Kaduna
as well as my colleagues in the office, the Danmakwayon Daura, Alh. Jamilu Abdulkadir;
Mal. Abdulrahman Yusuf; Mal. Abdulrahman Ahmad; Hajiya Maryam; Mal. Suleiman
Dauda among others. They have been very helpful and I pray that Almighty Allah reward you
all abundantly.

vi
ABSTRACT
This study examined the exchange rate pass-through effect at the aggregate level into import
and consumer prices in Nigeria between the periods 1986 and 2014. The study used the
Threshold Regression statistical technique to ascertain the possibility of the presence of
nonlinearity and asymmetry in the behaviour of exchange rate pass-through in Nigeria. It also
considered the pass-through from exchange rate to import prices, using import data, and then
the pass-through from import prices to consumer prices. The study found that Exchange Rate
Pass-Through in Nigeria is incomplete, low, nonlinear, slow in speed and symmetric. The
effect was discovered to be higher on import than consumer prices, implying that the pass-
through effect declines along the pricing chain. These findings are useful in the design and
implementation of monetary and exchange rate policies by the Central Bank of Nigeria.
vii
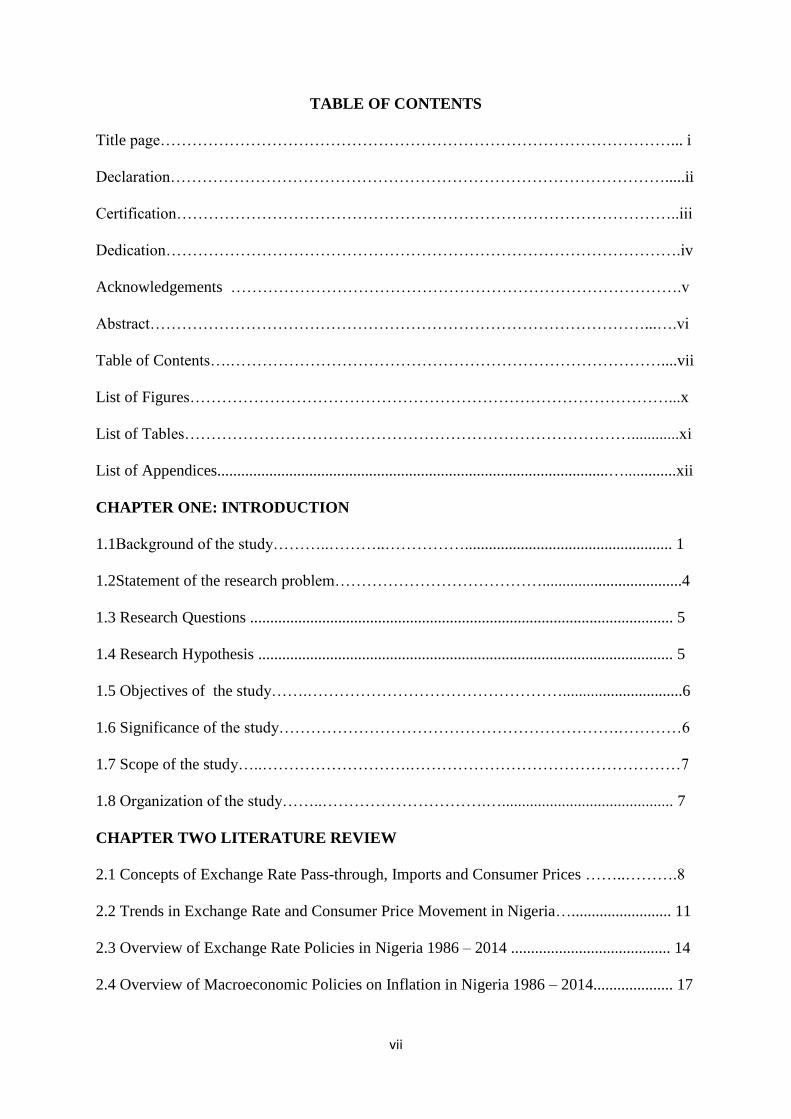
TABLE OF CONTENTS
Title page……………………………………………………………………………………... i
Declaration………………………………………………………………………………….....ii
Certification…………………………………………………………………………………..iii
Dedication…………………………………………………………………………………….iv
Acknowledgements ………………………………………………………………………….v
Abstract…………………………………………………………………………………...….vi
Table of Contents….………………………………………………………………………....vii
List of Figures………………………………………………………………………………...x
List of Tables…………………………………………………………………………............xi
List of Appendices..................................................................................................….............xii
CHAPTER ONE: INTRODUCTION
1.1Background of the study………..………..…………….................................................... 1
1.2Statement of the research problem…………………………………...................................4
1.3 Research Questions .......................................................................................................... 5
1.4 Research Hypothesis ........................................................................................................ 5
1.5 Objectives of the study…….…………………………………………..............................6
1.6 Significance of the study……………………………………………………….…………6
1.7 Scope of the study…..……………………….……………………………………………7
1.8 Organization of the study……..………………………….…........................................... 7
CHAPTER TWO LITERATURE REVIEW
2.1 Concepts of Exchange Rate Pass-through, Imports and Consumer Prices ……..……….8
2.2 Trends in Exchange Rate and Consumer Price Movement in Nigeria…......................... 11
2.3 Overview of Exchange Rate Policies in Nigeria 1986 – 2014 ........................................ 14
2.4 Overview of Macroeconomic Policies on Inflation in Nigeria 1986 – 2014.................... 17

viii
2.5 Theoretical Literature Review……………………………………………………....…. 23
2.6 Gaps in the Literature..........………………..……………………………………..….….31
CHAPTER THREE METHODOLOGY
3.1 Conceptual framework ........……………….………………………………………….....32
3.2 Theoretical Framework ………..…………………………………………………….......34
3.3 Model Specification .....………………………………..……………………………......36
3.4 Data Set and Sources ........................................................................................................39
3.5 Pre-Estimation Test ..........................................................................................................40
3.6 Method of Estimation ..................................................................................................... 41
3.7 Apriori Expectation ........................................................................................................ 42
CHAPTER FOUR: PRESENTATION OF RESULTS, ANALYSES AND
DISCUSSIONS
4.1 Tests for Stationarity…...................……...………………………………………….... 44
4.2 Analyses of the Results .…………..……………………………………………………46
4.3 Exchange Rate Pass-through to Import Prices………………………………………….48
4.4 Exchange Rate Pass-through from Import to Consumer Prices…………………….......50
4.5 Speed of the Pass-Through ..............................................................................................53
4.6 Nonlinearity of ERPT in Nigeria .....................................................................................53
4.7 Exchange Rate Pass-through Asymmetry ........................................................................53
CHAPTER FIVE: SUMMARY, CONCLUSION AND POLICY
RECOMMENDATIONS
5.1 Summary …………………….…………………………………….................................55
5.2 Conclusion…………………………………………………………………………….. .56
5.3 Recommendations…………………………………………………………………….....56
References ..............................................................................................................................58

ix
Appendices ............................................................................................................................ 64

x
LIST OF FIGURES
Figure 2.1: Trends in Exchange Rate and Consumer Prices Movement (Inflation) in Nigeria
(1986 – 2014)
Figure 3.1: Conceptual Framework of Exchange Rate Pass-Throgh to import and Consumer
Prices

xi
LIST OF TABLES
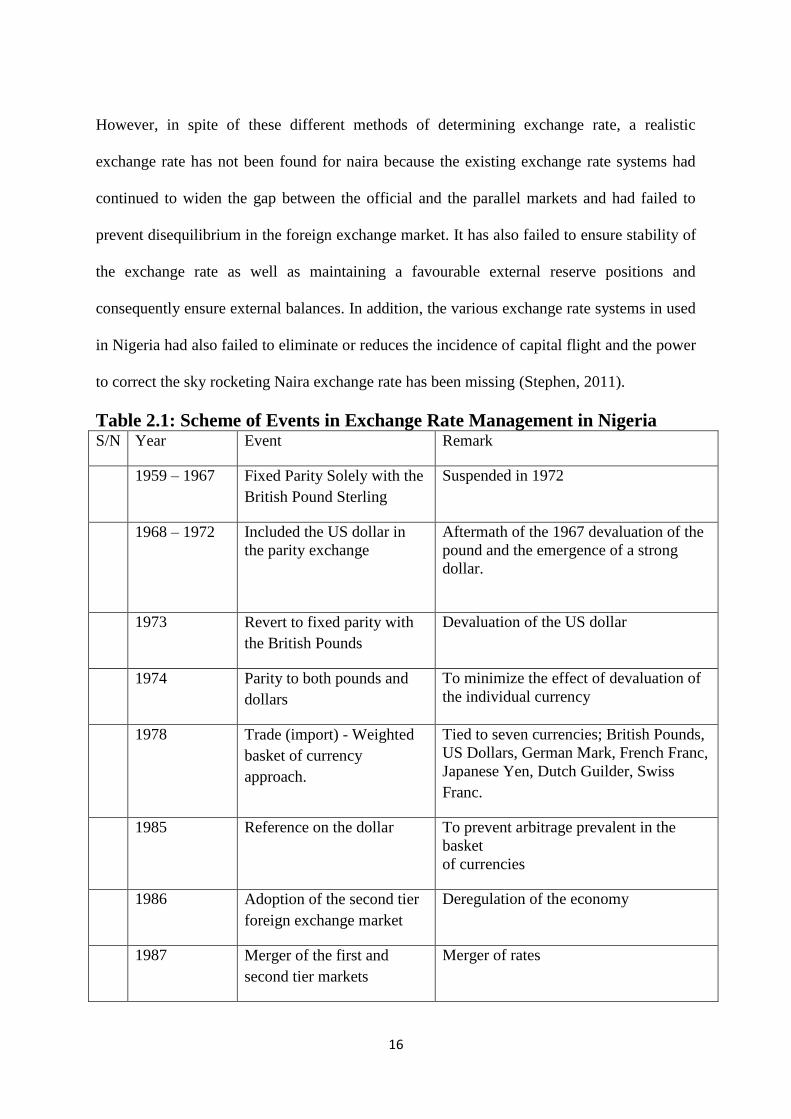
Table 2.1: Scheme of Events in Exchange Rate Management in Nigeria
Table 4.1: Results of Unit Root Test
Table 4.2: Result of Model Specification Criteria
Table 4.3: Result of Nonlinear Threshold Regression (Import)
Table 4.4: Result of Nonlinear Threshold Regression (Consumer Prices)

xii
LIST OF APPENDICES
Appendix I: Results of Nonlinear Threshold Regression
Appendix II: Results of Nonlinear Threshold Regression
Appendix III: Trends of the Variables

1
CHAPTER ONE
INTRODUCTION
1.1 BACKGROUND OF THE STUDY
Globalisation has increased the openness of global economies thereby necessitating an
increased focus on exchange rate pass-through with the aim of determining an appropriate
monetary policy response to exchange rate fluctuations. The incidence of large fluctuations in
exchange rates has informed the need for a better understanding of the determinants of
transmission of exchange rate variations into import and domestic prices (Aliyu, Sanni and
Duke, 2009). The concept of Exchange Rate Pass-Through (ERPT) has been well known to
Economists for a long time but significant interest in the concept grew since after the Plaza
Accord of 1985. This was an agreement between France, West Germany, Japan, USA and
UK to depreciate the US dollar in relation to the Japanese yen and German Deutsche Mark
and it was expected that the price of Japanese import in US dollar would be expensive.
However, it was later observed that the price of the Japanese imports in US dollar rose only
slightly or even remained unchanged and in some cases actually declined (Goldberg and
Knetter in Berga, 2012). This prompted Economists‟ increased interest in trying to estimate
the extent of speed and magnitude of Exchange Rate Pass-Through (ERPT).
Exchange Rate Pass-Through refers to the change in domestic prices that can be attributed to
a prior change in the nominal exchange rate (Aliyu et al., 2009). It is also generally
considered as the extent to which changes in exchange rate are reflected in the prices of
goods and services (Sanusi, 2010). When there is a proportionate change in domestic prices
arising from a change in exchange rate, the pass-through is said to be complete. It is
incomplete when the change is less than proportionate and zero pass-through occurs, when a
change in exchange rate does not affect domestic prices. ERPT affects consumer prices
directly through prices of imported consumer goods and indirectly through the prices of

2
imported intermediate goods. When the currency of the domestic country appreciates, it will
lead to lower import prices of finished goods and inputs. Likewise, when the domestic
currency depreciates, it will result in higher import prices which are more likely to be passed
on to consumer prices. Currency depreciation also causes a rise in the prices of imported
inputs which may result in the increase in the marginal cost of producers. Thus, this results to
higher prices in domestically produced goods (Mohammed, 2013).
Initially ERPT was perceived to be theoretically one-to-one, i.e, hundred percent change in
foreign price is wholly passed unto domestic consumer prices. This is because the Purchasing
Power Parity (PPP) was based on the perfect competitive market model. However, later
empirical studies have found ERPT to be incomplete (Berga, 2012). This may not be
unconnected with the fact that most of the assumptions underlying the theory do not exist in
reality thus, leading to contradictory outcomes from empirical studies. Some of the
explanations to the incompleteness of pass-through include the exporters‟ Pricing-To-Market
(PTM). Krugman (1987) first popularised this idea that, when there is a depreciation in the
importers‟ currency, foreign exporters tend to reduce their export prices by reducing the
margin of their profits instead of increasing the import prices in order to maintain market
share. Similarly, exporters may invoice in the currency of the importer known as Local
Currency Pricing (LCP). In such situations, prices do not often fluctuate with the variation in
exchange rate (Goldberg and Knetter, 1997). Similarly, some studies on ERPT have found
that in some cases, there tend to be higher pass-through during appreciation than during
depreciation. In some situations also, there tend to be zero/low pass-through during small
changes in exchanges and higher pass-through during higher changes in exchange rate. This
brings about the concept Asymmetry in ERPT.
There has been a debate about the major sources of inflation in Nigeria. Exchange rate
depreciation is believed to be one of the sources of inflationary trend in Nigeria. This is more

3
so as empirical evidence shows that there is a stronger positive relationship between
autonomous exchange rate and Consumer Price Index (CPI) even though the relationship is
weaker between the official rate and CPI (Adekunle, 2010). Other reasons brought forward
include the persistent inflationary trend experienced in the country alongside the successive
depreciation of the naira following the adoption of the Structural Adjustment Programme
(SAP) in 1986.
The Structural Adjustment Programme (SAP) was introduced to among other things, correct
the overvaluation of the naira through the setting up of a viable Second-tier Foreign
Exchange Market (SFEM). This led to the successive depreciation of the naira from N1.56
/US$1 at the end of September, 1986 to N4.54/US$1 in 1988. It almost double to N8.04 =
US$1and N17.30/US$1 in 1990 and 1992 respectively. By 1994, the de-factor pegging of the
official exchange rate formalised when the naira was officially pegged at N21.88/US$1 in
1994 Budget and the parallel market was declared illegal (Sanni, 2006). By the year 2000,
when the new civilian administration of Olusegun Obasanjo came to power, the exchange
rate was liberalised leading to the nose-dive of the naira to N102.1/US$1 in 2000,
N120.9/US$1 in 2002 and 133.5/US$1 in 2004 respectively. The naira appreciated against
the USD for the first time in 2005 since 1986 to N132.1/US$1 and later N128.7/US$1 and
N118.5/US$1 in 2006 and 2008. It, however, skyrocketed to around N157.3/US$1 in 2013
and later N158.6/US$1 in 2014 (CBN statistical Bulletin, 2014).
Similarly, in 1986, the rate of inflation was 6.25%. The figure more than quadrupled in 1988
to 34.2%. There was sharp decline to 7.9% in 1990 but climbed to 44.57% in 1992.It
remained around the same figure until 2002. Ascendancy in the inflation rate began
afterwards from 2009. However, the rate continued to rise from 6.94% in 2000 to 12.89% in
2002, 15% in 2004. A drop was experienced in 2006 to 8.22% but rose to 11.58% and

4
13.72% in 2008 and 2010 respectively (IMF World Economic Outlook, 2011 and
International Financial Statistics, 2012). It declines to 12.2% in 2012 and then to 8.0% in
2014 (CBN Statistical Bulletin, 2015).
A closer look at the relationship between the exchange rate and inflation in Nigeria within
the period 1986 to 2014 shows a somewhat positive relationship. There were sharp falls in
the inflation rate in 2006. The fall in 2006 could be linked to the Central Bank of Nigeria‟s
financial sector reforms during the period that led to the consolidation of banks‟ capital
base, accumulation of sizeable external reserve and appreciation of the naira against US
Dollar. This signifies that there is high level of possibility that exchange rate variability may
affect inflation in Nigeria. This study investigates the magnitude and speed of exchange rate
pass-through to import and consumer prices in Nigeria using the Threshold Regression
Model.
1.2 STATEMENT OF THE RESEARCH PROBLEM
Nigeria is an import dependent and a mono-cultural economy with oil constituting about 90%
of its revenue. The country heavily depends on imports from many countries as many
industries in Nigeria import their raw materials as well as massive importation of finished
goods from foreign countries (Adedayo, 2012). This has renders the nation vulnerable to
possible foreign inflation transmission.
Developments in the external sector of the Nigerian economy have led to the continued
dwindling of crude oil receipts due to both demand and supply factors which led to the
deterioration of the foreign exchange status of the naira. Concerns are on the implications of
these developments on inflation or the extent of exchange rate pass-through of foreign prices
to domestic and import prices. Thus, the need to empirically unravel the consequences of
5
these developments and provide policy recommendations for monetary policy authorities in
Nigeria cannot be overemphasised.
Although studies were conducted on ERPT in Nigeria, they rely heavily on linear models
while empirical evidences on some economies have found that ERPT could nonlinear.
Again, most of the above studies did not consider the first stage in the pass-through which is
to import prices but chose to jump to consumer prices. This has eluded a fundamental aspect
of the pass-through mechanism that could give more comprehensive information about ERPT
in Nigeria. In addition, the previous studies have not considered the possibility of the
presence of Asymmetry in ERPT in Nigeria.
1.3 RESEARCH QUESTIONS
i. What is the degree of ERPT to import and consumer prices in Nigeria?
ii. What is the speed of ERPT to import and consumer prices in Nigeria?
iii. Is there evidence of nonlinearity in ERPT to import and consumer prices in Nigeria?
iv. Is there presence of asymmetry in ERPT to import prices in Nigeria?
1.4 RESEARCH HYPOTHESES
i. There is low ERPT to import and consumer prices in Nigeria.
ii. There is low speed of ERPT to import and consumer prices in Nigeria.
iii. There is evidence of nonlinearity in ERPT to imports and consumer prices in Nigeria
iv. There is the presence of asymmetry in ERPT to import prices in Nigeria.
1.5 OBJECTIVES OF THE STUDY
The specific objective of this study is to examine exchange rate pass-through to import and
consumer prices in Nigeria.
Broadly, this study intends to:

6
i. Estimate the degree of ERPT to import and consumer prices in Nigeria
ii. Estimate the speed of ERPT to import and consumer prices in Nigeria
iii. Examine if there is evidence of nonlinearity in ERPT to import and consumer prices
in Nigeria
iv. Examine if there is the presence of asymmetry ERPT to import prices in Nigeria
1.6 SIGNIFICANCE OF THE STUDY
Exchange rate movements are indeed crucial to the stability of the economy and monetary
policy decisions. In a developing country like Nigeria with persistent trade deficits arising
from its dependence on imports of intermediate and consumer goods, the knowledge of ERPT
is important in appropriately adjusting its exchange rates to ensure competitiveness in the
international market and prepare an effective expenditure switching strategy. Similarly,
knowledge of Pass-through to import prices in Nigeria is very useful to monetary authorities
and the use of import data in this study has given a clearer picture of the pass-through to
import in Nigeria.
Knowledge of the linearity status of ERPT is of importance to monetary authorities in
designing a more effective monetary policy. In addition, knowledge about the presence or
otherwise of asymmetry in ERPT in Nigeria will help the monetary authorities in making an
informed policy decisions, most especially as the country is faced with foreign exchange
problems.
1.7 SCOPE OF THE STUDY
This study intends to study the exchange rate pass-through to import and consumer prices in
Nigeria from 1986 to 2014. It intends to consider the transmission of the ERPT to import
prices and also find out whether ERPT in Nigeria is symmetric or asymmetric.

7
1.8 ORGANISATION OF THE STUDY
This work is organised into five chapters. Chapter one consists of the general introduction,
statement of the research problem, research questions, objectives of the study, significance of
the study, scope and organisation of the study. Chapter two comprises the conceptual,
theoretical and empirical literatures related to ERPT. Chapter three is the methodology while
chapter four contains the analyses and interpretation of results. Chapter five provides the
summary, conclusion and recommendations. Thereafter, the references and appendices are
attached.
CHAPTER TWO
LITERATURE REVIEW
2.1 CONCEPTS OF EXCHANGE RATE PASS-THROUGH, IMPORTS AND
CONSUMER PRICES
2.1.1 EXCHANGE RATE

8
Exchange rate has been defined as the price of one currency in terms of another. It is the rate
at which one currency exchanges for another (Jhingan, 2003). It also refers to the cost of
converting naira into US dollars or other foreign currencies and is determined by the demand
and supply of the different currencies. They mediate any transaction between buyers and
sellers of goods and services in different countries (Kishtainy, 2012). Exchange rate between
two currencies is the rate at which one currency will be exchanged for another. It is also
regarded as the value of one country‟s currency in terms of another currency (Sullivan,
Steven and Shefirin, 2003). The main source of foreign exchange demand comes from
importers, purchasers of foreign securities, government agencies buying foreign goods or
services, basic travelling allowance and personal travelling allowances (Redmond, 2009).
Economists have identified three separate concepts used for measuring exchange rate which
includes:
The nominal exchange rate is the price of a currency in terms of another currency. The
domestic currency terms defines exchange rate as the units of domestic currency per foreign
currency, while the foreign currency term defines exchange rate as the units of a foreign
currency in terms of domestic currency (Dwivedi, 2007).
The real exchange rate is the relative price of local goods to foreign goods. It is the nominal
exchange rate which has been adjusted for price level between countries (Odusola, 2006).The
external real exchange rate is the ratio of aggregate foreign price level or cost level to the
home countries aggregate price or cost level while the internal real exchange rate measures
the relative prices of two broad categories of goods; ratio of domestic price of tradable goods
to non tradable goods within a country (Viser, 2004).

9
The effective exchange rate; is associated with a multilateral exchange rate where a country
has multiple trading partner. In this case, the rate is weighted and incorporates all forms of
taxes charged on import and export (Odusola, 2006). However, multilateral real exchange
rate is a weighted average of the external real exchange rate index with respect to using
multiple trading partners (Viser, 2004).
2.1.2 EXCHANGE RATE PASS-THROUGH
According to Goldberg and Knetter (1997) ERPT is defined as „the percentage change in
local currency import prices resulting from a one percent change in the exchange rate
between the exporting and importing countries‟. Adolfson (2001) defined the term ERPT as
the percentage change in import caused by an unidentified shock to the exchange rate. In the
view of Mumtaz, Oomen and Wang (2006), ERPT is the percentage change in local currency
import prices following a one percentage change in the exchange rate between importing and
exporting countries. According to Barhoumi (2005), ERPT can statistically be represented as
the elasticity of import prices to a change in exchange rates. An alteration in import prices
can consequently be extended to producer and consumer prices which will end up affecting
price level in the economy (Mohammed, 2013).
The degree of pass-through possibly depends on whether the exchange rate movement is
caused by a genuine exchange rate shock, or whether some other disturbances to the economy
generate an implicit exchange rate change. The definition in terms of import price change
seems narrow. A broader definition is the transmission of exchange rate shock to the overall
price level, either to the producer price index (PPI) or to the consumer price index (CPI)
(Devereux and Yetman, 2002). The pass-through is also dependent on whether one defines it
as partial – only measuring the direct effect on the price relation, excluding the effect on

10
other variables – or total – determining the entire effect an exchange rate change causes,
working through every interaction of the price determination (Adolfson, 2001).
2.1.3 DOMESTIC PRICE
A domestic price level represents the current price for a specific good or service in an
economy. It is the general level of prices in an economy. This may refer to consumer goods
prices in which case it is measured by a Retail Price Index, or to all goods produced,
including investment and government purchases as well as consumer goods, in which case it
is measured by a GDP deflator (Oxford Dictionary of Economics, 2013). Government
agencies or national Economists tend to look at various price levels in order to assess rising
or falling prices, called inflation and deflation in economic terms, respectively. The most
common domestic price level is the consumer price index. This index is common in a host of
countries; it measures the prices for a basket of goods that most Economists deem necessary
to individuals in the economy. Price levels can also represent a snapshot in time of prices,
allowing for benchmarks among various periods.
Price levels in a single nation‟s economy are often the most important elements of a market.
Hybrid economies, those that contain some elements of a free market and government
intervention, use the money supply to control inflation. The domestic price level as computed
using a consumer price index could signal the amount of inflation. When inflation increases
consistently over time, the nation‟s government may decide to decrease the money supply. In
theory, this should help control inflation and reduce its effect on the economy.
Another use of the domestic price level is the calculation of a country‟s gross domestic
product (GDP). In the classical sense, GDP represents the market value for all goods
produced by a nation. GDP tends to limit the computation of this figure to all goods produced

11
within the natural, domestic borders of the country. A country can experience GDP growth
when the dollar value of these goods increases through real production output increases.
Inflationary increases in this figure are not representative of true growth.
It is often difficult for an individual to compute a domestic price level. Government agencies,
therefore, provide this information on a monthly, quarterly, or annual basis. Economists and
other organizations can help track these figures and interpret the data. Central Banks or other
agencies may provide insight into the figures. This can result in a discussion on the topic or
interpretation of the data as computed (Wisegeek, 2003).
2.2 TRENDS IN EXCHANGE RATE AND CONSUMER PRICE MOVEMENT IN
NIGERIA
Inflation has been a major issue to policy makers in all countries of the world and it has
been at the heart of macroeconomics for as long as the discipline. The traditional Philips
curve was the first evidence that showed the inverse relationship between inflation and
unemployment. Freidman, (1965), however, contends that the trade-off between inflation
and unemployment in the Philips curve occurs only in a short-run and at NAIRU (natural
rate) such relationship does not exist. Looking at the Nigerian experience over the years,
from 1986 to 2014, the inflation dynamics has been somewhat of a random walk with a lot
of fluctuations.
FIG. 2.1 TRENDS IN EXCHANGE RATE AND CONSUMER PRICE MOVEMENTS
(INFLATION) IN NIGERIA: 1986 – 2014

12
0
50
100
150
200
250
300
350
86 88 90 92 94 96 98 00 02 04 06 08 10 12 14
CPI EXCHR
From figure 2.1, it can be seen that the period of the regime change from the fixed to flexible
exchange took effect in 1985 and from the period 1986 the Naira to US Dollar exchange rate
became market driven. The strength of the Naira became weakened by the high evel of
demand for import which was culminated by the orientation of the stage of production in the
economy. The primary productive stage means that there is no value addition in chain of
production in the economy. This implies that Nigeria was and still is a supplier of raw
materials to the rest of the world. Therefore the primary products are exported at a cheaper
price and finished products were imported at a higher cost and the net difference accrues
deficits to the economy.
From the period of 1986 to 1994 the US Dollar kept appreciating against the naira gradually
at a steady rate. It must be pointed out that over these periods; the US Dollar had a period
slower rate of appreciation from 1986 to 1991. From the period 1994 to 1998, the exchange
rate of the Naira to US Dollar was at stable state. All through during these periods, more
demand for US Dollar was being stabilized by an equal demand for Naira.

13
The domestic currency went for a sharp fall in value relative to the value of the US Dollar in
1999. It is suggestive at this premise to infer that prevailing political situation has far
reaching implication on the value of the Naira relative to the dollar in a flexible exchange
regime. This is so because the period of sky rocketing value of dollar exchange rate coincided
with the transition period from military to a civilian regime. Therefore, a point worthy to note
is that both political and exchange rate regimes showed phenomenal effect on the exchange
rate of Naira to a US Dollar. It is also note worthy that political event showed more
monumental effect on the exchange rate as it encapsulated the period with fastest rate of
appreciation of the US Dollar against the Naira in the entire history of the economy.
The rest of the period from year 2000 to the period of 2013 represents the periods of
instability in the exchange rate of the Naira. It can be seen that the value of dollar rise at a
steady rate from year 2000 to 2004 before it declined at steady pace for another period five
years that ended in 2009. Based on the performance of the rising prices of the crude oil
globally, it can be asserted that the surpluses from the earning of more US Dollars per barrel
provided the cushioning effect for the Naira to reverse the appreciation of dollar against the
naira over these periods. The adjustment in the demand for the dollar in the economy in the
period of 2009 coupled with the quantitative easing policy pursued in the American economy,
the dollar regained more impetus against the naira.
The inflation trend showed a steady price spikes which means that inflation dynamics has
been rising steadily from 1991 to 1994 and this rise was peaked around 1995, when it took a
nose dive in 1995. The trend showed an interesting pattern over the entire period. The first
pattern was marked by period of steady rise and this started from 1990 and settled in 1995.
The second pattern was characterized by a steeper but steady and moderate movement of
prices. By 1998, exchange rate rose sharply upward before it settles to a steady rise up to

14
around 2005. It declines a little around 2007 before it picked up in 2008 and continues to
rise steadily up to 2014. Within the period 1994 and 2014, inflation remains stable and rose
steadily without any sharp rise.
2.3 OVERVIEW OF EXCHANGE RATE POLICIES IN NIGERIA, 1986 - 2014
In 1986, the new exchange rate policy was adopted, however, exchange rate determination in
Nigeria has gone through many changes. Before the establishment of the Central Bank of
Nigeria in 1958 and the enactment of the Exchange Control Act of 1962, foreign exchange
was earned by private sector and held in balances abroad by commercial banks that acted as
agents for local exporters. The boom experienced in the 1970s made it necessary to manage
foreign exchange rate in order to avoid shortage. However, shortages in the late 1970s and
the early 1980‟s compelled the government to introduce some ad hoc measures to control
excessive demand for foreign exchange.
However, it was not until 1982 that a comprehensive exchange controls were applied. These
lists include the fixed exchange rate, the freely floating and the managed floating system
among others. In an attempt to achieve the goal of the new exchange rate policy, a transitory
dual exchange rate system (First and Second –Tier –SFEM) was adopted in September, 1986,
both metamorphosed into the Foreign Exchange Market (FEM) in 1987. Bureau de Change
was introduced in 1989 with a view to enlarging the scope of FEM. In 1994, there was a
policy reversal, occasioned by the non-relenting pressure on the foreign exchange market.
Further reforms such as the formal pegging of the Naira exchange rate, the centralization of
foreign exchange in the CBN, the restriction of Bureau de change to buy foreign exchange as
an agent of CBN etc. were all introduced in the foreign exchange market in 1994 as a result
of the volatility in exchange rates. Still, there was another policy reversal in 1995 to that of
“guided deregulation”. This necessitated the institution of the Autonomous Foreign Exchange
15
Market (AFEM) which later metamorphosed into a daily; two ways quote Inter-Bank Foreign
Exchange Market (IFEM) in 1999. The Dutch Auction System was reintroduced in 2002 as a
result of the intensification of the demand pressure in the foreign exchange market and the
persistence in the depletion of the country‟s external reserves. Finally, the Wholesales Dutch
Auction System (W-DAS) was introduced in February 20, 2006 which has been in existence
up to year 2014. The introduction of the WDAS was also to deepen the foreign exchange
market in order to evolve a realistic exchange rate of the Naira.
In summary, the numerous methods of exchange regimes practiced in Nigeria hitherto
include the extreme case of fixed exchange rate system, freely floating regime, adjustable
peg, crawling peg, target zones, managed float and so on. A fixed exchange rate regime
entails the pegging of the exchange rate of domestic currency to a unit of gold, a reference
currency or a basket of currencies with the primary objectives of ensuring a low rate of
inflation. This induced an overvaluation of Naira and was supported by exchange control
regulations that engendered significant distortions in the economy. The major drawback of
the fixed regimes, however is that it implies the loss of monetary policy discretion or
independence.
The floating exchange rate regime, on the other hand implies that the forces of demand and
supply will determine the exchange rate. This regime assumes the presence of an invisible
hand in the foreign exchange market and that the exchange rate adjusts automatically to clear
any deficit or surplus in the market. Again, the disadvantages of the freely floating regime
have been documented. These include persistence exchange rate volatility, high inflation and
transaction cost. Under the managed floating regimes the government intervenes in the
foreign exchange market in other to influence the exchange rate, but does not commit itself to
maintaining a certain fixed exchange rate or some narrow limit around it.
16
However, in spite of these different methods of determining exchange rate, a realistic
exchange rate has not been found for naira because the existing exchange rate systems had
continued to widen the gap between the official and the parallel markets and had failed to
prevent disequilibrium in the foreign exchange market. It has also failed to ensure stability of
the exchange rate as well as maintaining a favourable external reserve positions and
consequently ensure external balances. In addition, the various exchange rate systems in used
in Nigeria had also failed to eliminate or reduces the incidence of capital flight and the power
to correct the sky rocketing Naira exchange rate has been missing (Stephen, 2011).
Table 2.1: Scheme of Events in Exchange Rate Management in Nigeria S/N Year Event Remark
1959 – 1967
Fixed Parity Solely with the
British Pound Sterling
Suspended in 1972
1968 – 1972 Included the US dollar in
the parity exchange
Aftermath of the 1967 devaluation of the
pound and the emergence of a strong
dollar.
1973
Revert to fixed parity with
the British Pounds
Devaluation of the US dollar
1974 Parity to both pounds and
dollars
To minimize the effect of devaluation of
the individual currency
1978
Trade (import) - Weighted
basket of currency
approach.
Tied to seven currencies; British Pounds,
US Dollars, German Mark, French Franc,
Japanese Yen, Dutch Guilder, Swiss
Franc.
1985
Reference on the dollar
To prevent arbitrage prevalent in the
basket
of currencies
1986
Adoption of the second tier
foreign exchange market
Deregulation of the economy
1987
Merger of the first and
second tier markets
Merger of rates
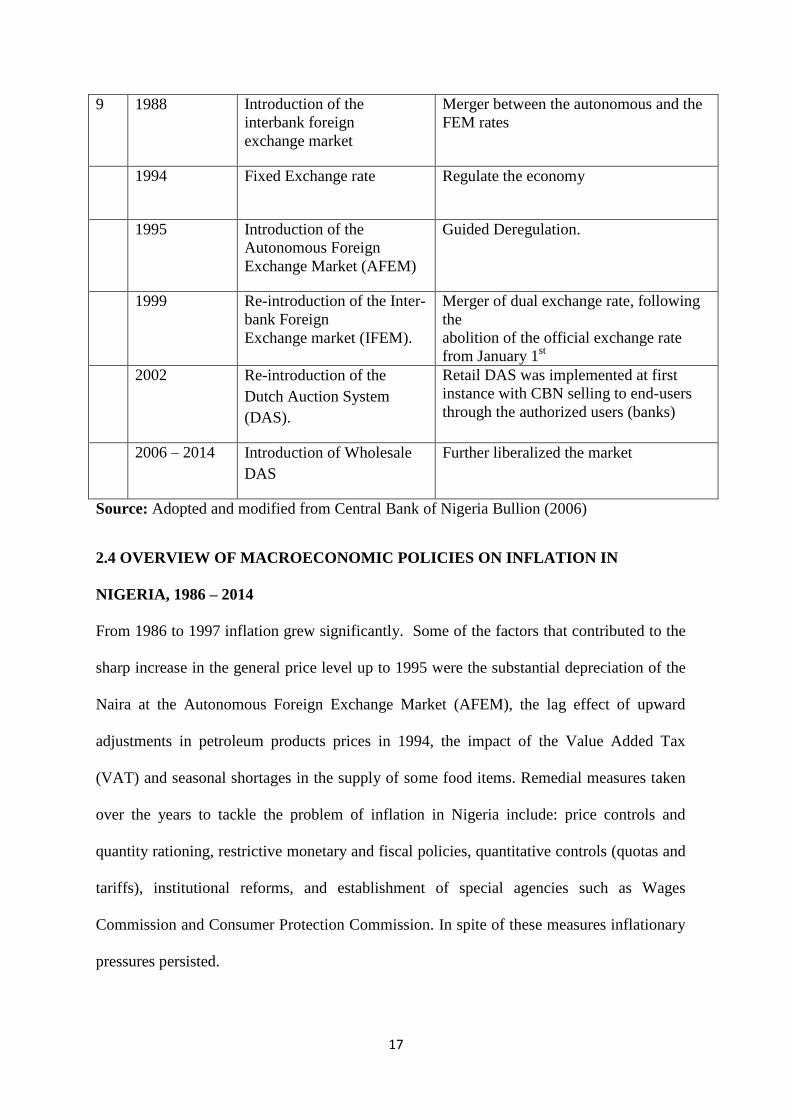
17
9 1988 Introduction of the
interbank foreign
exchange market
Merger between the autonomous and the
FEM rates
1994
Fixed Exchange rate Regulate the economy
1995
Introduction of the
Autonomous Foreign
Exchange Market (AFEM)
Guided Deregulation.
1999
Re-introduction of the Inter-
bank Foreign
Exchange market (IFEM).
Merger of dual exchange rate, following
the
abolition of the official exchange rate
from January 1st
2002
Re-introduction of the
Dutch Auction System
(DAS).
Retail DAS was implemented at first
instance with CBN selling to end-users
through the authorized users (banks)
2006 – 2014 Introduction of Wholesale
DAS
Further liberalized the market
Source: Adopted and modified from Central Bank of Nigeria Bullion (2006)
2.4 OVERVIEW OF MACROECONOMIC POLICIES ON INFLATION IN
NIGERIA, 1986 – 2014
From 1986 to 1997 inflation grew significantly. Some of the factors that contributed to the
sharp increase in the general price level up to 1995 were the substantial depreciation of the
Naira at the Autonomous Foreign Exchange Market (AFEM), the lag effect of upward
adjustments in petroleum products prices in 1994, the impact of the Value Added Tax
(VAT) and seasonal shortages in the supply of some food items. Remedial measures taken
over the years to tackle the problem of inflation in Nigeria include: price controls and
quantity rationing, restrictive monetary and fiscal policies, quantitative controls (quotas and
tariffs), institutional reforms, and establishment of special agencies such as Wages
Commission and Consumer Protection Commission. In spite of these measures inflationary
pressures persisted.
18
The implementation of the structural adjustment programme (SAP) in 1986 and de-regulation
of financial sector in Nigeria offered a lot of policy change in monetary policy development
in Nigeria. The deregulation brought an establishment of exchange rate markets in 1986. In
1987, there was a removal of interest rate, unification of foreign exchange markets and
liberalization of bank licensing.
The third high inflation episode started in the last quarter of 1987 and accelerated through
1988 to 1989. This episode is related to the fiscal expansion that accompanied the 1988
budget. In 1989, banks were permitted to pay interest on demand deposits, ban on credit
extension based on foreign exchange deposits. In 1990, a uniform accounting standards was
introduced for banks while a stabilization security to mop up excess liquidity was also
introduced. In 1991, inflation fell reaching one of its lowest points, i.e 13% (CBN, 2009).
There was an embargo on bank licensing while the administration of interest rate was
introduced. Central Bank was also empowered to regulate and supervise all financial
institutions in the economy. In 1992, privatization of government-owned banks commenced,
credit control was removed in 1993, and indirect monetary instruments were introduced while
in 1994, re-imposition of interest and exchange rate controls were made.
Central Bank of Nigeria has over the years used monetary targeting to achieve price stability.
Open Market Operations (OMO) was complemented by cash reserve ratio and repurchase
agreements. Others include: Cash Reserve Ratio and the adjustment of the Minimum
Rediscount to signal the direction dictated by monetary conditions. Interest Rate Draw Back
was introduced to reduce the cost of high borrowing by farmers in 2002. In 2006, broad
money grew by 30.6 percent compared with a target of 27.8 percent for the year and narrow
money grew by 20.3 percent. The Monetary authorities faced severe challenges maintaining
price stability, particularly due to the statutory allocations to the three tiers of government
19
and the monetization of the excess crude proceeds, the population census and pre-election
spending. Among the measures taken during this period focused on meeting the Policy
Support Instrument (PSI) Target. These included the introduction of the non-discountable
Special Nigerian Treasury Bills, gradual increase in interest rates at the open and discount
window by a 100 basis point in June, upward adjustment of the MRR mid-year which was
later replaced by the Monetary Policy Rate (MPR) introduced in December 2006 (Aliyu, et.
al., 2009). MPR has remained the policy rate of the CBN up to 2014 and beyond. The
monetary Policy Committee (MPC) meet quarterly to consider the appropriateness of the
policy rate or otherwise and consider the need to adjust it or otherwise among other
instruments.
Consequently, the focus of monetary policy during this period shifted significantly from
growth and developmental objectives to price stability. The operational framework for
indirect monetary policy management involved the use of market (indirect) instruments to
regulate the growth of major monetary aggregates. Under this framework, only the operating
variables, the monetary base or its components are targeted, while the market is left to
determine the interest rates and allocate credit. Essentially, the regime involves an
econometric exercise, which estimates the optimal monetary stock, which is deemed
consistent with the assumed targets for GDP growth, the inflation rate and external reserves.
Thereafter, market instruments are used to limit banks‟ reserve balances as well as their credit
creating capacity.
2.5 THEORETICAL LITERATURE
2.5.1 EXCHANGE RATE PASS-THROUGH THEORIES
Economists have traditionally believed that price differentials between countries are not
sustainable in the long run as market forces will equalise them and change exchange rates
based on the law of one price (purchasing power parity). Thus, a complete exchange rate

20
pass-through was assumed on the basis of the above theoretical standpoint. However,
empirical studies on exchange rate pass-through (ERPT) in both industrialised and emerging
economies have been found to be generally incomplete and vary across countries depending
on their size and openness (Sanusi, 2010). This led to the emergence of some theoretical
literatures in the last two decades explaining why ERPT is incomplete.
2.5.2 PURCHASING POWER PARITY
A theoretical discussion on the exchange rate pass-through effect should start with the
purchasing power parity (PPP) hypothesis. The PPP is the simple empirical proposition
which in its absolute form, states that, once converted to a common currency, national price
levels should be equal. According to the relative PPP assumptions, depreciation of one
currency relative to another match the difference in aggregate price inflation between two
countries concerned (Sarno and Taylor, 2002; Rogoff, 1996). The basic idea is that if goods
market arbitrage enforces broad parity in prices across a sufficient range of individual goods,
then there should also be a high correlation in aggregate price levels. The PPP is the
generalisation of the law of one price (LOOP) which postulates that the same good should
have the same price across countries if prices are expressed in terms of the same currency.
However, there is large number of studies on the ERPT effect conducted for developed
countries (e.g. Marazzi, Sheets and Vigfusson 2005; Campa and Goldberg 2004; Campa et al.
2005; Gagnon and Ihrig 2004; Hahn 2003; Ihrig et al. 2006 and Mcarthy 2000) and studies
conducted for developing countries (e.g. Ito and Sato 2006; Choudhri and Hakura 2006;
Frankel et al. 2005; Sheefeni, and Ocran, 2013; and Canetti and Greene 1992). The prevailing
consensus in all these studies is that movements in the exchange rate and prices do not go one
to one in the short to medium run.
2.5.3 EXPECTATION HYPOTHESIS

21
Expectation also plays an important role in both CPI inflation and nominal exchange rate
determination. The adaptive and rational expectation hypotheses have provided a theoretical
framework to analyse asymmetric ERPT. Firms are less likely to change prices in periods of
appreciation of the currency than they would want to in periods of depreciation (Maka, 2013).
Firms, in an attempt to maintain market share under imperfect market condition, may prefer
to reduce prices during periods of appreciation rather than increasing prices during periods of
depreciation. This is because a firm in an oligopolistic market may assume that its rival
would match its price if it initiates a price reduction instead of a price increase. These results
in a kink in the firms perceived demand curve (Sweezy, 1939 and Hall and Hitch, 1939).
2.5.4 TIME HORIZON
In a like manner, time horizon also affects the extent to which firms respond to changes in
demand same as it affects their response to exchange rate changes within the short or long
run. In the short run, firms face constraints on their production capacity and can only adjust
production in the long run. In such situations, firms consider their objective function of
maximising profit to react to changes in market conditions. Another factor that restricts
firms‟ ability to adjust production is trade regulations such as quotas and tariff which could
affect export or import. However, foreign exporting firms that are faced with quantity
adjustment rigidity in the short run may attempt to increase prices rather than reduce them as
the opportunity for increasing sales in the importing country becomes limited. This occurs in
cases of exchange rate depreciation and it may trigger a higher pass-through (Maka, 2013).
2.5.5 PRICING-TO-MARKET
Pricing-to-market (PTM), which refers to the pricing behaviour of firms exporting their
products to a destination market following an exchange rate change, is a closely related term
to ERPT. Particularly, PTM is defined as the percent change in prices denominated in the

22
exporter‟s currency due to a one percent change in the exchange rate. Thus, the greater the
degree of PTM, the lower will be the extent of ERPT. In the case where there is no PTM,
import prices will adjust by the same proportion as the change in the exchange rate and ERPT
will be complete. On the other hand, if there is full PTM (i.e if exporters adjust prices in their
currency by the same proportion as the exchange rate change but in the opposite direction)
ERPT to destination market prices will be zero (Berger, 2012). Generally, if exporters alter
the export prices in their own currency by a proportion smaller than the exchange rate
change, then pass-through is said to be incomplete (Gbosh and Rajan, 2006 in Berger, 2012).
2.6 EMPIRICAL LITERATURE
2.6.1 EXCHANGE RATE PASS-THROUGH: OTHER COUNTRIES EMPIRICAL
EVIDENCE
A number of empirical studies that were conducted to estimate exchange rate pass-through
found out that ERPT was incomplete. For instance, Goldberg and Knetter (1997) found that
the response of domestic prices to exchange rate movements is only partial in US. On the
average, only around 60 percent of exchange rate changes are passed on to import prices in
the US. However, the response of domestic US price to exchange rate fluctuations vary from
sector to sector and a considerable portion of the muted price responses seem to emanate
from changes in mark-ups on export prices. Also, Yang (1997) who studied the ERPT in US
manufacturing industries and its cross-sectional variation found that the pass-through was
incomplete and varies across industries. In the study, he found ERPT to be higher in
industries with higher degree of product differentiation and a lower elasticity of marginal

23
cost. The study also shows a negative relationship between import share and ERPT.
Similarly, Marazzi, Sheets and Vigfusson (2005) investigated ERPT to import price in US.
They found a sustained decline in ERPT to US import prices from 0.5 during the 1980s to
somewhere around 0.2 during the last decade (1993 – 2004).
McCarthy (2000) conducted a comprehensive study of ERPT on the aggregate level for a
number of industrialised countries which include the US, Germany, Japan, France, United
Kingdom, Belgium, Netherlands, Switzerland and Sweden. He estimated a VAR model using
import, producer and consumer price data from 1976 up until 1998. The findings of the study
show that exchange rates and import prices have a modest effect on domestic price inflation
over the post-Bretton Woods era. The pass-through is found to be stronger in countries with a
larger import share. The rate of pass-through is, furthermore, shown to be positively
correlated with the openness of the country and with the persistence of and exchange rate
change, and negatively correlate with the volatility of the exchange rate.
Campa and Goldberg (2002) using quarterly data from 1975 to 1999 of 25 OECD countries
discovered the prevalence of PCP and LCP in short run and long run pass-through elasticities
respectively. At the level of an aggregate import bundle, the evidence across countries is
strongly supportive of incomplete exchange rate pass-through in the short run. They also
made similar conclusions about the prevalence of partial pass-through into import prices at a
more disaggregated industry level. An (2006) also analysed the extent of ERPT at different
stages of distribution - import prices, producer and consumer prices – for eight major
industrialised countries: US, Japan, Canada, Italy, UK, Finland, Sweden and Spain. The study
found incomplete ERPT in many horizons, though complete pass-through is observed
occasionally. The study also revealed that the degree of pass-through declines along the

24
distribution chain. Thus, time needed for complete pass-through becomes longer along the
distribution chain.
Zorzi, Hahn and Sanchez (2007) estimated the magnitude of ERPT in emerging economies.
They found that ERPT is higher for import prices than for consumer prices implying that the
degree pass-through declines along the pricing chain. Their analysis also overturns partly the
conventional wisdom that ERPT is always considerably higher in „emerging‟ than in
„developed‟ economies. In particular, they found that in low inflation emerging economies;
pass-through to consumer prices is rather low just like advanced countries like US and Japan
which are included in their study. In addition, they tested the Taylors (2000) hypothesis by
simple correlation methods and found that positive and statistically significant connection
between inflation and ERPT.
Aziz (2009) estimated ERPT into import, export and domestic prices for Bangladesh over the
period 1973 to 2007. The estimated results from the full sample demonstrate that the
transmission of exchange rate changes is significant and „complete‟ to import and export
prices . However, ERPT to producer and consumer prices are found to be only unity „partial‟
implying that the degree of pass-through declines along the pricing chain. The recursive VAR
suggests that response of domestic prices to exchange raye devaluation is positive and larger
in the long run compared to the short run. The rolling regressions demonstrate that
sensitivities of export and import prices to the exchange rate have been consistently around
one until the early part of this decade.
Some of the empirical literatures of ERPT on African economies include Canetti and Greene
(1992) who show that apart from monetary expansion, exchange rate movements affect
consumer price inflation in sub-Saharan Africa (SSA). Particularly, they found that exchange

25
rates have a significant „Granger causal‟ impact on prices in Tanzania, Sierra Leone, and
Democratic Republic of Congo, which is linked to the high inflation episodes among these
economies. Choudhri and Hakura (2001) in their cross country study found an incomplete
pass-through for African countries during the period 1997 – 2000.
Frimpong and Adam (2010) analysed the effect of exchange rate changes on consumer prices
in Ghana using VAR models based on monthly data from 1990 – 2009. In their findings,
positive and insignificant long run relationship between domestic prices and exchange rate
exist; implying that long run exchange rate pass-through in Ghana is zero. However, in the
short run, they found low but significant pass-through. According to them, these findings
reflect the impact of increased openness and tighter monetary policy pursued by the central
bank of Ghana.
Sheefeni, and Ocran, (2013) employed the impulse response functions and variance
decompositions obtained from a structural vector autoregressive model to study the exchange
rate pass-through to domestic prices in Namibia. The results from the impulse response
functions show that there is a high and long-lasting effect from changes in exchange rates to
inflation in Namibia. The results from the forecast error variance decompositions also reflect
that changes in the price level evolve endogenously with changes in the exchange rate. The
results are in agreement with the findings of the impulse response functions regarding the
significant effect of the exchange rate variable on domestic prices (inflation). They concluded
that the results confirm an incomplete pass-through, indicating that the purchasing power
parity theory does not hold, with regard to the price level, in the context of Namibia.
Berga, (2012) investigated the degree of ERPT and its asymmetry to import and consumer
prices in Ethiopia between 1991/92 and 2010/11 using Structural Vector Autoregressive

26
(SVAR) and Co integrated Vector Autoregressive (CVAR). Based on SVAR analysis, the
work found that ERPT in Ethiopia during the period under review was moderate, significant
and persistent in the case of import price and low and short-lived in the case of consumer
prices. The co integration analysis shows that there was incomplete and zero ERPT pass-
through to import and consumer prices respectively in the long run.
Sanusi (2010) derived a Structural Vector Auto-regression (SVAR) model for the Ghanaian
economy from which he estimated the pass-through effects of exchange rate changes to
consumer prices. The model incorporates the special features of the Ghanaian economy,
especially its dependence on foreign aid and primary commodity exports for foreign
exchange earnings. His findings showed that the exchange rate pass-through to consumer
prices is incomplete, however, significantly large. He suggests that exchange rate
depreciation is a potentially important source of inflation in Ghana. Using variance
decomposition analyses, he submits that monetary expansion has been more important in
explaining Ghana‟s actual inflationary process than the exchange rate depreciation.
Maka (2013) examined asymmetric response of CPI inflation to changes in the nominal
exchange rate of Ghana using the Structural Vector Autoregressive Regression (SVAR)
model. Examining both symmetric and asymmetric exchange rate pass-through, the result
showed that a strong evidence of a response in CPI inflation to changes in exchange rate
exist. The response is not immediate but it featured prominently three months into the future
and dissipates thereafter. He suggests that the pass-through to non-food prices is complete but
incomplete in the case of food prices. He found that the exchange rate pass-through was
asymmetric with depreciation having a positive effect on CPI inflation as expected within the
first three months. Appreciation on the other hand has little impact on CPI inflation and has
no statistical significance. It is evident that, the size of the changes in exchange rate does not

27
affect pass-through. He suggests examining the role of inflation environment in pass-through
and concluded that, in periods of increasing inflation, CPI inflation responds strongly to
output gap and exchange rate than in periods of decreasing inflation. The variation in CPI
inflation explained by changes in exchange rate is very low due to increasing productivity
which absorbs the impact.
2.6.2 EXCHANGE RATE PASS-THROUGH: NIGERIAN EMPIRICAL EVIDENCE
Empirical studies on exchange rate pass-through in Nigeria have recently received some
boost using different models with varying outcomes. For instance, Aliyu et. Al. (2009) used
the Vector Error Correction Model (VECM) to provide an evidence of exchange rate pass-
through in Nigeria. The result found that the exchange rate pass-through to domestic prices is
low, however, they reported that a slightly higher and rapid pass through exist in the import
prices than in the consumer prices. The result showed that a one percent shock to exchange
rate, results in 14.3 and -10.5 percent pass-through effects to import prices and consumer
prices four quarters ahead, respectively. According to them, exchange rate pass-through in
Nigeria declines along the price chain, and partly overturns the conventional wisdom in the
literature that ERPT is always considerably higher in developing and emerging economies
than in developed economies. They, however, were of the view that the exchange rate pass-
through effect is expected to increase with greater degree of openness of the economy in the
future, but, the fact that it was found to be incomplete implies that prices react less
proportionately to exchange rate shock in Nigeria.
Adekunle (2010) adopted the correlation and Granger causality techniques to investigate the
significance of the relationship between exchange rate and domestic inflation (proxy by
Consumer Price Index) in Nigeria. The findings showed that there is a positive and
significant relationship between exchange rate and CPI. The coefficient between autonomous

28
exchange rates and the consumer price index (CPI) is less significant than official rate, while
the import ratio in the economy shows a near two-way balance causality with the consumer
price index. The more significant one in causality is that import ratio granger causes CPI. The
paper recommends a more liberalized foreign exchange market to reduce the impact of the
parallel market and increase in domestic production of consumables to reduce importation of
domestically substitutable goods in the economy.
Adedayo (2012) employed a distributed lag model that incorporates the first order lag of
exchange rate inclusive of current output level to study the exchange rate pass through in
Nigeria. The approach yielded two-variants of the adapted model and the classical ordinary
least square method was used for estimation. The empirical outcomes indicated that it is only
previous exchange rate of naira vis-a-vis U.S dollar that pass-through interest rate in Nigeria
between 1970 and 2010, while neither current exchange rate of naira vis-a-vis U.S dollar nor
previous exchange rate of naira vis-a-vis U.S dollar pass-through inflation rate in Nigeria
between 1970 and 2010.
Oriavwote and Omojimite (2012) investigated ERPT to domestic prices in Nigeria using
VEC model using data from 1970 to 2009. The result showed a long run relationship among
the variables. It found out that exchange rate volatility induced domestic inflation in Nigeria.
However, same was not true for interest rate. Thus, they recommended that exchange rate
volatility should be given consideration when making policies on curbing inflation.
Ogundipe, (2013) also applied the VEC model in studying the pass-through of foreign price
changes on Nigerian domestic inflation. The study found a substantially large exchange rate
pass-through to inflation in Nigeria. They suggested that the exchange rate has been more
important in explaining Nigeria‟s rising inflation phenomenon than the actual money supply.

29
Mohammed, (2013) used SVAR to study the extent of ERPT to domestic consumer price
inflation in Nigeria between 1986Q1 and 2013Q1. He found out that pass-through in Nigeria
is incomplete and relatively low. Moreover, he discovered that the speed of adjustment to
structural shocks, such as the exchange rate, output, monetary policy rate and money supply
shocks were high and the effects of such shocks were also highly volatile.
Zubair, Okorie, & Sanusi, (2013) used SVAR to estimate the dynamic ERPT to consumer
prices in Nigeria using quarterly data for the period between 1986 and 2010. Their findings
reveal that during the period under review, ERPT in Nigeria was incomplete, low and fairly
slow. It takes about eight quarters for the full impact of the pass-through to be passed to the
economy. This is in spite of the significant size of imports on Nigeria‟s consumption basket
which suggests, in their view, that importers practice the pricing-to-market strategy in
Nigerian market. Given this outcome, they argued that Nigerian monetary authorities may
consider the potential to float and the fear of adopting the floating exchange rate may be
unfounded for an effective and realistic monetary policy.
Out of the seven available works reviewed on ERPT in Nigeria, three of them used VEC
model. The works of Ogundipe, (2013), Oriavwote and Omojimite (2012) covered time
period from 1970 to 2008 and 1970 to 2009 respectively while Aliyu et. al. (2009) covered
time period between 1986 and 2007. While the latter found low ERPT to domestic prices and
slightly higher in the import prices (Aliyu et. al., 2009), the former discovered substantially
large exchange rate pass-through to inflation and that exchange rate volatility induces
inflation in Nigeria. The seemingly contradictory outcomes from the three works above may
be attributed to the difference in time frame covered by the works. Events and dynamism of
economic activities that took place between 1970 and 1986 could be cause of the variation in
the outcomes.

30
The other four studies used variety of techniques and covered different time frames.
Adedayo, (2012) used Distributed Lag Model and found zero pass-through in Nigeria
between 1970 and 2010. However, Adekunle (2010), used Granger Causality and Correlation
to estimate the ERPT between 1986 and 2007, and he found out that the ERPT was positive
and significant relationship exist between exchange rate and CPI. On the other hand, the
studies of Mohammed, (2013) and Zubair, et. al. (2013) where both used SVAR model
between 1986 and 2013 and 1986 to 2010 respectively found a consistent result in Nigeria. In
this case, methodological differences as well as choice of variables could be an important
factor in explaining these differences. However, none of the previous studies on Nigeria
considered nonlinearity and asymmetry.
2.7 GAPS IN THE LITERATURE
From the various studies reviewed on ERPT on the Nigerian economy, it is clear that they
rely heavily on linear models. However, some studies conducted on other economies shows
that ERPT behaviour could be nonlinear. This is a gap this study set out to bridge.
Most of the studies (e.g. Adekunle, 2010; Oriavwote and Omojimite, 2012; Adedayo, 2012;
Ogundipe, 2013; Mohammed, 2013) did not consider the first stage in the pass-through
which is to import prices but chose to jump to consumer prices, thus missing an important
part of the ERPT behaviour. This is another gap this study set out to bridge.
Again, the previous studies reviewed did not consider the possibility of the presence of
Asymmetry in the behaviour of ERPT in Nigeria. This is another gap the study set out to
bridge.

31
CHAPTER THREE
METHODOLOGY
3.1 CONCEPTUAL FRAMEWORK FOR METHODOLOGY
Exchange rate is a key price variable in an economy and performs dual role of maintaining
international competitiveness, and serving as nominal anchor for domestic prices. It is
therefore, defined as the price of one currency vis-à-vis another and is the number of units of
a currency required to buy another currency (Mordi, 2006). Theoretically, it is believed that,
under a floating exchange regime, exchange rate of a currency depends on the balance of
payment (BOP) of a country. A favourable balance of payments raises the value of the
exchange rate (appreciation) and vice-versa (Dwivedi, 2007).
If a country‟s productive capacity is low, its import will be high thereby exposing it to the
influence of foreign prices. The prices of imported goods are no doubt affected by the prices
of the exporting country in varying proportion. Most developing countries like Nigeria are
characterised with high dependence on import of consumer products and industrial inputs. In
the case of consumer products, the prices consumers will pay for the products in the domestic

32
market depend on the inflation status of the exporting country and the ERPT of the importing
country and the effect is direct. Similarly, the prices of the imported industrial inputs will also
form part of the prices of the domestic industrial outputs (consumer products). Thus, the
higher the proportion of import in the basket of consumer products of a country, the higher
the chances of the country to be exposed to imported inflation.
The need to understand the exchange rate pass-through in Nigeria is underpinned by the fact
that Nigerian economy is external sector driven such that shocks from global commodity
markets have serious implications on the economy (Aliyu, et al, 2009). The crude oil price
shock that forced the CBN to devalue the naira in the last quarter of 2014 a classical example.
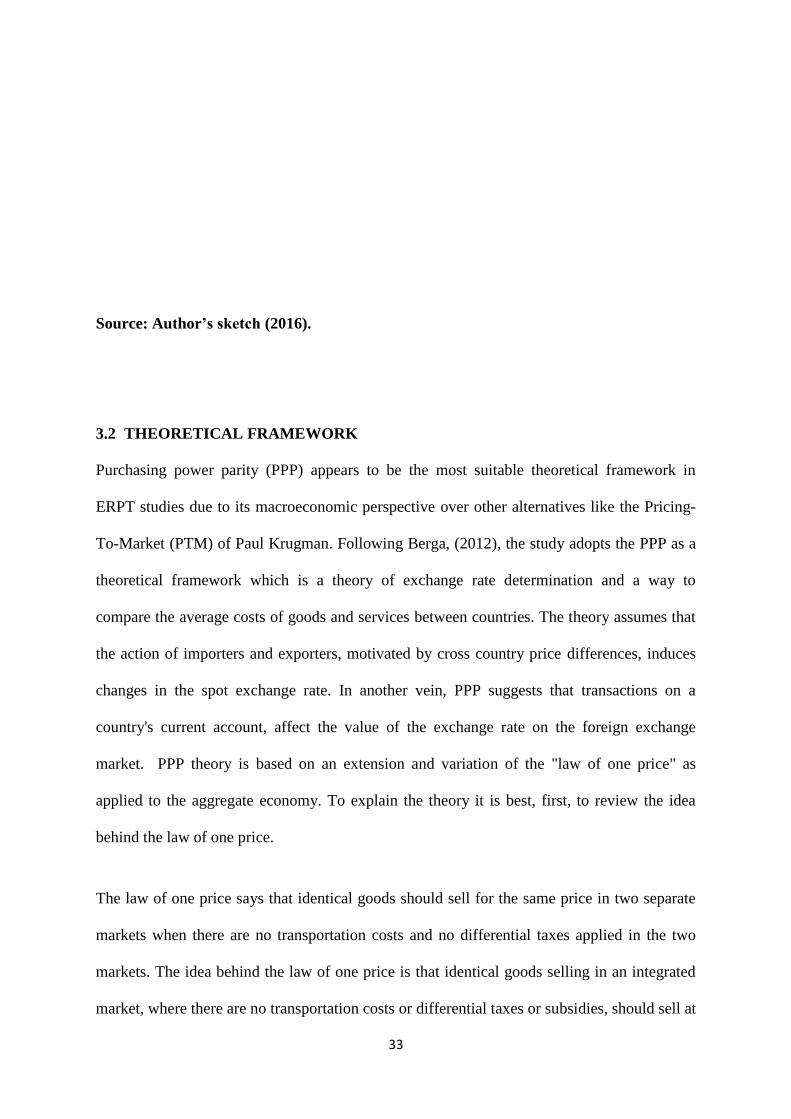
FIG. 3.1: CONCEPTUAL FRAMEWORK OF EXCHANGE RATE PASS-THROUGH
TO IMPORT AND CONSUMER PRICES
External/Out-look Elasticity of Import
Foreign Price
Shocks
Imported
Commodities Prices
Degree of
Transmission
Low
Degree of
Transmission
High
Firm House Hold Firms House Hold
Exchange Rate Inelastic
Intermediate good Intermediate good Final good Final good
Raw Raw
Exch
ange
Rate E
lastic
Exch
ange
rate
Speed
Hig
h/L
ow
Speed
Hig
h/L
ow
Domestic Economy
33
Source: Author’s sketch (2016).
3.2 THEORETICAL FRAMEWORK
Purchasing power parity (PPP) appears to be the most suitable theoretical framework in
ERPT studies due to its macroeconomic perspective over other alternatives like the Pricing-
To-Market (PTM) of Paul Krugman. Following Berga, (2012), the study adopts the PPP as a
theoretical framework which is a theory of exchange rate determination and a way to
compare the average costs of goods and services between countries. The theory assumes that
the action of importers and exporters, motivated by cross country price differences, induces
changes in the spot exchange rate. In another vein, PPP suggests that transactions on a
country's current account, affect the value of the exchange rate on the foreign exchange
market. PPP theory is based on an extension and variation of the "law of one price" as
applied to the aggregate economy. To explain the theory it is best, first, to review the idea
behind the law of one price.
The law of one price says that identical goods should sell for the same price in two separate
markets when there are no transportation costs and no differential taxes applied in the two
markets. The idea behind the law of one price is that identical goods selling in an integrated
market, where there are no transportation costs or differential taxes or subsidies, should sell at

34
identical prices. If different prices prevailed, then there would be profit-making opportunities
by buying the good in the low price market and reselling it in the high price market. If
entrepreneurs acted in this way, then the prices would converge to equality.
Of course, for many reasons, the law of one price does not hold even between markets within
a country. The price of items will also be different in other countries when converted at
current exchange rates. The simple reason for the discrepancies is that there are costs to
transport goods between locations, there are different taxes applied in different states and
different countries, non-tradable input prices may vary, and people do not have perfect
information about the prices of goods in all markets at all times. The purchasing power parity
theory is really just the law of one price applied in the aggregate, but, with a slight twist
added. If it makes sense from the law of one price that identical goods should sell for
identical prices in different markets, then the law ought to hold for all identical goods sold in
both markets.
As proposed by Berga, (2012), the starting point to study the link between exchange rate and
domestic prices is the law of one price (LOP) which states that the price of identical
commodities sold in different market should be the same when it is converted into the same
currency (Pilbeam, 1998). The LOP is mathematically expressed as follows:
Pt= Et Pt*........................................................ (3.1)
Where Pt is the domestic price index, Et is the nominal exchange rate (defined as domestic
currency per unit of foreign), and Pt* represents foreign prices. (Relative) purchasing power
parity tests use price indices across countries to test whether this relationship holds. If we
consider the LOP in logarithmic form we will have the following:

35
pt = γet + λpt*.................................................... (3.2)
Where pt, pt*and et are the natural logarithm of import price, export price and nominal
exchange rate respectively. The LOP implies that γ = λ =1 in which case changes in the
exchange rate completely pass through to the domestic price of the traded good. This simple
expression forms the basis of analyzing the long run pattern of ERPT.
Based on this fundamental relationship various researchers developed different more
advanced models to analyze the degree of pass-through. According to Goldberg and Knetter
(1997) and Campa and Goldberg (2002) ERPT studies consider the extent to which exchange
rate movements are passed-through into traded goods prices, or absorbed in producer profit
margins or mark-ups. Often these studies look at indices of industrial concentration or market
power to explain pass-through differences or PTM. Based on this, their analysis starts from
the following basic model:
Pt = γet + εt .................................................... (3.3)
Where, εt is an error term and γ is the ERPT coefficient. The extent of pass-through
coefficient is based on the value of γ. A one to one response of import prices to exchange rate
is known as a complete ERPT (γ=1) while the case where pass - through coefficient is less
than 1 (γ <1) is known as partial or incomplete ERPT
3.3 MODEL SPECIFICATION
From the above, we proceed with construction of the model which is rooted from the
functional relationship embedded in the Purchasing Power Parity (PPP) framework. The
suggestion that short-run price adjustment in markets is influenced by changes in the variable

36
cost and that of the long-run adjustment to both variable and fixed cost is assumed in the
import price dynamics.
(3.4)
The above Eq.3.4 shows that import price ( ) is a function of change in nominal
exchange rate ( ), consumer price index (CPI) denoted by ( ) and aggregate output change
( ). Keeping other factors affecting import prices constant, for the purpose of identifying the
exchange rate pass-through to import price, the expression is captured as:
(3.5)
Where i = (1, 2 ...n). Eq. (3.5) is the functional relationship denoted by between the log of
import prices ( ) and the log of nominal exchange rates ( t-i). It says that the prices
of imports in the economy are determined by the lag value of nominal exchange rates.
Appreciation in exchange rates may reduce the import prices while depreciations may lead to
increase in the imports prices. Therefore the model is expressed as follows:
(3.6)
Where is the log of import prices, t is the log of nominal exchange rate, lnπt is the
log of inflation, lnyt is the log of aggregate output and ԑt is the error term. Having
internalized the lag dependent variable in Eq. (3.6), the equation becomes a Self-Exciting
threshold model (SETAR). Using the indicator function 1(.) which is a dummy variable, we
have the expression as:
(3.7)

37
Where is the threshold variable, ln t is the nominal exchange rate, while denotes
import price variable and represents the threshold values, is a variable that coefficient
could change across regime, and a delay variable “. ”. In a condense back-shift operator eq.
(3.4) is same as:
(3.8)
Where = The nonlinear coefficients
, , , from eq.(3.8) is now condensed as which can be estimated as:
(3.9)
The result of the estimates of eq. (3.6) is presented in Appendix II. We however started by
estimating the optimal number of regimes using a model search section criteria.
On the other hand, inflation is a function of many variables among which are:
(3.10)
Where consumer price index (CPI) denoted by ( ), while denotes import price
variable and denotes change in nominal exchange rate, and aggregate output change ( ).
Keeping other factors affecting import prices constant, for the purpose of identifying the
exchange rate pass-through from import prices to consumer prices, the expression is captured
as:
(3.11)

38
Where i = (1, 2 ...n). Eq. (3.11) is the functional relationship between consumer prices (CPI)
and the import prices as is the case in the above. Therefore the model is also expressed as:
(3.12)
Where lnπt is the log of CPI, lnet is the log of nominal exchange rate, lnptimp
is the log of
import prices, yt is the log of aggregate output and ut is the error term. Having internalized
the lag dependent variable in Eq. (3.12), hence the equation becomes a Self-Exciting
threshold Autoregressive model (SETAR) with a delay “d”, we have the expression as:
(3.13)
Where is the threshold variable, is the import prices, is the variable that
coefficient could change across regime and represents the threshold values. In a condense
back-shift operator eq. 3.13 is same as:
(3.14)
Where = .The nonlinear
coefficients , , , , , , from eq.(3.10) is now condensed as which
can be estimated as:
(3.15)
The result of the estimates of eq. (3.15) is presented in Appendix II.

39
3.4 DATA SET AND SOURCES
The important objective of this study is to identify how the transmission of persistent
fluctuations in the exchange rate into import and consumer prices takes place. These three
variables are the core of our empirical analysis. It is thus assumed that exchange rate shocks
are initially passed into import prices and then to producer prices which will finally lead to a
reaction in consumer prices. The model includes nominal GDP as a measure of the domestic
economic activity (demand shock). The choice of nominal GDP is to enable observation of
detailed fluctuations in the aggregate output.
Similarly, monthly import data is included in the model to determine the magnitude and
effect of the exchange rate pass-through into import prices; while monthly data of consumer
price index (CPI) is equally included in the model to measure the magnitude and effect of
exchange rate pass-through on consumer prices. In addition, the study also used the Monthly
Nominal Effective Exchange Rate of the Naira to measure the exchange rate fluctuations. It is
considered the right choice for the study especially when the total effect of the exchange rate
changes is measured in a country with diversified trading partners whose distinct currencies
may vary differently (Ito and Sato, 2006).
The data used in this study is basically from secondary sources. We use monthly time series
data from the Central Bank of Nigeria statistical bulletin and Annual Reports (various issues).
These monthly observations cover time period extending from January, 1986 to December,
2014. This time period is strategically selected because it excludes periods of rigidities in
exchange rate determination following the commencement of floating exchange rate regime
in the country that was ushered in by the Structural Adjustment Programme (SAP, 1986).
3.5 PRE-ESTIMATION TEST

40
There were two preliminary test conducted prior to the estimation of the model. The first test
is the stationary test which allows checking for the presence of unit root. The study adopts
two variant test of the stationarity test. The Augmented Dickey Fuller (ADF) and Philip
Perron test (PP). The use of two variant stationarity tests was necessary in order to provide a
confirmatory test to see if there is a presence of outliers that may not be captured using a
single particular test. The second preliminary test is the model selection criteria test which
will be important in determining number of regimes in the period under review and the
threshold variable using the Sum of Square Residual (SSR). T
3.6 METHOD OF ESTIMATION
In estimating the specified SETAR model, this study uses the threshold estimation technique
in line with Krager and Kugler, (1993). Chappel, Padmore, Mistry and Ellis (1998). Balke
and Wohar, ( 1998), Posedel and Tica, (2007), Ismail and Isah, (2006) and Bello, Maji and
Sanusi (forthcoming). The justification for the use of the threshold estimation is predicated
upon a number of factors. One of which is centred on the broad objective of the study which
is a short-run dynamics in prices as against long-run equilibrium. Since the study precludes a
long-run study which the threshold estimation is anchored on, strength of the threshold
estimation is the inherent in the ability of a SETAR model to provide an important attribute
that allows for having both estimates of the Autoregressive (AR) linear component and the
nonlinear component which is responsible in switching the dependent variable (domestic
inflation) from one regime to the other. The technique also provides a superior feature in
telling the duration of time periods that exist between any two successive regimes.
As a non-linear time series model, we have chosen the self-exciting threshold autoregressive
model proposed by Tong and Lim (1980) and Tong (1983) because this type of model is
capable of producing dynamic asymmetric processes. Obviously in order to estimate the
41
model it is necessary to choose a threshold. Enders (2004) and Chan (1993) offer quite
intuitive three step methodology for threshold selection process:
i. First step is to sort the threshold variable from lowest to the highest value. In our sample
threshold variable is a change in nominal exchange.
ii. Second step is to estimate a TAR model using successive values of nominal exchange rate
changes as thresholds. After estimation sum of squared residuals are saved for every
observation (threshold) of nominal exchange rate change.
iii. Third step is to create a graph of successive values of sum of squared residuals. If there is
a single threshold, there should be a single trough in the graph.
With respect to model selection criteria, according to Enders (2004) the model with lowest
sum of squared residuals and according to Shen and Hakes (1995) the model with highest t-
ratio is the model that represents nonlinear data generating process most accurately (Posedel
and Tica, 2007). Furthermore the model was afterwards subjected to stability test to check
whether the estimated model is stable or not. The inference for the stability was drawn on the
basis of cusum and cusum square test.
3.7 APRIORI EXPECTATION
From the above models, the target coefficients from equation 16 include, , , , and
where denotes the intercept of the function, , , ɑ 3, ɑ 4 are the coefficients of the
variables affecting or determining the dependent variable (in this case import prices). These
coefficients explain the magnitude of the respective variables effect on the import prices, in
the case of equation 16. Of greater relevance is which is the coefficient of the nominal
exchange ( ). The value of determines the magnitude of the pass-through from
exchange rate to import prices in equation 16. The greater the coefficient, normally expressed

42
in percentage, the higher the pass-through and vice versa. , denotes the threshold variable
which shows the point at which a regime change takes place from one regime to another
while denotes the speed of the transition from one regime to another. In other words, it
shows how long it takes to pass-through from exchange rate to import prices based on eq. 16.
Similarly, the target coefficients from equation 22 include, , , , , , , and
where , denotes the intercept of the function, , , ,and are the coefficients of
the variables affecting or determining the dependent variable (in this case consumer prices).
These coefficients explain the magnitude of the respective variables‟ effect on the consumer
prices, in the case of equation 22. Of more importance is which is the coefficient of the
import prices ( ). The value of determines the magnitude of the pass-through from
import prices to consumer prices in the case of equation 22. The greater the coefficient,
normally expressed in percentage, the higher the pass-through and vice versa. , denotes the
threshold variable which shows the point at which a regime change takes place from one
regime to another while denotes the speed of the transition from one regime to another. In
other words, it shows how long it takes to pass-through from import prices to consumer
prices.
43
CHAPTER FOUR
PRESENTATION OF RESULTS, ANALYSES AND DISCUSSION
This chapter presents and discusses the results of the empirical analyses based on the
econometric frameworks used in the study. First, the results of the various preliminary tests
that should be undertaken before and after the estimation of the models are presented.
4.1 TESTS FOR STATIONARITY
In analysing time series data, testing for stationarity is a vital element and condition. This is
so because results obtained by using non-stationary time series may be spurious whereby they
may indicate a relationship between variables which does not exist. In order to obtain
consistent and reliable results, non-stationary data have to be transformed into stationary data.
Non-stationary process usually has a variable variance and a mean that does not remain near,
or returns to a long-run mean over time, the stationary process, on the other hand, reverts
around a constant long term mean and has a constant variance independent of time.
It is advisable to plot the time series under study as the first step in the analysis of time series.
Such a plot gives an initial clue about the likely nature of the time series. The graphs are in
appendix III. From the graphs, the first impression that we get is that at levels, almost all of
the time series shown in the figures appeared trending upward, but with a mild fluctuation in
the case of CPI and nominal GDP. There is a bit more upswings in the case of Exchange rate
and imports. This suggests that the mean of all the variables might be changing which
perhaps implies that they are not stationary at levels. Such preliminary intuitive analysis is an
important starting point to begin with before formal tests of stationarity.
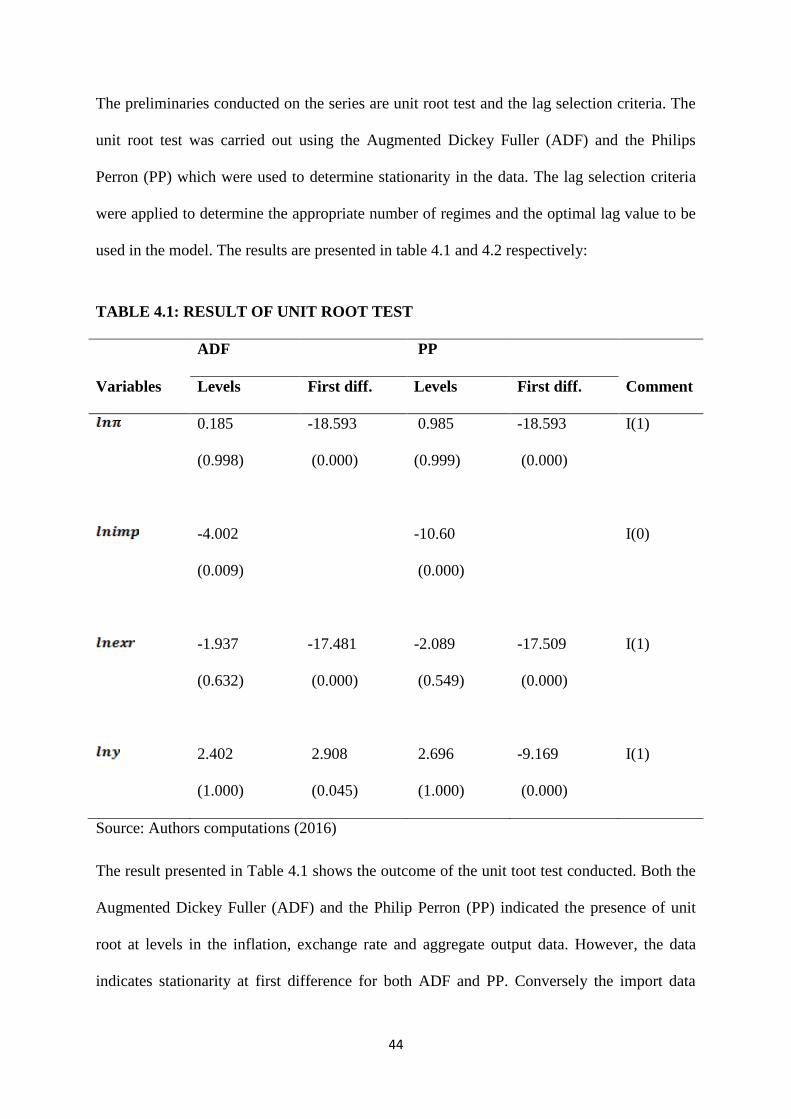
44
The preliminaries conducted on the series are unit root test and the lag selection criteria. The
unit root test was carried out using the Augmented Dickey Fuller (ADF) and the Philips
Perron (PP) which were used to determine stationarity in the data. The lag selection criteria
were applied to determine the appropriate number of regimes and the optimal lag value to be
used in the model. The results are presented in table 4.1 and 4.2 respectively:
TABLE 4.1: RESULT OF UNIT ROOT TEST
ADF PP
Variables Levels First diff. Levels First diff. Comment
0.185
(0.998)
-18.593
(0.000)
0.985
(0.999)
-18.593
(0.000)
I(1)
-4.002
(0.009)
-10.60
(0.000)
I(0)
-1.937
(0.632)
-17.481
(0.000)
-2.089
(0.549)
-17.509
(0.000)
I(1)
2.402
(1.000)
2.908
(0.045)
2.696
(1.000)
-9.169
(0.000)
I(1)
Source: Authors computations (2016)
The result presented in Table 4.1 shows the outcome of the unit toot test conducted. Both the
Augmented Dickey Fuller (ADF) and the Philip Perron (PP) indicated the presence of unit
root at levels in the inflation, exchange rate and aggregate output data. However, the data
indicates stationarity at first difference for both ADF and PP. Conversely the import data

45
revealed stationarity at levels. This result suggests that there is no significant variation in the
stationarity result in the series using the two different methods.
Following Enders (2004) and Chan (1993) intuitive three step methodology for threshold
selection process as expressed in Chapter Three, Table 4.2, presents the determination of the
optimal lag length and the corresponding regimes that fit into the model. From the result
shown in Table 4.2, it can be seen that the lag length of five (5) periods is the optimal lag as
suggested by the minimum Sum of Squared Residuals (SSR) of the model which was found
to be 3.003.
Table 4.2: Result of Model Selection Criteria
Threshold
Variable SSR Regimes
(-5) 3.003658 4
(-4) 3.055398 4
(-3) 3.292515 4
(-6) 3.336788 4
(-2) 3.345040 4
Source: Author‟s computations (2016)
The results of the model selection also suggest the presence of four (4) regimes in the series
which covers from 1986 to 2014. The number of regimes used is followed as suggested from
the selection criteria.
4.2: ANALYSES OF THE RESULTS
The result of the sequential determined non linear thresholds is as presented in Tables 4.3 and
4.4. From table 4.4, it can be observed that four (4) threshold values were estimated. The first
46
threshold value of 2.33% represents the lowest threshold value estimate. This value
represents the inflationary threshold in the economy and by extension it signifies that
inflationary trend prevails linearly over 81 month without switching to a new regime until it
reaches the threshold value at 2.33%. The threshold at this value means general price rise
must be kept at less than the threshold of 2.33% and any further increase in the general price
level which exceed or equals this threshold will trigger a regime change in inflationary trend.
Furthermore the result shows that the monetary policy regime that maintains price stability
below the threshold value of 2.33% must be inclined to managing the stability of the
exchange rate as well as the output rise that could emanate from the accommodative posture
of the CBN. This finding supports that of Sanusi and Bello (2015) and it follows from the
result which indicates that both coefficient of exchange rate and output growth are
statistically significant at 1%, 5% and 10% level. However, the coefficient of import is not
statistically significant which suggest that price shocks that can trigger a regime change at the
estimated threshold stems from either of exchange rate shock or output accommodation by
the monetary authority. Consequently because the coefficient of the import is not significant,
it means that the monetary authority should not bother about import to trigger a regime
change at the estimated threshold.
The result of the second price regime exists between the threshold value of 2.33% and 3.23%.
Also the result shows that inflation switches into this regime when inflation equals 2.33 but
less than 3.23% and the length of the regime spans for 48 months. At this regime all the
variables appear to be statistically significant at 1%, 5% and 10%. This implies that the
threshold variable (inflation) can be triggered to a new regime by any of import, output
and/or exchange rate. However, fall in importation adds to deficit supply in the economy and
by extension inflate the demand side inflation for imported goods. This conforms to the

47
notion that higher demand for imported product can spell a more pressure on the domestic
prices.
Within the span of fifty three (53) months, a new price regime was established between the
threshold value of 3.32% and 3.59%. This regime is triggered when inflation values equal or
is greater than 3.23% but remains below 3.56% threshold value. This appears to be the
regime with the shortest threshold difference (between the lower and the upper threshold).
This short threshold difference implies that inflation dynamics will inadvertently be less
restrictive in switching to another regime and therefore monetary authorities are more faced
with faster price changes as a result of inflationary shock that emanate from imported
commodities and expansionary policy that accommodates output rise. When such output
accommodation is validated by the CBN, this inflationary threshold will be short lived. The
last threshold value of 3.56% happens to be the most stable regime that lasted for about 137
months (about 12 years) without another regime change.
From the results in Appendices I and II, the various test statistics show that the models are
robust and significant. The results reported 99% R-squared and Adjusted R-squared in
Appendix I and 96% R-squared and Adjusted R-squared in Appendix II respectively. The F-
statistics, AIC, Schwarz criterion, and Hannan-Quinn criteria were all significant in the two
models as shown in the two Appendices I and II.
4.3: EXCHANGE RATE PASS-THROUGH TO IMPORTS PRICES
The result of the sequential determined non linear thresholds showing ERPT to imports prices
is as presented in Table 4.3:
TABLE 4.3: RESULT OF NONLINEAR THRESHOLD REGRESSION

48
Variable Coefficient Std. Error t-Statistic Prob.
(-5) < 9.632836 -- 105 obs
t 1.045416 0.125529 8.328073 0.0000
yt 0.298400 0.104312 2.860654 0.0045
9.632836 <= (-5) < 10.98592 -- 72 obs
t -0.096643 0.070581 -1.369260 0.1719
yt 1.019640 0.055558 18.35277 0.0000
10.98592 <= (-5) < 12.35084 -- 70 obs
t 0.020075 0.190295 0.105493 0.9161
yt 1.006641 0.131532 7.653210 0.0000
12.35084 <= (-5) -- 72 obs
t 1.484706 0.320738 4.629030 0.0000
yt 0.115342 0.202560 0.569419 0.5695
Non-Threshold Variables
ɑ 0 4.788829 0.173205 27.64827 0.0000
Source: Author‟s Computation (2016)
From Table 4.3, it can be observed that four (4) threshold values were estimated. The first
threshold value of 9.63% represents the lowest threshold value estimate. This value
represents the threshold from the exchange rate passé-through to import prices linearly over
105 months before switching to a new regime at the threshold value of 10.99%. It follows
from the result which indicates that both coefficients of exchange rate and output growth are
statistically significant at 1%, 5% and 10% level. However, price shocks that can trigger a
regime change at the estimated threshold stems from either of exchange rate shock or output
accommodation by the monetary policy. There is a high exchange rate pass-through to import
prices of about 104% of the exchange rate variation.
The result of the second import price regime exists between the threshold value of 9.63% and
10.99%. Also, the result shows that exchange rate pass-through switches into this regime
when import prices equals 9.63% but less than 10.99% and the length of the regime spans for

49
72 months. At this regime the only variable that appears to be statistically significant at 1%,
5% and 10% is output. This implies that the threshold variable (import price) can be triggered
to a new regime by only increase in output demand. The implication is that exchange rate
passes through to import prices is zero in this regime. The price shocks that can trigger a
regime change at the estimated threshold can only come from output demand increase.
Within the span of seventy two (72) months, a new price regime (third) was established
between the threshold value of 10.99% and 12.35%. This regime is triggered by import prices
equals or greater than 10.99% but remains below 12.35% threshold value. The regime lasted
for 70 months before reaching to the next threshold. At this regime also, the only variable that
appears to be statistically significant at 1%, 5% and 10% is output. Exchange rate pass-
through to imports prices is also zero at this regime. The price shocks that can trigger a
regime change at the estimated threshold can only come from output demand increase.
Similarly, after the 70 months of the third regime, the fourth regime sets in when imports
price rose to a threshold of 12.5%. In this regime, which lasted about 72 months, exchange
rate is the only variable that appears to be statistically significant at 1%, 5% and 10%. There
was a high exchange rate pass-through to imports prices at about 148% of the exchange rate
variation. We reject the null hypothesis that there is low ERPT to import prices in Nigeria.
4.4 EXCHANGE RATE PASS-THROUGH FROM IMPORTS PRICES TO
CONSUMER PRICES
From the estimated specification in Table 4.4, there is the consumer price index (CPI) as the
threshold variable. In this model, all parameters are subject to regime switching. There are
about four regimes in the estimated model as shown in the Table 4.4:
TABLE 4.4: RESULT OF NONLINEAR THRESHOLD REGRESSION
Variable Coefficient Std. Error t-Statistic Prob.

50
lnπt (-5) < 2.334697 -- 81 obs
-0.052141 0.034980 -1.490595 0.1371
yt 0.710221 0.064799 10.96038 0.0000
t
0.242892 0.052979 4.584669 0.0000
2.334697 <= lnπt (-5) < 3.238678 -- 48 obs
-0.266245 0.037386 -7.121430 0.0000
yt 0.462993 0.041743 11.09159 0.0000
t
1.353786 0.091786 14.74936 0.0000
3.238678 <= lnπt (-5) < 3.569532 -- 53 obs
0.179850 0.037553 4.789170 0.0000
yt 0.390806 0.080702 4.842600 0.0000
t
0.013021 0.026096 0.498951 0.6182
3.569532 <= lnπt (-5) -- 137 obs
0.002710 0.023528 0.115162 0.9084
yt 0.624451 0.031180 20.02756 0.0000
t
0.127708 0.052025 2.454715 0.0147
Non-Threshold Variables
-0.918685 0.149549 -6.143037 0.0000 Source: Author‟s Computation (2016)
According to the above estimation results, there is nonlinearity in the pass-through given by
the successive regime switches in the model. The pass-through from import prices to
consumer prices is zero in the regime when the economy was below the threshold. This
regime lasted for about seven years (i.e 1986 to 1993) out of the 28 years scope of this
research. The first threshold value of 2.33% represents the lowest threshold value estimate.
Inflationary trend in this regime could be attributed to the other variables.
In the second regime, the result indicates that all the coefficients of exchange rate, imports
and output growth are statistically significant at 1%, 5% and 10% level. The result of the

51
second price regime exists between the threshold value of 2.33% and 3.23%. Also the result
shows that exchange rate pass-through switches into this regime when inflation equals 2.33%
but less than 3.23% and the length of the regime spans for 48 months. This implies that the
threshold variable (import price) can be triggered to a new regime by all the three variables,
i.e import prices, output demand and exchange rate. There is import prices pass-through to
consumer prices of about 27% in this regime. The pass-through in this case, however, is
positive (i.e, an exchange rate appreciation) which results in a reduction in consumer prices
following a negative relationship it exhibited with inflation. Fall in inflation adds to deficit
supply in the economy and eventually inflate the demand side inflation. Thus, the inflationary
trend within this regime can be attributed to other variables.
However, in the third regime, it appears that the pass-through declined substantially from the
preceding regimes to around 1.3%. This low pass-through could be attributed to the fixed
exchange rate regime adopted by the Abacha administration from 1993 to 1998 – the period
that the third regime falls into by about three years (1996 – 1998). Additionally, the regime
switched from 3.23% to 3.56%. The regimes spans across 53 months of the scope of the
research. At this regime the variables that appear to be statistically significant at 1%, 5% and
10% are output and import prices. This implies that the threshold variable (import price) can
be triggered to a new regime by an increase in either domestic output demand or import
prices or both. The fourth regime shows a zero import price pass-through to consumer prices.
At this regime the variables that appear to be statistically significant at 1%, 5% and 10% are
output and exchange rates. This implies that the threshold variable (import price) can be
triggered to a new regime by an increase in either domestic output demand or exchange rate
or both. We accept the null hypothesis that there is low ERPT from import prices to
consumer prices.

52
4.5 SPEED OF THE PASS-THROUGH
From the results of the sequential determined non linear thresholds in Tables 4.3 and 4.4, the
speed of the exchange rate pass-through to imports and consumer prices is slow. For instance,
Pass-through from exchange rate to import prices is complete (about 104%) in the first
regime but precipitated over the period of 105 months before it is passed to the consumer
prices at a lower rate in the second regime. The low speed is why it could not be passed to
consumer prices in the first regime until the second and third regimes respectively. It took
about 247 months duration for the effects to dissipate. Similarly, there was a zero pass-
through from exchange rate to import prices which took about 212 months to manifest or be
transmitted to consumer prices in the fourth regime of the estimated model. This finding is
consistent with that of Aliyu, et. al. (2009). We accept the null hypotheses that ERPT to
import and consumer prices are low.
4.6 NONLINEARITY OF ERPT IN NIGERIA
According to the above estimation results, there is nonlinearity in the exchange rate pass-
through to imports and consumer prices in Nigeria. This is evident by the successive regime
switches in the model. There are about four regime switches across the period under review
showing the nonlinear behaviour of the ERPT in Nigeria.
4.7 EXCHANGE RATE PASS-THROUGH ASYMMETRY
Asymmetry in exchange rate pass-through is identified from two sources: 1. Size of the
variation in the exchange rate (i.e, small or large changes) 2. Direction of the exchange rate
change (i.e, appreciation or depreciation). From the results of the sequential determined non
linear thresholds in Tables 4.3 and 4.4, it is evident that there is no asymmetry in the
exchange rate pass-through in Nigeria within the period covered by this research. This is
evident in its absence either in terms of appreciation/depreciation or in terms of size of the

53
change in the exchange rate. It should be noted that exchange rate in Nigeria has witnessed a
longer period of successive depreciation of about 20 years from 1986 before it witnessed a
slight appreciation around 2005/2006 and few insignificant others before 2014. Thus,
ascertaining asymmetry with respect to direction may not be easily established due to the
absence of substantial appreciation within the period under review. Thus, accept the null
hypothesis that there is symmetry in ERPT to import prices in Nigeria.
CHAPTER FIVE
SUMMARY, CONCLUSION AND POLICY RECOMMENDATIONS
5.1 SUMMARY
It was recognised in the literature that the degree of ERPT is a very important issue in
designing trade and monetary policies. The pass-through relationship between exchange rate
changes and prices of imported and consumer goods determine the degree of current account
adjustment and international competitiveness achieved from variations in the exchange rate.
Importantly, the effectiveness of the exchange rate policy tool for import reduction or export
promotion depends on the degree of pass-through to import and consumer prices, regardless
of several other factors. On monetary policy, the exchange rate is considered as one of the

54
major transmission channels of monetary policy. Theoretical and empirical literature suggests
that in an open economy, fluctuations in the exchange rate affect inflation through direct
changes in import prices as well as through aggregate demand which is subject to changes in
the relative price between foreign and domestic commodities.
This informs the imperative of examining the ERPT status of the economy to enable the
monetary authorities appropriately situate its role in policy decisions. The study was
motivated by the obvious gap on pass-through to import prices, asymmetry, and nonlinearity,
among others from the review of fewer previous studies available on the subject matter in
Nigeria. It covered a time period from 1986 to 2014 which is about 28 years. Nonlinear
Threshold Regression Model was used and the findings were consistent with many of the
previous studies. It was able to disaggregate the pass-through effects from exchange rate to
imports prices and from import prices to consumer prices. It also examines the speed and
magnitude of the pass-through at the two levels as well as asymmetry.
5.2 CONCLUSION
The degree of ERPT to import and consumer prices was estimated using the Threshold
Regression Model. Evidence from the analysis, covering the period 1986Q1 to 2014Q4
reveals that exchange rate pass-through to import prices is substantial and complete, while
pass-through from import prices to consumer prices is low, slow in speed and incomplete.
The second part of the result is consistent with the findings of Aliyu, et. al. (2009),
Mohammed, (2013) and Zubair, et. al. (2013) where they all found low pass-through to
consumer prices for Nigeria in their respective studies. This is in spite of disaggregating the
pass-through chain; the ultimate effect on consumer prices in the economy remains consistent
with the findings of major previous studies in Nigeria and the literature on African countries,
for example, Ghana as found in Sanusi (2010). One interpretation of this low and slow

55
exchange rate pass-through is that importers to Nigeria practice the so-called pricing-to-
market strategy.
However, one important exclusive finding from the study is the substantial and complete
pass-through to import prices. Due to the slow pace in the speed, the effect from the import
prices to consumer prices dissipates along the transmission chain thereby passing smaller
portion unto the consumer prices. Again, the study also found symmetry in the pass-through
to import prices since no evidence of asymmetry either in terms of appreciation/depreciation
or in terms of size of the change in the exchange rate.
5.3 POLICY RECOMMENDATIONS
From the findings of this study, an important policy recommendation is that, Nigerian
monetary authorities may consider a more flexible exchange rate policy that will achieve the
required external adjustments which may not endanger the macroeconomic goal of achieving
price stability in the economy. This is necessary given the obvious rigidities in the foreign
exchange market – a situation that permits speculations and arbitrage as a result of the
stickiness of the official rate that warranted the continuous widening of the gap between the
official and the parallel market rate. The fear of the possible inflationary effect of a
downward devaluation of the naira to its appropriate (equilibrium) price may not be a source
of concern since the exchange rate pass-through is low and the speed is slow.
This study also recommends that, despite the low and slow pass-through, there is the need for
fiscal authorities to come up with policies that will continue to strengthen the domestic
production which will assist in reducing the level of the import components thereby reducing
the level of pass-through further. Strengthening domestic production, however, requires the
encouragement of the production of commodities we have competitive advantage and
increase in massive requisite infrastructural development such as electricity, rail

56
transportation and other investment incentives that would boost the economy through broad-
based policies that would improve income distribution, generate employment and reduce
poverty hence stimulate domestic demand.
Since ERPT is nonlinear, there is the need for the monetary authorities to monitor the pattern
in of movement in order to provide the appropriate monetary policy response. There is also
the need for the monetary authorities to continue to pursue stable and predictable monetary
and fiscal policies, since historically, money had played greater role in the inflationary
process than exchange rate variations. It is imperative to state that, achieving this would go a
long way in ensuring that the CBN achieves its mandate of maintaining price and monetary
stability, as well as sustained economic growth.
REFERENCES:
Adedayo, A. O. (2012). Exchange Rate Pass-Through in Nigeria: A Dynamic Evidence.
European Journal of Humanities and Social Sciences. 16 (1):785 – 801(pdf).
Available at: http://creativecommons.org/licenses/by-nc/3.0.
Adekunle, A. K. (2010). Exchange Rates and the Consumer Price Index in Nigeria: A
Causality Approach. Journal of Emerging Trends in Economics and Management
Sciences (JETEMS) 1 (2): 114-120 (pdf). Available at:jetems-scholarlinkresearch.org.
Adolfson, M. (2001). Monetary Policy with Incomplete Exchange Rate Pass-Through.
SverigesRiks Bank Working Paper Series, No. 127.
Aliyu, S.U.R., Yakub, M.U., Sanni, G.K. and Duke, O.O. (2009). “Exchange Rate Pass-
Through in Nigeria: Evidence from a Vector Error Correction Model”, JEL
Classification: F31, F41.
57
An, L. (2006). Exchange Rate Pass-Through: Evidence Based on Vector Autoregression with
Sign Restrictions. Department of Economics, University of Kentucky.
Aziz, N. (2009). Exchange Rate Pass-Through to Import, Export and Domestic Prices:
Evidence from a Developing Country. Department of Economics, University of
Birmingham, UK.
Balke, N.S.and Wohar, M. E.(1998). “Nonlinear dynamics and covered interest parity”.
Empirical Economics 23, 535-559.
Barhoumi, K. (2006). “Differences in long run exchange rate pass-through into import prices
in developing countries: An empirical investigation”. Economic Modelling. 23: 926-
951
Berga, H. (2012). Exchange Rate Pass-Through to Import and Consumer Prices: Evidence
from Ethiopia. A Masters Thesis, School of Graduate Studies, Addis Ababa
University, Ethiopia. June.
Black, J., Hashimzade, N. and Myles, G. (2012). Oxford Dictionary of Economics. 4th
edition. Oxford University Press.
Canetti, E. And Greene, J. (1992). Monetary Growth and Exchange Rate Depreciation as
Causes of Inflation in African Countries: An Empirical Analysis. Journal of African
Finance and Economic Development, 1:37-62.
Campa, J. and Godlberg, L.. (2002). Exchange Rate Pass-through into import prices: a Macro
or Micro Phenomenon (pdf), NBER Working paper 8934, Vol. 17 PP.139 – 176.
University of Chicago Press. May. Available at: http://www.nber.org./Chapters/c6982
Chappel, D. Padmore, J. Mistry, P. and Ellis, C. (1998). A Threshold Model for the French
franc/deutschmark exchange rate. Journal of forecasting pg. 463-475.
Choudhri, E. U., and. Hakura, D. S. (2001). “Exchange Rate Pass-Through to CPI: Does the
Inflationary Environment Matter?” IMF Working Paper 01/194 (Washington:
International Monetary Fund).
58
Devereux, M. and Yetman, J. (2002). Price Setting and Exchange Rate Pass-Through
:Theory and Evidence. Djustment and Monetary Policy, Proceedings of a conference
held at the Bank of Canada, Ottawa: Bank of Canada. PP. 71-347.
Dornbusch, R. (1987). “Exchange Rates and Prices,” American Economic Review 77 (March
1987), 93-106.
Dunn, R and Mutti, J. (2004): “International Economics”. Sixth Edition. Routledge ,London.
United Kingdom.
Dwivedi, D. N. (2007):“Macro Economics Theory and Policy”. 2nd Edition. Tata- Mc-
Graw Hill publishing Company ltd. New Delhi, India.
Enders, W. (2004). Applied Econometric Time Series, John WIley & Sons, Inc.
Friedman, M. and Schwartz, A. J. (1965), The Great Contraction 1929–1933, Princeton:
Princeton University Press, ISBN 0-691-00350-5
Frimpong, S. and Adam, A. M. (2010). “Exchange Rate Pass-Through in Ghana
“International Business Research, 3(2), pp. 186 – 192.
Gbosh, A. and Rajan, R.S. (2006). Exchange Rate Pass-Through in Asia: What does the
Literature Tell us? George Mason University and Claremont Graduate University.
Goldberg, P., and Knetter, M. (1997). "Goods Prices and Exchange Rates: What Have We
Learned?" Journal of Economic Literature, Vol. 35, No. 3, pp. 1243–1272.
Goldfajn, L. And Wang, S. (2000). “The Pass-Through from depreciation to inflation: a panel
study”. Central Bank of Brazil, Working Paper No. 5.
Hardwick, P., Khan, B., and Langmead, J. (1997). An Introduction to Modern Economics.
Third Impression. 4th
Edition. New York: Addison Wesley Longman Publishing.
Ismail, M. T. & Isa, Z. (2006). “Modelling Exchange Rates Using Regime Switching
Models”. Sains Malaysiana 3 (2): 55 – 62.
59
International Monetary Fund, (2012). International Financial Statistics. (Online). Available
at: http://www.indexmundi.com/facts/nigeria/official-exchange-
rate#sthash.yeUkpoi1.dpuf. (Accessed ...).
International Monetary Fund, (2011). World Economic Outlook. IMF
Jhingan, M. L. (2003). Advanced Economic Theory. Revised and Enlarged Edition. Delhi:
Vrinda Publications Ltd.
Kishtainy, N. (2014). Economics in Minutes. Quercus Editions Ltd. 55 Baker Street, South
Block, London.
Krager, H. and Kugler, P. (1993). Nonlinearities in foreign exchange markets: A different
perspective. Journal of Econometrics. 119-147. MR1409037.
Krugman, P. (1986). “Pricing to Market When the Exchange Rate Changes,” in Real-
Financial Linkages Among Open Economics. ed. by Sven W. Arndt andJ. David
Richardson, pp. 49–70 (Cambridge, Massachusetts: MIT Press).
Krugman,P and Obstfeld ,M. (2003):“International Economics:Theory and policy”. Sixth
Edition. Elm Street Publishing Services Inc. Boston.USA.
Maka, E. D. (2013). Asymmetric Pass-Through of Exchange Rate Changes to CPI Inflation
in Ghana. International Journal of Economics, Finance and Management, ISSN 2307-
2456. 5 (2) . PP. 338 – 350. August. Available at: http://www.ejournalofbusiness.org.
Marazzi, M., Sheets, N. and Vigfusson, R. (2005). “Exchange Rate Pass Through to US
Import Prices: Some New Evidence”, Federal Reserve Board of Govenors,
International Finance Discussion Paper no: 833, April.
McAdam, P. and William, A. (2004). “Supply, Factor Shares and Inflation Persistence: Re-
examining Euro-area New-Keynesian Phillips Curves”. Oxford Bulletin of Economics
& Statistics, 66, pp. 637-670
McCarthy, J. (2000). “Pass-Through of Exchange Rates and Import Prices to Domestic
Inflation in Some Industrialized Economies”. Federal Reserve Bank of New York
Staff Report no. 111 (September).

60
Mohammed, A. A. (2013). Exchange Rate Pass-Through to Domestic Consumer Prices in
Nigeria: A Structural Var Approach. A Masters Thesis at Cankaya University
Graduate School of Social Science Economics.
Mordi ,C. N. (2006):“Challenges of exchange rate volatility in Economic Management in
Nigeria”.CBN Bullion, Volume. 30, No.3. pg 17-25. Central Bank of Nigeria.
Mumtaz, H, O. and Wang, J. (2006). “Exchange rate pass -through into UK Import Prices”
Working Paper No: 312. Bank of England. [Online].
Odusola, A. (2006):“Economics of exchange rate Management”. CBN Bullion, Vol. 30,
No.3. Central Bank of Nigeria.
Oguanobi, R. C., Akamobi A. A. and Agu, C. C. (2014). Cross-Border Transmission of
Interest Rate Shocks: A VAR Analysis of the Nigerian Economy. Journal of
Economics and Sustainable Development. ISSN 2222-1700 (Paper) ISSNn2222-2855
(Online) 5 (7). Available at: www.iiste.org.
Ogundipe, A. A. and Samuel, E. (2013). Exchange Rate Pass-Through to Consumer Prices in
Nigeria. Journal of Business Management and Applied Economics, Vol. II Issue 4.
July. Available at: www.scientificpapers.org.
Ohno, K. (1989). “Export Pricing Behaviour of Manufacturing: a US-Japan comparison”.
IMF Staff Papers, 36. Pp. 550-579.
Omojimite, B. U., and Oriavwote, U. E. (2012). An Empirical Investigation of Exchange
Rate Pass-Through into Domestic Prices in Nigeria. European Journal of Economics
and Finance and Administrative Sciences. ISSN 1450 – 2275 Issue 45. Available at:
http://www.eurojournal.com.
O'Sullivan, A. and.Sheffrin, S. M. (2003). Economics: Principles in action. Upper Saddle
River, New Jersey 07458: Pearson Prentice Hall. p. 458. ISBN 0-13-063085-3.
Otaki, M. (2010). “A Pure Theory of Aggregate Price Determination”. DBJ Discussion Paper
series No. 0906. Institute of Social Science, University of Tokyo.
61
Pollard, P. and Coughlin, C. (2004). “Size Matters: Assymmetric Exchange Rate Pass-
Through at the Industrial Level”. University of Nottingham, Research Paper Series
no. 2004/13.
Posedel, P. and Tica, J. (2007). “Threshold Autoregressive Model of Exchange Rate Pass
through Effect: The Case of Croatia”. February. A working paper series paper no. 07
Vol. 15. Department of Economics, University of Zagreb, Croachia.
Rogoff, K. and Obstfeld, M. (1995): “The mirage of fixed exchange rate”. Journal of
Economic Perspective. Volume 9.No.4.pg 73-96.
Sanni, H. T. (2006):“Sustaining the current exchange rate regime in Nigeria.” CBN Bullion,
Volume 30, No.3.Central Bank of Nigeria.
Sanni, H.T. (2006). The Challenges of Sustainability of the Current Exchange Rate Regime
in Nigeria, CBN Journal Vol. 30 No. 3 July – Sept.
Sanusi, A, R. (2010). “Exchange Rate Pass Through To Consumer Prices In Ghana: Evidence
From Structural Vector Auto Regression” MPRA Paper, No, 29491 March. Available
at: http://mpr.ub.uni-muenchen.de/24491/ PP. 25 – 46.
Sims, C. (1986). “Are Forecasting Models Usable For Policy Analysis?” Quarterly review,
Federal Reserve Bank of Minneapolis.
Sheefeni, J. and Ocran, M. (2013). Exchange Rate Pass-Through to Domestic Prices in
Namibia: SVAR Evidence. Journal of Economic and Financial Sciences. /JEF/ Vol.
7(1), PP. 89-102. April.
Stock, J. H., and Watson, M. W. (2001) “Vector Auto regressions”, Journal of economic
perspective, volume No; 15, 101-115.
Stephen, B. A. (2011). The Exchange Rate Determination in Nigeria: The Purchasing Power
Parity Option, Mathematical Theory and Modelling www.iiste.org ISSN 2224-5804 (Paper)
ISSN 2225-0522 (Online) Vol.1, No.2, 2011

62
Taylor, J. B. (2000). “Low Inflation, Pass-Through, and the Pricing Power of Firms”
European Economic Review, June volume 44 issue 7 pp. 1389-1408.
Tong, H. (2010). Threshold models in tome series analysis – 30 years on. Statistics and its
interface. Vol. 4 123-127.
Viser, H. (2004): “International Monetary Economics‟‟. Third Edition. Edward Elgar
Publishing Ltd. Cheltenham. United Kingdom.
Wisegeek, (2003). Common Answers for Common Questions (Online). Available at:
http://www.wisegeek.com/what-is-domestic-price-level.htm (Accessed ....).
Zorzi, M., Hahn, E. And Sanchez, M. (2007). Exchange Rate Pass-Through in Emerging
Markets. European Central Bank Working Paper No. 739.
Zubair, A., Okorie, G. and Sanusi, A. R. (2013). Exchange Rate Pass-Through to Domestic
Prices in Nigeria: An Empirical Investigation. Central Bank of Nigeria Economic and
Financial Review, Vol. 51 (1). March.
APPENDIX I
Result Of Nonlinear Threshold Regression Dependent Variable: LOGCPI
Method: Threshold Regression
Date: 05/07/16 Time: 19:41
Sample (adjusted): 1986M06 2012M12
Included observations: 319 after adjustments
Threshold type: Bai-Perron tests of L+1 vs. L sequentially determined
Thresholds
Threshold variables considered: LOGCPI(-2) LOGCPI(-3) LOGCPI(-4)
LOGCPI(-5) LOGCPI(-6)
Threshold variable chosen: LOGCPI(-5)
Threshold selection: Trimming 0.15, Max. thresholds 5, Sig. level 0.05
Threshold values used: 2.334697, 3.238678, 3.569532
Note: final equation sample is larger than selection sample
Variable Coefficient Std. Error t-Statistic Prob.
LOGCPI(-5) < 2.334697 -- 81 obs
LOGIMPRT -0.052141 0.034980 -1.490595 0.1371
LOGNGDP 0.710221 0.064799 10.96038 0.0000
LOGEXCHR 0.242892 0.052979 4.584669 0.0000
2.334697 <= LOGCPI(-5) < 3.238678 -- 48 obs
LOGIMPRT -0.266245 0.037386 -7.121430 0.0000
LOGNGDP 0.462993 0.041743 11.09159 0.0000
LOGEXCHR 1.353786 0.091786 14.74936 0.0000

63
3.238678 <= LOGCPI(-5) < 3.569532 -- 53 obs
LOGIMPRT 0.179850 0.037553 4.789170 0.0000
LOGNGDP 0.390806 0.080702 4.842600 0.0000
LOGEXCHR 0.013021 0.026096 0.498951 0.6182
3.569532 <= LOGCPI(-5) -- 137 obs
LOGIMPRT 0.002710 0.023528 0.115162 0.9084
LOGNGDP 0.624451 0.031180 20.02756 0.0000
LOGEXCHR 0.127708 0.052025 2.454715 0.0147
Non-Threshold Variables
C -0.918685 0.149549 -6.143037 0.0000
R-squared 0.992781 Mean dependent var 3.273996
Adjusted R-squared 0.992497 S.D. dependent var 1.177484
S.E. of regression 0.101991 Akaike info criterion -1.687972
Sum squared resid 3.183042 Schwarz criterion -1.534532
Log likelihood 282.2315 Hannan-Quinn criter. -1.626694
F-statistic 3506.616 Durbin-Watson stat 0.505481
Prob(F-statistic) 0.000000
APPENDIX II
Result Of Nonlinear Threshold Regression
Dependent Variable: LOGIMPRT
Method: Threshold Regression
Date: 06/12/16 Time: 11:28
Sample (adjusted): 1986M06 2012M12
Included observations: 319 after adjustments
Threshold type: Bai-Perron tests of L+1 vs. L sequentially determined
Thresholds
Threshold variable: LOGIMPRT(-5)
Threshold selection: Trimming 0.15, Max. thresholds 5, Sig. level 0.05
Threshold values used: 9.632836, 10.98592, 12.35084
Variable Coefficient Std. Error t-Statistic Prob.
LOGIMPRT(-5) < 9.632836 -- 105 obs
LOGEXCHR 1.045416 0.125529 8.328073 0.0000
LOGNGDP 0.298400 0.104312 2.860654 0.0045
9.632836 <= LOGIMPRT(-5) < 10.98592 -- 72 obs
LOGEXCHR -0.096643 0.070581 -1.369260 0.1719
LOGNGDP 1.019640 0.055558 18.35277 0.0000
10.98592 <= LOGIMPRT(-5) < 12.35084 -- 70 obs
LOGEXCHR 0.020075 0.190295 0.105493 0.9161
LOGNGDP 1.006641 0.131532 7.653210 0.0000

64
12.35084 <= LOGIMPRT(-5) -- 72 obs
LOGEXCHR 1.484706 0.320738 4.629030 0.0000
LOGNGDP 0.115342 0.202560 0.569419 0.5695
Non-Threshold Variables
C 4.788829 0.173205 27.64827 0.0000
R-squared 0.969031 Mean dependent var 10.57093
Adjusted R-squared 0.968232 S.D. dependent var 2.019550
S.E. of regression 0.359955 Akaike info criterion 0.822131
Sum squared resid 40.16593 Schwarz criterion 0.928359
Log likelihood -122.1300 Hannan-Quinn criter. 0.864555
F-statistic 1212.517 Durbin-Watson stat 1.201309
Prob(F-statistic) 0.000000
APPENDIX III`
A. TRENDS OF THE VARIABLES
-6
-4
-2
0
2
4
86 88 90 92 94 96 98 00 02 04 06 08 10 12
LOGEXCHR
-16
-12
-8
-4
0
4
8
86 88 90 92 94 96 98 00 02 04 06 08 10 12
LOGIMPRT
-8
-6
-4
-2
0
2
4
86 88 90 92 94 96 98 00 02 04 06 08 10 12
LOGNGDP
-2.0
-1.5
-1.0
-0.5
0.0
0.5
1.0
86 88 90 92 94 96 98 00 02 04 06 08 10 12
C
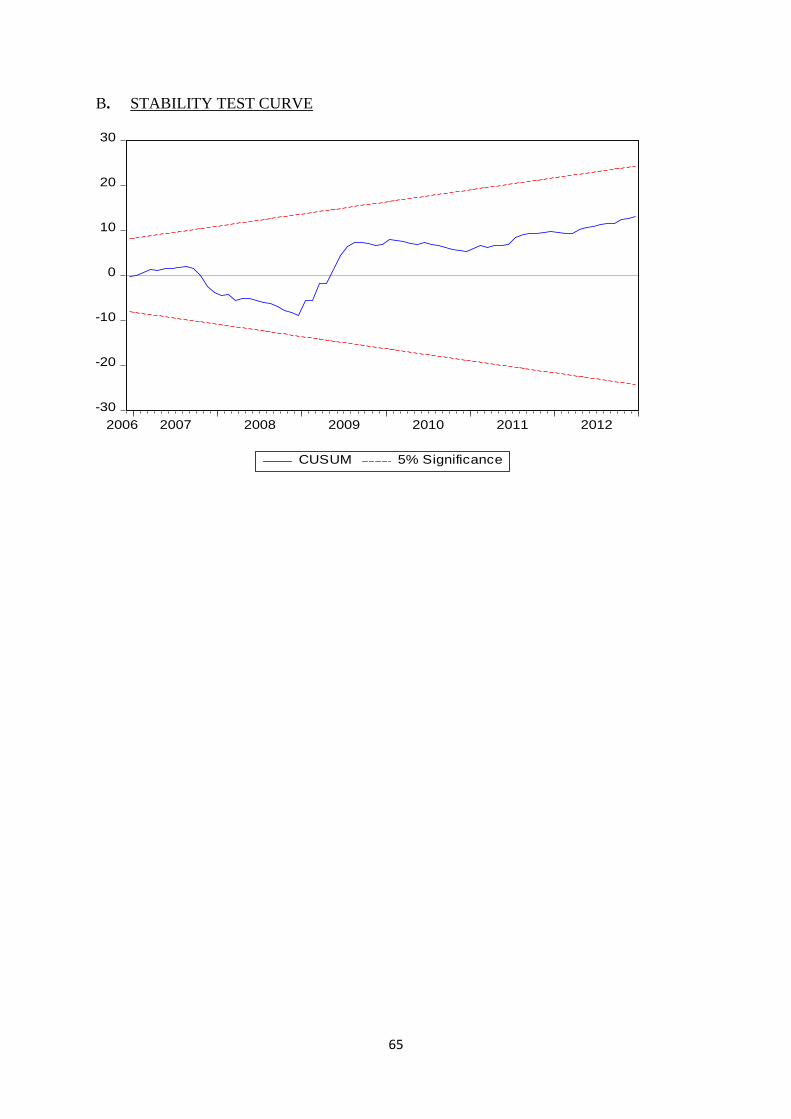
65
B. STABILITY TEST CURVE
-30
-20
-10
0
10
20
30
2006 2007 2008 2009 2010 2011 2012
CUSUM 5% Significance