Embed Size (px)
Citation preview

Commission of the European Communities
environment and quality of life
EXCHANGE OF INFORMATION CONCERNING ATMOSPHERIC POLLUTION
IN THE EUROPEAN COMMUNITY Annual Report 1982
Report EUR 12095 EN
Blow-up from microfiche original


Commission of the European Communities
environment and quality of life
EXCHANGE OF INFORMATION CONCERNING ATMOSPHERIC POLLUTION
IN THE EUROPEAN COMMUNITY Annual Report 1982
ENEX GROUP Rue du Collège, 41 B-1050 Bruxelles
Contract No. 84-B-6642-11 -009-11-S
FINAL REPORT
Directorate-General Environment, Nuclear Safety and Civil Protection
1959
PARL Eur?. r:MwS.
4 CL.EUR 12095 EN

Published by the COMMISSION OF THE EUROPEAN COMMUNITIES
Directorate-General Telecommunications, Information Industrie· and Innovation
L-2920 LUXEMBOURG
LEGAL NOTICE Neither the Commission of the European Communities nor any person acting on behalf of the Commission is responsible for the use which might be made of the following
information
Catalogue number: CD-NA-12095-EN-C
ι ECSC— EEC—EAEC Brussels - Luxembourg, 1989

III Annual Report 82
TABLE OF CONTENTS
Abstract
Summary
Introduction
Chapter I General presentation of the series 1.1 Content of the exchange of information 1.2 Summary of the measured pollutants by country
and by town class 1.3 Breakdown of the annual series by the
measurement technique codes 1.4 The monthly median 1.5 Characteristics of the annual series 1.6 Technical remarks
Chapter II Treatment of the selected series 11.1 Introduction II.2 Non-parametric statistics 11.3 Parametric statistics II.3.1 Definitions 11.3.2 Histograms
II.4 Characteristics of the time series
Figures
Annexes
Abbreviated descriptive tables

IV Annual Report 82
ACKNOWLEDGMENTS
We wish to express our appreciation to the late Dr. J. Smeets, Heed of Division at DG XI, E.E.C - and hie collaborators, Dr. P. Stief-Tauch and Mr. A. Price, for their constructive comments during the elaboration of this report. We also express our thanks to Mrs. M.-Ch. Van Houtte for her collaboration.

Annual Report 82
ABSTRACT
The Annual Repor t 82 c o n c e r n i n g t h e exchange of i n f o r m a t i o n
on a t m o s p h e r i c p o l l u t i o n i n t h e E u r o p e a n C o m m u n i t i e s i s p r e s e n t e d i n t h i s document.
T h i s r e p o r t a i m s a t p r e s e n t i n g t h e c o n t e n t o f t h e e x c h a n g e
o f i n f o r m a t i o n a s r e q u i r e d by t h e C o u n c i l D e c i s i o n 8 2 / 4 5 9 / E E C .
C o v e r i n g t h e p e r i o d O c t o b e r 8 1 t o S e p t e m b e r 8 2 , i t s u m m a r i z e s and e v a l u a t e s t h e d a t a f o r c e r t a i n s u l p h u r
compounds , s u s p e n d e d p a r t i c u l a t e s and h e a v y m e t a l s f r o m m e a s u r i n g s t a t i o n s s e l e c t e d by t h e M e m b e r S t a t e s i n accordance w i t h an agreed p r o c e d u r e .


VII Annual Report 82
SUMMARY
This report presents an analysis of the air pollution data for specific pollutants in the countries of the European Communities. It covers the period October 81 to September 82.
This work is based on previous recommendations appearing in the first report on Comparative Study on Data Analysis (ref. APREÇO BM (83) 254(711) of Duly 1984). Furthermore in order to insure continuity of the annual reports, the presentation of this document is similar to the one of the report 81 but taking into consideration the comments and suggestions of the National Coordinators.
The report is divided in two parts. The first part concerns a general presentation of the stations which submitted measurements. The second part related to the evaluation of the statistical parameters characterizing the series is divided into:
descriptive statistics time series analyses.
The main goal of this report on the exchange of information is to act as a reference document.

VIII Årsrapport 82
SAMMENFATNING
Denne rapport er en analyse af luftforureningsdata for specifikke forurenende stoffer i Det Europæiske Fællesskabs lande. Den dækker perioden oktober 81 ti l september 82.
Dette arbejde er baseret på tidligere henstillinger fra den første rapport om sammenlignende undersøgelse af dataanalyse (ref. APREÇO BM (83) 254(711) fra juli 1984). For at sikre kontinuiteten i årsrapporterne er dette dokument udformet som rapporten fra 81, men der er taget hensyn til bemærkninger og forslag fra de nationale koordinatorer.
Rapporten er opdelt i to dele. Første del indeholder en generel beskrivelse af de stationer, der har sendt målingerne. Anden del vedrørende evalueringen af de for rækkerne karakteristiske statistiske parametre er opdelt i:
- beskrivende statistik - tidsrækkeanalyser.
Hovedformålet med denne rapport om udveksling af oplysninger er at tjene som referencedokument.

IX
Jahresbericht 1982
ZUSAMMENFASSUNG
Der Bericht umfaßt eine Analyse von Luftverschmutzungsdaten bestimmter Schadstoffe in den Ländern der Europäischen Gemeinschaften. Er bezieht sich auf den Zeitraum von Oktober 1981 bis September 1982.
Die Arbeiten beruhen auf den Empfehlungen des ersten Berichts "Comparative Study on Data Analysis" (APREÇO BM (83) 254(711), Juli 1984). Um eine Kontinuität der Jahresberichte zu gewährleisten, wurde dieses Dokument formal) ähnlich gestaltet wie der Bericht f Cir 1981, wobei allerdings die Bemerkungen und Anregungen der nationalen Koordinatoren berücksichtigt wurden.
Der Bericht umfaßt zwei Teile. Im ersten Teil wird ein allgemeiner Überblick über die Stationen gegeben, die Meßergebnisse vorgelegt haben. Der zweite Teil, in dem eine Bewertung der statistischen Parameter, die die Meßreihen charakterisieren, vorgenommen wird, ist wie folgt unterteilt :
- beschreibene Statistik - Zeitreihenanalysen.
Dieser Bericht über den Informationsaustausch soll vor allem als Bezugsdokument dienen.
Informe anual 82
RESUMEN
El presente informe analiza los datos sobre contaminación atmosférica referidos a contaminantes específicos en los países de la Comunidad Europea durante el periodo comprendido entre octubre de 1981 y septiembre de 1982.
El trabajo se basa en las recomendaciones previas contenidas en el primer informe sobre Estudio comparativo del análisis de datos (ref. APREÇO BM(83)254(711) de julio de 1984). La presentación es similar a la del informe del año 81, para mantener una continuidad, pero teniendo en cuenta los comentarios y sugerencias de los coordinadores nacionales.
El informe se divide en dos partes. En la primera se analizan, de forma general, las estaciones que presentaron sus mediciones; la segunda parte se refiere a la evaluación de los parámetros estadísticos que caracterizan a las series, dividiéndolos en:
- estadísticas descriptivas - análisis de series temporales
El principal objetivo del presente informe sobre intercambio de información es servir como documento de referencia.

XI
Rapport annuel 1982
SOMMAIRE
Ce rapport analyse les données concernant la pollution atmosphérique par des polluants spécifiques dans les pays de la Communauté européenne. Il couvre la période d'octobre 1981 à septembre 1982.
Ce travail repose sur des recommandations contenues dans le premier rapport : Comparative Study on Data Analysis (ref. APREÇO BM (83) 254(711), juillet 1984). On a décidé en outre, afin d'assurer l'uniformité des rapports annuel?, d'adopter pour le présent document une présentation similaire à celle du rapport 1981, en prenant également en considération les commentaires et suggestions des coordinateurs nationaux.
Ce rapport comporte deux parties. La première constitue une présentation générale des stations qui ont présenté des mesures. La seconde, qui porte sur l'évaluation des paramètres statistiques caractérisant les séries est divisée comme suit :
- statistiques descriptives, - analyses des séries temporelles.
Ce rapport sur l'échange d'informations vise à servir de document de référence.
X I I
Ετήσια Έκθεση 82
ΠΕΡΙΛΗΨΗ
Η παρούσα έκθεση περιλαμβάνει ανάλυση σχετικών με τη ρύπανση του αέρα δεδομένων όσον αφορά τους συγκεκριμένους ρύπους στις χώρες των Ευρωπαϊκών Κοινοτήτων. Καλύπτει την περίοδο Οκτώβριος 81 έως Σεπτέμβριος 82.
Η εργασία αυτή βασίζεται σε προηγούμενες συστάσεις που περιλαμβάνονται στην πρώτη έκθεση για τη Συγκριτική Μελέτη της Ανάλυσης Δεδομένων (αναθ. APREÇO ΒΜ (83) 254 (711) του Ιουλίου 1984). Επιπλέον, προκειμένου να διασφαλιστεί η συνέχεια των εκθέσεων, η παρουσίαση του παρόντος εγγράφου είναι ανάλογη με την παρουσίαση της έκθεσης του 81, αλλά λαμβάνει υπδψη τα σχόλια και τις υποδείξεις των Εθνικών Συντονιστών.
Η έκθεση διαιρείται σε δύο μέρη. Το πρώτο μέρος περιλαμβάνει μία γενική παρουσίαση των σταθμών που υπέβαλαν αποτελέσματα μετρήσεων. Το δεύτερο μέρος αφορά την αξιολόγηση των στατιστικών παραμέτρων με βάση τις οποίες χαρακτηρίζονται οι σειρές, και διαιρείται σε:
περιγραφικές στατιστικές αναλύσεις χρονολογικών σειρών.
Κύριος στόχος της έκθεσης αυτής για την ανταλλαγή πληροφοριών είναι να αποτελέσει έγγραφο αναφοράς.

X I I I
RELAZIONE ANNUALE 1 9 8 2
R I A S S U N T O
La presente relazione contiene un'analisi dei dati sull'inquinamento atmosferico relativi ad inquinanti specifici nei paesi membri della Comunità europea, nel periodo compreso tra l'ottobre 1981 e il settembre 1982.
Essa tiene conto di quanto era stato proposto nella prima relazione sullo Studio comparato dell'analisi dei dati (rif. APREÇO BN (83) 254(711) del luglio 1984). Per assicurare una certa omogeneità delle relazioni annuali, il documento si ispira strutturalmente alla relazione del 1981, prende però in considerazione i commenti e i suggerimenti dei coordinatori nazionali.
La relazione è divisa in due parti. La prima contiene una descrizione generale delle stazioni che effettuano le misurazioni. La seconda presenta invece una valutazione dei parametri statistici che caratterizzano le serie e, a sua volta, si suddivide in:
- statistiche descrittive, - analisi delle serie cronologiche.
La presente relazione sullo scambio di informazioni vuol servire essenzialmente da documento di riferimento.

XIV
Jaarverslag 1982
SAMENVATTING
Dit verslag bevat een analyse van de gegevens met betrekking tot de door specifieke stoffen veroorzaakte luchtverontreiniging in de landen van de Europese Gemeenschap. Het betreft de periode oktober 1981 tot en met september 1982.
De werkzaamheden zijn gebaseerd op aanbevelingen die eerder In het eerste verslag met als titel "Comparative Study on Data Analysis" (ref. APREÇO BM (83) 254(711), Juli 1984) zijn verschenen. Met het oog op de continuïteit van de Jaarverslagen komt de presentatie van dit verslag In grote lijnen overeen met die van het Jaarverslag 1981, met dien verstande dat er rekening Is gehouden met de opmerkingen en suggesties van de nationale coördinatoren.
Het verslag bestaat uit twee delen. In het eerste deel wordt een algemene beschrijving van de meetstations gegeven. Het tweede deel, dat betrekking heeft op de evaluatie van de statistische parameters waarmee de datareeksen worden gekarakter I seerd, is ingedeeld In:
- beschrijvende stat Ist lek en - tijdreeksanalyse.
Dit verslag met betrekking tot de gegevensuitwisseling is In de eerste plaats bedoeld als referentiedocument.

XV ReLatório AnuaL 82
RESUMO
Este relatório apresenta uma análise dos dados sobre poluição atmosférica relativos a poluentes específicos nos países das Comunidades Europeias, cobrindo o período de Outubro de 1981 a Setembro de 1982.
0 trabalho baseia-se em recomendações anteriores, incluídas no primeiro relatório sobre o Estudo Comparativo de Análises de Dados (ref. APREÇO BM (83) 254 (711) de Julho de 1984). Além disso, para assegurar a continuidade dos relatórios anuais, a apresentação deste documento é semelhante à do relatório 81 tomando, no entanto, em consideração os comentários e sugestões dos Coordenadores Nacionais.
0 relatório divide-se em duas partes. A primeira consiste na apresentação geral das estações que enviaram os resultados das medições; a segunda, referente à avaliação dos parâmetros estatísticos que caracterizam a série, subdivide-se em:
- estatística descritiva - análise de séries cronológicas
Este relatório de trocas de informação pretende essencialmente servir de documento de referência.


XVII Annual Report 82
FOREWORD
The annual report 1982 aims at presenting the content of the exchange of information on atmospheric pollution established by the Council Decisions 75/441/EEC and 82/459/EEC. However, it must be pointed out that the set of data collected does not necessarily reflect the real situation of the atmospheric pollution in the European Communities for several reasons :
the exchange of information concerns only a set of stations selected by the Member States the majority of the stations are located in urban areas the coverage is not equivalent in each Member State the policy for placing stations differs between Member States and even regions or towns. the data transmitted by France and Denmark were incomplete and did not allow statistical treatment. For France, this lack of data is explained by the reorganization of the national network including the computerized data storage process. For Denmark, a number of stations have started reporting to the exchange in 1982 only. The other Danish stations have reported data against new measurement technique codes which implies a discontinuity in the data series. only few series for United Kingdom were retained for statistical treatment. This country has modified most of the stations participating to the exchange in March 1982.
Two general remarks about the results presented in this report are also relevant:
some figures (for examples fig F.3 to F.ll), show very high 98 percentile values. This can be due to exceptional events such as temperature inversion and also to extra-boundaries pollution transports. figure II.2.18 of page F.20 presents the global median value by town class for the four pollutants. This figure must be interpreted with care. Indeed the classification used (class of town) is only based on the number of inhabitants; neither the industrial activity nor the traffic density are taken into consideration.


1 Annual Repor t 82
INTRODUCTION
T h e C o u n c i l D e c i s i o n 8 2 / 4 5 9 / E E C e x t e n d s t h e D e c i s i o n
7 5 / 4 4 1 / E E C w h i c h has e s t a b l i s h e d a common p r o c e d u r e f o r t h e
e x c h a n g e o f i n f o r m a t i o n b e t w e e n t h e s u r v e i l l a n c e a n d
m o n i t o r i n g n e t w o r k s b a s e d on d a t a r e l a t i n g t o a t m o s p h e r i c
p o l l u t i o n c a u s e d by s u l p h u r c o m p o u n d s a n d s u s p e n d e d
p a r t i c u l a t e s .
The new D e c i s i o n a l l o w s t h e m e a s u r e m e n t s o f a d d i t i o n a l
p o l l u t a n t s i . e . N 0 X , CO, O3 a n d p a r t i c u l a t e h e a v y m e t a l s
s u c h as l e a d , c a d m i u m , e t c . o v e r r e c o m m e n d e d a v e r a g i n g
t i m e s .
The Member S t a t e s h a v e t r a n s m i t t e d d a t a on t h e s e a d d i t i o n a l
p o l l u t a n t s f o r 1 9 8 2 . F u t h e r m o r e , some o f t h e d a t a f o r t h e
o r i g i n a l p o l l u t a n t s c o r r e s p o n d t o h o u r l y a v e r a g i n g t i m e s .
To make t h e c o n s i d e r a b l e a m o u n t o f d a t a s u b m i t t e d by t h e
M e m b e r S t a t e s a v a i l a b l e t o t h e e x p e r t s a n d t o d r a w
c o n s t r u c t i v e c o n c l u s i o n s on t h e c o n t e n t o f t h e exchange o f
i n f o r m a t i o n o n a t m o s p h e r i c p o l l u t i o n , a n n u a l r e p o r t s
s u m m a r i z i n g t h e r e s u l t s o f t h i s exchange must be d r a f t e d .
I t i s i m p o r t a n t t o c o n s i d e r t h e s e r i e s o f m e a s u r e m e n t
r e c e i v e d f r o m t h e f i e l d s t a t i o n s i n two p e r s p e c t i v e s , f i r s t
on i n d i v i d u a l b a s i s , t o o b t a i n r e c o r d s o f e a c h s t a t i o n and
t h e i r c h a r a c t e r i s t i c s , w h i c h may i n t u r n l e a d t o a
r e p r e s e n t a t i v e s e l e c t i o n o r t h e e s t a b l i s h m e n t o f s t a n d a r d s .
S e c o n d l y on a g l o b a l b a s i s t o show t h e y e a r l y E u r o p e a n
s i t u a t i o n and hence t o o b t a i n an o v e r a l l s y n o p s i s w h i c h may,
f o r i n s t a n c e , f i t i n t o f o r e c a s t i n g p r o g r a m m e s . B o t h
a p p r o a c h e s a r e e n v i s a g e d t h r o u g h o u t t h i s r e p o r t and s h o u l d
c e r t a i n l y h e l p c l a r i f y i n g t h e f u n c t i o n and t h e r o l e o f s u c h
an i m p o r t a n t e x c h a n g e s y s t e m i n t h e f r a m e o f t h e E u r o p e a n
programme f o r t h e p r o t e c t i o n o f man and t h e e n v i r o n m e n t .

Annual Report 82
It is also important to underline that this report covers only the pollutants for which the Council Decision recommends an averaging time of 24 hours: i.e. sulphur compounds, suspended particulates and heavy metals. It was also decided by the Commission that this report will cover the period October 81 to September 82 so that the winter period is continuous. The presentation of this document is similar to the one of the report 81 in order to insure continuity of the annual reports but it takes also into consideration the comments of the National Coordinators.

Annual Repor t 82
I . GENERAL PRESENTATION OF THE SERIES
T h i s c h a p t e r can be s e p a r a t e d i n t h r e e d i f f e r e n t i t e m s :
1.1 t o 1.3 - an o v e r a l l d e s c r i p t i o n of t h e s t a t e of t h e
e x c h a n g e o f i n f o r m a t i o n i n t h e E u r o p e a n
Communi t i e s
1.4 and 1.5 - some a n n u a l c h a r a c t e r i s t i c s o f t h e raw s e r i e s
1.6 - t e c h n i c a l r e m a r k s c o n c e r n i n g t h e d a t a bank .
I t i s i m p o r t a n t t o r e m i n d t h a t t h i s r e p o r t c o v e r s o n l y t h e
p o l l u t a n t s f o r w h i c h t h e C o u n c i l D e c i s i o n r e c o m m e n d s an
a v e r a g i n g t i m e o f 2 4 h o u r s : i . e s u l p h u r c o m p o u n d s ,
s u s p e n d e d p a r t i c u l a t e s and heavy m e t a l s .
1 .1 CONTENT OF THE EXCHANGE OF INFORMATION
T a b l e 1.1 g i v e s a summary o f t h e n u m b e r o f t h e a n n u a l s e r i e s
( O c t . 81 - S e p t . 82 ) w i t h r e s p e c t t o t h e p o l l u t a n t c o d e .
T a b l e 1.1
Pollutant code | 1 2 3 4 19 28 I S02 Smoke SPM Acid Pb Cd
- I no. of annual I 142 146 82 155 13 10 series J percentage | 25.9 26.6 15.0 28.3 2.4 1.8
Tot
548
100. 0
Two heavy metals (lead and cadmium) are included for the firet time in the exchange of information. In fact, the number of annual series relating to these pollutants is very low compared with the number of series covering the traditional ones, but it is hoped that the numbers reported will increase.
Annuel Report 82
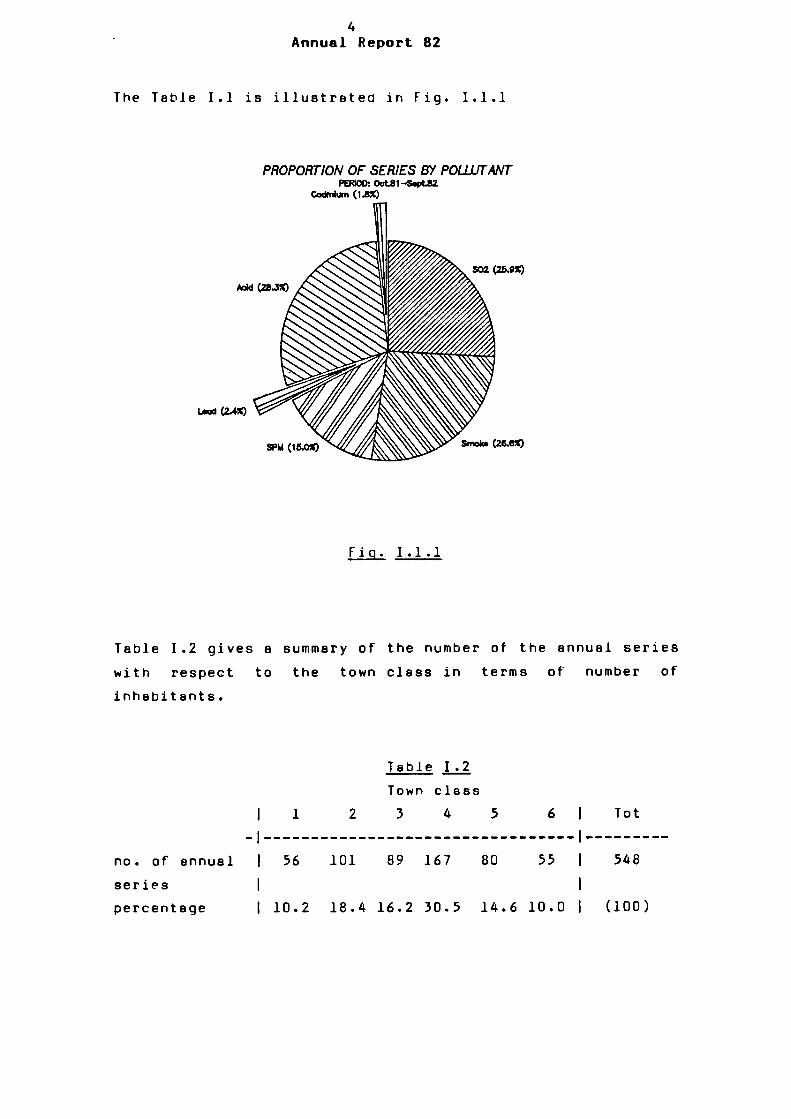
The Table 1.1 is illustreted in Fig. 1.1.1
PROPORTION OF SERIES BV POLLUTANT PERIOD: 0ct81-S«pt82
Cadmium (1.8*)
Add (28 JX)
Uad (2.4X)
SPM (16.0%)
(25.9«)
Smok· (26.6X)
F i g . I . 1 . 1
Table 1.2 gives β summary of the number of the annual series with respect to the town class in terms of number of inhabitants.
no. of annual series percentage
Table I .2 Town class 3 4 5
56 101 89 167 80 55
10.2 18.4 16.2 30.5 14.6 10.0
Tot
548
(100)

Annuel Report 82
The town class number is defined by
Town class
1 2 3 4 5 6
Number of inhabi tants
> 2 mi 1lions 1 to 2 millions 0.5 to 1 million 100 to 500 thousands 1 to 100 thousands < 1 thousand (background sites)
As it can be seen in Fig.I.1.2, the breakdown by town class groups of all the annual series involved in this exchange of information is well balanced.
PROPORTION OF SERIES BY TOWN CLASS PERIOD: 0ct81-SeptB2
<lm !nh. (10.0«) >2M inh. (10.2%)
1-100m Inh. (H.6%)
.1-.5M inh. (30.5%)
1-2M inh. (1B.+%)
Æ-1M inh. (16.2%)
F i g . I . 1 . 2
Annual Report 82
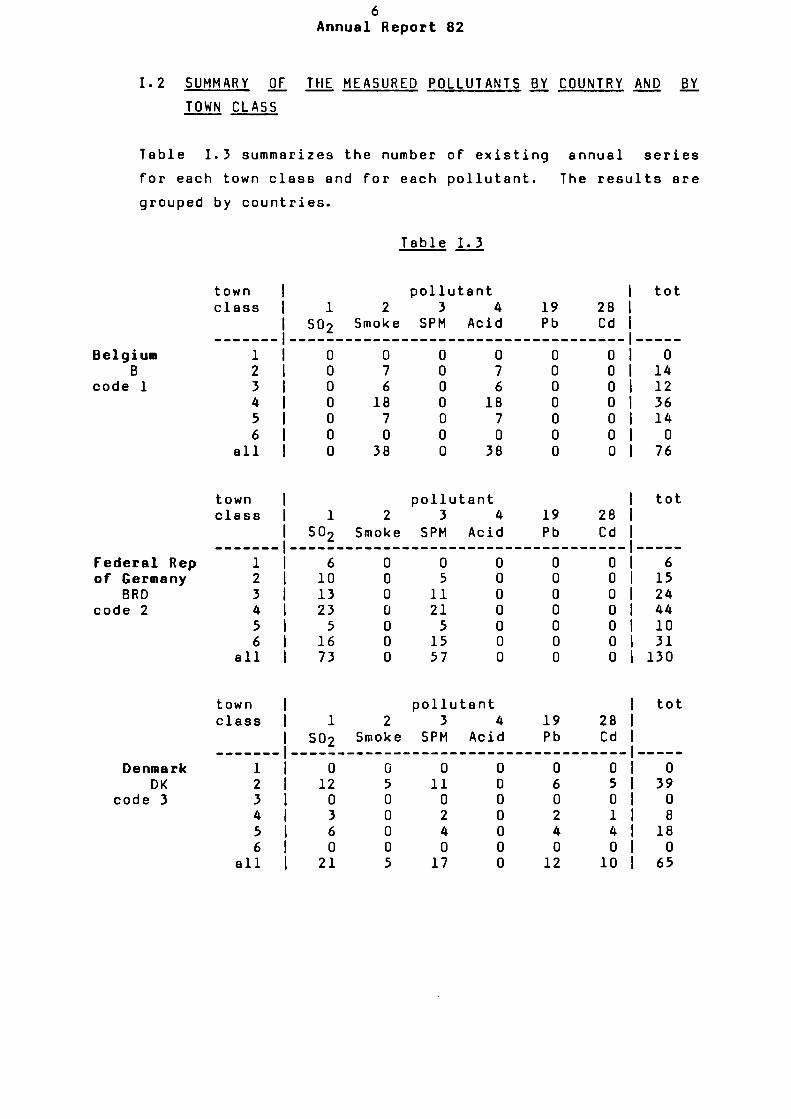
1.2 SUMMARY OF THE MEASURED POLLUTANTS BY COUNTRY AND BY TOWN CLASS
Table 1.3 summarizes the number of existing annual series for each town class and for each pollutant. The results are grouped by countries.
Table 1.3
Belgium Β
code 1
Federal Rep of Germany
BRD code 2
Denmark DK
code 3
town | p o l l u t a n t | t o t c l a s s | 1 2 3 4 19 28 I
| SO2 Smoke SPM Acid Pb Cd I
i l o 0 0 0 0 O l O 2 I 0 7 0 7 0 0 | 14 3 | 0 6 0 6 0 0 | 12 4 | 0 18 0 18 0 0 | 36 5 | 0 7 0 7 0 0 | 14 6 ι 0 0 0 0 0 0 | 0
a l l | 0 38 0 38 0 0 I 76
town | p o l l u t a n t 1 t o t c l a s s | 1 2 3 4 19 28 I
1 S 0 2 Smoke SPM Acid Pb Cd |
1 I 6 0 0 0 0 0 | 6 2 I 10 0 5 0 0 0 I 15 3 | 13 0 11 0 0 0 | 24 4 | 23 0 21 0 0 0 1 44 5 | 5 0 5 0 0 0 1 10 6 | 16 0 15 0 0 0 | 31
a l l I 73 0 57 0 0 0 I 130
town | p o l l u t a n t 1 t o t c l a s s | 1 2 3 4 19 28 I
1 SO2 Smoke SPM Acid Pb Cd I
i l o 0 0 0 0 O l O 2 | 12 5 11 0 6 5 | 39 3 1 0 0 0 0 0 0 1 0 4 | 3 0 2 0 2 1 | 8 5 | 6 0 4 0 4 4 | 18 6 | 0 0 0 0 0 0 | 0
a l l I 21 5 17 0 12 10 I 65

Annual Report 82
France F
code 4
Ireland IRL
code 5
town class
1 2 3 4 5 6
all
town class
1 2 3 4 5 6
all
1 SO-2 0 0 0 0 0 0 0
1 so 2 0 0 0 0 0 0
I o
2 Smoke
5 4 4 6 0 0 19
2 Smoke
0 0 6 1 2 0 9
pollu 3
SPM 0 0 0 0 0 0 0
pollu 3
SPM 0 0 0 0 0 0 0
tant 4
Acid 5 4 4 18 3 0 34
tant 4
Acid
0 0 6 1 2 0 9
19 Pb 0 0 0 0 0 0 0
19 Pb 0 0 1 0 0 0 1
28 Cd 0 I 0 0 0 0 0 0
28 Cd 0 0 0 0 0 0 0
tot
10 8 8 24 3 0 53
tot
0 0 13
I 2 ! 4 I o I 19
Italy I
code 6
town class
1 2 3 4 5 6
all
1 S02 6 3 1 4 1 0 15
Ρ S ollut 2
moke
0 0 0 0 0 0 0
ant 3
SPM 0 4 0 4 0 0 8
4 Acid
0 0 0 0 0 0 0
19 Pb 0 0 0 0 0 0 0
28 Cd 0 0 0 0 0 0 0
tot
6 7 1 8 1 0 23
Luxembourg L
code 7
town class
1 2 3 4 5 6
all
1 so 2 0 0 0 0 0 0 0
Ρ S
ollut 2
moke 0 0 0 0 4 1 5
ant 3
SPM 0 0 0 0 0 0 0
4 Acid
0 0 0 0 4 1 5
19 Pb 0 0 0 0 0 0 0
28 Cd 0 0 0 0 0 0 0
tot
0 0 0 0 8 2 10
8 Annual Report 82
The Netherlands
NL code 8
town class
1 2 3 4 5 6
all
1 S02 0 0 13 7 6 7 33
Ρ S ollut 2
moke
0 0 0 0 0 0 0
ant 3
SPM 0 0 0 0 0 0 0
4 Acid
0 0 0 0 0 0 0
19 Pb 0 0 0 0 0 0 0
28 Cd 0 0 0 0 0 0 0
tot
0 0 13 7 6 7 33
United Kingdoa
UK code 9
town class
1 2 3 4 5 6
all
1 SO-2 0 0 0 0 0 0 0
pollut 2
Smoke 17 9 9 19 8 8 70
ant 3
SPM 0 0 0 0 0 0 0
4 Acid 17 9 9 19 8 7 69
19 Pb 0 0 0 0 0 0 0
28 Cd 0 0 0 0 0 0 0
tot
34 18 18 38 16 15
139
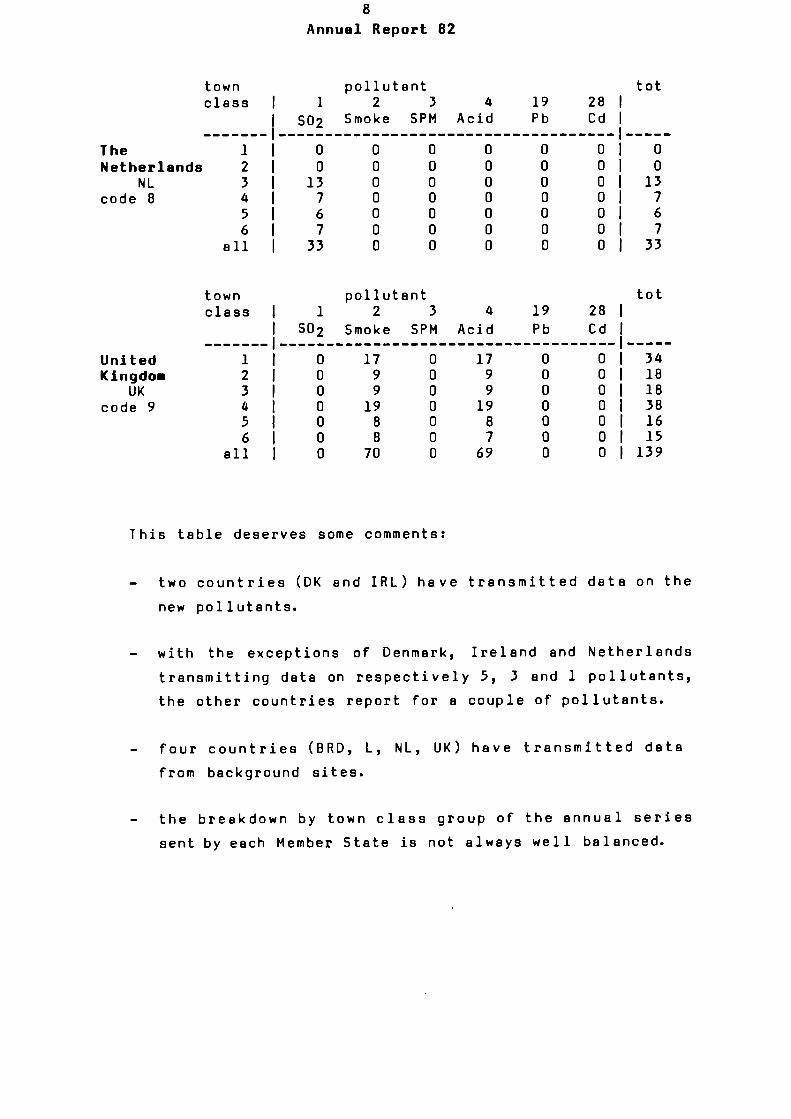
This table deserves some comments:
two countries (DK and IRL) have transmitted data on the new pollutants.
with the exceptions of Denmark, Ireland and Netherlands transmitting data on respectively 5, 3 and 1 pollutants, the other countries report for a couple of pollutants.
four countries (BRD, L, NL, UK) have transmitted data from background sites.
the breakdown by town class group of the annual series sent by each Member State is not always well balanced.

Annual Report 82
Figure 1.2.1 shows the breakdown of the annuel series by country. One can observe that the amount of annual series is not proportional to the geographic area of each Member State .
PROPORTION OF SERIES BY COUNTRY PERIOD: 0ctB1-Sept82
UK (25.+X)
NL (6.0*)
Β (13.03)
BRD (23.7X)
F (9.7*) DK (11.9*)
F i g . I . 2 . 1

10 Annual Report 82
1.3 BREAKDOWN OF THE ANNUAL SERIES BY THE MEASUREMENT TECHNIQUE CODES
The measurement technique codes used by each Member State for the year 82 are compared in Table 1.4 in terms of annual series. The results are grouped by pollutants.
Table I.4 No. of annual series for SO;
country code TM |
1 2 3 4 5 6 7 9
10 12 13 20 21 22 24 26 27 28 29 all
1 Β 0 0 0 0 0 0 0 0 0 0 0 0 0 0 0 0 0
1 0 0
1 0
2 BRD 0 0 6 10 3 4 2 14 5 6 15 0 0 0 0 8 0 0 0 73
3 DK 5 0 0 0 0 0 0 0 0 0 0 0 0 0 0 0
12 1 3
21
4 F 0 0 0 0 0 0 0 0 0 0 0 0 0 0 0 0 0 0 0 0
5 IRL 0 0 0 0 0 0 0 0 0 0 0 0 0 0 0 0 0 0 0 0
6 I 0 0 0 0 0 0 0 0 0 0 0 6 3 3 3 0 0 0 0 15
7 L
0 0 0 0 0 0 0 0 0 0 0 0 0 0 0 0 0 0 0 0
8 NL 0 33 0 0 0 0 0 0 0 0 0 0 0 0 0 0 0 0 0 33
9 I UK 0 0 0 0 0 0 0 0 0 0 0 0 0 0 0 0 0 0 0 0
tot
5 33 6
10 3 4 2 14 5 6 15 6 3 3
| 3 1 8 1 12 1 1
3 1 142
No. of annual series for Smoke country code
TM
1 2 3 4 5 6 7
10 all
1 Β 0 0
38 0 0 0 0 0
38
2 BRD
0 0 0 0 0 0 0 0 0
3 DK 0 5 0 0 0 0 0 0 5
4 F 0 0 0 0 0 0 0 19 19
5 IRL 0 0 0 6 2 1 0 0 9
6 I 0 0 0 0 0 0 0 0 0
7 L 5 0 0 0 0 0 0 0 5
8 NL 0 0 0 0 0 0 0 0 0
9 UK 0 0 0 0 0 0 70 0 70
tot
5 5 38 6 2 1 70 19 146

11 Annual Report 82
No. of annual series for 5PM country code
TM
1 2 3 5 6 8
15 25 26 47
all
1 Β
0 0 0 0 0 0 0 0 0 0
0
2 BRD
0 9 3 1
10 14 0 7
13 0
57
3 DK
5 0 0 0 0 0 0 0 0 12
17
4 F
0 0 0 0 0 0 0 0 0 0
0
5 IRL
0 0 0 0 0 0 0 0 0 0
0
6 I
0 0 0 0 0 0 8 0 0 0
8
7 L
0 0 0 0 0 0 0 0 0 0
0
8 NL
0 0 0 0 0 0 0 0 0 0
0
9 UK
0 0 0 0 0 0 0 0 0 0
0
tot
5 9 3 1 10 14 8 7
13 12
82
No ♦ of annual series for Acid country code
Τ M
1 3 4 5 5 7 8
11
all
1 Β
0 38 0 0 0 0 0 0
38
2 BRD
0 0 0 0 0 0 0 0
0
3 DK
0 0 0 0 0 0 0 0
0
4 F
0 0 0 0 0 0 22 12
34
5 IRL
0 0 6 2 1 0 0 0
9
6 I
0 0 0 0 0 0 0 0
0
7 L
5 0 0 0 0 0 0 0
5
8 NL
0 0 0 0 0 0 0 0
0
9 UK
0 0 0 0 0
69 0 0
69
tot
5 38 6 2 1
69 22 12
155
No. of annual series for Lead country code
TM
1 2
all
1 Β 0 0
0
2 BRD
0 0
0
3 DK 12 0
12
4 F 0 0
0
5 IRL 0 1
1
6 I 0 0
0
7 L
0 0
0
8 NL 0 0
0
9 UK 0 0
0
tot
12 1
13

12 Annual Report 82
No. of annual series for Cadmium country code
TM
1 11
1 Β 0 0
2 BRD 0 0
3 DK 10 10
4 F 0 0
5 IRL 0 0
6 I 0 0
7 L
0 0
8 NL 0 0
9 UK 0 0
tot
10 10
It is striking to note that a same technique code is never used by at least two countries. However, one must bear in mind that the codes of measurement technique also cover the sampling, the calibration and in some cases, the laboratory or the organization responsible for the analysis. For most countries, the measurement codes are well harmonized. For example, in UK: the 69 series concerning Acid are reported with the same code. However, in the case of BRD, for pollutant 5PM, 7 measurement codes are reported.
Although it does not appear in this table, it is also worth noting that 4 stations of Denmark measure SO2 according to two different measurement techniques. These stations as well as the techniques used are presented in Table 1.5:
Table 1.5 Station Town identifier name
TM Measurement technique
PPCVVSSS 03201103
03402915
03501565
03503351
Kobenhaven
Odense
Esbjerg
Naestvest
27 colorimetrie 28 coulometric 27 colorimetrie 29 UV fluorescence 27 colorimetrie 29 UV fluorescence 27 colorimetrie 29 UV fluorescence

13 Annual Report 82
For more details about the measurement techniques, the reader should refer to the Descriptive Table of the Commission.
Figures 1.3.1 to 1.3.4 (see list of Figures) present the coefficients of correlation and the orthogonal regression lines for the four stations. It appears that the techniques 27 and 29 are #better correlated than the techniques 27 and 28.
The content of the exchange of information summarized in this chapter corresponds well to the Decision of the Council 82/459/EEC. However, one must point out that the set of values in this exchange does not necessarily reflect the real situation of the atmospheric pollution in the European Communities for the following reasons:
only a selection of measurement stations the majority of the stations are in urban areas the average is not equivalent in each Member State the policy for placing stations differs between Member States and even regions or towns.

H Annual R e p o r t 82
1 .4 THE MONTHLY MEDIAN
B e f o r e any t r e a t m e n t i s made on t h e d a t a r e c e i v e d f r o m t h e
Member S t a t e s , a r e d u c t i o n o p e r a t i o n i s n e c e s s a r y t o o b t a i n
a u s e f u l and i n t e r p r e t a b l e p a r a m e t e r .
One s u c h r e d u c t i o n p a r a m e t e r i s t h e m o n t h l y m e d i a n , w h i c h
g i v e s t h e m i d d l e v a l u e o f t h e r a n k e d d a i l y d a t a . The t a b l e s
o f A n n e x 1 c o n t a i n t h e l i s t o f t h e m o n t h l y m e d i a n s f o r e a c h
s t a t i o n . ·
The r e s u l t s a r e compu ted on t h e b a s i s o f t h e v a l u e s r e c e i v e d
( u n s e l e c t e d ) by t h e C o m m i s s i o n . The m e a s u r e m e n t u n i t s a r e
t h e m i c r o g r a m / m 3 f o r S 0 2 , S m o k e , SPM and A c i d w h i l e t h e v a l u e s f o r Pb and Cd a r e e x p r e s s e d i n n a n o g r a m / m ^ .
The r e p r e s e n t a t i v i t y o f t h e med ian v a l u e s i s r e l a t e d t o t h e
number o f d a i l y measu red v a l u e s and t h i s r e p o r t shows t h a t a
l a r g e n u m b e r o f a n n u a l s e r i e s a r e n o t c o m p l e t e . I n
p a r t i c u l a r , no d a t a f o r 82 a p p e a r f o r F r a n c e .

15 Annual Report 82
1.5 CHARACTERISTICS OF THE ANNUAL SERIES
Annex 2 summarizes the characteristical occurrences shown by the series. Some parameters presented in this Annex are chosen in order to point out peculiar values and others to disclose discountinuous series. It also emphasizes the resolution of the measurement.
Comments on the column headings:
1.5.1 There are several labels used in the records of the data bank to codify days without measured values:
"BLANK" a five letter code used for a day with no valid measurement for any reason. "REP" a three letter code used to indicate a single measurement over several days or hours. (Space) a five spaces field is put in the records to symbolize a non existing day in the year (e.g 31st September). Normally each station should report 7 fields "space" for the period October 81-September 82.
Rem : only France, Ireland and the United Kingdom use the "REP" label.
1.5.2 Several limit values are pointed out in this Annex as: null values (zero); values higher than 9999 measurement units; the minimum value and the occurrence of the minimum.
From an analytical point of view, null values have no meaning and one should preferably speak about "below the detection limit". To estimate the detection limit value of each station, the minimum value and its occurrence are reported. 9999 measurement units were chosen as an upper limit above which values become unlikely and hence require confirmation from the appropriate Member State.

16 Annual Report 82
1.5.3 The practical accuracy of a series is characterized by the number of discontinuities in a fixed range of the frequency distribution (gap) and by the number of missing digits (dig) (see explanation page A2.1 and A2.2). For example: 21 stations seem to report specific SO2 to the nearest 10 microgram/m' than to the nearest microgram/m^ (9 digits are missing in the units).
1.5.4 The last column gives a status code for each series. This code number is used to classify the series according to the following hierarchical condition:
hierarchical condition status code
no. of month < 12 1 no. of "BLANK" + space > 177 2 no. of val. with concentration 3 > 9999 measurement units no. of measured values + REP < 240 4 no. of REP > 104 5 else 0
This status code will be used as a reject code in the subsequent treatments.
Some of the results presented in Annex 2 are illustrated in the following histograms.
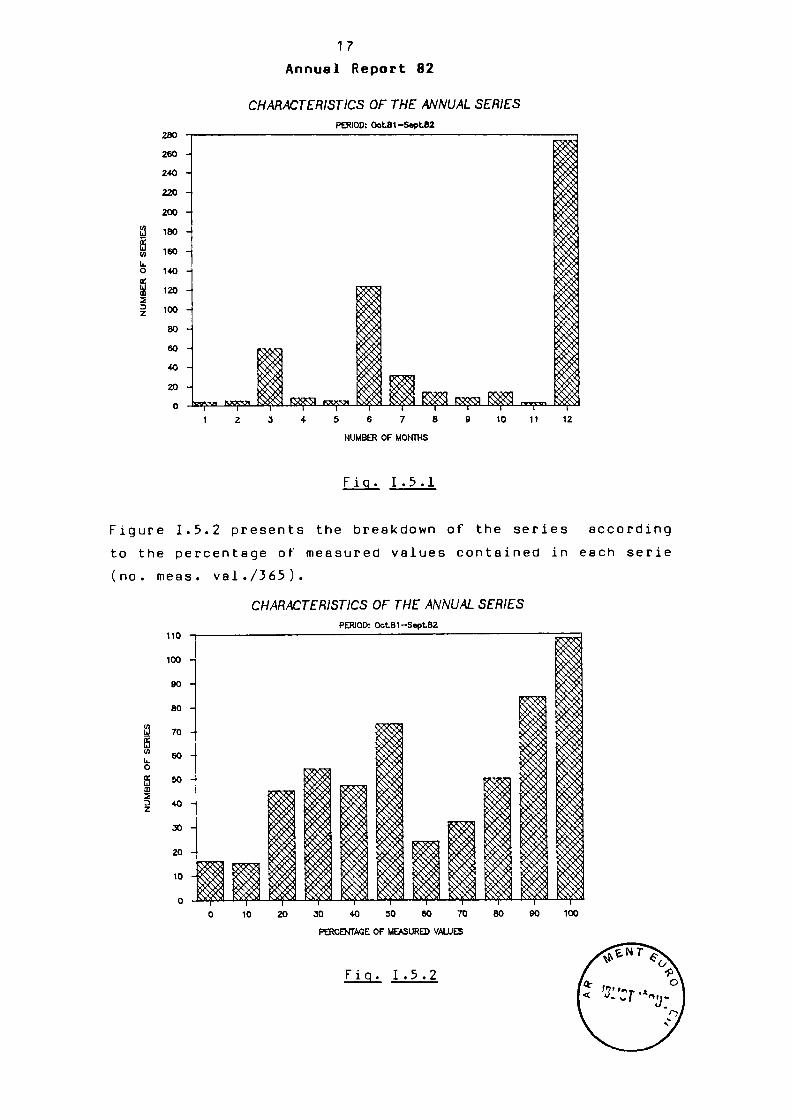
Figure 1.5.1 shows the breakdown of the annual series with respect to the number of months contained in each series. Besides the peak at 12 months, two other peaks are noticeable. The first one (3 months) is mainly explained by the lack of data for 82 from France. The peak at 6 months is mainly caused by the modifications and changes of stations which have occurred in Denmark and United Kingdom in March and April 82.
¡3 S l/l u. o
2B0 260 240
220
200 180
160
140 120
100
80 60 40
20 0
17
A n n u a l R e p o r t 82
CHARACTERISTICS OF THE ANNUAL SERIES PERIOD: 0ot81SaptB2
oqyoi IWyo» J323_EZKSL ressi 10 11
NUMBER OF MONTHS
Fiq. I.5.1
Figure 1.5.2 presents the breakdown of the series according to the percentage of measured values contained in each serie (no. meas. val./365).
CHARACTERISTICS OF THE ANNUAL SERIES PERIOD: 0ctB1-Sept82
a fi ΙΛ L. O S ID 2 D Ζ
10 20 30 40 50 60 70
PERCENTAGE OF MEASURED VALUES
F i g . I . 5 . 2

18 Annual Report 82
Compared to the previous figure, this histogram is characterized by a smoother distribution of the number of stations between the different classes.
Figure 1.5.3 presents the cumulated percentages of series containing β certain proportion of "BLANK" labels. The percentage of BLANK is determined by the ratio between the number of BLANK and the number of days with a measurement plus the number of BLANK (no. BLANK/(no. BLANK ♦ no. meas, val.)).
One can observe that at least 75% of the series for SO2, Smoke, SPM and Acid contain less than 20% of BLANK. Furthermore the percentages of complete series (class 0%) are higher for Smoke and Acid than for SO2
a n d S P M . N o conclusion can be drawn for Lead and Cadmium as the number of series is very low.
fe
CHARACTERISTICS OF THE ANNUAL SERIES PERIOD: Oct81-Sept82
F i g . 1.5.3

19 Annual Repor t 82
I .6 TECHNICAL REMARKS
The f o l l o w i n g t e c h n i c a l r e m a r k s c a n be made a b o u t t h e 548
a n n u a l s e r i e s :
1 . 6 . 1 Two c o u n t r i e s h a v e t r a n s m i t t e d d a t a c o r r e s p o n d i n g t o
an a v e r a g i n g t i m e o f l e s s t h a n 2 4 h o u r s f o r S 0 2 ·
D e n m a r k has s u b m i t t e d s e m i - h o u r l y d a t a f o r SO2
measured a c c o r d i n g t o t h e measurement t e c h n i q u e s 28
and 2 9 . The N e t h e r l a n d s has t r a n s m i t t e d a l l t h e 82
d a t a as h o u r l y d a t a . I n b o t h c a s e s , t h e y h a v e b e e n
r e d u c e d t o d a i l y d a t a by t h e C o m m i s s i o n .
1 . 6 . 2 When t h e f i r s t day o f a m o n t h c o r r e s p o n d s t o a "REP"
l a b e l , t h i s REP i s r e p l a c e d by t h e l a s t p r e c e e d i n g
non "REP" l a b e l . I t means t h a t t h e n u m b e r o f REP
p r e s e n t e d i n A n n e x 2 i s p o s s i b l y u n d e r e s t i m a t e d . On
t h e o t h e r h a n d , t h e n u m b e r s o f v a l u e s and " b l a n k "
l a b e l s a r e p o s s i b l y o v e r e s t i m a t e d .
1 . 6 . 3 Amongst t h e m o n t h l y r e c o r d s where REP l a b e l s a p p e a r ,
392 c o n t a i n t h e f o r m a t 'REP ' and 33 t h e f o r m a t
' R E P ' . The f o r m a t ' REP * has n o t been u s e d .


21 Annual Report B2
II. TREATMENT OF THE SELECTED SERIES
II.1 INTRODUCTION
This chapter is divided into three major topics: non parametric statistics, parametric statistics, and some characteristics of the time series. Each one of the above topic is accompanied by Annexes and Figures as described further.
Table II.1 summarizes the number of series associated with one of the reject code described in Annex 2.
Table II.1
Β BRD DK F IRL I GDL NL UK
country
1 2 3 4 5 6 7 8 9
total
0 62 118 0 0 8 9 8 32 30
267
, 1
12 8
65 53 11 13 2 1
109 274
reject 2 2 3 0 0 0 1 0 0 0 6
code 3 0 0 0 0 0 0 0 0 0 0
4 0 1 0 0 0 0 0 0 0 1
5 0 0 0 0 0 0 0 0 0 0
total
76 130 65 53 19 23 10 33
139 548
The series associated with the code 1, 2, 3 and 4 are rejected in the subsequent treatments. The reader should refer to 1.5.4 for the signification of these reject codes. After the application of the selection criteria, 274 series out of 548 (50S) are thus included in the following statistical treatments. When the results are reported with respect to the country, one can see that:

22 Annual Report 82
- France has not transmitted the data for 82 - No series have been retained for Denmark. A number of
stations have started reporting to the exchange in 82 only. Furthermore the other stations have modified their measurement technique.
- United Kingdom has changed several stations participating in the exchange of information in 82. This explains that only 22% of the series for this Member State have been selected.
It is expected that the next annual report 1983 will be more complete after the changes in the different networks.
Figure II.1.1 shows the proportion of rejected and selected series by pollutant. No series have been retained for Lead and Cadmium in this report.
S o s 3 Ζ
EVALUATION OF THE SELECTION PERIOD: 0cL81-SaptB2
S02 Smok·
SELECTED SERIES
SPM Aeld
POU 31±ϋ]ΜΓ REJECTED SERIES
Fig. II.1.1
Before presenting the results of the treatments, it is important to underline three remarks:

23 Annual R e p o r t 82
t h e r e p r e s e n t a t i v i t y o f t h e p a r a m e t e r s u s e d i s
d e p e n d e n t o f t h e n u m b e r o f m e a s u r e d v a l u e s . The
s e l e c t i o n p e r f o r m e d p r e v i o u s l y g u a r a n t e e s a minimum
o f 240 d a i l y v a l u e s .
t h e s t a t i s t i c s p e r f o r m e d i n t h i s r e p o r t a r e o n l y
d e s c r i p t i v e s t a t i s t i c s , a n d n o t i n f e r e n t i a l
s t a t i s t i c s . T h a t i s , t h e p a r a m e t e r s p r e s e n t e d a r e
r e d u c t i o n s o f t h e s a m p l e o f t h e measu remen ts s e n t by
e a c h M e m b e r S t a t e , a n d n o t e s t i m a t o r s o f t h e
e f f e c t i v e p o l l u t i o n l e v e l o f t h e a r e a c o v e r e d by t h e
s t a t i o n .
some p a r a m e t e r s l i k e t h e k u r t o s i s may a p p e a r t o be
s o p h i s t i c a t e d . H o w e v e r t h e s e p a r a m e t e r s a r e
p r e s e n t e d i n t h i s r e p o r t b e c a u s e t h e y show t h e
c h a r a c t e r i s t i c s o f t h e d i s t r i b u t i o n o f t h e a i r
p o l l u t i o n v a l u e s .

24 Annual Report 82
II .2 NON-PARAMETRIC STATISTICS
Annex 3 gives the yearly percentiles 25, 50, 75, 95, 98 computed for the selected series and both the maximum and the minimum value recorded for each serie.
This Annex should be compared with the plot of the median, the interquartile range and the 98 percentile for each series presented in the Fig. II.2.1 to II.2.9. Such a presentation gives an idea of the dissymetry to the left of the distribution. It also allows rapid comparison of the whole set of series grouped by pollutant. For example, the medians appearing in Fig. II.2.4 are quite homogeneous whereas the percentile 98 fluctuates between 28 and 273 microgram/m^.
Apart from the general comparison plot of the percentiles, two groups of scattered diagrams are presented for each pollutant, in the Fig. II.2.10 to II.2.17.
The first group (Fig. II.2.10 - II.2.13) concerns the correlation between central tendency parameters (median) and a marker of the higher values (percentile 98). It is interesting to point out in Fig. II.2.11 that the values seem to be grouped in different zones by country. The same remark applies but to a less extent to Fig. II.2.13.
The second group (Fig. II.2.14 - II.2.17) concerns the correlation between central tendency parameters (median) and a central dispersion tendency parameter (interquartile range). These diagrams are very interesting. For example, the sharp distribution of point found in Fig. II.2.15 seems to point out a repetitive frequency distribution for the sample central part.

25 Annual Repor t 82
The r e l a t i o n b e t w e e n t h e m e d i a n a s s o c i a t e d w i t h a t o w n and
t h e t o w n c l a s s i s p r e s e n t e d i n F i g . I I . 2 . 1 8 . T h e
i l l u s t r a t i v e l a b e l used i s t h e c o u n t r y code .
The r e l a t i o n s h i p be tween t h e g l o b a l med ian v a l u e compu ted by
town c l a s s and t h e town c l a s s i t s e l f i s v a r i a b l e . However i t
i s w o r t h n o t i n g t h a t t h e b a c k g r o u n d s i t e s a r e a l w a y s
a s s o c i a t e d w i t h l ow c o n c e n t r a t i o n s l e v e l f o r each p o l l u t a n t ,
e x c e p t f o r SPM i n c o u n t r y 2-BRD.

26 Annuel Report 82
II.3 PARAMETRIC STATISTICS
Annex 4 gives some descriptive statistics computed for the selected series. The mean, the standard deviation, the variation coefficient, the skewness, a shape estimator, and the kurtosis.
II.3.1 Definitions
A succinct description of the descriptive parameters computed is listed below (see definition in Comparative study on data analysis part 2: Descriptive statistics and data reduction Technical Report no 2, April 1984, APREÇO).
MEAN Label used: mean The mean is the most common measure of central tendency for variable measured at intervallevel. Often referred to as the "average", it is merely the sum of the individual values for each case divided by the number of cases.
STANDARD DEVIATION Label used: std.d The standard deviation is a measure of the dispersion of the data about the mean of an in ter ν a 1 1 e ν e 1 variable. This statistic is one way of measuring how closely the individual scores of the variable cluster around the mean. The standard deviation has the same units as the original variable.
VARIATION COEFFICIENT Label used: The variation coefficient is β relative measure of the dispersion (without units).
V = std.d / mean
SKEWNESS: Label used: skew Skewness measures deviation from symmetry. The measure of skewness will take on a value of zero when the distribution is completely symmetrical. A positive value indicates that

27 Annual Report 82
the cases are clustered more to the left of the mean with most of the extreme values to the right. A negative value indicates clustering to the right. For example, a normal distribution is completely symmetrical and has a skewness value of zero. A lognormal distribution is dissymmetrical with a positive value for skewness.
SHAPE ESTIMATOR: L a b e l u s e d : D
The skewness and t h e k u r t o s i s a r e u s u a l l y a p p l i e d t o compare
t h e r e l a t i v e f r e q u e n c y f u n c t i o n w i t h t h e t h e o r e t i c a l l y
n o r m a l d i s t r i b u t i o n . S i n c e o t h e r shape may a l s o be e x p e c t e d ,
an e s t i m a t o r D o f t h e f r e q u e n c y d i s t r i b u t i o n s h a p e i s
d e f i n e d :
D r skew / (V (V2 + 3) )
D has the following properties: D = 0 normal distribution D = 0.364 Maxwell D = 0.37 Rayleigh D = 0.5 Chi-Square with 2 degrees of freedom D = 0.6 Chi-Square with 6 degrees of freedom D = 1 log-normal.
KURTOSIS L a b e l u s e d : k u r t
K u r t o s i s i s a measu re o f t h e r e l a t i v e p e a k e d n e s s o r f l a t n e s s
o f t h e c u r v e d e f i n e d by t h e d i s t r i b u t i o n .
A n o r m a l d i s t r i b u t i o n w i l l h a v e a k u r t o s i s o f z e r o . I f t h e
k u r t o s i s i s p o s i t i v e , t h e n t h e d i s t r i b u t i o n i s more peaked
t h a n a n o r m a l d i s t r i b u t i o n , w h i l e a n e g a t i v e v a l u e means
t h a t i t i s f l a t e r .
Remark:
Relative descriptive parameters (such as V, skew, D, kurt) can be used to compare stations or pollutants without any assumption of conversion factors.

28 Annual Report 82
II.3.2 Histograms; (Fig. II.3.1 to II.3.7)
The histograms corresponding to each of the above parameters are presented in Fig. II.3.1 to II.3.7. The histograms of the medians have also been included in these figures. Some examples of comments are given below.
MEDIAN (Fig. II.3.2) Compared to the mean, the shift of the median to the left illustrates the dissymmetry of the distributions.
VARIATION COEFFICIENT (Fig. II.3.4) The maximum of the annual variation coefficient lies in a small range of value:
pollutant range value of the max. annual V
S0 2
Smoke SPM Acid
0.9 - 1.1 0.7 - 0.9
0.7 0.5 - 0.7
SKEWNESS (Fig. II.3.5) All the annual series for each pollutant have a positive skewness. This fact indicates that the frequency distribution is dissymmetrical with left clustering. Many stations are reporting an annual skewness in the range of:
pollutant range value of the max. skewness
S02 Smoke SPM Acid
2.4 - 3.2 2.0 - 2.4 1.2 - 1.6 1.2 - 2.0

29 Annual Report 82
5 to 10% of stations reporting measurement for S02> Smoke and Acid have an annual skewness higher than 5. This high spreading of the frequency distribution discloses for these stations the effect of high pollution events during this year.
SHAPE ESTIMATOR (Fig. II.3.6) As a general rule for all pollutants, the frequency distribution is far from a normal distribution (DsO) and not precisely a log-normal distribution (D=l). The annual shape estimator lies in the range of 0.6 to 0.8 as a chi-square with a large degree of freedom (0.67). But further statistical analysis have to be done before a conclusion is drawn.

30 Annuel Report 82
II.4 CHARACTERISTICS OF THE TIME SERIES
Annex 5 contains some characteristics of the time series: the ratio of the number of summer to winter measurements, the seasonal percentiles 50 and 98, the parameters of the annual regression line and the number of the 3 days persistence for a end 98, the parameters of the annual regression line and the number of the 3 days persistence for a concentration value higher than 125 microgram/m3. The winter is defined as the period October 81 to March 82 and the summer, the period April 82 to September 82. Remark ; This is an arbitrary balanced splitting of the year. In fact, seasonal periodicity can only be detected by a spectral analysis of a time serie performed over several years (e.g.: in a Summary Report). The scatter diagrams between the median and the percentile 98 are drawn for both seasons (Fig. II.4.1 to II.4.8).
E xample of explanation for Fig. 11.4.1 ^ 11.4.8 : Irrespective of the number of measurements made, the scatter of high values happens systematically in winter for S02, Smoke and Acid; in the case of SPM, this differentiation is not as clear as for the other pollutants.
The Fig. II.4.9 to II.4.12 compare the percentiles of the winter and the summer period. The orthogonal regressions are given for indicative purposes. The outliers labelled with an arrow are not included in the calculation of the regression line. For S02, Smoke and Acid, the discrepancy between winter and summer seems to be systematic. The parameters used are higher in winter than in summer. In the case of SPM, the 98 percentile seems to be higher in winter than in summer while no evidence appears for the median. It is also worth noting that, except for Acid, the slopes of the regression lines of the 98 percentile are

31 Annual Report 82
higher than the slopes of the median. This indicates that the 98 percentile increases relatively more rapidly than the median. However one must also take into consideration the scattering of the points illustrated by the coefficients of correlation .
Annex 6 gives the status of the isolated extreme of the monthly median values. To find out a relative dispersion of the monthly median values around a central tendency, Ζ is defined as the normalized monthly median :
|X - MEAN|
STD
where the MEAN statistics is the mean of the monthly median distribution excluding the minimum and maximum, and the STD.D statistics is the standard deviation of this distribution. Each normalized median value has been ranked from -5 to 5 according to the following intervals:
1 2 3 4 5
if if if if if
Ζ Ζ Ζ Ζ Ζ
> > > > >
2.33 2.88 3.09 3.71 3.99
and and and and
Ζ Ζ Ζ Ζ
< < < <
2.88 3.09 3.71 3.99
standard deviation standard deviation standard deviation standard deviation
The minus sign is given when the calculated montly value is lower than the MEAN, the sign + when the value is higher. The variation range of the scale is thus extending from - 5 (minimum value at more than 3.99 standard deviation from the MEAN) to + 5 (maximum value at more than 3.99 standard deviation from the MEAN).
Tables of Annex 6 point out monthly values at least at 2.33 standard deviation from the MEAN tendency. The boxes left

32 Annual Report 82
empty represent thus the monthly medians with values lower than 2.33. Fig. II.4.13 illustrates the Annex 6 and presents the average value for each month. For all pollutants there are more exceptional higher than lower months; this is confirmed by the distribution of the skewness described in Chapter II.3.
For SO2» Smoke and Acid, exceptional high pollution events are more frequently observed in December, January and February. SPM is characterized by a very high average value in February. It is also worth noting that the maximum average value is also observed in February for SO2, Smoke and SPM.

33 Annual Report 82
FIGURES
Unselected series
Correlation diagrams between 1.3.1 to 1.3.A measurement techniques
Selected series
Non-parametric statistics Global representation of the II.2.1 to II.2.9 percentiles 25,50,75,98 (see corresponding Annex 3) Correlation diagrams between II.2.10 to II.2.17 the median and the percentile 98, and between the median and the interquartile range Global median value by town II.2.18 classes
Annual parameters
Histograms of the descriptive II.3.1 to II.3.7 parameters listed in Annex 4
Characteristics of the time series
Correlation diagrams between II.4.1 to II.4.8 the seasonal median and the percentile 98 Correlation diagrams II.4.9 to II.4.12 - between the winter and summer median
- between the winter and summer percentile 98
Isolated extreme of the monthly II.4.13 median

34
Annual Report 82
COMMENTS ON FIG. 1 . 3 . 1 TO I . 3 . 4
F i g u r e s 1 .3 .1 t o 1 .3 .4 p r e s e n t t h e c o e f f i c i e n t of
c o r r e l a t i o n and t h e o r t h o g o n a l r e g r e s s i o n l i n e s f o r f o u r
s t a t i o n s of Denmark u s i n g two d i f f e r e n t m e a s u r e m e n t
t e c h n i q u e s for SO2·
The s t a t i o n s and t e c h n i q u e s a r e t he f o l l o w i n g :
Tab le 1.5
Station Town identifier name
TM Measurement technique
PPCVV5SS 03201103
03402915
03501565
03503351
Kobenhaven
Odense
Esbjerg
Naestvest
27 colorimetrie 28 coulometric
27 colorimetrie 29 UV fluorescence 27 colorimetrie 29 UV fluorescence 27 colorimetrie 29 UV fluorescence
For more details, the reader should refer to the Descriptive Tables of the Commission.

35
Κ) ε \ Ο»
2 Ο
Ο
CORRELATION BETWEEN TM 27 AND 2Ô STATION 03201103 - POL· 01
υυ
8 0
BO
/O
oo
»JO
ZÜ —
10 —
0
D DI
/
D
Π I
D ]
Η
/°Ί
π
π
π
1 I
D D G
Π
I
i n 1 DOT
1
5$Γ< ] u m *
ι D
D
D
ΠΠ
'D o /
ca 4i
' n D
η ( j
D
D
' D D
D
/
/
0
Π
D
/ /
/
orthogonal regression l ine n: 137 slope: 1.35 i n t . : -10.1 yg/m
3
corr .coef f . : 0.377
Π I
20 40 60
concentration TM27 (microg/m3)
Fig. 1.3.1
80 100
E
ρ
a CN
100
CORRELATION BETWEEN TM 21 AND 29 STATION 03503351 - POL· 01
40 60
concentration TM27 (microg/m3) 100
Fig. 1.3.2

36
io E Ν Oí
ε o
ro E \ ε o Ë ? d c o o
100
90
80
70
60
50
40
30
20
10
0
100
90
80
70
60
50
40
30
20
10
0
CORRELATION BETWEEN TM 27 AND 29 STATION 03501565 - POL: 01
E
D D
Β iC
ïï
π D
□ π
JjEJJ
lin" Ρ D
[
π D
D jx
ngjn
1 D
D
I
u c
'U
π
u /
D D
D
y
/
π
D
D /
/
/
O orthogonal regression l ine
η: 202 slope: 1.18 i n t . : 0.92 ţig/m
3
corr .coef f . : 0.865
20 40 60 80
concentration TM27 (microg/m3)
Fig. 1.3.3
CORRELATION BETWEEN TM 27 AND 29 STATION 03402915 - POL· 01
100
Π \.
- ^
orthogonal regression line n: 182 slope: 1.28 int.: -5.94 pg/m3 corr.coeff.: 0.924
40 60
concentration TM27 (microg/m3)
100
F i g . 1 .3 .4

37
Global representation of the percentiles 25 50 75 98 %
Pollutant : S02 Period : Oct.81 Sept.82 Units :microg/m3
PPCVVSSS TM TOWN r 0210100S
ΟΟΘ OIS ΟΙΘ 020 02Θ
201005 007 ΟΟΘ OIO Oil 012 013 014 015 016
301003 02003 03001 04001
OOS 050S1
ΟΘ2 ΟΘ3
06001 002
401071 072
02054 03001
022 04001 0500S
007 ΟΟΘ
OSI IO 111 112
07031 08001
002 09064
065 IODI 1 110Θ5 12003
OS OS 03 03 OS 03 04 04 04 04 04 04 04 04 04 04 OS OS 05 06 07 09 og 09 26 26 09 09 og io io 06 12 12 12 IO IO 26 09 06 06 09 09 09 09 12
B E R L I N (WEST
20 40 60 80 100 120 140 160 180 200 220 240 260 280 300
Ητττ-Κ-Ητ-Η4τ ' ι T T T "T
MUENCHEN. BA
DORTMUND DUISBURG DUESSEUDORF FRANKFURTMA NUERNBERG. Β
STUTTGART AUGSBURG. ΒΑ ERLANGEN. BAI KARLSRUHE KASSEL. HESS LUDWIGSHAFEN
MANNHEIM
REGENSBURG. WIESBADEN. Η
! WUERZBURG. B| INGOLSTADT. FUERTH. BAYEJ MAINZ
■•e
«Θ
♦ e — * « Θ ► ■ < — Θ <-
<* 9 ► ■* θ -
< 0 » < — β ► «e *■
«—D ·> ■ 0 » θ ·> «0—fc « θ *
«—θ *· « o »
■.—θ
«—θ *■ "· θ ►
-—θ «· < o
fc «Θ -
■* 0 * *β—».
*—β * ■4 g *
*θ—► +Θ *■ —β » • θ ·» « — β ·■
* 510 » 380 ι» 510
* 400
» 341 • 326
» 410
* 320 h f» 325
f 328
» 330 I * 333 » 375
I J_ _L 20 40 60 80 100 120 140 160 180 200 220 240 260 280 300
Caption : < 0
25 th percentile. 50 th percentile. 75 th percentile. 98 th percentile.
Fia. II.2.1

38 Global representation of the percentiles 25 50 75 98 %
Pollutant : S02 Period : Oct. 81 Sept. 82 Units :microg/m3
PPCVVSSS TM TOWN 20
02412004 OOS
501061 02091
092 03001 04001
699001 002 003 004 005 006 007 ΟΟΘ 009 OIO 012 013 O U 015 016 024
0B101009 aio oía o u O I S 016
0 S 3 0 1 5 1 5 51S 51Θ 519 520 521 523 5 2 5
0 2 4 0 4 405
0 3 4 1 S 423
4 0 1 S 1 4 0 2 9 0 8
9 0 9 0 3 2 1 3
2 1 4
12 12 09 · 09 09 26 26 13 13 13 13 13 13 13 13 13 13 13 13 13 13 13 IO 2D 2D 20 20 20 20 0 2 0 2 0 2 0 2 0 2 0 2 0 2 0 2 0 2 0 2 02· 02 0 2 0 2 0 2 0 2 0 2
«—B
MAINZ « Q
ASCHAFFENBUR KELHEIM. BA
HEILBROENN ULM Β. R. D E U T S C H L · *
40 60 80 100 120 140 160 180 200 220 240 260 280 300 1 ι 1 ι 1 ι 1 ι 1 Ύ
» 330
β -
*θ ►
«-β—»
■ β *
MILANO
AMSTERDAM
DEN HAAG
ROTTERDAM
E N S C H E D E G R O N I N G E N TILBURG
*
J_ I
712 939 538 489 437 Θ89
20 40 60 80 100 120 140 160 180 200 220 240 260 280 300
Caption : < 0 >
25 th percentile. 50 th percentile. 75 th percentile. 98 th percentile.
Fig. II.2.2

39 Global representation of the percentiles 25 50 75 98 %
Pollutant s S02 Period : Oct.81 Sept.82 Units :microg/m3
P P C V V S S S TM TOWN 20 40 50 80 100 120 140 ISO 180 200 220 240 260 280 300
T t T τ τ -Γ-ΓΤ τττ τ τ 0 Θ 4 0 4 6 0 7
ΒΙΟ 5 0 1 5 2 Β
0 2 2 0 4 0 3 5 3 0 0 4 1 2 1 0 5 3 0 4 0 6 B 0 S
3 9 9 1 2 4 2 0 6 3 1 2 SOI 6 1 7 Θ15 9 0 1
0 2 0 2 0 2 0 2 0 2 0 2 0 2 0 2 0 2 0 2 0 2 0 2 0 2 0 2 0 2
U T R E C H T
B U S S U M D E N B O S C H H I L V E R S U M M A A S T R I C H T M I D D E L B U R G Z W O L L E L I G . A C H T E R G R
••-θ—► ♦β—·> « 0 *
< - β ► ♦ Θ - *
••-θ » «-Θ
« 0 »
« 0 ► «—θ ►
■ * · ·
·«* - 0 *
-L-UL _L J_ _L - U - L J_ _L 20 40 80 80 100 120 140 160 180 200 220 240 260 280 300
Caption : < o >
25 th percentile. 50 th percentile. 75 th percentile. 98 th percentile.
Fiq. II.2.3

40 Global representation of the percentiles 25 50 75 98 %
Pollutant ι Smoke Period ι Oct.81 Sept.82 Units : microg/m3
PPCVVSSS TM TOWN
01201001 03 BRUXELLES 002 03 οοβ os 0 1 4 O S 0 1 7 03 0 2 2 03 0 2 S OS
S01801 OS ANTWERPEN Θ 0 9 OS 8 1 2 OS 8 1 3 OS 8 1 8 OS 8 2 6 OS
401501 OS CHARLEROI 5 0 4 OS 5 0 5 O S S 0 9 OS 5 1 3 OS 5 1 4 0 3
02701 0 3 GENT 7 0 S 0 3 7 0 7 OS 7 0 9 OS 7 1 2 OS 715 OS
O S 2 0 5 OS LIEGE 2 2 9 OS 2 3 0 OS
5 0 1 6 0 5 03 BRUGGE 0 2 6 0 3 OS KORTRIJK 0 3 3 0 2 0 3 LIBRAMONT
0 5 3 0 1 0 0 7 04 DUBLIN OIO 0 4 IOS 04
501001 Οβ GALWAY 0 7 5 0 1 S 5 S Ol LUXEMBOURGV
0 2 3 5 S Ol ESCHSURALZ 0 3 3 S 0 Ol STEINFORT
699001 Ol SITE DE FOND 0 9 1 0 1 0 1 5 07 LONDON G
0 2 1 1 5 07 MANCHESTER G 2 1 S 07
2 0 2 3 2 2 07 MERSEYSIDE C 4 0 S 07
3 0 1 0 1 8 07 LEEDS 0 3 0 07
J 20 40 60 80 tOO 120 140 160 I 1 L I , I I 1 , 1 1
ι Ι ι Ι ι Ι ι Ι ι Ι ι Ι ι Ι ι Ι ι
η « Q t» « •o» » »0 », ♦
M
« 0 » · «o » ·
■ η «o » · ♦β—*> · «o » ·
« 0 » * «0 » ·
* 0 » · ,Q , #
•«θ» · o » · <ο « · ι η ι
** · «0 » · p.
«θ»· · *ο » » , Q „ #
« Q » » ■0 *» » , Q . »
ο»· * « g >.
. Q ■»
·*&*■ o < 0 ' « «0«· *
· » · <0 » » «o » * , Q , ,
«o *■ · -0 1» #" o » · 1 1 1 1 1 1 1 1 1 1 1 1 1 1 1 1 1
1. 1 1 1 1 I I I
180 200 220 240 I t i I I I I Ι ι Ι ι I
φ
! ι Ι ι Ι ι 1 1 1 l i
273
20 40 60 80 100 120 140 160 180 200 220 240
Caption : < 0 >
25 th percentile. 50 th percentile. 75 th percentile. 98 th percentile.
Fig. II.2.4

41 Global representation of the percentiles 25 50 75 98 %
Pollutant : Smoke Period : Oct.81 Sept.82 Units :microg/m3
PPCVVSSS TM TOWN 0 20 40 60 80 100 120 140 160 ΙΘ0 200 220 240 ! 1 I 1 I 1 Τ τ
0 9 3 0 3 1 3 1 0 7 d O l O l l 0 7
0 1 5 0 7 0 2 0 1 3 0 7 0 3 0 1 2 0 7 0 5 0 0 9 0 7
2 2 9 0 7 S 0 5 0 0 5 0 7
T Y N E S I D E B E L F A S T
C A R D I F F EDINBURGH T E E S S I D E
L I N C O L N
*Q ►
* 0 « ♦ β — * · « 0 —
J_ X J_ 20 40 60 80 100 120 140 180 180 200 220 240
Caption : < 25 th percentile. 0 50 th percentile. > 75 th percentile. ·* 98 th percentile.
Fig. ii.2.5

42
Global representation of the percentiIQS 25 50 75 98 X
Pollutant » SPM Period : Oct.81 Sept.82 Units :microg/m3
PPCVVSSS TM TOWN 20 40 80 Θ0 100 120 +-Γ+-Τ
140 160 ISO 200 220 240 Τ τ
0 2 2 0 1 0 0 8 0 2 ΟΙΟ 0 2 0 1 4 . 0 2 O Í S 0 2 Ο ΐ β 0 2
3 0 A 0 0 1 0 2 0 5 0 S 1 OS
0 8 2 OS ΟβΟΟΙ 2S
002 26 401071 OS 02054. OS 03001 26
022 26 OAOOl 02 05006 25
007 25 ΟΟΘ 25
06110 26 111 26 1 12 25
07031 OS ΟΘΟΟΙ 02 090S4 OS lOOll OS 110Θ5 OS 12003 25
OQ4 25 005 25
13001 26 5020S1 OS 03001 26 04001 26 05001 25
699002 OS 003 OS 004 OS 005 OS 006 OS 007 ΟΘ OOS OS oog os ΟΙΟ ΟΘ 012 OS OÍS OS Ol 4 OS
MUENCHEN. BA
FRANKFURTMA NUERNBERG. Β STUTTGART AUGSBURG. BA ERLANGEN. ΒΑ KARLSRUHE KASSEL. HESS LUDWIGSHAFEN
MANNHEIM
REGENSBURG. WIESBADEN. Η WUERZBURG. Β INGOLSTADT. FUERTH. BAYE MAINZ
FREIBERG KELHEIM. BAYj HEILBROENN ULM S P E I Z E R Β. R. D E U T S C H
·« Θ-·« Θ-
«—θ · -« θ ·>
>· θ » ·· θ —
< 8-
· ·—θ *
* -β *
—β ► « θ-
» 313
·« θ-" θ-
■ 0 » ·«—e »
* - β — * ♦ — β *
-β ·· —β-
—Θ—» - Θ — · > ♦
— Θ * · « — Θ • 354
· «—θ * « — θ ►
ι θ * ■ • — θ — *
Ι L _L _L 20 40 80 Θ0 100 120 140 180 180 200 220 240
Caption : < 25 th percentile. 0 50 th percentile. > 75 th percentile. * 98 th percentile.
Fig. II.2.6

43 Global representation of the percentiles 25 50 75 98 Ζ
Pollutant :SPM Period : Oct.81 Sept.82 Units :microg/m3
P P C V V S S S TM TOWN 20 40 60 Θ0 100 120 140 160 180 200 220 240
0 2 6 9 9 0 1 5 ΟΘ B . R. D E U T S C H 0 1 Β ΟΘ 0 2 4 2 6
0Β201001 15 TORINO 0 0 2 1 5 D O S 1 5
■· Β-
» 274 » 560 » 444
_L _L J _ 20 40 60 80 100 120 140 160 180 200 220 240
Caption : < 0 >
25 th percentile. 50 th percentile. 75 th percentile. 98 th percentile.
Fig. II.2.7

A4 Global reprQsentation of the percenti los 25 50 75 98 %
Pollutant : Acid Period : Oct. 81 Sept.82 Units :microg/m3
PPCVVSSS TM TOWN 20 40 60 80 100 120 140 160 180 200 220 240 260 280 300
Τ τ τ ητ τ 01201001
0 0 2 008 ΟΙΑ 017 022 026
301Θ01 809 812 813 818 82S
401501 504 505 509 513 514.
02701 70S 707 709 712 715
0 3 2 0 5 229 2 3 0
5 0 1 6 0 5 0 2 6 0 3 0 3 3 0 2
0 5 3 0 1 0 0 7 ΟΙΟ IOS
501001 ¡07501353
0 2 3 5 5 osseo
699001 0 9 1 0 1 0 1 5
021 15 213
2 0 2 3 2 2 406
3 0 1 0 1 8 0 3 0
OS 03 03 OS 03 03 OS 03 OS OS OS 03 03 03 03 OS 03 OS 03 OS OS 03 OS OS OS OS OS 03 OS OS 03 04. 04 04 OB Ol Ol Ol Ol 07 07 07 07 07 07 07
B R U X E L L E S
ANTWERPEN
CHARLEROI
GENT
8
«Θ ► ♦ f l — ►
*θ ' -—e • • — β — ►
Θ ·■ β ►
• — β ► ·· 8 » ·« θ ►
» θ «·
·« 8
·« β — «—8
»fl— —θ ► ·· θ
« 0
LIEGE
BRUGGE KORTRIJK LIBRAMONT DUBLIN
GALWAY LUXEMBOURGV E S C H S U R A L Z S T E I N F O R T SITE DE FOND LONDON G MANCHESTER G
MERSEYSIDE C
L E E D S
■· B
*—8— >· 8« 0 »
—-Θ—-
«—θ—» 8 ►
«0» · +—8—»
« 0 » ·
*e
• • — 8 — *
I ■ I ' 1 ' I ■ I ■ I ■ I ■ 1 ■ I ■ I ■ 1 ' I ' I ■ I ■ 20 40 60 80 100 120 140 160 180 200 220 240 260 280 300
Caption : < 0 >
25 th percenti1Q. 50 th percentile. 75 th percentile. 98 th percentile.
Fig. II.2.8

45 Global representation of the percentiles 25 50 75 98 %
Pollutant : Acid Period : Oct.81 Sept. 82 Units : microg/m3
PPCVVSSS TM TOWN 0 20 40 60 Θ0 100 120 140 160 ISO 200 220 240 260 2Θ0 300 I I I I I I I I
· .—θ ► «—0—»· * ■ o » ·
ι ι ι ι ι ι ι ι ι 0 9 3 0 3 1 3 1 0 7
4 0 1 0 1 1 0 7 Ol 5 0 7
0 2 0 1 2 0 7 0 3 0 1 2 0 7 0 5 0 0 9 0 7
2 2 9 0 7 5 0 5 0 0 5 0 7
T Y N E S I D E BELFAST
CARDIFF EDINBURGH TEESSIDE LINCOLN
» 0 » *—β -
θ—» » ■ 0 »
1 1 ' I ' I ■ 1 ■ I ■ 1 ■ 1 ■ I ■ I ■ I ■ 1 ' 1 ' I ' 20 40 60 80 100 120 140 160 180 200 220 240 260 280 300
Caption : < 0 >
25 th percentile. 50 th percentile. 75 th percentile. 98 th percentile.
Fig. II.2.9

Scatter chart of the percenti lee 50 and ΘΘ labelled with the country code. Pollutant 1 CS02) Oct. 81 Sept. 82
œ 0)
c o ü L (V £L
400 T m i crog/in3
350 . .
300 . .
250 . .
200 . .
1 5 0 . .
50 . .
r 2
τ r e a
f β
t β
a a i aa
a
2
2 2
a 2
2 2 Β
a az a 2 a • a
8a e " a, '
100. . a a
3 8 θ
β %
. . ■* 2
r 2
τ Β
τ α
IO 2 0 3 0 4 0 5 0 6 0 7 0 SO 9 0 ÌOO 1 1 0 120 1 3 0 1 4 0 1 5 0 microg/m3
M e d i a n
F iq . I I . 2 . 1 0

αο 0)
c dl o L 01
Scatter chart of the percenti lee 50 and 98 labelled with the country code. Pollutant 2 (Smoke) Oct. 81 - Sept. 82
200 microg/m3
180..
180
140..
120..
100..
80 ..
60 ..
40 ..
20 ..
o ι β
1 1 1
1
τ τ τ 3 3 3
10 15 20 25
M e d i α π
30 35 40 45 50 microg/m3
■ ^
^j
Fig. II.Ζ.Π

Scatter chart of the percentiles 50 and 98 labelled with the country code. Pollutant 3 <SpnO Oct. 81 Sept. 82
GO 0)
•P C (V Ü L a a.
2 0 0 T m l c r o g / m 3
1 8 0 . .
1 6 0 . .
1 4 0 . .
1 2 0 . .
1 0 0 . .
Θ0 . .
6 0 . .
4 0 . .
2 0 . .
2 2
2
2 2 2
2
* a 2
2 2 2
1 0 1 5 2 0 2 5
M e d i a n
F i g . I I . 2 . 1 2
3 0 — ι — 3 5
ι 4 0
2
2
2
-Η 4 5
2 * 2 " 2 "
2 ' 2 '
-Η 5 0
m í c r o g / t t i 3
oo

Scatter chant of the percenti lee 50 and 98 labelled with the country code. Pollutant 4 <Acid> Oct. 81 - Sept-82
CD 0)
•H
C ai ü L ai o.
400 microg /m3
350 . .
300 . .
250- .
200 . .
1 5 0 . .
1 0 0 . .
50 ..
0
β
1 i 1 t ,
β S 7
è *
β β 7 .
β 7
10 2 0 3 0 4 0 50 60 — t —
70 — t —
80
M e d i on
— ι — 90 100 H O 120 1 3 0 14U ISO
m i c r o g / m 3

Scatter chart of the median and interquartile range labelled with the country code. Pollutant 1 <S02) Oct81 Sept. 82
Ql Ü) C a L
L 0 3 ¡Γ L ai c
1 0 0 χ m i crog/ tn3
90 . .
80 . .
70 . .
60 . .
50 . .
40 . .
30 . .
20 -.
10 . .
ία
2 2 2
β 2
s 8
βθ
2ΐ 2
2 8 2 2
2 β β
2 θ _ i i 2 2 β ΘΒ
θ
2 β 2 2
§θΙ 3 ί 2 2
8 2 8 2 2 2
τ τ β ο
1 0 2 0 3 0 40 50
M e d i απ
Fig . 11.2.14
6 0 7 0 8 0
τ τ β α -
90 100 i n l c r o g / m 3
o

Scatter chart of the median and interquartile range labelled with the country code. Pollutant 2 <Smoke> Oct. 81 - Sept. 82
m c o L
L 0 3 CT L
ai c
■H
7 5
70 . .
6 5 . .
6 0 . .
5 5 . .
5 0 . .
45 . .
40 . .
3 5 . .
3 0 . .
2 5 . .
20 . .
15 . .
10 . .
5 . .
O
m i c r o g / m 3
O
β ι β
s 1
1 θ 1 β
β β 1 1 1 1 1
7ν 1
1 1
1 1
1
1
α ι
1 0 1 5 2 0 2 5 3 0 3 5 4 0 45 5 0 5 5 6 0 6 5 7 0 7 5 mi c r o g / m 3
M e d i an
Fig . I I . 2 .15

σι c o L
■Ρ L O πι α ¿> c
Scatter chart of the median and interquartile range labelled with the country code. Pollutant 3 CSpm) Oct. 81 Sept. 82
75 Ί
70 .
65 .
60 .
55 .
50 .
45 .
40 .
35 .
30 .
25 .
20 .
15 .
10 .
5 .
0
.microg/m3
2
2
1 1
2
1
2 2
1—
2
2
2
2
2
2
Η
2 2 3
H
2
2 2 2 2
2 2 2 2
2 2
1
2
2
3 2
2
2
2
Η
2
2
2 2
1
2
2
1
2
1
2
2
» —
2
2
2 2
1
■
β
2
2
» ( IO 15 2 0 2 5 3 0 3 5 4 0 45 50 55 60 65 70 75
m i c r o g / m 3
v/i INJ
M e d i an
F i g . I I . 2 . 1 6

Scatter chart of the median and interquartile range labelled with the country code, ι Pollutant 4 <Acid> Oct81 Sept. 82
ai CD c o L
4J L 0 D u L ai c
100 mí c r o g / m 3
go ..
80 . .
70 ..
60 ..
50 . .
40 . .
30 ..
20 ..
IO . .
1 e s
7 a a a
1 0 2 0 3 0 40 50
M e d i a n
F i g . I I . 2 . 1 7
6 0 7 0 8 0 9 0 ÎOO micr~og/rt i3
ui OJ

Global median valuó by town class - periodi Oct.. 81 — Sept. 82
Pollutant 1 (S02) 90 T i torog/HB
β
75
TD
SS
3 ss 1 « S · 1 *
sg a a is IO
s o
Pollutant 2 (S*oke)
(β T derog/K
SS.
SO
2 I tom cia
3 " S a 6
I" 20
IS
M
S
0
^
2 S
tom cia
Pollutant 3 (Spa) BO T vlorag/tfO |
SS
so;
«
«
SS
Pollutant 4 (Acid)
3
6
20
15
U
S
2 t
toan cia
η - derog/al
Η
η π 70
(S
IO
35 3 90 t « S «
1« 30
a 20
IS
u s 0
2 t tom cia
F i g . I I . 2 . 1 8

Annual mean for stations — periodi Oct. 81 — Sept. 82
<0 c o
4-> o
4-> co
SO
45
40
35
30
25
o 20
15
10
5
0
Pollutant 1 (S02)
i I ι ¡I I n III
out 10 30 50 70
microg/m3
mH go out
50
45
40
35
30
25
20
15
10
5
0
Pollutant 2 (Smoke)
m
I I
1
■pi out 5 15 25 35
microg/m3
VftVftVft 45
50
45
40
35
30
25
20
15
10
5
0
Pollutant 3 (Spin) so T Pollutant 4 (Acid)
eut & 4 5 25 35
nncrog/m3
1 45
40
35
m S æ
4J 3 2 5 i u> o 201
»-« 15
10
5
0 -eut. 4&
F i q . I I . 3 . 1
I ■lliiii 30- -5Q 7B
niicrog/ra3

Annual median for stations — periodi Oct. 81 — Sept. 82
5D .
45
40
35
(0 S »
•—ι 4-> 3 25 w
*fe 2 0 i
15
10
5
0
Pollutant 1 (S02)
wi
autl0 2 0 3 0 4 0 5 0 e 0 7 0 a 0 8 0 1O0out microg/mS
50 τ
45
40
35
ro 8
æ
^ 2D |
15
10
5
0
Pollutant 2 (Smoke)
I
II P outS 10 15 2 0 2 5 3 0 3 5 4 0 4 5 5 0 o u t
raicrog/m3
Pollutant 3 (Spm)
out 5 10 15 2 0 2 5 3 0 3 5 4 0 4 5 5 0 « * «icrog/«3
50
45
40
35
§ 3 0 1 •ψ*
3 25 w
'fe 20
15
10
5
0
Pollutant 4 (Acid)
1
Fig. I I . 3 . 2
II a u t l 0 2 0 3 0 4 0 5 0 e 0 7 0 a 0 f l 0 100out
■icrog/ii3

Annual ©tandard deviation for stations periodi Oct. 81 — Sept.82
Pollutant t (S02)
out 5 25 45 85
microg/m3
50
45
40 .
35
g 30
4J σ 25 W
% 20
15
10
5
0
Pollutant 2 (Snoke)
Β I m I M ¡
out 2.5 12.5 22.5 32.5
microg/m3
■ 42.5 un
^1
50 τ
45
40
35
w S 3°
4-> "
0)
ΐ 20
15
10
5
0
Pollutant 3 (Spe)
I I
Mι υ I
out 2.5 12.5 22.5 32.5
mier g m3 4 . 5
33 1 out
Pollutant 4 (Acid)
F i q . I I . 3 . 3
45 65
raicrog/m3

Annual coefficient of variation for stations — periodi Oct.81 — Sept. 82
so
45
40
35 1
(I)
.2 3
°l
% 20J
15
10
5
0
Pollutant 1 (S02)
¡I ¡I
sA W& lie I I I I ¡¡¡11 w. 17771 νγΆ vjA
out aso aro 1.10 1.50 1.90 out
50
45
40
35
(0
σ 25 en
*è 20 »4
15
10
5
0
Pollutant 2 (Smoke)
out aso
■ i 1
I i II ¡I 1 'ftvAVAm . P?a
aro 1.10 1.50 1.90 out 00
50
45
40
35
§ 3 0 1 · ■ - · J J O 25 (0
*è 20 >-«
15
10
5
0
Pollutant 3 (Spin)
1
■ 1 1 1
1 111 ■ ¡I I I 1
50
45
40
35
8» •Φ-Λ
4->
3 25 0)
^ 20 >*
15
10
5
0
Pollutant 4 (Acid)
si j g?3
out a 30 aro 1.10 1.50 1.80 out a 30 aro 1.10 1.50 1.90 out
f i g . I I . 3 . 4

Annual ekewnees for etatione — periodi Oct. 81 — Sept. 82
en c o
4-1
a <n
so. Pol lu tant 1 (S02) 45
40
35
30
25
50 Pollutant 2 (SraokG)
ω c o
4-> O ■U U)
out 1.20 2.00 2.80 3.60 4.40 out out 1.20
50
45
40 I
35
30
25
20
15
10
5
0
Pollutant 3 (Sp«) Pollutant 4 (Acid)
, , m. 2.80 3.1» 4.40 out
V) c o Ό 4J CO
_ ! _ _ 2.8& 3.B& 4.40 out
Fia. I I . 3 . 5

Annual shape estimator of the froquoncy distribution period· Oct. 81Sopt.82
Pollutant 1 (S02) Pollutant 2 (Snoke)
out CL2 out 0.2 out O
50
45
40
35
i» S 25 »
15 i
10
5 i
0
Pollutant 3 (Spi)
m I
out 0.2 <& ¡il ■ι
yA
αβ ■ ■il
YA
1.0 1.4 1.8 out
50
45
40
35
i» S 25 (o
"è 20
15
10
5
0
F ig . I I . 3 . 6
Pollutant 4 (Acid)
11 out 0.2 0.6
^
1 I I I
il 1.0
L̂ J L4 1.8 out

Annual Kurtosis for stations — period· Oct. 81 — Sopt·. 82
so
45
40
35
5 25 to
^ 20 κ
15
10
5
0
Pollutant 1 (S02)
■-Ml out 2
I lEfftT*
I ι
50
45
40
35
§ 3 0 -•-4
% 20
15
10
5
0
Pollutant 2 (Snoke)
β 10 12 14 18 18 20 out EZL
out 2 ■SI ZTkvfaW ,
I β 10 12 14 18 18 20 out
50
45
40
35
8 S 25 co 'S 20 »4
15
10
5
0
Pollutant 3 (Spin)
I I
V WÍM Wmn ι IrørøEa
50
45
40
35
S 30 •ψ*
3 25 η
«Ο 20
15
10
5
0
Pollutant 4 (Acid)
_a h IMI I
a Lai out Z * β β 10 12 14 16 16 2Ê cut out 2 4 * * » tí M W Ι» 2β u t
F i g . I I . 3 . 7

62
ε ρ
to oa y
o a. ld α.
400
350
300
250
200
150
100
50
E 2 o ε co σ>
o cc υ a.
400
350
300
250
200
150
100
50
SCATTER CHART OF THE PERCENT. 50 AND 90 POLLUTANT 1 (S02) 0ct.81-Sept82 SUMMER
%
|<i )&$>
8 ι
s e e
P. - ·;
&Λ ι
.
ι
|
6
: .
I
20 40 120 60 80 100
MEDIAN miorog/m3
Fig> I Í . 4 . 1
SCATTER CHART OF THE PERCENT. 50 AND 90
140
2 l 2*
I
2
" 2
8 8
2
I
28^
22 2
Ζ
,2 2
2; t 2 ^
Λ» a a
ι
POLLUTANT 1
2
22
I 8 2
B 8
,
2 :
2
1
%
(S02) 0ct81-Sept82 WINTER
2
fe2
:
.
1
: :
ì
"Z
î
1 I
< 1
;
20 40 $0 80 100
MEDIAN mlcrog/m3
Fig. 11.4.2
120 140

E
e o ε
(O
α y ι o S α.
200 190 180 170 160 150 140 130 120 110 100 90 80 70 60 50 40 30 20 10 0
63
SCATTER CHART OF THE PERCENT. 50 AND 90 P0L2 (Smoke) 0ct81-Sept82 SUMMER
I i ¡ 1
! i
I i ι - ■
I
α § Θ
ν* 7 1 * '
5 5
5 Qfl 1 1
Ie oí
\ 0 I 1
! ι ! I I I ; I
ι ! ι ; I ■·
i :
1
j ¡ i ' !
τ ! 1 1
i 1
20
MEDIAN microg/m3
Fig. I I . 4 . 3
40
Η)
ρ
o α
O Κ u Q.
200 190 180 170 160 150 140 130 120 110 100 90 80 70 60 50 40 30 20 10 0
SCATTER CHART OF THE PERCENT. 50 AND 96 P0L2 (Smoke) Oct81-Sept.82 WINTER
0 5 , 9
1—I 1 ' , n
τπΤΤ _9 1_
7 1
20
MEDIAN microg/m3
Fig . I I . 4 . 4
40

64
»o ε
\ w o
CO α
ζ υ ο χ υ α.
200 190 180
SCATTER CHART OF THE PERCENT. 50 AND 90 P0L3 (SPM) 0ct81-Sept82 SUMMER
K)
Ω C υ E co η
Η c ζ Iii O α: y α.
170 160 150 140 130 120 110 100 90 80 70 fiO 50 40 30 20 10 0
200 190 180 170 160 150 140 130 120 110 100 90 80 70 60 50 40 30 20 10 0
! ι
1 !
ι ' : 2
2
: I l '
ì ¡ 2 2 2
! 2 2 n ι ¿ « ! . 2 , 2
■i ! 2 2 . . . 2 I "21
Ζ \ «·ζ 2
5 2 2 2 2 , : 2 ι
2 2 ι Ι
2 , 2
2
Ι Ι
¡ j
20
MEDIAN
40
microg/m3
Fig. I I . 4 . 5
SCATTER CHART OF THE PERCENT. 50 AND 90 P0L3 (SPM) 0ct81 -Sopt82 WINTER
l , 2 1
1 1 *l i ' '
i ; _ 2
| i i ¿ ¡ 2 ¿ ! *
ι
2 ! ' i 1 ! !
, ι ? ' a '
Ζ | Ι τ ' ι ¿ ¡
2Ζ ζ ' '
ι « · , Ι Ι ' ί ! ι i
Τ i ' ι ! ì !
• 1 ι · 2 ! Ι
20
MEDIAN microg/m3
Fig. I I . 4 . 6
40

65
ε o ε «o α
α.
400
350
300
250
200
150
100
50
SCATTER CHART OF THE PERCENT. 50 AND QÔ P0L.4 (Acid) 0ct81-Sept82 SUMMER
5
1
7 71
7 '
' 1
fl 1 i l 7 7
»,' , , 9
1
I Θ9
Ϊ11
1
1
9 1 1
1 1
1
1
t
K)
E o·
ε o Ë m α y o α: u α.
400
350
300
250
200
150
100
50
20 40 60 80 100 120
MEDIAN mícrog/m3
Fig. I I . 4 . 7
SCATTER CHART OF THE PERCENT. 50 AND 90 POL* (Acid) 0ct81-Sept82 WINTER
140
5
β 1
d 7
1f i
1 1
i1
9 * 1
1 θ
it
1
1
f li 1
71
9 1 1
1β5
9 1 I
9 1 1
1
1
1
' ι
1
1 1
20 40 60 80 100
MEDIAN microg/m3
Fig. I I . 4 . 8
120 140

Correlation between the summer and winter percenti lee 50 and 9Θ labelled with the country code. Pollutant 1 CS02) Oct. 81 Sept. 82 dashed linei bisector. continuous linei orthogonal regression line.
c □ X» ai ίαι c
00
4> c OJ υ 0) οίοι jj c
Θ lepe« correlation·
1.97 a 87
70 80 SO 100 U O 120 130 1 « 150 ■lcrog/a3
Summer median
400
380
320
280
240
200
lea
120
80 '.
40 '.
0
-■Icrog/lS i j 2 a a
a 2
2 a a
* * 7
a» / a /
a / / a
a / a/ a
a y a 7 a
" Φ a '/" ι
a V a
-V ··· ' / · a ·
i a · / * a / . a *a /
h / X
: /2 /
/ x
Λ 1 1 1 1 1 1 1 1 1
»t t f t a i · as
a
a
a
/ /
/ /
/ /
1 1 1 1 1 1 1 1 1 t 1 1 1 1 1 1 1 1 1 1 1 1 1 1 t 1 1 1 1 1 1
o o
40 80 120 180 200 240 280 320
e löpet 3.32 correlation· a63 Summer percent i le 98
380 400 ■1009/13
F ig . I I . 4 . 9

Correlation between the summer and winter percentiles 50 and 98 labelled with the country code. Pollutant 2 CSmoke) Oct.81 Sept. 82
dashed lines bisector. continuous linei orthogonal regression line.
c a
-.-I
a) E L 01
4> C
50
45
40
35
30
25
20
15
10 .
5 .
0
■
/
crog/«3
/
/ t
/
— t -
t t 3 S
S
e
8 S / 1 1 /
S / a /
7 / β /
β / 1 1 / t 1 / 1
/ ' g /
i f / m ' Áx ' / ƒ ' ' V
/
1 1
/
/ t
/ s
1
/ /
/
H t
1
1 1 1 —t 1
200T»icrog/»3
10
elopei cor re la t ion ·
1.56 0 .63
15 20 25 30
Summer median
35 40
GO CD
4J C οι o L a D -
L Q)
4-> C
45 50 ■icrog/i3
O -vi
slopei 2.44 correlation· 0.54 Summer p e r c e n t i 1 Θ 98
+ 1 l· 1 1 160 180 200
■ crog ad
F i g . I I . 4 . 1 0

Correlation between the summer and winter percentiles 50 and 98 labelled with the country code. Pollutant 3 CSpm) Oct81 Sept. 82
d a s h e d l i n e i b i s e c t o r . c o n t i n u o u s l i n e i o r t h o g o n a l r e g r e s s i o n l i n e .
c σ
ai E C ai c
50
45 ..
40 ..
35 ..
30
25 .
20
15
10
5 .
■lcrog/a3
4 /
/
/ /
/ 0 V. Η
t 1 1 t 2 2 2 ■♦
2 *
2 2
y /
/
/
/ ^
* ^ X
10
slopes 0.84 correlation· 0.76
15 20 25 —ι— 30
—ι— 35
Summer median
40
GO en
c ai υ Í_ ai οίοι c
5 50 ■lcrog/κ)
20DTiicrag/i3 t » t 2 2 · *
O* co
20 40 80 80
elope. 1.23 correlatiom a52 S u m m e r p e r c e n t i l e 98
100 120 140 180 180 200 »lcrog/«3
Fig. II.4.11

Correlation between the summer and winter percentiles 50 and 98 labelled with the country code. Pollutant 4 CAcid) Oct. 81 Sept. 82 dashed linei bisector. continuous linei orthogonal regression line.
c a CU E L CU
4> C
DTiicrog/«3
CD CO
4J C cu υ c cu Ο
Ι. cu c
elopei 1.40 correiat i ora 0.76
■lcrog/a3
>0
Summer median
0 Κι I I I I I I I I I I I I I t I I I I I I I I t ι ι ι ι ι ι ι * —ι—* ι ι ι ι t ι 0 40 80 120 180 200 240 280 320 360 400
«icrog/a3 elope» 1.23 correlatiotii 0.52 Summer p e r c e n t i l e 98
F i g . I I . 4 . 1 2

ISOLATED EXTREME OE THE MONTHLY MEDIAN
3.5 PERIOD: Oct.81 -Sep.82
in in
< > M
>-_J Χ
LU X
LU
< Ol LU >
3 -
2.5 -
2 -
1.5
0.5 -
0 Ji -=ter jft m
o
ΈΓ f \1
■0.5 ~ 1 I 1— Mar Apr May
I
Oct Nov Dec Jan Feb Jun Jul Aug Sep
/7~λ S02 W/\ Smoke [g£2 SPM \ 3SJ Acid
F ig . I I . 4 . 13

71 Annual Report 82
ANNEXES
Unselected series
A.1 Monthly medians
A.2 Global description
Selected serieş
A.3 Yearly percentiles 25,50,75,95,98 (see corresponding Fig. II.2.1 to II.2.18)
A.4 Annual descriptive parameters (see corresponding Fig. II.3.1 to II.3.7)
A.5 First characteristics of the time series (see corresponding Fig. II.4.1 to II.4.12)
A.6 Status of the isolated extreme of the monthly median values, (see corresponding Fig. II.4.13)

72 Annusi Report 82
ANNUAL CHARACTERISTICS OF THE SERIES
October 1981 - September 1982
Annex 1; Monthly medians
Column caption:
Labei
Station code
Explanation
PPCVVSSSPLTM: PP C VV SSS PL TM
country code town class code town code station code pollutant code measurement technique code
monthly medians measurement unit poll. 1-4: microg/ç3 poll. 19,28: nanog/m
special symbols used:
"~": no data recorded for the month "." : at least one missing value for the month
cas no. number of esses reported for the year (measured values).

73 Annual Report 82
Monthly medians Pollutant 1: S0 2 (column caption: see Al.l)
Station code Values in measurement unit caá PPCVVSSSPLTM Town name OCT NOV DEC JAN FEB MAR APR MAY JUN JUL AUG SEP n<j>
81 82 021010060103 BERLIN (WEST 80 70 140 160 150 70 45 40 30 30 40 55 36!» 021010080103 BERLIN (WEST 70 65 120 150 165 80 60 80 40 50 50 70 36? 021010160103 BERLIN (WEST 100 90 210 270 210 120 85 70 40 40 40 80 365 021010180103 BERLIN (WEST 80 75 120 150 160 80 40 50 30 30 40 55 36!» 021010200103 BERLIN (WEST 60 80 170 210 140 90 60 60 30 30 30 60 365 021010280103 BERLIN (WEST 50 65 130 190 120 70 50 50 30 40 30 50 36l· 022010050104 MUENCHEN, BA 13. 13 19. 19. 23. 16. 17. 13. 13. 13. 13. 13. 32i! 022010070104 MUENCHEN, BA 16 22 30. 63. 38 27. 28 19 14 13. 13. 14 34J. 022010080104 MUENCHEN, BA 26 34. 58. 75. 64. 30 37 24. 16. 16. 15. 25. 33(1 022010100104 MUENCHEN, BA 22 28. 36 52. 48 30. 28 23 19 25. 18. 28 345» 022010110104 MUENCHEN, BA 30. 35. 39. 39. 38. 15. 19 17. 25 14. 14. 14 320 022010120104 MUENCHEN, BA 21 30 52 81. 49. 31. 27 16. 19 15. 13. 18. 336 022010130104 MUENCHEN, BA 15 19. 35 35. 47. 29. 26 18. 14. 17. 13. 20 320 022010140104 MUENCHEN, BA 20 25 56 75. 53. 23. 22 18. 16. 16. 15. 24 32f! 022010150104 MUENCHEN, BA 14. 26. 27. 25 33. 22 24 27. 21. 15. 15. 25. 32 022010160104 MUENCHEN, BA 18. 25 49 61. 60. 28 32. 25. 18. 19. 17. 26. 34 023010030105 DORTMUND 55. 70.110. 90.120. 70. 50 50. 30. 30. 30. 40. 29 023020030105 DUISBURG 70. 40. 60 90.110. 70. 60. 50 40. 35. 20. 50. 28 023030010105 DUESSELDORF 60. 65.100.120. 90.110. 55. 80. 70. 60. 60.100. 28 023040010106 FRANKFURT-MA 74 85 136.175 122 95 59 57 28 45. 38 42. 35 023040030107 FRANKFURT-MA 31. —. —. —. —. 61 33 34. 38. 35. 34 34. 22 023040050107 FRANKFURT-MA 48. 65.107.106.113. 78. 40. 35. 35. 38. 30 37. 30 023050810109 NUERNBERG, B 35. 46. 72.111. 81. 45 34. 27 19. 22. 13. 24. 29 023050820109 NUERNBERG, B 30. 29 53. 82. 65 34. 38. 25 19 28. 17 26 35 023050830109 NUERNBERG, B 20 26. 59 91 91. 33 37 25 14 18. 13. 17 34 023060010126 STUTTGART 40. 45 70.100 60. 20. 30. 30 20. 20 10. 20 33 023060020126 STUTTGART 40 60 90 120.120. 50 40 20. 20. 15. 20. 20. 33 023060030126 STUTTGART —. —. —. 90 80. 30. 30. 20. 10. 10. 10. 20 24 023060040126 STUTTGART —. —. —.110 95 50 50. 20 10. 10. 10 10 25 024010710109 AUGSBURG, BA 28 29 40 43 41. 25. 19. 19. 26 24. 22. 38. 31 024010720109 AUGSBURG, BA 13. 20. 41 38. 39. 24. 17 13 13. 13. 13. 15 31 024020540109 ERLANGEN, BA 42 44 61 119. 92 58 48 22. 20. 33. 17. 32 33 024030010110 KARLSRUHE 40. 70. 90.110 90. 50 40 30. 50. 30 50. 55. 29 024030220110 KARLSRUHE 30. 50 75.130. 60. 30 30 20 20. 20 10. 40. 33 024040010106 KASSEL, HESS 60 55.126 139 164 73 47 43 35 37 30 42. 36 024050060112 LUDWIGSHAFEN 24 20. 71 99. 78 38. 24. 25 16. 20 9. 26 34 024050070112 LUDWIGSHAFEN 45 59 98 131 87 52. 51. 36 21. 30. 19 32. 35 024050080112 LUDWIGSHAFEN 27. 32 77 85 86 36. 32. 36. 22. 36. 21 46. 34 024061100110 MANNHEIM 50. 60. 60.110. 80. 60. 40. 50. 55. 40. 50. 40. 293) 024061110110 MANNHEIM 30. 40. 70. 85. 75 60. 50. 40. 20. 30. 20. 40. 31l| 024061120126 MANNHEIM 30. 50. 90.110 70. 45. 40. 30. 40. 20. 10. 20. 29ß 024070310109 REGENSBURG, 30. 28. 72. 78. 52. 40 30 23. 17 19. 14. 18 305 024080010106 WIESBADEN, H 43. 38 104 141 126 47. 42 44 26. 39 28. 34. 344 024080020106 WIESBADEN, H 51. 53.134 158 178 76 35 41 27 34 18 33. 35 024090640109 WUERZBURG, B 25. 22. 47. 58. 50 39 31 18 16 21. 14. 18. 32 024090650109 WUERZBURG, B 27. 36. 87. 91 57. 30 26. 17 14 17. 15. 15 343

74 Annuel Report 82
Monthly medians Pollutant 1: SO2 (column caption: see Al.l)
Station code PPCVVSSSPLTM
024100110109 024110850109 024120030112 024120040112 024120050112 024130010126 025010610109 025020910109 025020920109 025030010126 025040010126 026990010113 026990020113 026990030113 026990040113 026990050113 026990060113 026990070113 026990080113 026990090113 026990100113 026990120113 026990130113 026990140113 026990150113 026990160113 026990240110 032011010127 032011020101 032011030127 032011030128 032012100127 032012210127 032013300101 032013310101 032013340101 032013350101 032013420127 032013480127 034018150127 034029150127 034029150129 035015650127 035015650129 035025150127 035033510127
Town name
INGOLSTADT, FUERTH, BAYE MAINZ MAINZ MAINZ FREIBERG ASCHAFFENBUR KELHEIM, BAY KELHEIM, BAY HEILBR0ENN ULM B.R. DEUTSCH B.R. DEUTSCH B.R. DEUTSCH B.R. DEUTSCH B.R. DEUTSCH B.R. DEUTSCH B.R. DEUTSCH B.R. DEUTSCH B.R. DEUTSCH B.R. DEUTSCH B.R. DEUTSCH B.R. DEUTSCH B.R. DEUTSCH B.R. DEUTSCH B.R. DEUTSCH B.R. DEUTSCH KOBENHAVN KOBENHAVN KOBENHAVN KOBENHAVN KOBENHAVN KOBENHAVN KOBENHAVN KOBENHAVN KOBENHAVN KOBENHAVN KOBENHAVN KOBENHAVN AALBORG ODENSE ODENSE ESBJERG ESBJERG FREDERICIA NAESTVED
OCT 81
23 50. 19 15 26 10. 39 26 17. 40 30 3 1 4. 9 11. 1 1. 7 15 13 16 2. 3 10 7
·β ·
β β · 14
— · 4. 3.
14 11
·β ·
™ · · β — ·
NOV
24 52 26. 22. 41. 20. 43 30. 18. 50. 40. 2 5
12. 12 8 9 4 4 10 20 11 9. 9.
12. 10 60. —— · 12
—— · 5 Λ 11 18
■■■» ·
·· · ·— ·
Val DEC
45 99. 93 55 106 40. 54 37 61. 60 50 16 18. 40 23 25. 11 5 20. 51 39. 46. 13 12 37 38. 45. —~ · 31
~~ · 14.
36 46
—'.
~ ™ · ■ ■ · ·
ues JAN 82
66. 112. 142. 88. 140 110. 67. 48 85. 60. 50. 8
21 60 22 20. 10. 1 15. 36 29 27 19 9 41 47. 95. —. 35
β™ ·
40.
34 64
β™ ·
~~ · ·
— ·
in measurement unit FEB
57 93. 140 95 158. 40. 76. 30 46 60 45 16 20 44 30 35 15. 5
17 55 44. 55. 17 10 44 52 50. — . 22
—— · 17
43 t y 57
48. 59. 46. 43. 43. 31.
MAR
32. 47 35 27. 48. 20. 54 31. 35 30. 30 5 4.
14 14 13. 10. 3 9.
17. 18. 17 6 9. 22 12 50. — · 25
™ " ·
13.
26. 42.
27 30 16. 22 21. 29.
í\PR
28 38 24. 35. 39. 25. 29 29 33 30 30 2. 8
12 10. 4. 11 7 1. 5.
11 7 9 7.
12 22 20. 10. 26 12.
"™ · 8.
16 18 10.
18. 21. 19 11. 15 18. 22
MAY
19. 33. 22. 19. 26. 20. 19 24 20. 35. 30 2. 1 6. 7 4 5 2 1 8.
10. 8 2 1. 8. 5
30. 19.
35 28.
22.
13.
20 20. 21. 12 12. 20. 23.
3UN
14. 13 11. 17. 23 — . 13 26 17. 30. 30. 1 0. 4 5 4 2 0 0 5 6 6 0 0 5 5
20. 14
29. 32 12. 17
10.
25 17 15. 11 13. 13. 14
JUL
18. 13. 16. 20 34.
13. 26. 21. 30 50. 1 2 7
13 2. 2 1 0. 3. 6. 4. 2 0 6.
22 25. 10.
27. 27 7.
10
8.
15 15. 9 9 10 10. 11
(\UG
13. 13 11. 11. 16.
13. 19. 15. 30. 30 1 0 1. 4 4 3. 0 1 8.
10 9 0 0 3 2 20. 14
26. 27 8.
11.
5
15. 11. 9.
11. 16 11 21.
5EP
18. 14. 18. 19. 34
24 22 22. 30 30 2 1 7
13 7 4 0 5 13 9.
10. 0 0 8
IO 20 17. — . 29. 38. 13. 11
8 19 14 17 14 15 17 14 21
cas no
343 344 326 333 352 202 349 358 332 325 344 362 352 357 364 353 357 344 346 340 349 359 360 359 353 356 285 153 212 141 150 107
. 147 143 39
210 210 144 23
162 209 186 210 211 198 219

75 Annual Report 82
Monthly medians Pollutant 1: SO2 (column caption: see Al.l)
Station code PPCVVSSSPLTM
Values in measurement unit caè Town name OCT NOV DEC JAN FEB MAR APR MAY JUN JUL AUG SEP no
81 82
035033510129 035046350127 061010090120 061010100120 061010130120 061010140120 061010150120 061010160120 062010010122 062010020122 062010030122 063020010124 064040010121 064040020121 064040030121 064080010124 065140010124 083015150102 083015160102 083015180102 083015190102 083015200102 083015210102 083015220102 \* w ^ KJ ̂ ^ ^m ^m K*i± \J ^m
083015230102 083015250102 083024040102 083024050102 083034180102 083034230102 084018140102 084029080102 084029090102 084032130102 084032140102 084046070102 084046100102 085015280102 085022040102 085035300102 085041210102 085053040102 085068060102 086991240102 086992060102 086993120102
NAESTVED RANDERS MILANO MILANO MILANO MILANO MILANO MILANO TORINO TORINO TORINO GENOVA BOLZANO BOLZANO BOLZANO PESCARA VERCELLI AMSTERDAM AMSTERDAM AMSTERDAM AMSTERDAM AMSTERDAM AMSTERDAM AMSTERDAM AMSTERDAM AMSTERDAM DEN HAAG DEN HAAG ROTTERDAM ROTTERDAM ENSCHEDE GRONINGEN GRONINGEN TILBURG TILBURG UTRECHT UTRECHT BUSSUM DEN BOSCH HILVERSUM MAASTRICHT MIDDELBURG ZWOLLE LIG.ACHTERGR LIG.ACHTERGR LIG.ACHTERGR
—.
107 91 83. 57. 65.
101. 159. 118. 128. ~ . 40. 73 81. 16. 61. 24. 25. 26. 22. 25. 25. 24. 22. 30 33. 41 32 27 20. 15 39. 27. 19. 28 20. 41. 24. 26. 21. 27 17 19. 34.
·· ·
370 372. 309. 257. 214. 417 322. 299. 221. . 152. 164 155 • ™ · 218. 21. 22. 19. 17. 32. 25. 19. 26. 24. 17 37 32. 20. 13. 13. 33. 22. 16. 25. 16. 35. 20. 35. 17 20. 25. 22. 22
.
463. 473. 351. 237. 195. 499. 357. 326. 307
w w β
198. 183 206. 47. 244. ~~ · 33 39 35 39. 43 34. 45 47. 33. 59. 59. 41. 11. 18. 61. 50 39. 41. 37. 64. 32. 53. 34. 28. 31. 43. 59.
·· ·
396. 499 287. 225. 278 499 499. 499 104. 250. 211. 209. 39. 218. 41. 46. 38. 35. 39. 35. 31. 40. 62. 57. 64. 63. 46. 13. 21. 82. 51. 51. 37. 29. 72. 37. 50. 49. 32 27. 48. 75.
44. 499. 455 385. 403. 265 471 342. 343.
130. 170. 164. 175. 44. 192 57. 59. 50. 68. 51. 40. 32. 47. 79. 69. 70. 55. 61. 37. 41. 72. 41. 55. 50. 55. 81. 44. 50. 86. 60. 28 49. 73.
34. 14. 161. 213. 175. 122. 130. 229 161. 125.
~~ · 74 101 88. 36. 128. 29. 32. 28. 13. 27. 26. 29. 29. 31 25 41. 32. 17. 12. 10. 33. 14. 27. 19. 20. 30. 24. 34. 19 22. 24. 19. 29.
25. 11 75. 88. 92. 56. 76. 80. 82 66. 26. 97. 79. 93. 11. 15. 5. 13. ™ ~ · 7. 19. 12. 15. 12. 11. 22. 18. 4. 2. 4. 30. 14. 11. 16. 14. 18. 13. 25. 14. 7. 20. 7. 16.
30. 16 44. 36. 44 31 34. 36.
™ ~ ·
52. 34 58. ~~ · 9. 19. 20. 17. 38. 18. 23. 20. 21. 22. 20. 33. 29. 11. 7. 7. 33. 22. 16. 17. 20. 29. 17. 15. 22 13. 18. 20. 25
17 12. 42. 21. 21. 31. 60. 36.
·· ·
29. 44. "· · 10. 17. 9. 13. 12. 13. 14. 18. 15. 15. 14. 26. 20. 8. 6. 13. 29. 17 12. 17. 18. 24. 19. 13. 14 8. 15 11. 23
11 8 32. 21. 36. 23. 57. 42.
·" ·
39. 86. 65. 3. 14. 9. 16. 9. 8. 14. 14. 9. 10. 10. 17 15. 11. 6
β β · 24. 17. 10. 13. 11. 23. 14. 28. 17. 7. 14. 14. 11.
23 8. 23. 13. 19. 16. 23. 26. β" ·
W W ·
■"■" ·
63. 3. 15. 17. 14. 32. 17. 17. 19. 14. 15. 15 27. 17. 11. 8.
β β · 31. 17. 15. 18. 17. 22. 16. 22. 13 8 13. 11. 9
28 13 65 31 44 31 68 50 —
— — — 13 14 20 19 19 24 20 26 28 16 33 26 33 23 22 13 9 36. 18 19 22 22. 23. 23. 24. 25. 14. 11. 16. ~
β ι
. 180 171 269 321 296 318 318 338 152 185 90 42 264 281 226 42 139 276 300 306 256 315 299 (3
299 292 345 323 34¿ 343 333 331 271 270 31Ş 309 335 266 31Í 315 25Í 326 325 332 31$ 295

76 Annual Report 82
Monthly medians Pollutant 1: SO2 (column caption: see Al.l)
Station code PPCVVSSSPLTM
Values in measurement unit cas Town name OCT NOV DEC JAN FEB MAR APR MAY JUN JUL AUG SEP no
81 82
086995010102 LIG.ACHTERGR 12. 5. 16. — . 30. 7. 4. 9. 4. 3. 6. 9. 265 086996170102 LIG.ACHTERGR 11. 8 19. 12. 20. 10. 2. 5. 5. 5. 6 9 320 086998150102 LIG.ACHTERGR 15. 12. 30. 10. 48. 15. 4. 11. 9. 4. 5. 13. 328 086999010102 LIG.ACHTERGR 10 6. 15. 12. 27. 8. 1. 6. 5. 4. 3. 6. 327

77
Annual Report 82
Monthly medians Pollutant 2; Saoke (column caption: see Al.l)
Station code PPCVVSSSPLTM
012010010203 012010020203 012010080203 012010140203 012010170203 012010220203 012010260203 013018010203 013018090203 013018120203 013018130203 013018180203 013018260203 014015010203 014015040203 014015050203 014015090203 014015130203 014015140203 014027010203 014027060203 014027070203 014027090203 014027120203 014027150203 014032020203 014032050203 014032150203 014032180203 014032290203 014032300203 015016050203 015026020203 015026030203 015033020203 015044040203 015044050203 015044110203 032011020202 032013300202 032013310202 032013340202 032013350202 041010110210 041010170210 041010490210
Town name
BRUXELLES BRUXELLES BRUXELLES BRUXELLES BRUXELLES BRUXELLES BRUXELLES ANTWERPEN ANTWERPEN ANTWERPEN ANTWERPEN ANTWERPEN ANTWERPEN CHARLEROI CHARLEROI CHARLEROI CHARLEROI CHARLEROI CHARLEROI GENT GENT GENT GENT GENT GENT LIEGE LIEGE LIEGE LIEGE LIEGE LIEGE BRUGGE KORTRIJK KORTRIJK LIBRAMONT NAMUR NAM UR NAMUR KOBENHAVN KOBENHAVN KOBENHAVN KOBENHAVN KOBENHAVN PARIS PARIS PARIS
OCT 81
29 20 12 6 11 16 10 11 38 11 15 13 9
19. 12. 19. 7 9.
10 14 10 22 16 12 10 ™
— · 14 "™ ·
19 14 12 20 5.
25 25 44 27 11. 9.
12 25 32 31 38
NOV
26 19 12 9
16 25 14 8 28 7 9 11 8 19. 14. 19 8 14 18 16 10 20 14 16 12 24. 10. 6.
19 13 12 24 7.
29. 34. 38. 19 9 8. 5 15 44 41. 46
Val DEC
45. 28. 26. 6. 16. 32. 26 17 35 15 25 23 14 16 16 25 9 17 21 28 8 42 12 24 18 29. 10. 8.
20 16 20 40 8.
14 27 43 27 12. 14 34 43. 43. 42.
ues JAN 82
30. 23. 17. 10. 16. 31. 20 22 37 10. 22 23 21 16 25 32 16 16 37 28 12 39 20 24 22 . 17 W M ■
45. 10. 16 27. 9. 7.
16. 24. 29 25. 15 28
in measurement unit FEB
35 29. 24 17 21 37 31 20 39 21 28 29 24 14 36. 33 21 29 25 21 14 33 21. 28 20 40. 23 β~ ·
46. 23. 29 39. 14 16 34 26 43 20 19 36
MAR
23 31 12 10 14 20. 20 11 27. 6. 12. 13 12 12. 10 23 19 10 16 10 10 28 8. 18 16 28. 14 — . 14. 17 22. 14 22. 9 5. 6. 21. 32 11. 16. 31.
APR
22 28 18 9 15 4. 14 13 21 9
11 14 9 7
13 24 6. 9
19 14 8
25 12 12 10 12. 11 •™ · 43 16 14. 10. 18. 6
" ■ " ·
™ · · e — · 19
6 13
MAY
17 32 10 6 11 8.
13 11 23 7 9 9 7
16 10 19 9. 7
16 16 7 24 10 12 8 10. 12 « w · 20 17. 15. 9
17. 4
·"· · ·" · •e ·
JUN
16 31 14 7 10 15 12 10 18 6 7 10 7 20 9
13 12. 9 11 14 8 25 8 8 7
—— · 16 β β · 23 12 2. 8 14. 4 19 15 28
JUL
16 20 10 6 11 15 12 9 18 6 8 9 6 7
12 9 7 9 9
10 8 20 8 8 10 8. 7.
~~ · 17. 10. 8. 8 15. 5
14. 10. 17.
AUG
14 26 12 7 13 14 11 13 27 9
12 9 6 10 9 9 6 7 9 14 8 16 8 5 8 9. 8. 29. 15. 10. 8. 5 11. 4
~~ · β β · " ■ " ·
SEP
25 38 12 9 17 19 18 14 34 13 12 14 10 21 16 10 7
16 22 24 12 27 16 16 16 11 8 40 31 22 14 16 24 8
__ β β __
cas nû
36;Î 360 36Ü 351) 36;: 3o;. 36!) 365 360 35$ 360 365 365 360 343 359 358 363 365 365 365 365 357 365 365 112 301 16J 294 243 363
Û 315 33¿ 173 173 173 212 143 39
21 d 210 89 8d 91!

78 Annual Report 82
Pollutant 2: Monthly medians
Senke (column caption: see Al.l)
Station code PPCVVSSSPLTM
041010650210 041010970210 042020010210 042020080210 042020120210 042020180210 043020120210 043020150210 043020190210 043020230210 044010010210 044010020210 044010040210 044010080210 044010320210 044010330210 053010010204 053010020204 053010040204 053010070204 053010100204 053011030204 054010010205 055010010206 055020020205 075013520201 075013530201 075023550201 075033600201 076990010201 091010150207 091011060207 091012030207 091013040207 091014040207 091015050207 091021110207 091021150207 091022130207 091023100207 091030190207 091030260207 091031100207 091032090207 091033170207 091033180207
Values in measurement unit cas Town name OCT NOV DEC JAN FEB MAR APR MAY JUN OUL AUG SEP no
81 82
PARIS PARIS MARSEILLE MARSEILLE MARSEILLE MARSEILLE LILLE-R0UB-T LILLE-R0UB-T LILLE-R0UB-T LILLE-R0UB-T CLERM0NT-FER CLERMONT-FER CLERMONT-FER CLERMONT-FER CLERMONT-FER CLERMONT-FER DUBLIN DUBLIN DUBLIN DUBLIN DUBLIN DUBLIN CORK GALWAY CORK COUNTY LUXEMBOURG-V LUXEMBOURG-V ESCH-SUR-ALZ STEINFORT SITE DE FOND
G G G G G G
LONDON LONDON LONDON LONDON LONDON LONDON MANCHESTER MANCHESTER MANCHESTER MANCHESTER W.MIDL.CONUR W.MIDL.CONUR W.MIDL.CONUR W.MIDL.CONUR W.MIDL.CONUR W.MIDL.CONUR
40 44 40. 49. 75. 74. 14. 30. 40 74 69.113 25 25 26 25. 20 22 23 29 9. 23 14 13. 4 11 2 2 23 22 17 30
46. 66. 18. 89. 41. 42 47. 27. 26. 7 9 4. 2 16 13
40. 33. 67. 49. 39. 46
35 37 33 37 59. 45
78 72 92
58 60 32. 80 78 44 59 48 45.
40 32 20 14 27 12 6 4 33 24 13 24 24 15
9. 7
20 26 48. 28. 15. 21 15
14 13 20 21 13 18 6 3 17 22 8 9 9 11 18 22 10 11 16. 18. 29. 22. — 19. 20. 24. 15. 17. 15 18.
9 31. 14 6
17. 20 19. 22. 11 26. 51. 42. 40. 17. 23.
4 8 7. 8.
8 11 6 9
37. 34 24 24
26 32 57. 49
— . — . 25. 13. 16. 7 26. 19 20. 17 24 15 8. 9 17 17 13 14 12. 17 21. 31 20. 15 23. 26. 25. 28 16. 33. 35. 20. 25. 21. 13 30. 24. 17 21. 14. 15. 22. 20. 19. — . — . 14. 15 11 7. 13 12 6. 28. 35 24. 28. 26 15.
47 28 27 22 20 37
6 20 9 15 8. 21 7 19 7. 13. 7. 11, 1 2
4. 5. 7 — . 1. 2 1 27. 8. 11 11. 22. 26. 6. — . — . — . 10. 12.
13. 8. 7 6. 7. 9 13 12 7. 6 8 6 4 4 3 3 3 6 15 14 11 10 11 16
19. 9. 9. 7. 24. 20. 11. 9.
17 16 13 7.
6. 9.
6.
9. 14.
7.
61 88 60 56 78 70 92 89 91 91 72 71 87 92 92 92 183 176 183 364 351 363 30 309 149 113 242 278 364 358 357 180 158 176 158 119 129 244 258 112 155 141 179 180 151 179

79 Annual Report 82
Monthly medians Pollutant 2: Smoke (column caption: see Al.l)
Station code PPCVVSSSPLTM
Values in measurement unit cas Town name OCT NOV DEC JAN FEB MAR APR MAY JUN JUL AUG SEP rio
81 82 091034130207 092010200207 092010610207 092010680207 092010730207 092010910207 092022080207 092023220207 092024040207 092024060207 093010180207 093010300207 093020400207 093020480207 093020820207 093030010207 093031310207 093032060207 093033040207 094010110207 094010150207 094010330207 094020090207 094020100207 094020110207 094020120207 094030120207 094030170207 094030200207 094040050207 094040080207 094040100207 094050090207 094051140207 094052010207 094052290207 094053060207 094053100207 095010090207 095020020207 095020060207 095030050207 095030100207 095050050207 095050110207 095050150207
W.MIDL.C0NUR GLASG0W+SURR GLASG0W+SURR GLASG0W+SURR GLASG0W+SURR GLASG0W+SURR MERSEYSIDE C MERSEYSIDE C MERSEYSIDE C MERSEYSIDE C LEEDS LEEDS SHEFFIELD SHEFFIELD SHEFFIELD TYNESIDE TYNESIDE TYNESIDE TYNESIDE BELFAST BELFAST BELFAST CARDIFF CARDIFF CARDIFF CARDIFF EDINBURGH EDINBURGH EDINBURGH PORTSMOUTH PORTSMOUTH PORTSMOUTH TEESSIDE TEESSIDE TEESSIDE TEESSIDE TEESSIDE TEESSIDE BARNSLEY BATH BATH BEDFORD BEDFORD LINCOLN LINCOLN LINCOLN
24. 32. 58. 29. 37. 21. — 19 11 53 22 18. 17. — 13 10 78 23 17 8 3 57 14 12 7 4 22 31 31 63 8. 7. 26.
12. 10. 33. 14 14 24 9 9 17
17. 15. 45. 26. 32. 79.
9 7 37 37 20. 14. 28. 19. 41. 27. 18 19 43. 44. 64. 53.
19. 13. 16. 8.
23 7.
11. 11 5
28. 41. 29.
7 4 7 3 3 7 23 23 19 23 23 23 13. 13. 12. 12. 7. 7. 10 10 7 5 6 12 7 6 7 5 5 10
10 14. 15 16 28 21. 19. 29. 13. 10. 14. 37. 41. 59. 36. 29. 47. 46. 43. 50. 20 23 38 9 12 25 12 15 18 18. 24. 41. 21. 23. 57. 20. 21. 50. 27. 25. 60. 5 6 11 8 11 15
47. 24. 46. 45. 31. 22. 36. 38. 18. 27 55. 44. 28 17 18 17 18 21 25. 23. 61. 34. 31. 25. 37. 36. 8 9
15 14 8. 9. 22. 19. 13.
10. 14. 25. 25. 18. 12 7 17 12. 13 14 12 21 19 14 21 18 12 9 10 23 28 18 27 21 58 45 112 101 53 11. 16. 28. 12. 15. 17. 25. 40. 29. 40. 13. 14. 44. 34. 19. 21. 37. 68. 32. 21. 11. 13. 40. 28. 10.
8 21. 14. 13 23 40. 12. 10. 14. 9.
16 16. 21. 4. 5. 6. 8 9. 8. 6
10. 22. 41. 11. 7.
14. 6. 7
16. 10.
M^ 32 17
23 34
11 —
7 15 ·*·"
23.
13. 12 7.
"«
— β . 27
9
. 27 19
8 . —
7 . 11
—
10
15. 11 8.
— — ■
M
. 28 8
. 14 12
. 9 7
. —
4 8
™
10
15. 7 3.
" — I
* » v
. 20 6
. 9 9
. 5 5
, —
5 4
~
7
13. 4 7.
™ t
. 11
. —
. 13 10
6 8
—
4 . 5
——
7
16. 7 10. __ «
. 19.
. — .
. 23. 17
. 11.
. 11.
. — .
9 . 9. ——.
9
19. 15 6.
β β
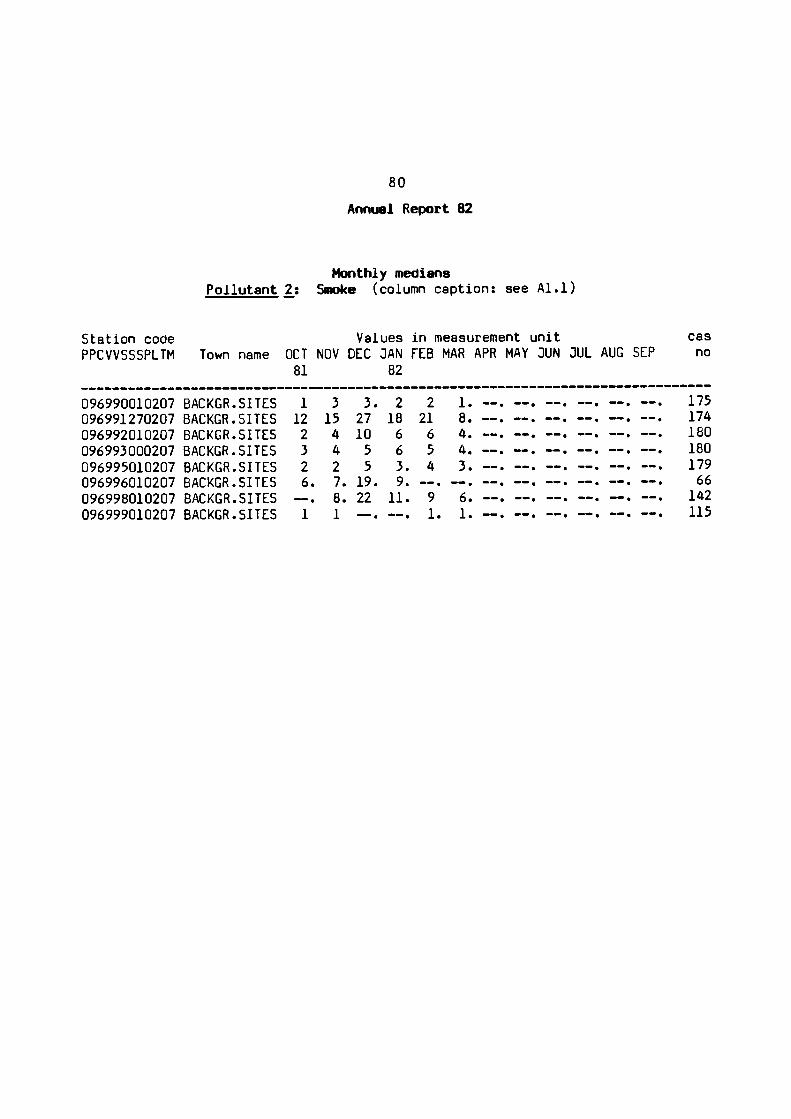
80 Annuel Report 82
Pollutant 2: Monthly medians
Smoke (column caption: see Al.l)
Station code PPCVVSSSPLTM
Values in measurement unit cas Town name OCT NOV DEC JAN FEB MAR APR MAY JUN JUL AUG SEP no
81 82
096990010207 BACKGR.SITES 1 096991270207 BACKGR.SITES 12 096992010207 BACKGR.SITES 2 096993000207 BACKGR.SITES 3 096995010207 BACKGR.SITES 2 096996010207 BACKGR.SITES 6. 096998010207 BACKGR.SITES — 096999010207 BACKGR.SITES 1
3 15 4 4 2
3. 27 10 5 5
7. 19. 8. 22
2 18 6 6 3. 9.
11.
2 21 6 5 4
9 1.
1. 8. 4. 4. 3.
6. 1.
175 174 180 180 179 66 142 115

81 Annual Report 82
Monthly medians Pollutant 3: SPM (column caption: see Al.l)
Station code Values in measurement unit bas PPCVVS5SPLTM Town name OCT NOV DEC JAN FEB MAR APR MAY JUN JUL AUG SEP no
81 82
022010080302 MUENCHEN, BA 47 96. 64. 63.100. 70 71 57. 54. 63. 48. 84. 300 022010100302 MUENCHEN, BA 66. 92. 81 97.151.124.135.118. 82.107. 97.116. 320 022010140302 MUENCHEN, BA 25. 34. 32. 41 71. 32. 41. 39. 30. 36. 27. 47. 320 022010150302 MUENCHEN, BA 26. 43 39 72. 99. 57. 59. 56. 36. 56. 36. 62. 300 022010160302 MUENCHEN, BA 22 29. 30. 37. 76. 35 44 35. 19. 38. 26. 53. 337 023010010303 DORTMUND 44. 69. 78. — . — . 65. 91. 79. 71. 72. 55. 95. 97 023020010303 DUISBURG 69. 65. 81.136.173. 89.125. 71.107.106. 59.129. 95 023030020303 DUESSELD0RF 40. 45. 53. 81.103. 51. 87. 59. 57. 75. 59. 94. 133 023040010302 FRANKFURT-MA 49 48 55 76 96 71 70. 62 59. 72. 50. 80. 327 023040050305 FRANKFURT-MA — . 17. 31. 40 46. 17. 16. 21. 17. 19 15. 20. 272 023050810306 NUERNBERG, B 48. 55. 45. 68.105. 47 44. 46. 42. 58. 34. 56. 301 023050820306 NUERNBERG, B 27. 31. 19. 17. 92. 43. 47. 45 33. 46. 33 47 302 023060010326 STUTTGART 6 10 6. 39. 38 16. 18 18 17. 14 7 15. 304 023060020326 STUTTGART 9 15 14 19. 39 9 10 10. 8. 14 8. 16 353 023060030326 STUTTGART — . — . — . 26 51 14. 14 16 14. 26 15 30 266 023060040326 STUTTGART — . — . — . 29 53 16 17 20 21. 29. 20 36 258 024010710306 AUGSBURG, BA 28. 34 32 68. — . — . 73. 65 75 84. 56. 73. 284 024020540306 ERLANGEN, BA 44. 43. 44. 44.106 46. 45. 45 45 45. 44. 46. 314 024030010326 KARLSRUHE 14 18 20. 28. 38 14 17 17. 13. 16 12. — . 323 024030220326 KARLSRUHE 21 29 22. 42 65 22 17 16 19. 25 17. 29. 349 024040010302 KASSEL, HESS — . — . —.108.140. 74. 70. 68 83. 65 54 70 255 024050060325 LUDWIGSHAFEN 31. 27. 33. 56. 97. 39. 50. 43 55. 59. 26. 62. 305 024050070325 LUDWIGSHAFEN 39. 31. 41. 77.137. 32. 56. 64. 51. 82. 35. 66. 306 024050080325 LUDWIGSHAFEN 41. 33. 33.159.164. 82. 60. 89. 79.120. 73.138. 288 024061100326 MANNHEIM — . 7. 15 19 37 8. 14. 15. 11. 17. 12. 28. 284 024061110326 MANNHEIM 13. 25. 30 33 61 21. 19. 18. 16. 18. 19. 30. 328 024061120326 MANNHEIM 14. 16. 24 28 48 19. 19. 18. 19. 21. 18. 27 329 024070310306 REGENSBURG, 30. 33. 25. 29.117. 63. 60 46 40 41. 28 45 300 024080010302 WIESBADEN, H 44. 45 74 96 136. 66. 77. 64 54 64. 55. 69. 331 024080020302 WIESBADEN, H 30 28. 36. — . — . — . — . — . — . — . — . — . 80 024090640306 WUERZBURG, B 29. 25. 40. 49. 81. 33. 33. 33. 27. 40. 27. 32. 314 024100110306 INGOLSTADT, 21 34 38. 40. 86. 36. 37. 39. 37. 45. 30. 53. 340 024110850306 FUERTH, BAYE 36 39 45 63. 87. 40. 41 43. 28. 38. 29. 41. 342 024120030325 MAINZ 21. 18 32. 45. 99. 37. 17. 42. 25. 52 31. 57. 323 024120040325 MAINZ 38. 40. 55. 57. 95. 51. 62. 68. 87. 91. 58. 86. 296 024120050325 MAINZ 31. 24. 36 63.143. 48. 49. 42. 35. 55. 26. 51. 297 024130010326 FREIBERG 3 4. 5. 4 — . 3. 4. 3 2. 9 6. 10. 271 025010610306 ASCHAFFENBUR — . — . — . 53. 94. 48. 34. 29 27. 35. 21. 30. 221 025020910306 KELHEIM, BAY 26. 30. 34 40. 61. 34. 35. 25. 17. 24. 23. 38. 340 025030010326 HEILBROENN 13 21. 26 41 73 19 12 15 13. 21 12 22 353 025040010326 ULM 13 16. 25 36. 81 18. 13. 16 11. 15. 12 22 340 025050010325 SPEIZER 24. 9. 8. 88.113 40. 65. 48. 28. 69. 39. 48. 283 026990020308 B.R. DEUTSCH 19 25 20. 46 86 31. 41 33 30. 48 29 43. 350 026990030308 B.R. DEUTSCH 28 29 40 53 84 31. 46 36. 40 59 36 56 363 026990040308 B.R. DEUTSCH 20. 25 26. 32 57 32 47 40 42 63 31 50 363 0269900r0308 B.R. DEUTSCH 34. 26 54 58. 81 40. 35 33. 43 39 50 69. 359

82 Annual Report 82
Monthly medians
Station code PPCVVSSSPLTM
026990060308 026990070308 026990080308 026990090308 026990100308 026990120308 026990130308 026990140308 026990150308 026990160308 026990240326 032011010347 032011020301 032011030347 032012100347 032012210347 032013300301 032013310301 032013340301 032013350301 032013420347 032013480347 034018150347 034029150347 035015650347 035025150347 035033510347 035046350347 062010010315 062010020315 062010030315 062010040315 064040020315 064040030315 064040050315 064080010315
Pollutant 3:
Town name
B.R. DEUTSCH B.R. DEUTSCH B.R. DEUTSCH B.R. DEUTSCH B.R. DEUTSCH B.R. DEUTSCH B.R. DEUTSCH B.R. DEUTSCH B.R. DEUTSCH B.R. DEUTSCH B.R. DEUTSCH KOBENHAVN KOBENHAVN KOBENHAVN KOBENHAVN KOBENHAVN KOBENHAVN KOBENHAVN KOBENHAVN KOBENHAVN KOBENHAVN KOBENHAVN AALBORG ODENSE ESBJERG FREDERICIA NAESTVED RANDERS TORINO TORINO TORINO TORINO BOLZANO BOLZANO BOLZANO PESCARA
OCT 81
19 10 29 33 22 28 15 12 20 30 ~" — 22
"· 31 20 39 19 — —
— — . — 117. 168 142 264. 20. 26 ~ ™ 4 97.
SPK
NOV
21 . 14 . 22 . 23 23 21
. 25. 14 21 27
. 11. » · · · 17
M #
. 19.
. 20 32. 14 ~ ™ ·
■ — .
β β · M W #
β — · 199. 261. 247. 205. 13. 36 β —
■ ·
135.
I (
DEC
16 7 49 47 32 39 25 13 27 47 14 ™™ 26
™™ 28 32 23 — —
— ~ —
185 204. 197 163 24 45. ·»· 77.
column caption: see Al.l]
Values JAN FEB 82
14 38. . 7 19 36. 74
. 59.114 26. 76 41. 91
. 55 59 25 47 38 80 59.101
. 17 24. β β· »··
31. 43
" · · ™ ~ · 33. 40.
36 85 28. 39 "·· ··· "™ · ·~·
. —.141. — .163.
. —.137.
.167.218. 400.371. 335.292 204.271. 26. 33. 51. 53 " ™ · " · · 148.141.
in measurement unit MAR
31. 14 41 43. 32 41 30 22 37 58 3.
β β · 34
"" · 33 58 35. " ™ · •— ·
60 57. 77. 95. 55. 123. 237 191 182 19. 37. "· ·
106.
APR
46 30 46. 31. 42 33 45 37 41 76 5. 30. 23 41. 23. 72. 42 49. 26. e™ · 61. 57. 52 79. 82 75 109 229. 174. 205. 20 32 • ™ · 80.
MAY
42 27 34. 41. 33 34 34 29. 37 55. 4 43. 93 43. e" ·
"e ·
39. "^ · 66 48. 52 64. 69. 62 116. 173. 137.
18 35 ™" ·
102.
JUN
34 16. 31 36. 34 42 27 23 33 38. 3. 38 87. 34. 37
"* · 37. — · 84 47 54 55. 62 67. 98.
171. 139.
21. 32. 56. 88.
JUL
43. 33 28. 45. 47 43 45 29 47. 86 8 33. 96. 31 34
•e ·
34 — . 52 46. 50 49. 53 55
147. 172. 142.
18. 29. 37.
103.
AUG
34 19 38. 42 34 47 25 19. 38 49 4. 51
107. 44 49.
— . 44 * ™ · 62. 51. 52. 54 73 56. 79.
107. 86. — . 27. —. 82.
SEP
55 31 46 75 53 58 43 33 54 69 9 60 99 59 57
— 58 64 87 60 66 76 86 81 109 185 134 — < — < — . 130.
cas no
356 356 344 315
. 357 354 358 363 363 344 303
. 153 206 144 113 1 1 > 151
. 158 42
1 "Tfc
. 211
. 179 148 23 163 209 214 202 222 169 267 318 344 181 279 300 43 101

83 Annual Report 82
Monthly medians Pollutant 4: Acid (column caption: see Al.l)
Station code PPCVVSSSPLTM
012010010403 012010020403 012010080403 012010140403 012010170403 012010220403 012010260403 013018010403 013018090403 013018120403 013018130403 013018180403 013018260403 014015010403 014015040403 014015050403 014015090403 014015130403 014015140403 014027010403 014027060403 014027070403 014027090403 014027120403 014027150403 014032020403 014032050403 014032150403 014032180403 014032290403 014032300403 015016050403 015026020403 015026030403 015033020403 015044040403 015044050403 015044110403 041010110408 041010170408 041010490408 041010650408 041010970408 042020010408 042020080408 042020120408
Town name
BRUXELLES BRUXELLES BRUXELLES BRUXELLES BRUXELLES BRUXELLES BRUXELLES ANTWERPEN ANTWERPEN ANTWERPEN ANTWERPEN ANTWERPEN ANTWERPEN CHARLEROI CHARLEROI CHARLEROI CHARLEROI CHARLEROI CHARLEROI GENT GENT GENT GENT GENT GENT LIEGE LIEGE LIEGE LIEGE LIEGE LIEGE BRUGGE KORTRIJK KORTRIJK LIBRAMONT NAMUR NAMUR NAMUR PARIS PARIS PARIS PARIS PARIS MARSEILLE MARSEILLE MARSEILLE
OCT 81
94 49 28 14 38 27 18 90 90 54 76 91 115 29. 28. 46. 74 15. 40 38 71 64 68 79 75 •™ · 64 "·" ·
75 59 49 46 18. 30 28 42 41. 54. 42 44. 35. 54. 32. 24.
NOV
108 54 30 21 49 41 27 90 98 47 90 100 77 40. 39. 43 67 26 49 52 45 45 53 56 63 82. 57. 63. 80 57 38 52 26. 33. 45. 52. 69 104. 74. 93 71 80. 25. 44.
Values in DEC
130. 87. 53. 17. 71. 76. 47 91 116 78 97 112 106 38 46 68 78 56 74 75 60 60 60 75 60 94. 91. 63. 107 88. 84 94 39. 30 66 73 85 122 101.
83 71. 31. 48.
JAN 82
138. 86. 57. 53. 74. 73. 55
125. 153. 115. 144. 83. 124. 51 48 81 73 58 87 83 49 79 56 71 60 —. 74 — .
118. 42. 71 60. 42. 22. 46. 32.
• ™ · ™ ~ · •— ·
FEB
118 92. 54 38 56 73 62
132. 113. 149. 146. 109. 120. 62 48. 63 67 72 65 53 47 58 60. 69 45 146. 92 mm*m ·
132. 83. 64 82. 50 25 39. 35
—™ · — . .
mea MAR
83 98 32 21 46 40. 38 76 84. 53. 73. 83 90 64. 23 48 56 41 63 30 34 34 30. 38 41 111. 94 ""
e · 63. 88 66. 36 38. 30 33. 36. 29.
"™ · ™ " · .
sûrement APR
74 75 39 37 43 23. 52 68 70 55 67 56 63 52 24 48 20. 30 40 60 39 34 49 39 39 63. 79 — . 101 88 53. 32. 43. 36 ™
β · ™ · · β β ·
™ · · "™ · *~ ·
MAY
59 61 26 25 37 18. 41 68 63 50 58 64 75 46 38 35 28. 25 49 45 38 38 56 45 38 74. 65 ■ " · ·
90 96. 68. 26 30. 30 ™
β · ·· · "·
— ·
™ · · ™ ~ · ~™ ·
unit JUN
45 51 29 17 28 33 31 60 59 44 64 64 69 51 13 25 36. 25 45 58 53 39. 69 41 45. — . 97 — . 62. 58 35. 17 17. 22 38 32 36
β· · — . ™ " ·
JUL
32 48 24 16 26 30 28 58 52 41 42 45 68 18 20 20 40 41 36 41 30 60 113 79 19 90. 93. ™ " · 89. 96. 75. 17 14. 28 33. 31. 34.
™ ~ · ""· · " ™ ·
AUG
30 40 32 20 20 21 24 71 46 26 49 71 87 29. 5 12 18 16 35 38. 30. 38. 53 233. 34 41. 62. 30. 16. 45. 23. 9 9. 18 "β ·
Μ *
β β »
"™ · W V ·
"· ·
SEP
46 64 43 21 33 28 37 71 79 73 59 77 95 48 20 18 37 35 41 53 49 44 69 46 49 49 61 74 39 49 37 23 16 28
~ ~
— — —
cas no
362 360 362 355 362 301 365 358 352 346 346 358 358 359 343 359 360 356 365 362 357 352 358 354 358 112 301 70 147 294 241 363 0
315 336
. 173 169 173 91 87 90 60 91 57 53 63

84 Annual Report 82
Monthly medians Pollutant 4; Acid (column caption: see Al.l)
Station code PPCVVSSSPLTM
042020180408 043020120408 043020150408 043020190408 043020230408 044010010408 044010020408 044010040408 044010080408 044010320408 044010330408 044020120411 044020210411 044020290411 044020310411 044020320411 044020430411 044040010411 044040040411 044040060411 044040070411 044040080411 044040110411 045010250408 045010260408 045010310408 053010010404 053010020404 053010040404 053010070404 053010100404 053011030404 054010010405 055010010406 055020020405 075013520401 075013530401 075023550401 075033600401 076990010401 091010150407 091011060407 091012030407 091013040407 091014040407 091015050407
Town name
MARSEILLE LILLEROUBT LILLEROUBT LILLEROUBT LILLEROUBT CLERMONTFER CLERMONTFER CLERMONTFER CLERMONTFER CLERMONTFER CLERMONTFER LE HAVRE LE HAVRE LE HAVRE LE HAVRE LE HAVRE LE HAVRE ROUEN ROUEN ROUEN ROUEN ROUEN ROUEN CALAIS CALAIS CALAIS DUBLIN DUBLIN DUBLIN DUBLIN DUBLIN DUBLIN CORK GALWAY CORK COUNTY LUXEMBOURGV LUXEMBOURGV ESCHSURALZ STEINFORT SITE DE FOND LONDON G LONDON G LONDON G LONDON G LONDON G LONDON G
OCT 81
56. 50 41 28 62 23. 23 24 28 0 4. 2 17 17 9 54 27 15 53. 25 51 6.
114 0 5 21
102.
40 31 57.
11 — · 96 78 62 29 28 31 45 44 56 82
NOV
95 61 62. 43 78 39 32. 51 44 2. 25. 5
30. 18 18 56 27 41 97 47 121 29. 139 0 9 35.
93.
52. 38 63
11 ·· · 70 55 50 31 28 30 57 56 67 87.
DEC
56. 91 91. 63. 95. 25 29 32. 28 35. 69. 25. 62 28 69 67 56 46. 107 63. 95 28 109 2. 11 46
90.
61 62 77 24. — · 45 57. 35 31 36. 55 97. 83. 59
108.
Val JAN 82
™™ ·
™* ·
71.
61 51 72 29. ™
e ·
49. 44. 40 22 44 49 62. 61. 71
133.
ues FEB
" ■ · ·
65
47 49 66.
11. e~ · 20. 46 43 32 37 47 58 55 77. 112
in measurement unit MAR
"· ·
104
43. 51 59.
17 — . 47. 30 38. 35 27 22 39. 39. 43. 74. 81.
APR
•™ ·
73 — · 44 50 48 28
12 18. 58. 29. 35. 35 20 31
MAY
™— ·
64
36 42 42 48 6 22. 28. •— ·
28. 23 16 34
JUN
** ·
53
33 43 44 33 6
— · 30 ~· · 26 17. 11 29
JUL
• ™ ·
53
31 51 48. 42 6
— · 35. •e ·
15. 17 8 17
AUG
"e ·
41
25 31 25. 30 74. 11. " ™ · 36. 16. 16. 13 7 23
SEP
— β
36
21 27 31 25 48 6.
— ■
20. 24. 18 17 17 23
cas no
70 92 89 91 91 73 71 87 92 58 67 85 88 92 92 92 92 85 89 88 92 89 92 85 92 90 183 177 183 361 351 360 37 315 39 113 242 278 364 365 357 180 158 176 159 118

85 Annual Report 82
Monthly medians Pollutant 4; Acid (column caption: see Al.l)
Station code PPCVVSSSPLTM
Values in measurement unit cas Town name OCT NOV DEC JAN FEB MAR APR MAY GUN JUL AUG SEP no
81 82
091021110407 091021150407 091022130407 091023100407 091030190407 091030260407 091031100407 091032090407 091033170407 091033180407 091034130407 092010200407 092010610407 092010680407 092010730407 092010910407 092022080407 092023220407 092024040407 092024060407 093010180407 093010300407 093020400407 093020480407 093020820407 093030010407 093031310407 093032060407 093033040407 094010110407 094010150407 094010330407 094020090407 094020100407 094020110407 094020120407 094030120407 094030170407 094030200407 094040050407 094040080407 094040100407 094050090407 094051140407 094052010407 0940522
c0407
MANCHESTER G MANCHESTER G MANCHESTER G MANCHESTER G W.MIDL.C0NUR W.MIDL.C0NUR W.MIDL.CONUR W.MIDL.CONUR W.MIDL.CONUR W.MIDL.CONUR W.MIDL.CONUR GLASGOW+SURR GLASGOW+SURR GLASGOW+SURR GLASGOW+SURR GLASGOW+SURR MERSEYSIDE C MERSEYSIDE C MERSEYSIDE C MERSEYSIDE C LEEDS LEEDS SHEFFIELD SHEFFIELD SHEFFIELD TYNESIDE TYNESIDE TYNESIDE TYNESIDE BELFAST BELFAST BELFAST CARDIFF CARDIFF CARDIFF CARDIFF EDINBURGH EDINBURGH EDINBURGH PORTSMOUTH PORTSMOUTH PORTSMOUTH TEESSIDE TEESSIDE TEESSIDE TEESSIDE
96. — . 64. 30. 65
29 15 73. 53 43. 73
52 35
26 46 34. 61. 56 37 67. 47. "*" · 22 36 26. 18. 40. 24. 43. 54 "̂6 18 32. 31. 16. 42. 34 39
52. 28. 13 22
90. 98. 67. 45. 55.
37 76 68 50 43. 49
46 37
26 40 32. 56. 64 39 72. 67. ™ ~ · 65. 50 28. 19. 41. 22. 42. 59 45 18 43. 32. 17. 39. 27 47
37. 13. 12 22
173. 129. 153. 75. 110.
88 55
115. 76 50. 137
110 89
63 106 88.
112. 86 43 113. 115.
—™" ·
79 31. 17. 48. 27. 43. 83 49 25 73. 73. 42. 85. 27 58.
71. 17. 17 38
131. 99. 113. 75. 91.
48 46 65. 71 . 53. 73
63 61
25 77 55. 85. 104. 62 82.
108. — M #
65. 60. 30. 46. 40. 50. 60 43 18 46. 70. 33. 52. 34. 48
65. 26. 12. 31
128. 86. 93. 57. 77.
47 31 71 61 62. 65
74 35
27 71 27. 78. 100. 61 145. 111. — .
61. 39. 24. 45. 64 62. 25 43 12 44. 42. 18. 45. 36. 51
38. 13. 9.
22.
77. 55 70 40. 71. 84. 32. 15. 73. 54. 31. 63.
62. 44. 40. 21. 36 9.
80. 53 42 77. 62. 87.
22 29. 24. 49 55 53. 20. 28. 12. 42. 26 18. 34. 28. 42. 50. 39 7. 6. 7
89. 84. —
63
—
31
42 — 94 50 32 — — 95
45 —
45 32 —
— 39 — —
36 57 —
15
57. 79.
41
—
21
36 . — 67 55 42
. —
. —
. 81
35 . —
. 41 32
. —
. — 33
> — . —
42 . 37 —
. 14
53. 50. .
35
—
31
51 . — 79 40 36
. —
. —
. 52
36 . —
. 36 28
. —
. 36 46
. —
.
26 35 —
7
65. 47. .
40.
—
31
48 — 62 19 30
. —
. —
. 53 41
. —
. 32 36
■ —
33 38
. —
.
32 42 —
7
38. 33.
18
—
26
37 — 40 25 36
. —
. —
. 57
. —
. —
. 35 36
. —
25 38
. — >
39 61 —
8
49. 48.
9.
— .
30
42 . — . . 56. 48 45
. — .
. — .
. 66.
. — . ■ — .
. 37. 47
. — .
35. . 32. > . , — ,
39 43.
. — .
14.
130 247 258 112 150 141 180 180 151 179 115 180 0
180 180 185 180 365 121 242 357 365 107 120 115 33 276 128 128 269 336 126 180 180 180 200 302 122 123 177 179 185 273 130 172 349

86 Annual Report 82
Monthly medians Pollutant 4; Acid (column caption: see Al.l)
Station code PPCVVSSSPLTM
Values in measurement unit cas Town name OCT NOV DEC JAN FEB MAR APR MAY 3UN JUL AUG SEP no
81 82
094053060407 094053100407 095010090407 095020020407 095020060407 095030050407 095030100407 095050050407 095050110407 095050150407 096990010407 096991270407 096992010407 096993000407 096996010407 096998010407 096999010407
TEESSIDE TEESSIDE BARNSLEY BATH BATH BEDFORD BEDFORD LINCOLN LINCOLN LINCOLN BACKGR.SITES BACKGR.SITES BACKGR.SITES BACKGR.SITES BACKGR.SITES BACKGR.SITES BACKGR.SITES
24 24 35 24 22 22 23 21 16 14 93 87 131 135 90 36. 29. 49. 36. 29.
40. 36. 74. 67. 71.
59. 64. 85. 64. 45. 52. 64. 92. 64. 40. 42. 61. 44. 87. 50. 11 11 15 11 9 37 33 66 46 37 26 20 34 27 27 8 15 8 7 15
13. 13. 78. 83. — . — . 37. 92 48 44 18 12 — — . 18.
26. — 15. — 61. — 38. — 29. 32 51. — 34. 67 94 49 52. — 45. — 11. — 38. — 20. — 17. —
43. — 23. —
30
72 36
35
78 33
30
54 36
32
62 32
23
48 34
180 180 180 123 129 118 183 254 112 106 179 174 180 180 66 143 115

87 Annual Report 82
Pollutant 19: Monthly mediana
Lead (Pb) (column caption: see Al.l)
Station code Values in measurement unit cas PPCVVSSSPLTM Town name OCT NOV DEC JAN FEB MAR APR MAY JUN JUL AUG SEP no
81 82
032011011901 KOBENHAVN — — — — — —124.329.323 235.338 255. 142 032011031901 KOBENHAVN —. —. —. —. —. —.427.499 499.499.499.499. 125 032012101901 KOBENHAVN — — —. —. —. —. — — 1 1 6 . 91 97 128. 104 032012211901 KOBENHAVN —. —. —. — — —. 63.147.142.121 138.210. 136 032013421901 KOBENHAVN — —. — — —. —. 66. 96.100. 84 64 102. 143 032013481901 KOBENHAVN —. —. — —. —. —. —. —. —. — —.172. 17 034018151901 AALBORG —. —. —. —. —. —.499.499 499 499 499.499 163 034029151901 ODENSE — —. — —.258.295 304.211.301 219.263.301. 209 035015651901 ESBJERG —. —. —. —.230.188.210 185 264 265 217.263. 214 035025151901 FREDERICIA — —. —. —356.298.319.303.312.243.218 291. 201 035033511901 NAESTVED — — — —.482.367.471 438.412 451 345 459 222 035046351901 RANDERS —. —. —. —. —.409.391.499 383.459 499.499. 164 053010011902 DUBLIN —. —. —.499.499.499.499.499.499.499.499. —. 37
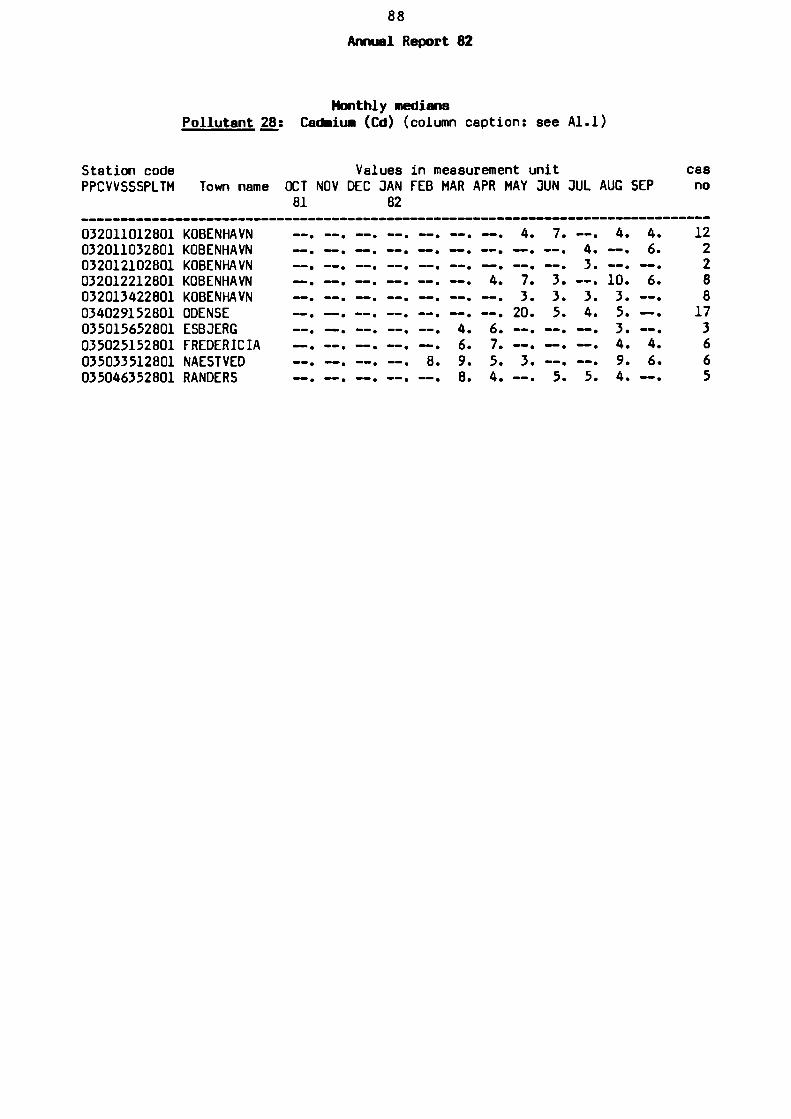
88 Annuel Report 82
Monthly mediens Pollutent 28; Cadmium (Cd) (column caption: see Al.l)
Station code PPCVVSSSPLTM
Values in measurement unit cae Town name OCT NOV DEC JAN FEB MAR APR MAY JUN JUL AUG SEP no
81 82
032011012801 032011032801 032012102801 032012212801 032013422801 034029152801 035015652801 035025152801 035033512801 035046352801
KOBENHAVN KOBENHAVN KOBENHAVN KOBENHAVN KOBENHAVN ODENSE ESBJERG FREDERICIA NAESTVED RANDERS
MM . —
. - - .
««· . 8
. 4
. 6
. 9
. 8
, ~ . —. - - . 4 . - - . 6.
. 4 . 7. 3 . — . 10. 6.
. — 3 . 3 . 3 . 3 . —
. —. 20. 5. 4 . 5. —.
, 7. —. —. —. 4 . 4. . 5. 3 . —. —. 9. 6. . 4 . — 5. 5. 4 . —
12 2 2 8 8 17 3 6 6 5

89 Annual Report 82
ANNUAL CHARACTERISTICS OF THE SERIES
October 1981 - September 1982
Annex 2; Global description
Column caption:
Label
station code
month
BLA
REP
spa
ze
>9999
cas
min
occ
med
gap
dig
Explanation
PPCVVSSSPLTM: PP country code C town class code VV town code SSS station code PL pollutant code TM measurement technique code
number of months recorded for the year
number of values labelled as "BLANK"
number of values labelled as "REP"
number of values labelled as space
number of null values
number of values higher than 9999 measurement units
poll. 1-4: microg/m poll. 19,28: nanog/m^
number of cases reported for the year (measured values)
minimum concentration for the year (measurement unit)
occurrence of the minimum
median (measurement unit)
number of gaps between 1 and the median (for integer values)
symbol for the number of missing digits into the yearly series. Example: a) 9: 9 digits are missing in the units b) 41: 4 digits are missing in the tens
and 1 digit is missing in the units.
rej cde reject code for the series

90 Annual Report 82
hierarchical condition reject
no. of month < 12 no. of "BLANK" > 170 no. of val. with concentration
> 9999 measurement units no. of measured values < 240 no. of REP > 104 else
code
1 2 3 4 5 0
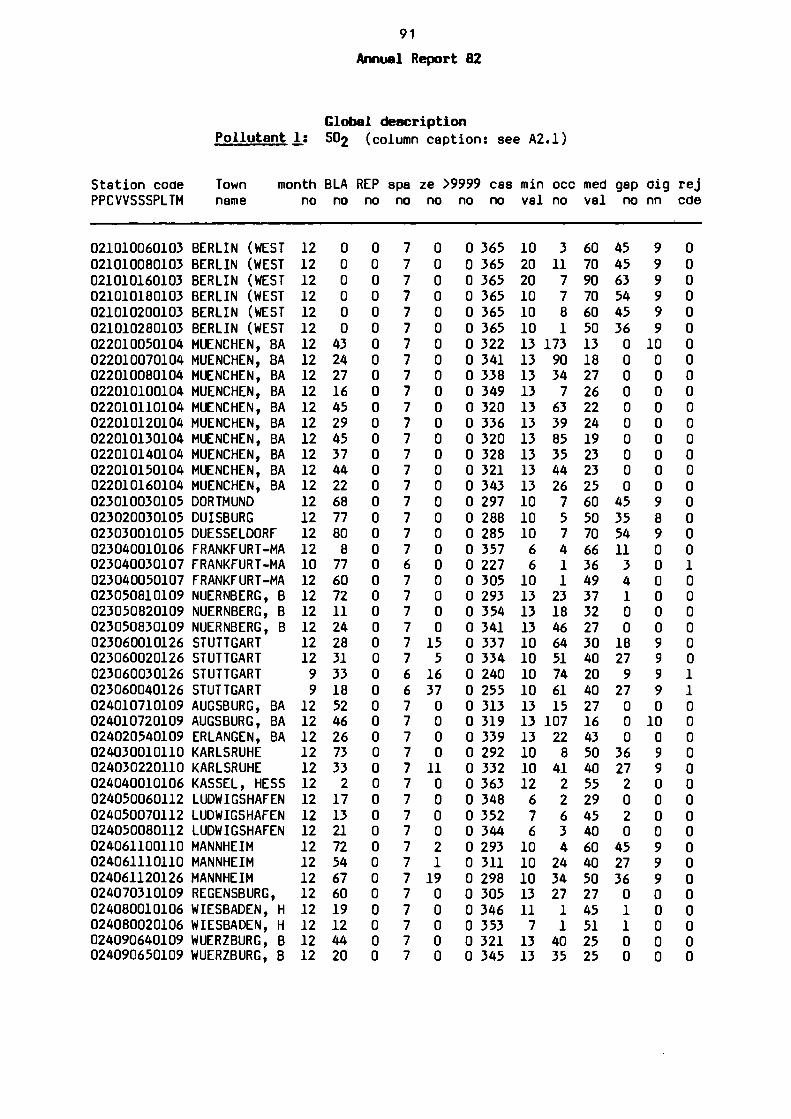
91 Annual Report 62
Global description Pollutant 1; SO2 (column caption: see A2.1)
Station code Town month BLA REP spa ze >9999 cas min occ med gap dig rej PPCVVSSSPLTM name no no no no no no no vai no vai no nn cde
021010060103 BERLIN (WEST 12 0 0 7 0 021010080103 BERLIN (WEST 12 0 0 7 0 021010160103 BERLIN (WEST 12 0 0 7 0 021010180103 BERLIN (WEST 12 0 0 7 0 021010200103 BERLIN (WEST 12 0 0 7 0 021010280103 BERLIN (WEST 12 0 0 7 0 022010050104 MUENCHEN, BA 12 43 0 7 0 022010070104 MUENCHEN, BA 12 24 0 7 0 022010080104 MUENCHEN, BA 12 27 0 7 0 022010100104 MUENCHEN, BA 12 16 0 7 0 022010110104 MUENCHEN, BA 12 45 0 7 0 022010120104 MUENCHEN, BA 12 29 0 7 0 022010130104 MUENCHEN, BA 12 45 0 7 0 022010140104 MUENCHEN, BA 12 37 0 7 0 022010150104 MUENCHEN, BA 12 44 0 7 0 022010160104 MUENCHEN, BA 12 22 0 7 0 023010030105 DORTMUND 12 68 0 7 0 023020030105 DUISBURG 12 77 0 7 0 023030010105 DUESSELD0RF 12 80 0 7 0 023040010106 FRANKFURT-MA 12 8 0 7 0 023040030107 FRANKFURT-MA 10 77 0 6 0 023040050107 FRANKFURT-MA 12 60 0 7 0 023050810109 NUERNBERG, Β 12 72 0 7 0 023050820109 NUERNBERG, Β 12 11 0 7 0 023050830109 NUERNBERG, Β 12 24 0 7 0 023060010126 STUTTGART 12 28 0 7 15 023060020126 STUTTGART 12 31 0 7 5 023060030126 STUTTGART 9 33 0 6 16 023060040126 STUTTGART 9 18 0 6 37 024010710109 AUGSBURG, BA 12 52 0 7 0 024010720109 AUGSBURG, BA 12 46 0 7 0 024020540109 ERLANGEN, BA 12 26 0 7 0 024030010110 KARLSRUHE 12 73 0 7 0 024030220110 KARLSRUHE 12 33 0 7 11 024040010106 KASSEL, HESS 12 2 0 7 0 024050060112 LUDWIGSHAFEN 12 17 0 7 0 024050070112 LUDWIGSHAFEN 12 13 0 7 0 024050080112 LUDWIGSHAFEN 12 21 0 7 0 024061100110 MANNHEIM 12 72 0 7 2 024061110110 MANNHEIM 12 54 0 7 1 024061120126 MANNHEIM 12 67 0 7 19 024070310109 REGENSBURG, 12 60 0 7 0 024080010106 WIESBADEN, Η 12 19 0 7 0 024080020106 WIESBADEN, Η 12 12 0 7 0 024090640109 WUERZBURG, Β 12 44 0 7 0 024090650109 WUERZBURG, Β 12 20 0 7 0
0 365 10 3 60 45 0 365 20 11 70 45 0 365 20 0 365 10 0 365 10 0 365 10
7 7
90 63 70 54
8 60 45 1 50 36
0 0 322 13 173 13 0 341 13 90 18 0 338 13 34 27 0 349 13 7 26 0 320 13 63 22 0 336 13 39 24 0 320 13 85 19 0 328 13 35 23 0 321 13 44 23 0 343 13 26 25 0 297 10 7 0 288 10 5 0 285 10 7 0 357 6 4 0 227 6 1 36 0 305 10 1 49 0 293 13 23 37 0 354 13 18 32 0 341 13 46 27
0 0 0 0 0 0 0 0 0
60 45 50 35 70 54 66 11
3 4 1 0 0
0 337 10 64 30 18 0 334 10 51 40 27 0 240 10 74 20 9 0 255 10 61 40 27 0 313 13 15 27 0 0 319 13 107 16 0 0 339 13 22 43 0 0 292 10 8 50 36 0 332 10 41 40 27 0 363 12 2 55
29 45 40
2 0 2 0
0 348 6 2 0 352 7 6 0 344 6 3 0 293 10 4 60 45 0 311 10 24 40 27 0 298 10 34 50 36 0 305 13 27 27 0 0 346 11 1 45 1 0 353 7 1 51 1 0 321 13 40 25 0 0 345 13 35 25 0
9 9 9 9 9 9 10 0 0 0 0 0 0 0 0 0 9 8 9 0 0 0 0 0 0 9 9 9 9 0 10 0 9 9 0 0 0 0 9 9 9 0 0 0 0 0
0 0 0 0 0 0 0 0 0 0 0 0 0 0 0 0 0 0 0 0 1 0 0 0 0 0 0 1 1 0 0 0 0 0 0 0 0 0 0 0 0 0 0 0 0 0

92 Annual Report 82
Global description Pollutant 1: S02 (column caption: see A2.1)
Station code Town PPCVVSSSPLTM name
month BLA REP spa ze >9999 cas min occ med gap dig rej no no no no no no no vai no vai no nn cde
024100110109 INGOLSTADT, 024110850109 FUERTH, BAYE 024120030112 MAINZ 024120040112 MAINZ 024120050112 MAINZ 024130010126 FREIBERG 025010610109 ASCHAFFENBUR 025020910109 KELHEIM, BAY 025020920109 KELHEIM, BAY 025030010126 HEILBR0ENN 025040010126 ULM 026990010113 B.R. DEUTSCH 026990020113 B.R. DEUTSCH 026990030113 B.R. DEUTSCH 026990040113 B.R. DEUTSCH 026990050113 B.R. DEUTSCH 026990060113 B.R. DEUTSCH 026990070113 B.R. DEUTSCH 026990080113 B.R. DEUTSCH 026990090113 B.R. DEUTSCH 026990100113 B.R. DEUTSCH 026990120113 B.R. DEUTSCH 026990130113 B.R. DEUTSCH 026990140113 B.R. DEUTSCH 026990150113 B.R. DEUTSCH 026990160113 B.R. DEUTSCH 026990240110 B.R. DEUTSCH 032011010127 KOBENHAVN 032011020101 KOBENHAVN 032011030127 KOBENHAVN 032011030128 KOBENHAVN 032012100127 KOBENHAVN 032012210127 KOBENHAVN 032013300101 KOBENHAVN 032013310101 KOBENHAVN 032013340101 KOBENHAVN 032013350101 KOBENHAVN 032013420127 KOBENHAVN 032013480127 KOBENHAVN 034018150127 AALBORG 034029150127 ODENSE 034029150129 ODENSE 035015650127 ESBJERG 035015650129 ESBJERG 035025150127 FREDERICIA 035033510127 NAESTVED
12 12 12 12 12 12 12 12 12 12 12 12 12 12 12 12 12 12 12 12 12 12 12 12 12 12 12 6 7 6 5 4 6 7 2 7 7 6 1 6 8 8 8 8 8 8
22 21 39 32 13 163 16 7 33 40 21 3 13 8 1 12 8 21 19 25 16 6 5 6 12 9 80 30 0 42 3 15 36 69 22 2 2 39 7 21 33 56 32 31 44 23
0 0 0 0 0 0 0 0 0 0 0 0 0 0 0 0 0 0 0 0 0 0 0 0 0 0 0 0 0 0 0 0 0 0 0 0 0 0 0 0 0 0 0 0 0 0
7 7 7 7 7 7 7 7 7 7 7 7 7 7 7 7 7 7 7 7 7 7 7 7 7 7 7 3 5 3 2 2 3 5 1 5 5 3 1 3 6 6 6 6 6 6
0 0 0 0 0 6 0 0 0 11 6 57 92 20 0 22 31 99 80 1 7 8 85 122 21 28 6 0 0 0 0 0 0 0 0 0 0 0 0 1 1 0 3 0 0 1
0 0 0 0 0 0 0 0 0 0 0 0 0 0 0 0 0 0 0 0 0 0 0 0 0 0 0 0 0 0 0 0 0 0 0 0 0 0 0 0 0 0 0 0 0 0
343 344 326 333 352 202 349 358 332 325 344 362 352 357 364 353 357 344 346 340 349 359 360 359 353 356 285 153 212 141 150 107 147 143 39 210 210 144 23 162 209 186 210 211 198 219
13 13 6 6 6 10 13 13 13 10 10 1 1 1 1 1 1 1 1 1 1 1 1 1 1 1 10 5 4 8 5 1 2 1 1 1 3 2 8 2 2 1 1 1 3 3
50 70 4 9 3 54 54 12 42 5 27 73 37 30 3 15 27 48 53 8 7
14 37 25 4 10 36 1 1 2 5 1 1 5 9 2 1 8 1 2 1 4 1 2 2 1
23 40 28 25 36 30 32 27 24 40 40 6 11 11 12 10 8 7
12 13 15 12 10 12 13 18 40 14 23 29 31 9 13 12 3 24 32 8 17 19 17 15 12 16 15 20
0 4 0 0 1 18 0 0 0 27 27 0 0 0 0 0 0 0 0 0 0 0 0 0 0 0 27 0 2 2 4 2 0 0 0 1 2 0 2 1 0 0 0 0 1 0
0 0 0 0 0 9 0 0 0 9 9 20 0 0 0 0 10 50 10 0 10 0 10 20 0 0 9 50 0 20 10 60 40 10 41 0 0 50 61 40 20 20 20 10 30 10
0 0 0 0 0 4 0 0 0 0 0 0 0 0 0 0 0 0 0 0 0 0 0 0 0 0 0

93 Annual Report 82
Global description
Station code PPCVVSSSPLTM
035033510129 035046350127 061010090120 061010100120 061010130120 061010140120 061010150120 061010160120 062010010122 062010020122 062010030122 063020010124 064040010121 064040020121 064040030121 064080010124 065140010124 083015150102 083015160102 083015180102 083015190102 083015200102 083015210102 083015220102 083015230102 083015250102 083024040102 083024050102 083034180102 083034230102 084018140102 084029080102 084029090102 084032130102 084032140102 084046070102 084046100102 085015280102 085022040102 085035300102 085041210102 085053040102 085068060102 086991240102 086992060102 086993120102
Town month name
NAESTVED RANDERS MILANO MILANO MILANO MILANO MILANO MILANO TORINO TORINO TORINO GENOVA BOLZANO BOLZANO BOLZANO PESCARA VERCELLI AMSTERDAM AMSTERDAM AMSTERDAM AMSTERDAM AMSTERDAM AMSTERDAM AMSTERDAM AMSTERDAM AMSTERDAM DEN HAAG DEN HAAG ROTTERDAM ROTTERDAM ENSCHEDE GRONINGEN GRONINGEN TILBURG TILBURG UTRECHT UTRECHT BUSSUM DEN BOSCH HILVERSUM MAASTRICHT MIDDELBURG ZWOLLE LIG.ACHTERGR LIG.ACHTERGR LIG.ACHTERGR
no
9 7 12 12 12 12 12 12 7 7 3 4 10 10 9 11 7 12 12 12 12 12 12 3 12 12 12 12 12 12 12 12 12 12 12 12 12 12 12 12 12 12 12 12 12 12
BLA no
93 43 96 44 69 47 47 27 60 27 2 78 40 23 48 293 73 89 65 59 109 50 66 92 66 73 20 42 21 22 32 34 94 95 47 56 30 99 54 50 114 39 40 33 47 70
REP no
0 0 0 0 0 0 0 0 0 0 0 0 0 0 0 0 0 0 0 0 0 0 0 0 0 0 0 0 0 0 0 0 0 0 0 0 0 0 0 0 0 0 0 0 0 0
spa no
6 3 7 7 7 7 7 7 5 5 1 4 6 6 5 6 5 7 7 7 7 7 7 1 7 7 7 7 7 7 7 7 7 7 7 7 7 7 7 7 7 7 7 7 7 7
ze >9999 cas no
0 0 0 3 0 1 1 0 0 0 0 0 0 0 0 1 0 0 1 2 0 4 0 0 0 0 0 0 0 0 1 13 0 0 3 0 0 0 0 0 0 0 4 0 1 1
no
0 0 0 0 0 0 0 0 0 0 0 0 0 0 0 0 0 0 0 0 0 0 0 0 0 0 0 0 0 0 0 0 0 0 0 0 0 0 0 0 0 0 0 0 0 0
no
180 171 269 321 296 318 318 338 152 185 90 42 264 281 226 42 139 276 300 306 256 315 299 0
299 292 345 323 344 343 333 331 271 270 318 309 335 266 311 315 251 326 325 332 318 295
min vai
3 1 8 3 3 5 3 8 36 16 60 26 6 10 7 3 13 2 1 1 1 1 5 0 4 4 1 2 1 3 1 1 1 8 1 2 2 1 3 2 5 1 1 4 1 1
occ no
1 2 1 5 2 3 2 1 2 1 1 15 3 1 1 5 2 2 4 1 1 8 2 0 1 3 2 1 3 1 4 12 5 2 1 3 1 1 1 1 1 1 6 1 7 2
med val
24 11 75 117 78 55 83 96 213 250 200 52 75 95 107 16 200 21 22 23 25 25 25 0 23 23 25 21 37 28 16 12 13 35 21 19 21 22 29 22 32 20 17 20 18 26
gap no
0 0 41 74 46 31 51 56 134 182 110 25 9 23 40 8
143 0 0 1 0 0 0 0 0 0 0 0 1 0 0 0 0 1 0 0 0 1 0 0 2 0 0 0 0 0
dig nn
0 40 0 0 0 0 0 0 0 0 0 45 0 0 0 20 0 0 0 0 0 0 0 0 0 0 0 0 0 0 0 0 0 0 0 0 0 0 0 0 0 0 0 0 0 0
*ej cde
1 1 0 0 0 0 0 0
0 0 0 0 0 0 1 0 0 0 0 0 0 0 0 0 0 0 0 0 0 0 0 0 0 0 0 0 0

94 Annuel Report 82
Globel description Pollutant 1: SO2 (column caption: see A2.1)
Station code Town month BLA REP spa ze >9999 cas min occ meo gap dig rej PPCyVSSSPLTM name no no no no no no no vai no vai no nn cde
086995010102 LIG.ACHTERGR 12 100 086996170102 LIG.ACHTERGR 12 45 086998150102 LIG.ACHTERGR 12 37 086999010102 LIG.ACHTERGR 12 38
0 0 0 0
7 7 7 7
16 16 6 26
0 265 0 320 0 328 0 327
1 1 1 1
10 23 11 31
8 9 12 8
0 0 0 0
30 30 10 10
0 0 0 0

95 Annual Report 82
Global description Pollutant 2: Saoke (column caption: see A2.1)
Station coae PPCVVSSSPLTM
012010010203 012010020203 012010080203 012010140203 012010170203 012010220203 012010260203 013018010203 013018090203 013018120203 013018130203 013018180203 013018260203 014015010203 014015040203 014015050203 014015090203 014015130203 014015140203 014027010203 014027060203 014027070203 014027090203 014027120203 014027150203 014032020203 014032050203 014032150203 014032180203 014032290203 014032300203 015016050203 015026020203 015026030203 015033020203 015044040203 015044050203 015044110203 032011020202 032013300202 032013310202 032013340202 032013350202 041010110210 041010170210 041010490210
Town name
BRUXELLES BRUXELLES BRUXELLES BRUXELLES BRUXELLES BRUXELLES BRUXELLES ANTWERPEN ANTWERPEN ANTWERPEN ANTWERPEN ANTWERPEN ANTWERPEN CHARLEROI CHARLEROI CHARLEROI CHARLEROI CHARLEROI CHARLEROI GENT GENT GENT GENT GENT GENT LIEGE LIEGE LIEGE LIEGE LIEGE LIEGE BRUGGE KORTRIJK KORTRIJK LIBRAMONT NAMUR NAMUR NAMUR KOBENHAVN KOBENHAVN KOBENHAVN KOBENHAVN KOBENHAVN PARIS PARIS PARIS
month no
12 12 12 12 12 12 12 12 12 12 12 12 12 12 12 12 12 12 12 12 12 12 12 12 12 12 12 5 IO 12 12 12 3 12 12 10 10 10 7 7 2 7 7 3 3 3
BLA no
3 5 3 10 3 64 0 0 5 6 5 0 0 5 22 6 7 2 0 0 0 0 8 0 0
253 64 83 145 71 122 2 92 50 29 131 131 131 0 69 22 2 2 1 1 0
REP no
0 0 0 0 0 0 0 0 0 0 0 0 0 0 0 0 0 0 0 0 0 0 0 0 0 0 0 0 0 0 0 0 0 0 0 0 0 0 0 0 0 0 0 2 5 1
spa no
7 7 7 7 7 7 7 7 7 7 7 7 7 7 7 7 7 7 7 7 7 7 7 7 7 7 7 2 4 7 7 7 1 7 7 6 6 6 5 5 1 5 5 1 1 1
ze >9999 cas no
0 0 0 0 0 0 0 0 0 0 0 0 0 0 0 0 0 0 0 0 0 0 0 0 0 0 0 0 0 0 0 0 0 0 0 0 0 0 0 0 0 1 0 0 0 0
no no
0 362 0 360 0 362 0 355 0 362 0 301 0 365 0 365 0 360 0 359 0 360 0 365 0 365 0 360 0 343 0 359 0 358 0 363 0 365 0 365 0 365 0 365 0 357 0 365 0 365 0 112 0 301 0 70 0 161 0 294 0 243 0 363 0 0 0 315 0 336 0 173 0 173 0 173 0 212 0 143 0 39 0 210 0 210 0 89 0 86 0 91
min vai
5 4 3 1 1 1 2 1 3 1 1 1 1 1 1 3 3 3 3 2 2 2 2 2 2 2 1 2 4 1 1 2 0 3 1 3 3 4 3 1 1 1 1 10 11 10
occ no
3 1 11 4 4 1 2 4 1 2 3 5 20 1 3 6 14 13 9 3 27 7 15 17 8 1 3 4 2 1 11 10 0 1 15 4 1 2 3 1 3 7 1 1 2 1
med val
23 27 14 8 14 19 16 13 28 9 13 13 9 14 14 16 9 10 16 16 8 24 12 14 12 12 12 22 22 17 14 12 0 20 6 16 23 33 29 14 8 13 27 39 38 42
gap no
0 2 5 0 1 0 0 1 2 0 0 0 0 5 5 5 2 2 5 6 2 10 4 5 4 1 0 10 1 0 0 0 0 1 0 0 6 5 4 0 0 1 2 7 6 8
dig nn
0 0 0 30 10 10 10 10 0 20 0 10 10 30 0 0 0 10 10 10 30 0 20 10 30 20 20 21 0 0 10 30 0 0 50 20 0 0 0 0 60 10 0 0 10 20
rej cde
0 0 0 0 0 0 0 0 0 0 0 0 0 0 0 0 0 0 0 0 0 0 0 0 0 2 0 1 1 0 0 0 1 0 0
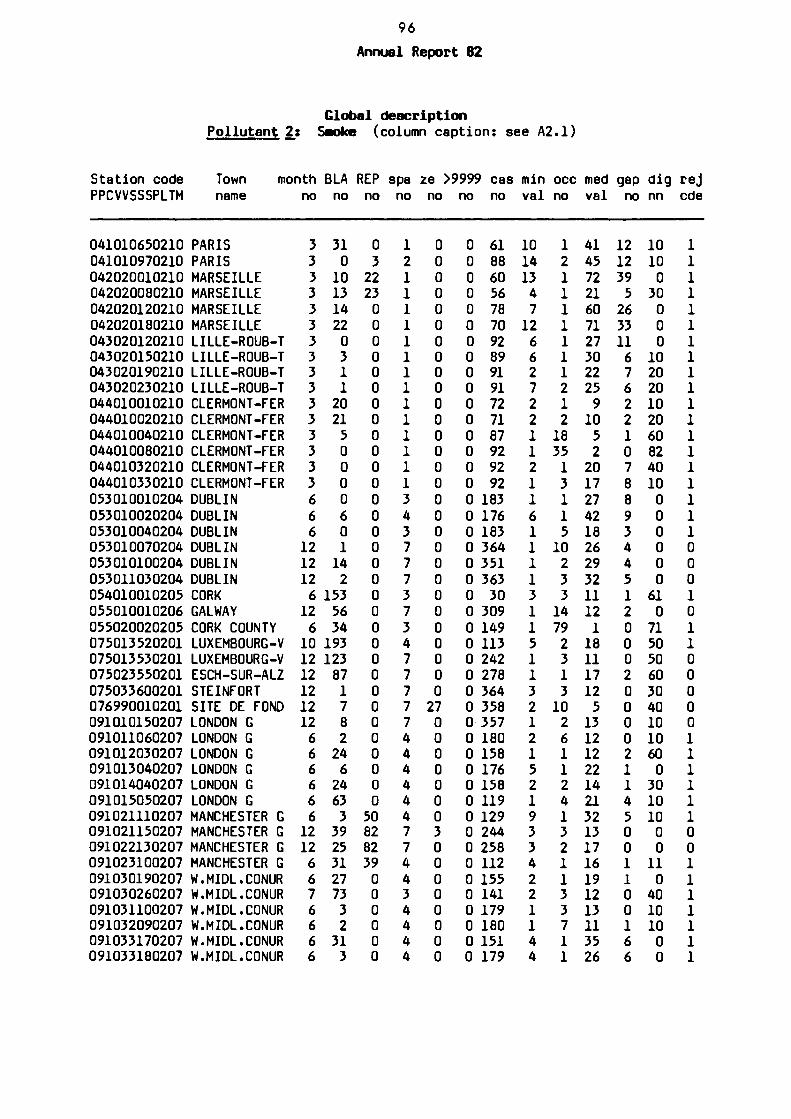
96 Annual Report B2
Global description
Station code PPCVVSSSPLTM
041010650210 041010970210 042020010210 042020080210 042020120210 042020180210 043020120210 043020150210 043020190210 043020230210 044010010210 044010020210 044010040210 044010080210 044010320210 044010330210
Pollutant 2 : Saoke
Town month name
PARIS PARIS MARSEILLE MARSEILLE MARSEILLE MARSEILLE LILLE-R0UB-T LILLE-R0UB-T LILLE-R0UB-T LILLE-ROUB-T CLERMONT-FER CLERMONT-FER CLERMONT-FER CLERMONT-FER CLERMONT-FER CLERMONT-FER
053010010204 DUBLIN 053010020204 053010040204 053010070204
DUBLIN DUBLIN DUBLIN
053010100204 DUBLIN 053011030204 DUBLIN 054010010205 055010010206 055020020205 075013520201 075013530201 075023550201 075033600201 076990010201 091010150207 091011060207 091012030207 091013040207 091014040207 091015050207 091021110207 091021150207 091022130207 091023100207 091030190207 091030260207 091031100207 091032090207 091033170207 091033180207
CORK GALWAY CORK COUNTY LUXEMBOURG-V LUXEMBOURG-V ESCH-SUR-ALZ STEINFORT SITE DE FOND LONDON G LONDON G LONDON G LONDON G LONDON G LONDON G MANCHESTER G MANCHESTER G MANCHESTER G MANCHESTER G W.MIDL.CONUR W.MIDL.CONUR W.MIDL.CONUR W.MIDL.CONUR W.MIDL.CONUR W.MIDL.CONUR
no
3 3 3 3 3 3 3 3 3 3 3 3 3 3 3 3 6 6 6 12 12 12 6 12 6 10 12 12 12 12 12 6 6 6 6 6 6 12 12 6 6 7 6 6 6 6
BLA no
31 0 10 13 14 22 0 3 1 1 20 21 5 0 0 0 0 6 0 1 14 2
153 56 34 193 123 87 1 7 8 2 24 6 24 63 3 39 25 31 27 73 3 2 31 3
(column ca
REP spa no no
0 1 3 2 22 1 23 1 0 1 0 1 0 1 0 1 0 1 0 1 0 1 0 1 0 1 0 1 0 1 0 1 0 3 0 4 0 3 0 7 0 7 0 7 0 3 0 7 0 3 0 4 0 7 0 7 0 7 0 7 0 7 0 4 0 4 0 4 0 4 0 4 50 4 82 7 82 7 39 4 0 4 0 3 0 4 0 4 0 4 0 4
ption: see A2.1)
ze >9999 cas no
0 0 0 0 0 0 0 0 0 0 0 0 0 0 0 0 0 0 0 0 0 0 0 0 0 0 0 0 0 27 0 0 0 0 0 0 0 3 0 0 0 0 0 0 0 0
no no
0 61 0 88 0 60 0 56 0 78 0 70 0 92 0 89 0 91 0 91 0 72 0 71 0 87 0 92 0 92 0 92 0 183 0 176 0 183 0 364 0 351 0 363 0 30 0 309 0 149 0 113 0 242 0 278 0 364 0 358 0 357 0 180 0 158 0 176 0 158 0 119 0 129 0 244 0 258 0 112 0 155 0 141 0 179 0 180 0 151 0 179
min val
10 14 13 4 7 12 6 6 2 7 2 2 1 1 2 1 1 6 1 1 1 1 3 1 1 5 1 1 3 2 1 2 1 5 2 1 9 3 3 4 2 2 1 1 4 4
occ no
1 2 1 1 1 1 1 1 1 2 1 2 18 35 1 3 1 1 5 10 2 3 3 14 79 2 3 1 3 10 2 6 1 1 2 4 1 3 2 1 1 3 3 7 1 1
med val
41 45 72 21 60 71 27 30 22 25 9 10 5 2 20 17 27 42 18 26 29 32 11 12 1 18 11 17 12 5 13 12 12 22 14 21 32 13 17 16 19 12 13 11 35 26
gap no
12 12 39 5 26 33 11 6 7 6 2 2 1 0 7 8 8 9 3 4 4 5 1 2 0 0 0 2 0 0 0 0 2 1 1 4 5 0 0 1 1 0 0 1 6 6
dig nn
10 10 0 30 0 0 0 10 20 20 10 20 60 82 40 10 0 0 0 0 0 0 61 0 71 50 50 60 30 40 10 10 60 0 30 10 10 0 0 11 0 40 10 10 0 0
rej cde
0 0 0 1 0 1 1 0 0 0 0 0 1 1 1 1 1 1 0 0 1 1 1 1 1 1 1

97 Annual Report 82
Global description Pollutant 2t Saoke (column caption: see A2.1)
Station code Town PPCVVSSSPLTM name
month BLA REP spa ze >9999 cas min occ med gap dig pej no no no no no no no vai no vai no nn cde
091034130207 W.MIDL.CONUR 6 24 43 4 092010200207 GLASG0W+SURR 6 3 0 4 092010610207 GLASG0W+SURR 6 182 0 4 092010680207 GLASG0W+SURR 6 2 0 4 092010730207 GLASG0W+SURR 6 2 0 4 092010910207 GLASG0W+SURR 7 29 0 3 092022080207 MERSEYSIDE C 6 2 0 4 092023220207 MERSEYSIDE C 12 0 0 7 092024040207 MERSEYSIDE C 6 20 41 4 092024060207 MERSEYSIDE C 12 41 81 7 093010180207 LEEDS 12 7 0 7 093010300207 LEEDS 12 0 0 7 093020400207 SHEFFIELD 6 35 40 4 093020480207 SHEFFIELD 6 15 47 4 093020820207 SHEFFIELD 7 59 42 3 093030010207 TYNESIDE 6 149 0 4 093031310207 TYNESIDE 12 89 0 7 093032060207 TYNESIDE 6 7 47 4 093033040207 TYNESIDE 6 7 47 4 094010110207 BELFAST 12 1 96 7 094010150207 BELFAST 12 0 29 7 094010330207 BELFAST 6 4 52 4 094020090207 CARDIFF 6 2 0 4 094020100207 CARDIFF 6 2 0 4 094020110207 CARDIFF 6 2 0 4 094020120207 CARDIFF 12 107 58 7 094030120207 EDINBURGH 12 24 39 7 094030170207 EDINBURGH 6 14 46 4 094030200207 EDINBURGH 6 13 46 4 094040050207 PORTSMOUTH 6 2 0 4 094040080207 PORTSMOUTH 6 2 0 4 094040100207 PORTSMOUTH 7 29 0 3 094050090207 TEESSIDE 12 0 92 7 094051140207 TEESSIDE 6 2 50 4 094052010207 TEESSIDE 6 3 0 4 094052290207 TEESSIDE 12 7 0 7 094053060207 TEESSIDE 6 2 0 4 094053100207 TEESSIDE 6 2 0 4 095010090207 BARNSLEY 6 2 0 4 095020020207 BATH 6 14 47 4 095020060207 BATH 7 32 54 3 095030050207 BEDFORD 6 17 45 4 095030100207 BEDFORD 7 29 0 3 095050050207 LINCOLN 12 31 80 7 095050110207 LINCOLN 6 26 44 4 095050150207 LINCOLN 6 39 37 4
0 0 115 9 1 30 2 0 0 0 179 3 13 20 3 0 0 0 0 0 0 0 0 0 0 0 180 3 9 18 6 0 0 0 180 3 30 12 2 0 0 0 185 3 91 4 0 73 0 0 180 1 7 9 0 0 0 0 365 3 2 26 14 10 0 0 0 121 1 2 11 0 10 1 2 0 243 1 4 12 0 0 0 0 0 358 1 3 11 0 0 0 0 0 365 1 15 8 0 0 0 0 0 107 4 1 27 7 0 0 0 120 10 4 40 5 0 0 0 113 5 2 24 3 20 0 0 33 2 2 10 3 70 0 0 276 2 2 15 0 0 0 0 128 6 5 29 7 0 0 0 128 3 16 16 3 10 0 0 268 5 2 23 1 0 0 0 336 3 1 20 0 0 0 0 126 6 1 44 9 0 0 0 180 4 18 21 5 0 0 0 180 1 12 15 0 20 0 0 180 1 1 17 0 20 0 0 200 1 1 13 0 0 0 0 302 1 4 14 1 10 0 0 122 7 1 24 1 0 0 0 123 5 1 30 7 0 0 0 180 2 20 7 0 40 0 0 180 2 9 10 0 30 0 0 185 2 26 6 0 60 0 0 273 2 5 8 0 30 0 0 130 2 4 16 0 0 0 0 179 1 1 11 0 20 0 0 358 1 2 11 0 0 0 0 180 3 4 12 0 30 0 0 180 4 4 22 5 10 0 0 180 8 1 61 24 0 0 0 121 3 1 16 0 10 0 0 128 5 3 15 0 50 0 0 120 2 1 25 3 0 0 0 185 1 8 8 0 50 0 0 254 1 3 10 0 0 0 0 112 6 4 28 5 0 0 0 106 3 6 12 1 10
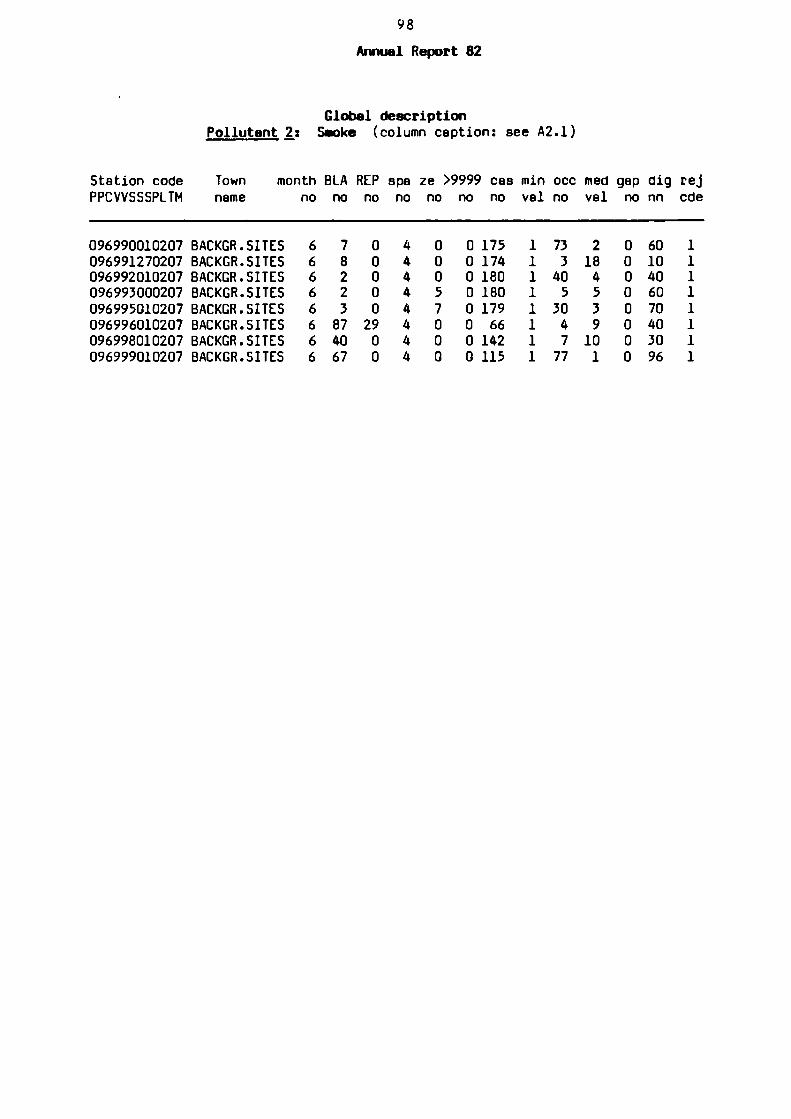
98 Annual Report 82
Global description Pollutant 2: Saoke (column caption: see A2.1)
Station code Town month BLA REP spa ze >9999 cas min occ med gap dig rej PPCVVSSSPLTM name no no no no no no no vai no vai no nn cde
096990010207 BACKGR.SITES 096991270207 BACKGR.SITES 096992010207 BACKGR.SITES 096993000207 BACKGR.SITES 096995010207 BACKGR.SITES 096996010207 BACKGR.SITES 096998010207 BACKGR.SITES 096999010207 BACKGR.SITES
6 6 6 6 6 6 6 6
7 8 2 2 3 87 40 67
0 0 0 0 0 29 0 0
4 4 4 4 4 4 4 4
0 0 0 5 7 0 0 0
0 175 0 174 0 180 0 180 0 179 0 66 0 142 0 115
1 1 1 1 1 1 1 1
73 3 40 5 30 4 7 77
2 18 4 5 3 9
10 1
0 0 0 0 0 0 0 0
60 1 10 1 40 1 60 1 70 1 40 1 30 1 96 1

99 Annual Report 82
Globel description Pollutant 3t SPM (column caption: see A2.1)
Station code PPCVVSSSPLTM
Town month BLA REP spa ze >9999 cas min occ med gap dig réj name no no no no no no no vai no vai no nn cde
022010080302 MUENCHEN, BA 12 65 0 7 0 0 300 1 022010100302 MUENCHEN, BA 12 45 0 7 0 0 320 17 022010140302 MUENCHEN, BA 12 45 0 7 0 0 320 6 022010150302 MUENCHEN, BA 12 65 0 7 0 0 300 1 022010160302 MUENCHEN, BA 12 28 0 7 0 0 337 5 023010010303 DORTMUND 12 268 0 7 0 0 97 15 023020010303 DUISBURG 12 270 0 7 0 0 95 32 023030020303 DUESSELD0RF 12 232 0 7 0 0 133 5 023040010302 FRANKFURT-MA 12 38 0 7 0 0 327 22 023040050305 FRANKFURT-MA 11 62 0 7 0 0 272 8 023050810306 NUERNBERG, B 12 64 0 7 0 0 301 13 023050820306 NUERNBERG, B 12 63 0 7 0 0 302 023060010326 STUTTGART 12 61 0 7 0 0 304 023060020326 STUTTGART 12 12 0 7 0 0 353 023060030326 STUTTGART 9 7 0 6 0 0 266 023060040326 STUTTGART 9 15 0 6 0 0 258 024010710306 AUGSBURG, BA 12 81 0 7 0 0 284 10 024020540306 ERLANGEN, BA 12 51 0 7 0 0 314 36 024030010326 KARLSRUHE 12 42 0 7 0 0 323 6 024030220326 KARLSRUHE 12 16 0 7 0 0 349 6 024040010302 KASSEL, HESS 12 110 0 7 0 0 255 35 024050060325 LUDWIGSHAFEN 12 60 0 7 0 0 305 2 024050070325 LUDWIGSHAFEN 12 59 0 7 0 0 306 024050080325 LUDWIGSHAFEN 12 77 0 7 0 0 288 024061100326 MANNHEIM 12 81 0 7 0 0 284 024061110326 MANNHEIM 12 37 0 7 0 0 328 024061120326 MANNHEIM 12 36 0 7 0 0 329 024070310306 REGENSBURG, 12 65 0 7 0 0 300 024080010302 WIESBADEN, H 12 34 0 7 0 0 331 19 024080020302 WIESBADEN, H 3 12 0 1 0 0 80 15 024090640306 WUERZBURG, B 12 51 0 7 0 0 314 024100110306 INGOLSTADT, 12 25 0 7 0 0 340 024110850306 FUERTH, BAYE 12 23 0 7 0 0 342 024120030325 MAINZ 12 42 0 7 0 0 323 024120040325 MAINZ 12 69 0 7 0 0 296 10 024120050325 MAINZ 12 68 0 7 0 0 297 2 024130010326 FREIBERG 12 94 0 7 0 0 271 025010610306 ASCHAFFENBUR 9 52 0 6 0 0 221 025020910306 KELHEIM, BAY 12 25 0 7 0 0 340 025030010326 HEILBROENN 12 12 0 7 0 0 353 025040010326 ULM 12 25 0 7 0 0 340 025050010325 SPEIZER 12 82 0 7 0 0 283 026990020308 B.R. DEUTSCH 12 15 0 7 0 0 350 026990030308 B.R. DEUTSCH 12 2 0 7 0 0 363 026990040308 B.R. DEUTSCH 12 2 0 7 0 0 363 026990050308 B.R. DEUTSCH 12 6 0 7 0 0 359
1 7 3 4 4 1 4 6 8 6
1 63 21 1 104 26 2 36 3 1 50 6 2 34 0
69 34
82 11 15 0

100 Annual Report 82
Global description Pollutant 3: SPM (column caption: see A2.1)
Station code Town PPCVVSSSPLTM name
month BLA REP spa ze >9999 cas min occ med gap dig rej no no no no no no no vai no vai no nn cde
026990060308 B.R. DEUTSCH 026990070308 B.R. DEUTSCH 026990080308 B.R. DEUTSCH 026990090308 B.R. DEUTSCH 026990100308 B.R. DEUTSCH 026990120308 B.R. DEUTSCH 026990130308 B.R. DEUTSCH 026990140308 B.R. DEUTSCH 026990150308 B.R. DEUTSCH 026990160308 B.R. DEUTSCH 026990240326 B.R. DEUTSCH 032011010347 KOBENHAVN 032011020301 KOBENHAVN 032011030347 KOBENHAVN 032012100347 KOBENHAVN 032012210347 KOBENHAVN 032013300301 KOBENHAVN 032013310301 KOBENHAVN 032013340301 KOBENHAVN 032013350301 KOBENHAVN 032013420347 KOBENHAVN 032013480347 KOBENHAVN 034018150347 AALBORG 034029150347 ODENSE 035015650347 ESBJERG 035025150347 FREDERICIA 035033510347 NAESTVED 035046350347 RANDERS 062010010315 TORINO 062010020315 TORINO 062010030315 TORINO 062010040315 TORINO 064040020315 BOLZANO 064040030315 BOLZANO 064040050315 BOLZANO 064080010315 PESCARA
12 12 12 12 12 12 12 12 12 12 12 6 7 6 4 6 7 2 7 7 6 1 6 8 8 8 8 7 12 12 12 7 10 11 2 12
9 9 21 50 8 11 7 2 2 21 62 30 6 39 9 32 54 19 1 33 35 7 20 33 28 40 20 45 98 47 21 31 25 35 18 264
0 0 0 0 0 0 0 0 0 0 0 0 0 0 0 0 0 0 0 0 0 0 0 0 0 0 0 0 0 0 0 0 0 0 0 0
7 7 7 7 7 7 7 7 7 7 7 3 5 3 2 3 5 1 5 5 3 1 3 6 6 6 6 3 7 7 7 5 6 6 1 7
0 0 0 0 0 0 0 0 0 0 0 0 0 0 0 0 0 0 0 0 0 0 0 0 0 0 0 0 0 0 0 0 0 0 0 0
0 0 0 0 0 0 0 0 0 0
356 356 344 315 357 354 358 363 363 344
0 303 0 0 0 0 0 0 0 0 0 0 0 0 0 0 0 0 0 0 0 0 0 0 0 0 0
153 206 144 113 151 158 42 211 179 148 23
163 209 214 202 222 169 267 318 344 181 279 300 43 101
2 1 4 8 2 5 5 4 3 7 1 6 7 11 6 15 5 6 4 4 17 24 23 18 23 18 26 19 14 56 42 44 6 11 23 46
1 1 1 2 1 1 1 2 1 1 17 1 2 1 1 1 1 1 1 1 1 1 1 1 2 1 1 2 1 1 1 1 1 2 1 1
31 17 36 45 36 40 33 25 37 55 7 43 28 94 40 43 30 20 42 26 40 60 68 52 55 61 73 65
120 200 160 205 22 35 41 104
1 0 3 0 4 3 0 0 4 1 0 13 1 41 13 4 3 5 6 0 0 27 12 7 4 14 8 9 38 55 38 97 0 1 6 21
0 10 0 0 0 0 0 0 0 0 10 0 0 0 0 0 0 40 0 0 10 21 0 0 0 0 0 0 0 0 0 0 0 0 20 0
0 0 0 0 0 0 0 0 0 0 0
0 0 0 1 1 1 1 2

101
Annual Report 82
Global description Pollutant 4; Acid (column caption: see A2.1)
Station code PPCVVSSSPLTM
012010010403 012010020403 012010080403 012010140403 012010170403 012010220403 012010260403 013018010403 013018090403 013018120403 013018130403 013018180403 013018260403 014015010403 014015040403 014015050403 014015090403 014015130403 014015140403 014027010403 014027060403 014027070403 014027090403 014027120403 014027150403 014032020403 014032050403 014032150403 014032180403 014032290403 014032300403 015016050403 015026020403 015026030403 015033020403 015044040403 015044050403 015044110403 041010110408 041010170408 041010490408 041010650408 041010970408 042020010408 042020080408 042020120408
Town name
BRUXELLES BRUXELLES BRUXELLES BRUXELLES BRUXELLES BRUXELLES BRUXELLES ANTWERPEN ANTWERPEN ANTWERPEN ANTWERPEN ANTWERPEN ANTWERPEN CHARLEROI CHARLEROI CHARLEROI CHARLEROI CHARLEROI CHARLEROI GENT GENT GENT GENT GENT GENT LIEGE LIEGE LIEGE LIEGE LIEGE LIEGE BRUGGE KORTRIJK KORTRIJK LIBRAMONT NAMUR NAMUR NAMUR PARIS PARIS PARIS PARIS PARIS MARSEILLE MARSEILLE MARSEILLE
month no
12 12 12 12 12 12 12 12 12 12 12 12 12 12 12 12 12 12 12 12 12 12 12 12 12 12 12 5 10 12 12 12 3 12 12 10 10 10 3 3 3 3 3 3 3 3
BLA no
3 5 3 10 3 64 0 7 13 19 19 7 7 6 22 6 5 9 0 3 8 13 7 11 7
253 64 83 159 71 124 2 92 50 29 131 135 131 0 1 0 31 0 11 16 29
REP no
0 0 0 0 0 0 0 0 0 0 0 0 0 0 0 0 0 0 0 0 0 0 0 0 0 0 0 0 0 0 0 0 0 0 0 0 0 0 1 4 2 1 1 24 23 0
spa no
7 7 7 7 7 7 7 7 7 7 7 7 7 7 7 7 7 7 7 7 7 7 7 7 7 7 7 2 4 7 7 7 1 7 7 6 6 6
ze >9999 cas no
0 1 3 6 1 5 2 0 0 1 2 0 0 0 4 2 0 1 0 9 8 13 1 6 28 1 3 0 0 1 0 12 0 6 1 0 2 0 0 0 0 0 0 0 0 0
no
0 0 0 0 0 0 0 0 0 0 0 0 0 0 0 0 0 0 0 0 0 0 0 0 0 0 0 0 0 0 0 0 0 0 0 0 0 0 0 0 0 0 0 0 0 0
no
362 360 362 355 362 301 365 358 352 346 346 358 358 359 343 359 360 356 365 362 357 352 358 354 358 112 301 70 147 294 241 363 0
315 336 173 169 173 91 87 90 60 91 57 53 63
min vai
10 11 4 2 2 2 4 14 10 11 7 15 13 2 2 2 2 2 5 11 8 8 8 8 8 30 13 4 9 13 9 2 0 2 2 9 7 8 8 15 8 4 9 27 4 3
occ no
2 1 1 3 2 2 2 2 1 1 1 1 1 1 8 3 1 1 1 4 1 4 5 5 4 1 1 1 2 1 1 8 0 5 2 1 1 1 2 1 1 1 1 1 1 1
med val
74 62 36 23 38 35 36 75 79 53 71 78 88 43 26 36 49 35 48 53 45 53 56 60 53 65 77 61 70 79 55 34 0 37 28 33 40 40 62 91 70 64 64 67 29 31
gap no
11 5 14 0 4 2 1 12 16 2 14 10 14 16 9 13 19 14 19 26 24 29 32 34 28 12 23 34 23 22 5 6 0 1 3 0 5 5 25 43 30 37 23 21 11 9
dig r nn c
0 0 0 0 0 0 0 0 0 0 0 0 0 0 0 0 0 0 0 0 0 0 0 0 1 0 0 0 0 0 0 0 0 0 0 0 0 0 0 0 0 0 0 0 0 10
tí
d 0 d D
ι
3
ι D 3 L L L
L L L

102 Annuel Report 82
Global description Pollutant 4; Acid (column caption: see A2.1)
Station code Town PPCVVSSSPLTM name
month BLA REP spa ze >9999 cas min occ med gap dig rej no no no no no no no vai no vai no nn cde
042020180408 043020120408 043020150408 043020190408 043020230408 044010010408 044010020408 044010040408 044010080408 044010320408 044010330408 044020120411 044020210411 044020290411 044020310411 044020320411 044020430411 044040010411 044040040411 044040060411 044040070411 044040080411 044040110411 045010250408 045010260408 045010310408 053010010404 053010020404 053010040404 053010070404 053010100404 053011030404 054010010405 055010010406 055020020405 075013520401 075013530401 075023550401 075033600401 076990010401 091010150407 091011060407 091012030407 091013040407 091014040407 091015050407
MARSEILLE LILLE-R0UB-T LILLE-R0UB-T LILLE-R0UB-T LILLE-R0UB-T CLERM0NT-FER CLERM0NT-FER CLERMONT-FER CLERM0NT-FER CLERM0NT-FER CLERM0NT-FER LE HAVRE LE HAVRE LE HAVRE LE HAVRE LE HAVRE LE HAVRE ROUEN ROUEN ROUEN ROUEN ROUEN ROUEN CALAIS CALAIS CALAIS DUBLIN DUBLIN DUBLIN DUBLIN DUBLIN DUBLIN CORK GALWAY CORK COUNTY LUXEMBOURG-V LUXEMBOURG-V ESCH-SUR-ALZ STEINFORT SITE DE FOND LONDON G LONDON G LONDON G LONDON G LONDON G LONDON G
3 3 3 3 3 3 3 3 3 3 3 3 3 3 3 3 3 3 3 3 3 3 3 3 3 3 6 6 6 12
22 0 3 1 1 19 21 5 0 34 25 7 4 0 0 0 0 7 3 4 0 3 0 7 0 2 0 5 0 4
12 14 12 5 6 146 12 50 6 144 10 193 12 123 12 87 12 12 12 6 6 6 6 6
1 0 8 2 24 6 23 64
0 0 0 0 0 0 0 0 0 0 0 0 0 0 0 0 0 0 0 0 0 0 0 0 0 0 0 0 0 0 0 0 0 0 0 0 0 0 0 0 0 0 0 0 0 0
7 3 7 3 4 7 7 7 7 7 4 4 4 4 4
0 0 0 0 0 0 0 0 0 18 12 31 13 11 2 0 0 9 0 0 0 5 0 57 17 0 0 0 0 0 0 0 0 0 1 0 0 0 5 14 1 0 0 0 0 0
0 0 0 0 0 0 0 0 0 0 0 0 0 0 0 0 0 0 0 0 0 0 2 0 0 0
70 92 89 91 91 73 71 87 92 58 67 85 88 92 92 92 92 85 89 88 92 89 92 85 92 90
0 183 0 177 0 183 0 361 0 351 0 360 0 37 0 315 0 39 0 113 0 242 0 278 0 364 0 365 0 357 0 180 0 158 0 176 0 159 0 118
25 18 12 2 14 11 7 8 7 3 3 1 1 1 1 4 1 2 11 6 17 1 18 1 2 2 5 11 5 6 12 6 22
1 1 1 1 1 1 1 1 1 1 1 5 4 4 5 1 2 1 1 1 2 3 1 1 2 1 1 1 2 8 2 4 2
69 21 68 19 61 19 43 9 76 30 27 4 25 32 31
8 7 6
6 120 9 5
43 19 26 5 72 46 65 35 26 2 24 4 58 22 33 8 33 11 86 43 39 12 88 33 25 2 119 66 500 480 14 0 38 11 50 25 92 43 31 14 45 7 44 6 49 14 52 20 11 4 22 10
5 2 8 3 2 6 6 22 12 30 39
1 1 1 1 3 5 2 3 1 1 1
38 37 40 31 20 29
8 3 4 3 1 7
39 16 56 21 56 28 65 13 97 27
0 0 0 0 0 30 40 0 10 20 0 11 0 0 0 0 0 10 0 0 0 10 0 51 30 0 0 0 0 0 0 0 30 20 50 10 0 0 10 20 10 0 0 0 10 0
0 0 0 1 0 1 1 0 0 0 0 0

103 Annuel Report 82
Global description Pollutant 4; Acid (column caption: see A2.1)
Station code Town PPCVVSSSPLTM name
month BLA REP spa ze >9999 cas min occ med g ρ d g rej no no no no no no no val no val no nn cde
091021110407 MANCHESTER G 091021150407 MANCHESTER G 091022130407 MANCHESTER G 091023100407 MANCHESTER G 091030190407 W.MIDL.C0NUR 091030260407 W.MIDL.C0NUR 091031100407 W.MIDL.C0NUR 091032090407 W.MIDL.C0NUR 091033170407 W.MIDL.C0NUR 091033180407 W.MIDL.C0NUR 091034130407 W.MIDL.C0NUR 092010200407 GLASG0W+SURR 092010610407 GLASG0W+SURR 092010680407 GLASG0W+SURR 092010730407 GLASG0W+SURR 092010910407 GLASG0W+SURR 092022080407 MERSEYSIDE C 092023220407 MERSEYSIDE C 092024040407 MERSEYSIDE C 092024060407 MERSEYSIDE C 093010180407 LEEDS 093010300407 LEEDS 093020400407 SHEFFIELD 093020480407 SHEFFIELD 093020820407 SHEFFIELD 093030010407 TYNESIDE 093031310407 TYNESIDE 093032060407 TYNESIDE 093033040407 TYNESIDE 094010110407 BELFAST 094010150407 BELFAST 094010330407 BELFAST 094020090407 CARDIFF 094020100407 CARDIFF 094020110407 CARDIFF 094020120407 CARDIFF 094030120407 EDINBURGH 094030170407 EDINBURGH 094030200407 EDINBURGH 094040050407 PORTSMOUTH 094040080407 PORTSMOUTH 094040100407 PORTSMOUTH 094050090407 TEESSIDE 094051140407 TEESSIDE 094052010407 TEESSIDE 094052290407 TEESSIDE
6 12 12 6 6 7 6 6 6 6 6 6
2 36 25 31 32 73 2 2 31 3 24 2
6 182 6 2 6 7 6 12 6 12 12 12 6 6 7
2 29 2 0 20 41 8 0 35 15 57
6 149 12 89 6 6 12 12 6 6 6 6
7 7 0 0 4 2 2 2
12 107 12 24 6 6 6 6 7 12 6 6 12
14 13 5 3 29 0 2 10 16
50 82 82 39 0 0 0 0 0 0 43 0 0 0 0 0 0 0 41 82 0 0 40 47 42 0 0 47 47 96 29 52 0 0 0 58 39 46 46 0 0 0 92 50 0 0
4 7 7 4 4 3 4 4 4 4 4 4 4 4 4 3 4 7 4 7 7 7 4 4 3 4 7 4 4 7 7 4 4 4 4 7 7 4 4 4 4 3 7 4 4 7
0 3 0 0 0 1 0 21 0 0 0 0 0 0 0 0 2 0 0 0 0 0 0 0 0 0 0 0 2 0 0 0 2 0 0 0 1 2 0 5 0 1 0 0 8 14
0 130 35 1 110 36
25
0
0 247 7 0 258 19 0 112 9 0 150 20 0 141 6 0 180 7 0 180 0 151 0 179 13 0 115 12 0 180 18 0 0 0 180 15 0 180 13 0 185 12 0 180 5 0 365 12 0 121 6 0 242 16 0 357 0 365 0 107 27 0 120 15 0 115 26 0 33 11 0 276 7 0 128 6 0 128 6 0 269 12 0 336 11 0 126 11 0 180 0 180 0 180 0 200 0 302 0 122 0 123 13 0 177 7 0 179 14 0 185 6 0 273 7 0 130 6 0 172 6 0 349 7
6 6
7 7 6 2 6 6
1 1 1 1
63 27 70 7 54 22 72 17
8 40 25 7 1 47 21 8 11 39 22
3 1 1 1 0 4 2 4
73 22 60 34 43 12 68 15 0 0 61 19 46 31
8 27 10 2 47 19 13 34 12
69 10 53 10 42 24 82 23 73 24 60 16 17 4
0 0 0 0 0 0 0 0 0 0 0 0 0
9 0 8 10
2 1 1 1 3 1 3 1 2 14 22
43 12 34 11
0 0 0 0 0 0 0 0 0 61 0 10
8 10 41 36
1 4 1 6 3 11 1 1 8 22
3 4
48 12 53 14 42 13 18 41 13 38 14
1 1 42 13 10 28 15 2 47 14
36 14 43
3 3 12 14 47 12 94 15
10 0 0 0 0
8 50 10
8 2 5 5
0 10 0 10 0 0 0 10 10 10
0 0 1 1 1 1 1 1 1 1 1 Ï 1 I I I 0 i Ρ o o 1 A ι ι o i 1 o o 1 1 1 1 o 1 1 1 1 1 o 1 1 o

104 Annual Report 82
Global description Pollutant 4: Acid (column caption: see A2.1)
Station code Town PPCVVSSSPLTM name
month BLA REP spa ze >9999 cas min occ med gap dig rej no no no no no no no vai no vai no nn cde
094053060407 TEESSIDE 094053100407 TEESSIDE 095010090407 BARNSLEY 095020020407 BATH 095020060407 BATH 095030050407 BEDFORD 095030100407 BEDFORD 095050050407 LINCOLN 095050110407 LINCOLN 095050150407 LINCOLN 096990010407 BACKGR.SITES 096991270407 BACKGR.SITES 096992010407 BACKGR.SITES 096993000407 BACKGR.SITES 096996010407 BACKGR.SITES 096998010407 BACKGR.SITES 096999010407 BACKGR.SITES
6 6 6 6 7 6 7 12 6 6 6 6 6 6 6 6 6
2 2 2 12 29 19 31 31 26 39 3 8 2 2 87 39 67
0 0 0 47 56 45 0 80 44 37 0 0 0 0 29 0 0
4 4 4 4 3 4 3 7 4 4 4 4 4 4 4 4 4
0 0 0 0 0 0 0 0 0 0 0 1 2 2 7 0 0
0 180 0 180 0 180 0 123 0 129 0 118 0 183 0 254 0 112 0 106 0 179 0 174 0 180 0 180 0 66 0 143 0 115
7 6 14 13 9 11 30 2 19 6 5 10 7 7 4 21 6
2 1 1 3 1 1 1 1 1 1 18 1 6 53 1 1 16
26 19 95 36 31 55 62 47 54 50 11 44 27 9 27 47 18
7 3 49 2 1 12 8 19 9 21 1 19 11 0 12 7 8
10 1 40 1 0 1 30 1 30 1 0 1 0 1 0 0 0 1 0 1 70 1 0 1 31 1 71 1 0 1 0 1 60 1

105 Annual Report 82
Global description Pollutant 19:
Station code PPCVVSSSPLTM
032011011901 032011031901 032012101901 032012211901 032013421901 032013481901 034018151901 034029151901 035015651901 035025151901 035033511901 035046351901 053010011902
Lead (F
Town month name
KOBENHAVN KOBENHAVN KOBENHAVN KOBENHAVN KOBENHAVN KOBENHAVN AALBORG ODENSE ESBJERG FREDERICIA NAESTVED RANDERS DUBLIN
no
6 6 4 6 6 1 6 8 8 8 8 7 9
BLA no
41 58 18 47 40 13 20 33 28 41 20 50 47
'b)
REP no
0 0 0 0 0 0 0 0 0 0 0 0
189
(column
spa no
3 3 2 3 3 1 3 6 6 6 6 3 6
capt .ion:
ze >9999 cas no
0 0 0 0 0 0 0 0 0 0 0 0 0
no
0 0 0 0 0 0 0 0 0 0 0 0 0
no
142 125 104 136 143 17 163 209 214 201 222 164 37
see
min val
52 162 29 33 12 72 180 51 40 96 94 69 120
A2. 1)
occ mec no
1 1 2 1 1 1 1 2 1 1 1 1 1
vaJ
280 499 109 138 80 170 499 260 236 278 422 466 499
1 gap no
175 324 45 61 24 91 285 129 114 112 237 325 376
dig ¿ej nn c de
0 4 0 1 0 1 0 1 14 1 0 1 0 1 0 1 0 1 0 1 0 1 29

106 Annual Report 82 A2.18
Global description Pollutant 28; Cadniun (Cd) (column caption: see A2.1)
Station code PPCVVSSSPLTM
032011012801 032011032801 032012102801 032012212801 032013422801 034029152801 035015652801 035025152801 035033512801 035046352801
Town name
KOBENHAVN KOBENHAVN KOBENHAVN KOBENHAVN KOBENHAVN ODENSE ESBJERG FREDERICIA NAESTVED RANDERS
month no
4 2 1 5 4 4 3 4 6 5
BLA no
110 59 29 144 115 106 89 116 175 148
REP no
0 0 0 0 0 0 0 0 0 0
spa no
2 1 0 3 1 1 1 2 5 2
ze >9999 no
0 0 0 0 0 0 0 0 0 0
no
0 0 0 0 0 0 0 0 0 0
cas no
12 2 2 8 8 17 3 6 6 5
min vai
3 4
4
occ no
3 1 1 1 6 4 1 1 1 2
med val
5 4 3 5 3 5 3 4 6 4
gap no
0 0 0 0 0 0 0 0 1 0
dig rej nn cde
84 1 98 1 98 1 85 1 98 1 42 1 97 1 96 1 95 1 97 1

107 Annual Report 82
ANNUAL CHARACTERISTICS OF THE SERIES
October 1981 - September 1982
Annex 3i Yearly percentiles 25,50.75.95.98 computed for the selected series
Column caption:
Label
station code
cas
mm
max
25,50,75,95,98
Explanation
PPCVVSSSPLTM: PP country code C town class code VV town code SSS station code PL pollutant code TM measurement technique code
number of cases reported for the yeaţ (measured values)
minimum concentration for the year (microg/nP)
maximum concentration for the year (microg/m3)
yearly percentiles ( microg/nP)
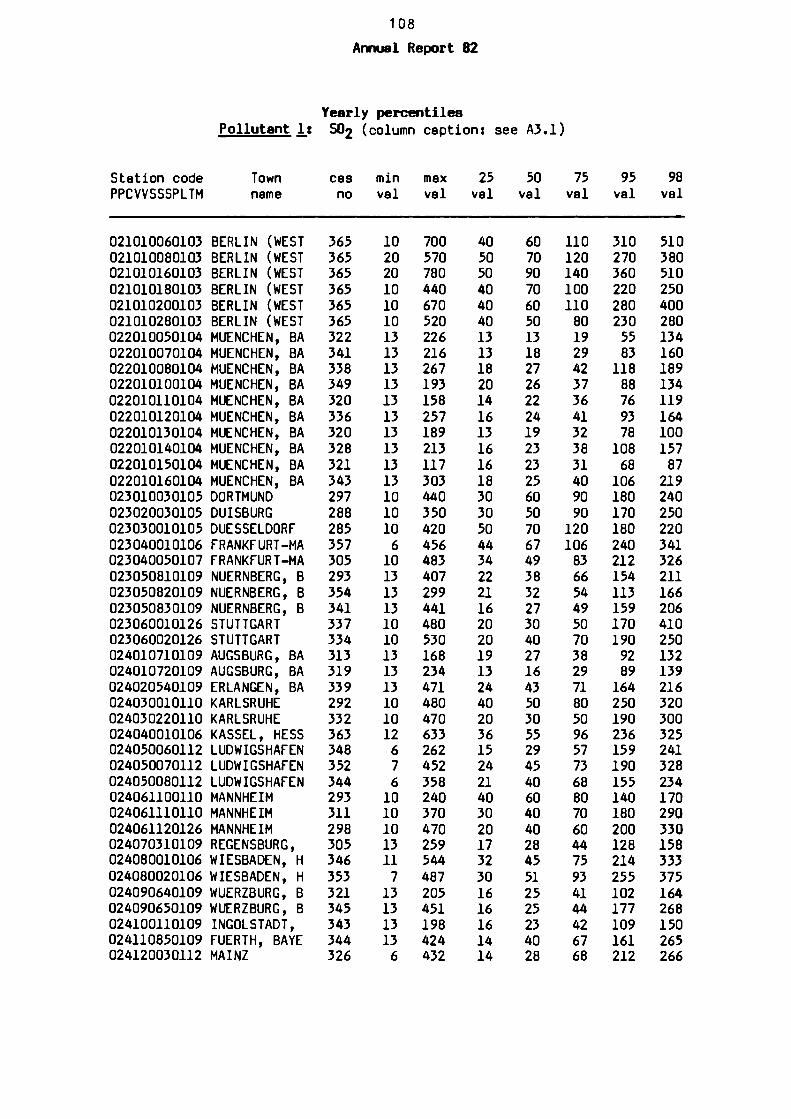
108 Annual Report 82
Yearly percentiles Pollutant 1; SO2 (column caption: see A3.1)
Station code PPCVVSSSPLTM
021010060103 021010080103 021010160103 021010180103 021010200103 021010280103 022010050104 022010070104 022010080104 022010100104 022010110104 022010120104 022010130104 022010140104 022010150104 022010160104 023010030105 023020030105 023030010105 023040010106 023040050107 023050810109 023050820109 023050830109 023060010126 023060020126 024010710109 024010720109 024020540109 024030010110 024030220110 024040010106 024050060112 024050070112 024050080112 024061100110 024061110110 024061120126 024070310109 024080010106 024080020106 024090640109 024090650109 024100110109 024110850109 024120030112
Town name
BERLIN (WEST BERLIN (WEST BERLIN (WEST BERLIN (WEST BERLIN (WEST BERLIN (WEST MUENCHEN, BA MUENCHEN, BA MUENCHEN, BA MUENCHEN, BA MUENCHEN, BA MUENCHEN, BA MUENCHEN, BA MUENCHEN, BA MUENCHEN, BA MUENCHEN, BA DORTMUND DUISBURG DUESSELDORF FRANKFURT-MA FRANKFURT-MA NUERNBERG, Β NUERNBERG, Β NUERNBERG, Β STUTTGART STUTTGART AUGSBURG, BA AUGSBURG, BA ERLANGEN, BA KARLSRUHE KARLSRUHE KASSEL, HESS LUDWIGSHAFEN LUDWIGSHAFEN LUDWIGSHAFEN MANNHEIM MANNHEIM MANNHEIM REGENSBURG, WIESBADEN, Η WIESBADEN, Η WUERZBURG, Β WUERZBURG, Β INGOLSTADT, FUERTH, BAYE MAINZ
cas no
365 365 365 365 365 365 322 341 338 349 320 336 320 328 321 343 297 288 285 357 305 293 354 341 337 334 313 319 339 292 332 363 348 352 344 293 311 298 305 346 353 321 345 343 344 326
min val
10 20 20 10 10 10 13 13 13 13 13 13 13 13 13 13 10 10 10 6 10 13 13 13 10 10 13 13 13 10 10 12 6 7 6 10 10 10 13 11 7 13 13 13 13 6
max val
700 570 780 440 670 520 226 216 267 193 158 257 189 213 117 303 440 350 420 456 483 407 299 441 480 530 168 234 471 480 470 633 262 452 358 240 370 470 259 544 487 205 451 198 424 432
25 val
40 50 50 40 40 40 13 13 18 20 14 16 13 16 16 18 30 30 50 44 34 22 21 16 20 20 19 13 24 40 20 36 15 24 21 40 30 20 17 32 30 16 16 16 14 14
50 val
60 70 90 70 60 50 13 18 27 26 22 24 19 23 23 25 60 50 70 67 49 38 32 27 30 40 27 16 43 50 30 55 29 45 40 60 40 40 28 45 51 25 25 23 40 28
75 val
110 120 140 100 110 80 19 29 42 37 36 41 32 38 31 40 90 90 120 106 83 66 54 49 50 70 38 29 71 80 50 96 57 73 68 80 70 60 44 75 93 41 44 42 67 68
95 val
310 270 360 220 280 230 55 83 118 88 76 93 78 108 68 106 180 170 180 240 212 154 113 159 170 190 92 89 164 250 190 236 159 190 155 140 180 200 128 214 255 102 177 109 161 212
98 val
510 380 510 250 400 280 134 160 189 134 119 164 100 157 87 219 240 250 220 341 326 211 166 206 410 250 132 139 216 320 300 325 241 328 234 170 290 330 158 333 375 164 268 150 265 266

109 Annual Report 82
Yearly percentiles Pollutant It S02 (column caption: see A3.1)
Station code PPCVVSSSPLTM
024120040112 024120050112 025010610109 025020910109 025020920109 025030010126 025040010126 026990010113 026990020113 026990030113 026990040113 026990050113 026990060113 026990070113 026990080113 026990090113 026990100113 026990120113 026990130113 026990140113 026990150113 026990160113 026990240110 061010090120 061010100120 061010130120 061010140120 061010150120 061010160120 083015150102 083015160102 083015180102 083015190102 083015200102 083015210102 083015230102 083015250102 083024040102 083024050102 083034180102 083034230102 084018140102 084029080102 084029090102 084032130102 084032140102
Town name
MAINZ MAINZ ASCHAFFENBUR KELHEIM, BAY KELHEIM, BAY HEILBR0ENN ULM B.R. B.R. B.R. B.R. B.R. B.R. B.R. B.R. B.R. B.R. B.R. B.R. B.R. B.R. B.R. B.R.
DEUTSCH DEUTSCH DEUTSCH DEUTSCH DEUTSCH DEUTSCH DEUTSCH DEUTSCH DEUTSCH DEUTSCH DEUTSCH DEUTSCH DEUTSCH DEUTSCH DEUTSCH DEUTSCH
MILANO MILANO MILANO MILANO MILANO MILANO AMSTERDAM AMSTERDAM AMSTERDAM AMSTERDAM AMSTERDAM AMSTERDAM AMSTERDAM AMSTERDAM DEN DEN
HAAG HAAG
ROTTERDAM ROTTERDAM ENSCHEDE GRONINGEN GRONINGEN TILBURG TILBURG
cas no
333 352 349 358 332 325 344 362 352 357 364 353 357 344 346 340 349 359 360 359 353 356 285 269 321 296 318 318 338 276 300 306 256 315 299 299 292 345 323 344 343 333 331 271 270 318
min val
6 6 13 13 13 10 10 1 1 1 1 1 1 1 1 1 1 1 1 1 1 1 10 8 3 3 5 3 8 2 1 1 1 1 5 4 4 1 2 1 3 1 1 1 8 1
max val
431 511 202 131 325 350 250 176 133 328 133 168 82 104 263 359 156 139 154 150 208 277 380 1178 1131 770 608 543
1206 150 327 396 291 381 299 328 375 313 198 320 298 314 322 329 196 191
25 val
13 21 17 20 16 30 20 1 1 4 6 3 2 1 1 6 7 5 1 1 5 5 20 36 34 36 29 52 42 15 12 13 13 14 17 14 14 13 12 23 16 10 5 7 27 14
50 val
25 36 32 27 24 40 30 3 3 9 12 8 6 2 4 13 14 12 4 3 11 13 40 78 114 78 55 83 96 21 22 22 25 24 26 23 23 26 21 37 28 16 11 13 35 20
75 val
52 74 54 38 46 60 50 10 11 24 21 17 14 6 13 29 25 26 10 9 24 32 50 265 367 239 166 190 377 33 37 36 42 40 38 34 37 47 38 55 49 33 20 22 55 33
95 val
143 250 109 77 142 120 110 44 50 112 52 73 33 17 57 126 62 70 32 29 82 91 140 601 796 452 398 367 785 76 82 88 93 93 84 70 91 102 93 100 96 85 56 67 102 88
98 val
226 330 153 93 208 190 170 101 86 164 98 103 42 31 137 188 73 89 66 44 124 132 230 712 939 536 489 437 889 95 130 129 126 127 115 88 118 124 109 124 121 118 79 110 130 129
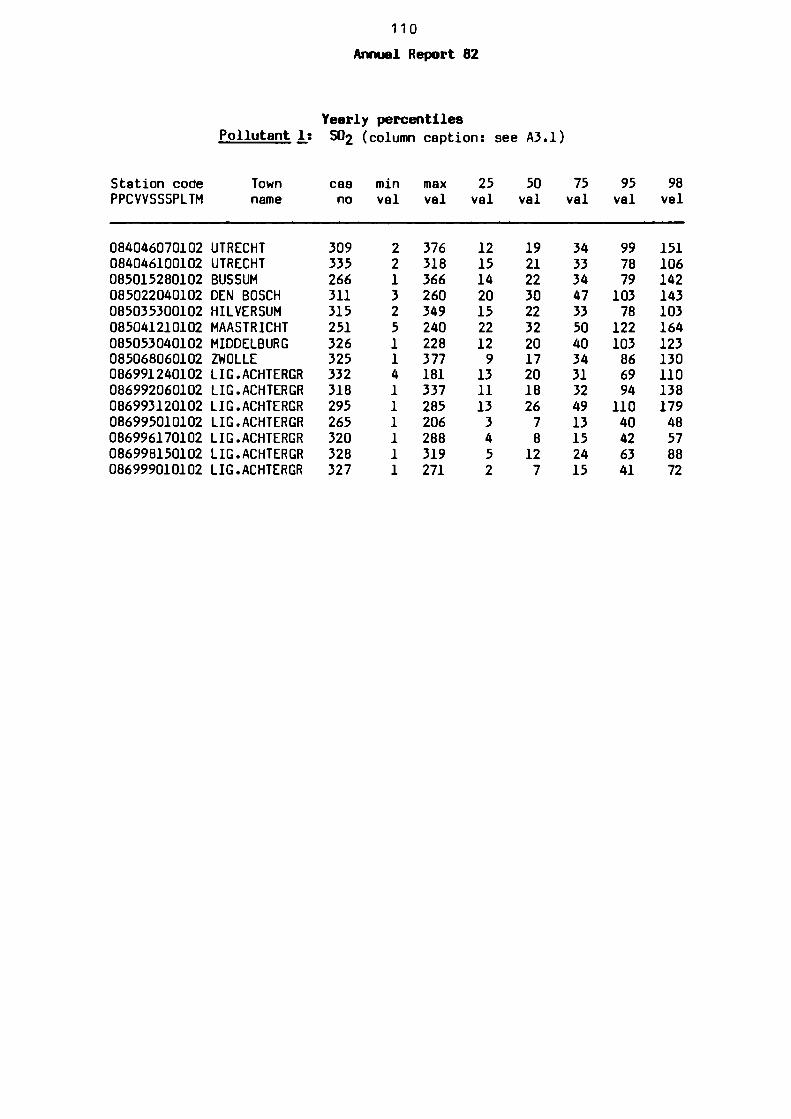
110 Annuel Report 82
Yearly percentiles Pollutant 1: SO2 (column caption: see A3.1)
Station code PPCVVSSSPLTM
084046070102 084046100102 085015280102 085022040102 085035300102 085041210102 085053040102 085068060102 086991240102 086992060102 086993120102 086995010102 086996170102 086998150102 086999010102
Town name
UTRECHT UTRECHT BUS5UM DEN BOSCH HILVERSUM MAASTRICHT MIDDELBURG ZWOLLE LIG.ACHTERGR LIG.ACHTERGR LIG.ACHTERGR LIG.ACHTERGR LIG.ACHTERGR LIG.ACHTERGR LIG.ACHTERGR
cas no
309 335 266 311 315 251 326 325 332 318 295 265 320 328 327
min val
2 2 1 3 2 5 1 1 4 1 1 1 1 1 1
max val
376 318 366 260 349 240 228 377 181 337 285 206 288 319 271
25 val
12 15 14 20 15 22 12 9 13 11 13 3 4 5 2
50 val
19 21 22 30 22 32 20 17 20 18 26 7 8 12 7
75 val
34 33 34 47 33 50 40 34 31 32 49 13 15 24 15
95 val
99 78 79 103 78 122 103 86 69 94 110 40 42 63 41
98 val
151 106 142 143 103 164 123 130 110 138 179 48 57 88 72

111 Annuel Report 82
Yearly percentiles
Station code PPCVVSSSPLTM
012010010203 012010020203 012010080203 012010140203 012010170203 012010220203 012010260203 013018010203 013018090203 013018120203 013018130203 013018180203 013018260203 014015010203 014015040203 014015050203 014015090203 014015130203 014015140203 014027010203 014027060203 014027070203 014027090203 014027120203 014027150203 014032050203 014032290203 014032300203 015016050203 015026030203 015033020203 053010070204
Pollutant 2:
Town name
BRUXELLES BRUXELLES BRUXELLES BRUXELLES BRUXELLES BRUXELLES BRUXELLES ANTWERPEN ANTWERPEN ANTWERPEN ANTWERPEN ANTWERPEN ANTWERPEN CHARLEROI CHARLEROI CHARLEROI CHARLEROI CHARLEROI CHARLEROI GENT GENT GENT GENT GENT GENT LIEGE LIEGE LIEGE BRUGGE KORTRIJK LIBRAMONT DUBLIN
053010100204 DUBLIN 053011030204 055010010206 075013530201 075023550201 075033600201 076990010201 091010150207 091021150207 091022130207 092023220207 092024060207 093010180207 093010300207
DUBLIN GALWAY LUXEMBOURG-V ESCH-SUR-ALZ STEINFORT SITE DE FOND LONDON G MANCHESTER G MANCHESTER G MERSEYSIDE C MERSEYSIDE C LEEDS LEEDS
Sanke
cas no
362 360 362 355 362 301 365 365 360 359 360 365 365 360 343 359 358 363 365 365 365 365 357 365 365 301 294 243 363 315 336 364 351 363 309 242 278 364 358 357 326 340 365 324 358 365
(column capti
min val
5 4 3 1 1 1 2 1 3 1 1 1 1 1 1 3 3 3 3 2 2 2 2 2 2 1 1 1 2 3 1 1 1 1 1 1 1 3 2 1 3 3 3 1 1 1
max val
163 155 92 77 80 120 111 88 132 76 94 99 114 114 119 140 94 114 98 159 111 290 70 129 102 94 190 83 74 106 54 606 445
1336 124 56 39 60 80 136 208 136 378 197 335 290
on: ι
25 val
16 18 8 6 9 12 10 8 20 6 8 9 4 9 7 12 6 7 10 10 7 16 8 8 8 8 11 8 8 14 4 9 15 14 6 7 8 8 3 8 8 11 19 7 7 5
see A3..
50 val
23 27 14 8 14 19 16 13 28 9 13 14 10 14 14 16 9 10 16 16 8 24 12 14 12 12 17 14 12 20 6 26 29 32 12 11 17 12 4 13 13 17 26 11 11 8
1)
75 val
33 38 20 12 20 32 24 20 39 17 23 23 18 23 23 29 14 19 25 26 14 39 18 24 18 19 28 22 19 30 11 47 61 59 24 16 23 17 7 22 21 26 38 19 22 15
95 val
70 87 51 27 41 58 53 38 66 42 50 53 47 37 54 65 42 48 51 51 28 87 39 48 39 42 58 52 39 65 23 146 181 196 71 24 33 31 18 45 51 54 89 45 70 53
98 val
94 119 66 39 54 85 66 47 85 54 65 66 68 48 77 85 61 61 65 83 39 111 51 66 54 51 72 70 51 85 29 242 235 273 95 28 35 38 32 72 64 76 144 76 112 83

112 Annual Report 82
Yearly percentiles
Station code PPCVVSSSPLTM
093031310207 094010110207 094010150207 094020120207 094030120207 094050090207 094052290207 095050050207
Pollutant 2:
Town name
TYNESIDE BELFAST BELFAST CARDIFF EDINBURGH TEESSIDE TEESSIDE LINCOLN
Saoke
cas no
276 364 365 258 341 365 358 334
(column caption:
miri val
2 5 3 1 1 2 1 1
max val
157 355 287 129 227 101 104 193
25 val
8 13 13 8 8 7 6 7
see A3..
50 val
15 22 22 13 16 8 11 10
D 75 val
26 37 33 25 27 17 20 19
95 val
65 101 61 54 85 37 47 52
98 val
80 123 113 84 105 52 69 79

113 Annual Report 82
Yearly percentiles Pollutant 3: SPM (column caption: see A3.1)
Station code Town cas min max 25 50 75 95 98 PPCVVSSSPLTM name no val val val val val val val
022010080302 022010100302 022010140302 022010150302 022010160302 023040010302 023050810306 023050820306 023060010326 023060020326 024010710306 024020540306 024030010326 024030220326 024040010302 024050060325 024050070325 024050080325 024061100326 024061110326 024061120326 024070310306 024080010302 024090640306 024100110306 024110850306 024120030325 024120040325 024120050325 024130010326 025020910306 025030010326 025040010326 025050010325 026990020308 026990030308 026990040308 026990050308 026990060308 026990070308 026990080308 026990090308 026990100308 026990120308 026990130308 026990140308
MUENCHEN, BA MUENCHEN, BA MUENCHEN, BA MUENCHEN, BA MUENCHEN, BA FRANKFURT-MA NUERNBERG, Β NUERNBERG, Β STUTTGART STUTTGART AUGSBURG, BA ERLANGEN, BA KARLSRUHE KARLSRUHE KASSEL, HESS LUDWIGSHAFEN LUDWIGSHAFEN LUDWIGSHAFEN MANNHEIM MANNHEIM MANNHEIM REGENSBURG, WIESBADEN, Η WUERZBURG, Β INGOLSTADT, FUERTH, BAYE MAINZ MAINZ MAINZ FREIBERG KELHEIM, BAY HEILBROENN ULM SPEIZER B.R. DEUTSCH B.R. DEUTSCH B.R. DEUTSCH B.R. DEUTSCH B.R. DEUTSCH B.R. DEUTSCH B.R. DEUTSCH B.R. DEUTSCH B.R. DEUTSCH B.R. DEUTSCH B.R. DEUTSCH B.R. DEUTSCH
300 320 320 300 337 327 301 302 304 353 284 314 323 349 255 305 306 288 284 328 329 300 331 314 340 342 323 296 297 271 340 353 340 283 350 363 363 359 356 356 344 315 357 354 358 363
1 17 6 1 5 22 13 7 1 2 10 36 6 6 35 2 6 7 4 7 8 1 19 1 5 4 5 10 2 1 3 4 4 1 4 6 8 6 2 1 4 8 2 5 5 4
308 303 271 337 342 229 251 217 129 166 211 200 159 239 232 244 271 433 146 248 191 194 279 274 224 222 303 396 291 63 144 267 216 298 175 163 150 210 142 107 202 908 160 166 131 105
47 79 24 30 21 47 36 28 9 6 36 43 12 16 55 24 27 37 9 14 15 30 45 20 25 30 20 37 25 3 21 11 11 19 21 26 24 29 18 9 24 29 23 27 19 14
63 104 36 50 35 63 51 41 15 12 60 45 17 23 74 41 60 82 15 21 21 45 62 35 39 39 35 62 41 5 30 18 17 40 34 42 35 45 31 17 36 45 36 40 33 25
83 135 53 71 50 86 72 57 22 21 80 79 25 38 104 78 89 136 24 38 32 63 96 56 58 55 59 95 79 9 45 37 28 70 54 69 57 74 46 31 59 85 54 66 52 37
139 194 97 142 99 132 132 106 50 49 132 109 54 97 182 134 182 244 56 86 64 128 171 108 102 113 135 171 149 22 74 87 100 152 106 122 98 129 79 53 125 184 86 124 84 66
172 224 149 191 124 156 176 124 69 60 151 138 90 138 205 173 216 316 74 122 88 151 218 170 147 152 182 229 200 31 86 139 170 186 150 142 116 161 90 64 143 354 108 151 103 76

114 Annual Report 82
Yearly percentiles Pollutant 3t SPM (column caption: see A3.1)
Station code PPCVVSSSPLTM
026990150308 026990160308 026990240326 062010010315 062010020315 062010030315
Town name
B.R. DEUTSCH B.R. DEUTSCH B.R. DEUTSCH TORINO TORINO TORINO
cas no
363 344 303 267 318 344
min val
3 7 1 14 56 42
max val
192 224 103 299 748 620
25 val
23 30 4 88 156 123
50 val
37 55 7
121 200 160
75 val
59 88 16 157 280 231
95 val
97 148 41 240 451 379
98 val
115 168 68 274 560 444

115 Ar>r»."»J Report 82
Yearly percentiles Pollutant 4; Acid (column caption: see A3.1)
Station code PPCVVSSSPLTM
012010010403 012010020403 012010080403 012010140403 012010170403 012010220403 012010260403 013018010403 013018090403 013018120403 013018130403 013018180403 013018260403 014015010403 014015040403 014015050403 014015090403 014015130403 014015140403 014027010403 014027060403 014027070403 014027090403 014027120403 014027150403 014032050403 014032290403 014032300403 015016050403 015026030403 015033020403 053010070404 053010100404 053011030404 055010010406 075013530401 075023550401 075033600401 076990010401 091010150407 091021150407 091022130407 092023220407 092024060407 093010180407 093010300407
Town name
BRUXELLES BRUXELLES BRUXELLES BRUXELLES BRUXELLES BRUXELLES BRUXELLES ANTWERPEN ANTWERPEN ANTWERPEN ANTWERPEN ANTWERPEN ANTWERPEN CHARLEROI CHARLEROI CHARLEROI CHARLEROI CHARLEROI CHARLEROI GENT GENT GENT GENT GENT GENT LIEGE LIEGE LIEGE BRUGGE KORTRIJK LIBRAMONT DUBLIN DUBLIN DUBLIN GALWAY LUXEMBOURG-V ESCH-SUR-ALZ STEINFORT SITE DE FOND LONDON G MANCHESTER G MANCHESTER G MERSEYSIDE C MERSEYSIDE C LEEDS LEEDS
cas no
362 360 362 355 362 301 365 358 352 346 346 358 358 359 343 359 360 356 365 362 357 352 358 354 358 301 294 241 363 315 336 361 351 360 315 242 278 364 365 357 329 340 365 324 357 365
min val
10 11 4 2 2 2 4 14 10 11 7 15 13 2 2 2 2 2 5 11 8 8 8 8 8 13 13 9 2 2 2 6 12 6 6 2 8 3 2 6 7 19 12 16 6 6
max val
387 388 214 185 225 274 220 335 399 260 363 274 445 168 373 305 264 256 251 289 285 409 1858 447 218 254 417 269 265 288 133 268 140 418 88 205 143 88 107 103 324 347 310 363 455 434
25 val
46 43 24 13 26 20 24 52 54 36 48 51 62 26 15 20 28 20 36 34 30 30 41 38 30 58 56 38 17 16 18 31 31 31 6 22 26 17 12 21 40 43 36 42 34 30
50 val
74 62 34 21 38 34 36 75 79 53 70 78 88 43 25 36 49 35 48 53 45 49 56 60 49 76 79 56 32 36 28 45 44 49 11 37 40 31 19 29 56 62 47 65 53 42
75 val
113 93 53 36 59 64 55 112 113 83 101 102 129 59 45 61 74 56 68 75 64 75 79 90 71 103 109 77 56 61 41 61 59 69 17 62 55 43 32 39 90 89 73 82 76 61
95 val
201 191 101 86 132 145 122 172 188 153 172 163 205 104 96 122 140 114 122 139 109 135 135 214 120 157 170 139 120 119 77 98 89 116 30 114 87 66 53 65 151 155 128 159 159 129
98 val
248 239 128 102 180 180 139 200 231 184 225 191 264 135 183 186 172 145 158 169 131 184 225 282 154 191 237 154 173 147 90 138 111 151 46 118 105 73 64 80 209 194 233 244 181 160

116 Annual Report 82
Yearly percentiles Pollutant 4: Acid (column caption: see A3.1)
Station code PPCVVSS5PLTM
093031310407 094010110407 094010150407 094020120407 094030120407 094050090407 094052290407 095050050407
Town name
TYNESIDE BELFAST BELFAST CARDIFF EDINBURGH TEESSIDE TEESSIDE LINCOLN
cas no
276 365 365 258 341 365 349 334
min val
7 12 11 2 6 7 7 2
max val
374 163 103 214 229 236 228 177
25 val
28 21 24 31 26 29 7 33
50 val
43 35 33 39 38 41 15 46
75 val
63 47 48 47 52 60 30 69
95 val
122 60 64 78 86 101 53 105
98 val
143 70 80 112 125 123 65 119

117 Annuel Report 82
ANNUAL CHARACTERISTICS OF THE SERIES
October 1981 - September 1982
Annex 4; Annual descriptive parameters
Column ception:
Label
station code
cas
mean
std.d
V
skew
D
kurt
Explanation
PPCVVSSSPLTM: PP country code C town class code VV town code SSS station code PL pollutant code TM measurement technique code
number of cases reported for the year (measured values)
mean (microg/m3)
standard deviation (microg/m^)
variation coefficient
skewness
shape estimator of the frequency distribution
kurtosis
Remark:
See definitions and explanations in the "Comparative study on data analysis part 2: descriptive statistics and deta reduction", Chap. Ill, Technical Report no. 2.

118 Annual Report 82
Annuel descriptive parameters Pollutant 1: SO2 (column caption: see A4.1)
Station code Town PPCVVSSSPLTM name
cas mean std.d no val val
skew kurt
021010060103 BERLIN (WEST 365 021010080103 BERLIN (WEST 365 021010160103 BERLIN (WEST 365 021010180103 BERLIN (WEST 365 021010200103 BERLIN (WEST 365 021010280103 BERLIN (WEST 365 022010050104 MUENCHEN, BA 322 022010070104 MUENCHEN, BA 341 022010080104 MUENCHEN, BA 338 022010100104 MUENCHEN, BA 349 022010110104 MUENCHEN, BA 320 022010120104 MUENCHEN, BA 336 022010130104 MUENCHEN, BA 320 022010140104 MUENCHEN, BA 328 022010150104 MUENCHEN, BA 321 022010160104 MUENCHEN, BA 343 023010030105 DORTMUND 297 023020030105 DUISBURG 288 023030010105 DUESSELDORF 285 023040010106 FRANKFURT-MA 357 023040050107 FRANKFURT-MA 305 023050810109 NUERNBERG, Β 293 023050820109 NUERNBERG, Β 354 023050830109 NUERNBERG, Β 341 023060010126 STUTTGART 337 023060020126 STUTTGART 334 024010710109 AUGSBURG, BA 313 024010720109 AUGSBURG, BA 319 024020540109 ERLANGEN, BA 339 024030010110 KARLSRUHE 292 024030220110 KARLSRUHE 332 024040010106 KASSEL, HESS 363 024050060112 LUDWIGSHAFEN 348 024050070112 LUDWIGSHAFEN 352 024050080112 LUDWIGSHAFEN 344 024061100110 MANNHEIM 293 024061110110 MANNHEIM 311 024061120126 MANNHEIM 298 024070310109 REGENSBURG, 305 024080010106 WIESBADEN, Η 346 024080020106 WIESBADEN, Η 353 024090640109 WUERZBURG, Β 321 024090650109 WUERZBURG, Β 345 024100110109 INGOLSTADT, 343 024110850109 FUERTH, BAYE 344 024120030112 MAINZ 326
100 110.6 1.11 2.93 0.62 10.0 99 83.6 0.84 2.41 0.77 7.0
122 112.2 0.92 2.33 0.66 6.7 82 65.6 0.80 1.84 0.63 4.5 94 90.6 0.96 2.55 0.67 8.5 78 70.4 0.90 2.61 0.76 8.9 23 26.2 1.16 4.37 0.86 21.4 29 31.1 1.08 3.65 0.81 14.8 40 40.9 1.01 3.06 0.75 10.6 34 26.2 0.76 3.02 1.11 10.8 31 24.5 0.80 2.50 0.86 7.6 36 34.4 0.96 3.15 0.84 12.0 29 24.6 0.86 3.14 0.97 13.0 35 33.9 0.96 2.90 0.77 9.5 28 17.8 0.65 2.31 1.05 6.1 39 42.9 1.09 3.58 0.78 14.7 70 54.6 0.78 2.41 0.85 8.9 69 52.9 0.76 2.01 0.73 5.1 87 54.3 0.62 1.45 0.68 4.5 88 73.9 0.84 2.50 0.80 7.6 73 71.7 0.98 3.16 0.81 12.0 56 59.2 1.06 3.35 0.76 14.2 45 41.4 0.91 3.14 0.89 12.8 46 56.6 1.24 3.62 0.64 16.2 54 80.1 1.48 3.62 0.47 13.9 59 71.8 1.21 3.40 0.63 14.8 34 26.0 0.76 2.72 1.00 8.3 29 31.4 1.09 3.48 0.76 14.2 60 60.9 1.02 3.37 0.82 15.1 75 74.3 0.99 2.76 0.70 8.4 53 66.8 1.26 3.45 0.59 13.3 81 75.6 0.94 2.68 0.73 10.3 47 50.9 1.09 2.40 0.53 6.1 64 71.2 1.10 3.05 0.65 10.7 55 53.0 0.96 2.57 0.68 8.3 64 37.6 0.59 1.56 0.80 3.2 62 61.4 0.99 2.69 0.68 8.3 60 72.4 1.20 3.04 0.57 10.3 40 38.0 0.96 2.88 0.77 9.9 69 71.9 1.04 3.16 0.74 12.1 80 83.5 1.04 2.46 0.58 6.9 36 33.1 0.92 2.78 0.78 9.0 46 60.4 1.31 3.42 0.55 13.1 37 34.0 0.92 2.43 0.68 6.5 56 62.7 1.13 3.07 0.64 11.8 57 69.9 1.23 2.29 0.41 5.8

119 Annuel Report 82
Annuel descriptive peremeters Pollutant It SO2 (column caption: see A4.1)
Station code PPCVVSSSPLTM
024120040112 024120050112 025010610109 025020910109 025020920109 025030010126 025040010126 026990010113 026990020113 026990030113 026990040113 026990050113 026990060113 026990070113 026990080113 026990090113 026990100113 026990120113 026990130113 026990140113 026990150113 026990160113 026990240110 061010090120 061010100120 061010130120 061010140120 061010150120 061010160120 083015150102 083015160102 083015180102 083015190102 083015200102 083015210102 083015230102 083015250102 083024040102 083024050102 083034180102 083034230102 084018140102 084029080102 084029090102 084032130102 084032140102
Town name
MAINZ MAINZ ASCHAFFENBUR KELHEIM, BAY KELHEIM, BAY HEILBR0ENN ULM B.R. B.R. B.R. B.R. B.R. B.R. B.R. B.R. B.R. B.R. B.R. B.R. B.R. B.R. B.R. B.R.
DEUTSCH DEUTSCH DEUTSCH DEUTSCH DEUTSCH DEUTSCH DEUTSCH DEUTSCH DEUTSCH DEUTSCH DEUTSCH DEUTSCH DEUTSCH DEUTSCH DEUTSCH DEUTSCH
MILANO MILANO MILANO MILANO MILANO MILANO AMSTERDAM AMSTERDAM AMSTERDAM AMSTERDAM AMSTERDAM AMSTERDAM AMSTERDAM AMSTERDAM DEN DEN
HAAG HAAG
ROTTERDAM ROTTERDAM ENSCHEDE GRONINGEN GRONINGEN TILBURG TILBURG
cas no
333 352 349 358 332 325 344 362 352 357 364 353 357 344 346 340 349 359 360 359 353 356 285 269 321 296 318 318 338 276 300 306 256 315 299 299 292 345 323 344 343 333 331 271 270 318
mean val
44 67 43 32 42 49 45 10 11 24 18 17 10 5 14 31 20 20 9 8 23 25 49 177 236 152 114 132 233 29 31 32 34 33 33 29 33 37 31 44 38 28 18 21 46 29
std.d val
56.8 80.8 34.4 19.3 46.7 43.0 38.0 20.9 19.1 39.9 20.0 25.8 11.9 8.8 32.2 50.7 19.5 22.7 17.4 13.0 30.9 33.5 50.9 204.4 261.1 156.9 126.6 114.0 257.1 23.2 34.9 36.1 33.4 36.9 29.7 28.9 35.3 36.3 28.6 35.7 32.7 34.4 24.8 29.5 30.6 28.3
V
1.29 1.20 0.81 0.60 1.11 0.88 0.85 2.11 1.78 1.68 1.14 1.54 1.17 1.71 2.27 1.63 0.98 1.11 1.83 1.70 1.37 1.32 1.04 1.15 1.11 1.03 1.11 0.86 1.10 0.81 1.11 1.14 0.99 1.11 0.90 0.98 1.08 0.98 0.92 0.81 0.87 1.23 1.41 1.39 0.67 0.96
skew
3.41 2.70 1.93 2.19 3.03 3.80 3.02 4.61 3.18 3.49 3.12 3.23 2.51 5.85 4.69 3.59 2.33 2.03 4.78 5.35 2.90 2.97 3.14 1.78 1.29 1.38 1.60 1.28 1.29 2.24 3.74 5.00 3.25 4.18 4.38 5.43 4.79 2.67 2.11 3.18 2.75 4.13 6.37 5.37 2.00 2.76
D
0.57 0.50 0.65 1.08 0.65 1.15 0.95 0.29 0.29 0.36 0.64 0.39 0.49 0.58 0.25 0.39 0.60 0.43 0.41 0.53 0.43 0.47 0.74 0.36 0.28 0.33 0.34 0.39 0.28 0.75 0.79 1.02 0.82 0.89 1.28 1.39 1.06 0.68 0.60 1.07 0.84 0.75 0.91 0.79 0.87 0.73
kurt
14.6 8.6 4.4 5.8 10.6 19.1 11.3 24.9 11.4 15.3 11.9 12.0 8.5 51.1 25.5 15.4 8.6 4.6 28.8 44.2 10.3 12.7 12.5 3.4 0.9 1.6 2.0 1.0 0.8 6.0 21.6 38.8 17.5 28.9 29.2 45.3 35.4 12.0 6.0 18.5 13.7 25.1 67.5 44.8 5.2 9.1

120 Annuel Report 82
Annuel descriptive parameters Pollutant 1: SO2 (column caption: see A4.1)
Station code PPCVVSSSPLTM
084046070102 084046100102 085015280102 085022040102 085035300102 085041210102 085053040102 085068060102 086991240102 086992060102 086993120102 086995010102 086996170102 086998150102 086999010102
Town name
UTRECHT UTRECHT BUSSUM DEN BOSCH HILVERSUM MAASTRICHT MIDDELBURG ZWOLLE LIG.ACHTERGR LIG.ACHTERGR LIG.ACHTERGR LIG.ACHTERGR LIG.ACHTERGR LIG.ACHTERGR LIG.ACHTERGR
cas no
309 335 266 311 315 251 326 325 332 318 295 265 320 328 327
mean val
31 30 31 40 30 44 32 28 28 29 39 12 14 20 13
std. d val
38.9 30.4 34.2 35.0 31.3 37.7 33.0 34.8 25.6 35.7 41.0 18.9 22.4 30.2 23.0
V
1.26 1.01 1.12 0.88 1.05 0.86 1.02 1.26 0.93 1.23 1.05 1.56 1.65 1.48 1.74
skew
4.31 4.65 5.06 2.70 5.05 2.42 2.45 4.44 3.13 3.82 2.48 6.04 7.24 5.64 6.02
D
0.74 1.14 1.06 0.81 1.18 0.75 0.60 0.77 0.87 0.69 0.58 0.71 0.76 0.73 0.57
kurt
26.1 31.4 37.9 9.9
38.6 7.0 8.0 32.9 12.3 21.4 8.4 51.2 74.9 45.7 52.8

121 Annuel Report 82
Annual descriptive parameters Pollutant 2: Smoke (column caption: see A4.1)
Station code PPCVVSSSPLTM
012010010203 012010020203 012010080203 012010140203 012010170203 012010220203 012010260203 013018010203 013018090203 013018120203 013018130203 013018180203 013018260203 014015010203 014015040203 014015050203 014015090203 014015130203 014015140203 014027010203 014027060203 014027070203 014027090203 014027120203 014027150203 014032050203 014032290203 014032300203 015016050203 015026030203 015033020203 053010070204 053010100204 053011030204 055010010206 075013530201 075023550201 075033600201 076990010201 091010150207 091021150207 091022130207 092023220207 092024060207 093010180207 093010300207
Town name
BRUXELLES BRUXELLES BRUXELLES BRUXELLES BRUXELLES BRUXELLES BRUXELLES ANTWERPEN ANTWERPEN ANTWERPEN ANTWERPEN ANTWERPEN ANTWERPEN CHARLEROI CHARLEROI CHARLEROI CHARLEROI CHARLEROI CHARLEROI GENT GENT GENT GENT GENT GENT LIEGE LIEGE LIEGE BRUGGE KORTRIJK LIBRAMONT DUBLIN DUBLIN DUBLIN GALWAY LUXEMBOURG-V ESCH-SUR-ALZ STEINFORT SITE DE FOND LONDON G MANCHESTER G MANCHESTER G MERSEYSIDE C MERSEYSIDE C LEEDS LEEDS
cas no
362 360 362 355 362 301 365 365 360 359 360 365 365 360 343 359 358 363 365 365 365 365 357 365 365 301 294 243 363 315 336 364 351 363 309 242 278 364 358 357 326 340 365 324 358 365
mean val
28 33 17 11 17 24 20 16 32 14 18 18 15 17 19 24 13 16 20 21 12 32 15 18 15 16 23 18 15 26 8 45 50 59 19 12 17 14 6 18 20 23 37 17 21 15
sto. d val
20.8 24.3 14.5 9.7 12.1 18.5 15.1 11.7 18.5 12.5 15.3 15.6 15.6 12.7 18.5 20.3 13.1 15.4 14.6 17.9 10.0 27.9 11.3 16.1 11.8 12.2 20.0 15.3 11.6 18.0 7.2 74.5 56.5 117.7 22.0 7.0 9.2 9.0 7.3 16.2 24.6 18.6 37.9 20.5 29.9 23.2
V
0.73 0.73 0.83 0.90 0.72 0.76 0.77 0.75 0.57 0.91 0.87 0.86 1.07 0.73 0.97 0.85 0.98 0.96 0.74 0.87 0.86 0.86 0.76 0.88 0.78 0.78 0.88 0.87 0.76 0.69 0.86 1.64 1.14 2.01 1.13 0.59 0.55 0.66 1.14 0.89 1.25 0.82 1.03 1.18 1.45 1.58
skew
2.42 2.41 2.36 3.24 2.05 1.94 2.10 2.33 1.55 2.17 1.97 2.07 2.56 2.26 2.47 2.02 3.00 2.72 1.91 3.26 3.85 3.24 2.13 2.33 2.55 2.32 3.38 1.99 1.77 1.72 2.17 5.10 2.70 7.68 2.56 1.52 0.41 2.13 4.91 3.09 4.73 2.90 5.22 4.52 5.01 6.01
D
0.93 0.93 0.77 0.94 0.80 0.71 0.76 0.87 0.81 0.62 0.61 0.65 0.58 0.88 0.64 0.65 0.77 0.72 0.73 0.99 1.19 1.00 0.79 0.70 0.91 0.82 1.01 0.61 0.65 0.71 0.67 0.55 0.55 0.54 0.53 0.78 0.22 0.94 1.00 0.92 0.83 0.97 1.24 0.87 0.68 0.69
kurt
8.1 6.8 6.6 14.9 5.4 5.1 6.2 8.4 3.7 5.5 4.5 5.2 8.6 10.2 7.6 5.1 10.6 10.1 4.6 15.5 27.8 20.4 5.8 8.4 10.3 8.0 19.5 4.7 3.7 3.1 6.5 32.4 9.7 72.4 7.4 5.7 -0.9 6.8 34.8 14.1 28.3 11.6 37.7 28.1 38.0 56.3

122 Annual Report 82
Annual descriptive parameters Pollutant 2; Smoke (column caption: see A4.1)
Station code Town PPCVVSSSPLTM name
093031310207 TYNESIDE 094010110207 BELFAST 094010150207 BELFAST 094020120207 CARDIFF 094030120207 EDINBURGH 094050090207 TEESSIDE 094052290207 TEESSIDE 095050050207 LINCOLN
cas no
276 364 365 258 341 365 358 334
mean val
22 32 27 20 24 14 16 17
std.d val
20.8 35.2 28.7 19.9 28.2 12.4 15.7 21.7
V
0.96 1.09 1.05 0.98 1.16 0.90 0.97 1.26
skew
2.42 4.55 5.05 2.24 3.12 2.57 2.65 3.84
D
0.65 0.99 1.17 0.57 0.62 0.75 0.69 0.66
kurt
8.1 30.9 35.2 6.2
14.2 9.5 8.7
20.7

123 Annual Report 82
Annual descriptive parameters Pollutant 3; SPM (column caption: see A4.1)
Station code Town PPCVVSSSPLTM name
cas mean std.d V skew D kurt no val val
022010080302 MUENCHEN, BA 300 71 40.7 0.57 2.46 1.29 9.9 022010100302 MUENCHEN, BA 320 111 45.4 0.41 0.92 0.71 1.3 022010140302 MUENCHEN, BA 320 44 34.9 0.79 3.34 1.17 15.3 022010150302 MUENCHEN, BA 300 60 46.3 0.78 2.80 1.00 11.6 022010160302 MUENCHEN, BA 337 43 36.6 0.86 3.64 1.13 20.2 023040010302 FRANKFURT-MA 327 71 33.3 0.47 1.62 1.07 3.7 023050810306 NUERNBERG, Β 301 60 36.7 0.61 1.97 0.96 5.0 023050820306 NUERNBERG, Β 302 47 28.2 0.60 2.06 1.01 6.6 023060010326 STUTTGART 304 19 16.9 0.90 2.86 0.84 11.9 023060020326 STUTTGART 353 19 22.5 1.20 3.70 0.70 17.4 024010710306 AUGSBURG, BA 284 63 36.0 0.57 1.26 0.66 2.5 024020540306 ERLANGEN, ΒΑ 314 60 27.6 0.46 1.65 1.13 2.9 024030010326 KARLSRUHE 323 23 18.9 0.84 3.31 1.06 14.7 024030220326 KARLSRUHE 349 34 33.6 0.98 3.01 0.78 11.4 024040010302 KASSEL, HESS 255 86 43.1 0.50 1.35 0.83 1.4 024050060325 LUDWIGSHAFEN 305 55 40.6 0.74 1.54 0.59 2.8 024050070325 LUDWIGSHAFEN 306 69 53.0 0.77 1.30 0.47 1.3 024050080325 LUDWIGSHAFEN 288 97 74.2 0.76 1.39 0.51 2.5 024061100326 MANNHEIM 284 20 18.3 0.89 2.70 0.80 10.4 024061110326 MANNHEIM 328 32 32.2 0.99 3.13 0.79 13.4 024061120326 MANNHEIM 329 28 23.4 0.84 3.47 1.12 17.0 024070310306 REGENSBURG, 300 53 33.6 0.63 1.75 0.81 3.5 024080010302 WIESBADEN, Η 331 78 47.2 0.61 1.72 0.84 3.4 024090640306 WUERZBURG, Β 314 44 36.5 0.82 2.38 0.79 7.9 024100110306 INGOLSTADT, 340 46 30.7 0.67 2.03 0.88 6.0 024110850306 FUERTH, BAYE 342 48 30.8 0.64 2.14 0.98 6.1 024120030325 MAINZ 323 48 42.9 0.90 2.40 0.70 7.8 024120040325 MAINZ 296 75 54.5 0.73 2.23 0.87 7.3 024120050325 MAINZ 297 58 48.9 0.84 2.07 0.67 5.5 024130010326 FREIBERG- 271 7 7.9 1.08 3.32 0.74 15.1 025020910306 KELHEIM, BAY 340 35 20.4 0.58 1.32 0.69 2.6 025030010326 HEILBROENN 353 30 33.3 1.10 2.96 0.64 11.9 025040010326 ULM 340 29 34.5 1.19 2.98 0.57 9.6 025050010325 SPEIZER 283 53 49.4 0.93 1.80 0.50 4.1 026990020308 B.R. DEUTSCH 350 44 32.2 0.74 1.75 0.67 3.4 026990030308 B.R. DEUTSCH 363 52 33.0 0.64 1.13 0.52 0.9 026990040308 B.R. DEUTSCH 363 43 26.4 0.61 1.25 0.61 1.6 026990050308 B.R. DEUTSCH 359 57 38.0 0.67 1.37 0.59 1.7 026990060308 B.R. DEUTSCH 356 35 22.1 0.63 1.13 0.53 1.5 026990070308 B.R. DEUTSCH 356 22 16.6 0.77 1.44 0.52 2.8 026990080308 B.R. DEUTSCH 344 48 35.3 0.74 1.68 0.64 2.8 026990090308 B.R. DEUTSCH 315 73 89.8 1.24 4.97 0.89 34.2 026990100308 B.R. DEUTSCH 357 42 24.6 0.59 1.44 0.73 2.9 026990120308 B.R. DEUTSCH 354 51 33.6 0.66 1.39 0.61 1.6 026990130308 B.R. DEUTSCH 358 39 24.0 0.62 1.05 0.50 1.0 026990140308 B.R. DEUTSCH 363 28 18.4 0.65 1.26 0.56 1.7

124 Annual Report 82
Annual descriptive parameters Pollutant 3t 5PM (column caption: see A4.1)
Station code PPCVVSSSPLTM
026990150308 026990160308 026990240326 062010010315 062010020315 062010030315
B.R. B.R. B.R.
Town name
DEUTSCH DEUTSCH DEUTSCH
TORINO TORINO TORINO
cas no
363 344 303 267 318 344
mean val
44 65 13 129 232 188
std.d val
27.6 42.1 15.4 57.7
114.5 96.7
V
0.63 0.65 1.22 0.45 0.49 0.51
skew
1.26 0.94 3.01 0.72 1.30 1.34
D
0.59 0.42 0.55 0.50 0.81 0.80
kurt
2.3 0.5
11.5 0.0 1.8 1.9

125 Annual Report 82
Annual descriptive parameters Pollutant 4; Acid (column caption: see A4.1)
Station code PPCVVSSSPLTM
012010010403 012010020403 012010080403 012010140403 012010170403 012010220403 012010260403 013018010403 013018090403 013018120403 013018130403 013018180403 013018260403 014015010403 014015040403 014015050403 014015090403 014015130403 014015140403 014027010403 014027060403 014027070403 014027090403 014027120403 014027150403 014032050403 014032290403 014032300403 015016050403 015026030403 015033020403 053010070404 053010100404 053011030404 055010010406 075013530401 075023550401 075033600401 076990010401 091010150407 091021150407 091022130407 092023220407 092024060407 093010180407 093010300407
Town name
BRUXELLES BRUXELLES BRUXELLES BRUXELLES BRUXELLES BRUXELLES BRUXELLES ANTWERPEN ANTWERPEN ANTWERPEN ANTWERPEN ANTWERPEN ANTWERPEN CHARLEROI CHARLEROI CHARLEROI CHARLEROI CHARLEROI CHARLEROI GENT GENT GENT GENT GENT GENT LIEGE LIEGE LIEGE BRUGGE KORTRIJK LIBRAMONT DUBLIN DUBLIN DUBLIN GALWAY LUXEMBOURG-V ESCH-SUR-ALZ STEINFORT SITE DE FOND LONDON G MANCHESTER G MANCHESTER G MERSEYSIDE C MERSEYSIDE C LEEDS LEEDS
cas no
362 360 362 355 362 301 365 358 352 346 346 358 358 359 343 359 360 356 365 362 357 352 358 354 358 301 294 241 363 315 336 361 351 360 315 242 278 364 365 357 329 340 365 324 357 365
mean val
86 78 43 30 51 50 46 87 90 66 81 82 102 47 36 48 59 44 56 60 51 60 71 77 54 85 91 64 44 46 33 50 48 56 14 46 43 32 23 31 71 73 61 74 64 53
std.d val
56.9 54.7 30.6 26.3 38.7 45.6 34.2 47.3 51.3 42.2 51.0 42.1 59.2 28.9 40.7 42.9 42.2 35.7 33.1 39.1 32.8 48.6 104.0 64.8 36.1 37.8 53.4 38.0 40.4 40.4 20.8 31.8 23.0 41.3 10.3 32.2 22.9 17.8 15.8 16.7 47.2 46.1 45.0 51.3 48.6 42.7
V
0.66 0.70 0.71 0.89 U.76 0.92 0.74 0.54 0.57 0.64 0.63 0.51 0.58 0.61 1.13 0.89 0.71 0.81 0.59 0.65 0.64 0.81 1.47 0.85 0.66 0.45 0.59 0.60 0.92 0.89 0.63 0.63 0.48 0.74 0.75 0.70 0.53 0.55 0.69 0.53 0.66 0.63 0.74 0.69 0.76 0.80
skew
1.53 2.06 2.14 2.33 1.95 2.05 1.92 1.31 1.79 1.45 1.95 0.96 1.63 1.23 3.82 2.39 1.52 2.19 2.25 2.08 2.41 2.70 14.32 2.33 1.48 1.26 2.41 1.80 1.99 1.93 1.37 2.60 1.19 4.03 2.61 1.28 1.28 0.59 1.21 1.30 2.01 2.28 2.78 2.44 2.96 3.90
D
0.67 0.84 0.86 0.69 0.71 0.58 0.73 0.73 0.95 0.66 0.92 0.58 0.84 0.60 0.79 0.70 0.61 0.74 1.14 0.93 1.11 0.91 1.89 0.74 0.65 0.88 1.22 0.90 0.56 0.58 0.64 1.21 0.77 1.55 0.97 0.52 0.73 0.33 0.50 0.74 0.88 1.06 1.06 1.01 1.10 1.34
kurt
3.4 5.5 6.5 7.5 4.4 5.2 4.6 2.8 5.4 2.2 5.7 1.3 4.5 2.0 20.5 8.2 2.9 7.0 7.5 6.7 10.5 12.1 240.7 7.1 3.4 2.3 9.8 5.4 5.3 6.0 2.5 11.6 1.8 28.0 10.9 2.0 2.4 -0.3 2.1 2.1 6.2 8.2 9.8 8.4 15.0 24.0

126 Annual Report 82
Annual descriptive parameters Pollutant 4: Acid (column caption: see A4.1)
Station code Town cas mean std.d V skew D kurt PPCVVSSSPLTM name no val val
093031310407 TYNESIDE 276 53 39.9 0.76 3.39 1.25 18.8 094010110407 BELFAST 094010150407 BELFAST 094020120407 CARDIFF 094030120407 EDINBURGH 094050090407 TEESSIDE 094052290407 TEESSIDE 095050050407 LINCOLN 334 54 28.8 0.53 1.10 0.62 1.2
365 365 258 341 365 349
36 37 42 43 47 21
16.6 16.7 23.5 27.9 28.2 22.1
0.46 0.45 0.55 0.64 0.60 1.03
1.84 0.97 3.36 2.98 1.96 5.17
1.24 0.66 1.84 1.35 0.98 1.23
9.6 1.2 17.4 13.3 7.4
40.8

127 Annual Report 82
ANNUAL CHARACTERISTICS OF THE SERIES
October 1981 - September 1982
Annex 5; First characteristics of the time series (selected series)
Column caption:
Label Explanation
Station code PPCVVSSSPLTM: PP country code C town class code VV town code SSS station code PL pollutant code TM measurement technique code
S/W ratio of the number of summer to winter measurements
50,98 winter and summer percentiles (microg/m^) winter: October 81 to March 82 summer: April to September 82
slope, int. slope (microg/m^/100 days and intercept (microg/m^) of the regression line computed for the yearly series.
persist. number of 3 days persistence for a concentration value higher than 125 microg/nK.

128 Annual Report 82
First characteristics of the time series Pollutant 1_: SO2 (column caption: see A5.1)
Station code PPCVVSSSPLTM
021010060103 021010080103 021010160103 021010180103 021010200103 021010280103 022010050104 022010070104 022010080104 022010100104 022010110104 022010120104 022010130104 022010140104 022010150104 022010160104 023010030105 023020030105 023030010105 023040010106 023040050107 023050810109 023050820109 023050830109 023060010126 023060020126 024010710109 024010720109 024020540109 024030010110 024030220110 024040010106 024050060112 024050070112 024050080112 024061100110 024061110110 024061120126 024070310109 024080010106 024080020106 024090640109 024090650109 024100110109 024110850109 024120030112 024120040112
Town
BERLIN (WEST BERLIN (WEST BERLIN (WEST BERLIN (WEST BERLIN (WEST BERLIN (WEST MUENCHEN, BA MUENCHEN, BA MUENCHEN, BA MUENCHEN, BA MUENCHEN, BA MUENCHEN, BA MUENCHEN, BA MUENCHEN, BA MUENCHEN, BA MUENCHEN, BA DORTMUND DUISBURG DUES5ELD0RF FRANKFURT-MA FRANKFURT-MA NUERNBERG, Β NUERNBERG, Β NUERNBERG, Β STUTTGART STUTTGART AUGSBURG, BA AUGSBURG, BA ERLANGEN, BA KARLSRUHE KARLSRUHE KASSEL, HESS LUDWIGSHAFEN LUDWIGSHAFEN LUDWIGSHAFEN MANNHEIM MANNHEIM MANNHEIM REGENSBURG, WIESBADEN, Η WIESBADEN, Η WUERZBURG, Β WUERZBURG, Β INGOLSTADT, FUERΤΗ, BAYE MAINZ MAINZ
S/W no
1.01 1.01 1.01 1.01 1.01 1.01 0.88 1.03 1.00 1.01 1.01 0.96 1.09 0.92 0.90 0.93 1.03 0.75 1.11 0.99 0.94 0.88 1.05 1.07 1.03 0.96 0.93 1.16 0.90 0.71 0.95 1.01 1.01 0.96 0.93 0.79 0.92 0.85 1.40 0.92 0.98 1.14 0.99 0.97 1.05 0.82 0.90
summer 50
40 60 50 40 40 40 13 14 20 23 17 17 16 18 21 21 40 40 70 45 35 22 24 18 20 20 23 13 27 40 20 39 21 31 34 50 30 20 19 37 31 18 17 17 15 16 19
98
120 150 150 90 120 80 37 45 58 47 70 55 42 51 61 58 90 130 160 119 77 63 73 62 50 60 51 32 85 90 60 103 71 105 98 100 110 70 47 83 91 67 47 81 59 74 60
winter 50
100 90 140 100 110 80 16 25 38 35 33 36 28 32 25 32 80 70 90 100 79 63 45 39 50 60 32 29 57 60 50 84 43 61 54 70 60 60 47 62 84 37 43 35 67 51 39
98
600 400 530 260 430 320 153 178 231 159 126 186 150 191 98 248 260 260 240 421 403 352 258 349 460 450 144 165 349 360 370 349 257 357 284 190 330 390 197 353 414 195 309 185 360 321 299
regression slope
-37 -23 -44 -29 -35 -25 -5 -8 -13 -7 -8 -11 -6 -9 -3 -10 -23 -11 -3 -31 -23 -21 -12 -15 -25 -26 -5 -11 -15 -15 -20 -24 -15 -20 -10 -8 -15 -24 -20 -20 -31 -11 -20 -10 -28 -19 -13
int.
167 142 202 136 157 125 31 44 64 47 44 55 39 52 34 57 112 87 92 144 115 94 68 73 101 105 44 49 87 99 88 124 74 100 73 78 90 102 81 105 136 56 83 55 107 91 68
persist no
31 40 72 36 49 32 3 6 7 3 0 6 0 6 0 7 6 11 16 31 17 13 5 11 12 19 0 3 12 23 18 38 15 14 13 6 10 16 9 27 41 3 14 5 11 21 10

129 Annual Report 82
Firet characteristics of the time series Pollutant 1_; SO2 (column caption: see A5.1)
Station code PPCVVSSSPLTM
024120050112 025010610109 025020910109 025020920109 025030010126 025040010126 026990010113 026990020113 026990030113 026990040113 026990050113 026990060113 026990070113 026990080113 026990090113 026990100113 026990120113 026990130113 026990140113 026990150113 026990160113 026990240110 061010090120 061010100120 061010130120 061010140120 061010150120 061010160120 083015150102 083015160102 083015180102 083015190102 083015200102 083015210102 083015230102 083015250102 083024040102 083024050102 083034180102 083034230102 084018140102 084029080102 084029090102 084032130102 084032140102 084046070102 084046100102
Town
MAINZ ASCHAFFENBUR KELHEIM, BAY KELHEIM, BAY HEILBR0ENN ULM B.R. B.R. B.R. B.R. B.R. B.R. B.R. B.R. B.R. B.R. B.R. B.R. B.R. B.R. B.R. B.R.
DEUTSCH DEUTSCH DEUTSCH DEUTSCH DEUTSCH DEUTSCH DEUTSCH DEUTSCH DEUTSCH DEUTSCH DEUTSCH DEUTSCH DEUTSCH DEUTSCH DEUTSCH DEUTSCH
MILANO MILANO MILANO MILANO MILANO MILANO AMSTERDAM AMSTERDAM AMSTERDAM AMSTERDAM AMSTERDAM AMSTERDAM AMSTERDAM AMSTERDAM DEN DEN
HAAG HAAG
ROTTERDAM ROTTERDAM ENSCHEDE GRONINGEN GRONINGEN TILBURG TILBURG UTRECHT UTRECHT
S/W no
0.99 0.96 1.00 0.91 0.92 0.93 0.99 0.99 1.02 1.00 1.03 1.04 1.14 1.00 0.89 0.95 1.01 1.03 0.99 0.97 1.06 1.24 1.17 0.83 1.06 1.12 1.05 0.97 1.11 0.85 0.96 0.74 0.94 0.86 0.86 0.85 0.99 0.96 1.06 1.02 0.91 1.03 0.58 0.81 1.11 1.10 1.03
summer 50
27 17 25 20 30 30 2 1 5 8 4 4 1 1 7 9 8 1 1 6 8 20 39 31 39 29 55 42 17 15 17 23 15 19 18 15 17 15 29 21 10 7 10 31 17 14 17
98
93 61 55 75 70 100 19 27 33 30 31 28 16 25 66 30 43 17 12 26 63 70 143 156 125 94 125 125 46 43 41 105 59 47 49 38 60 54 80 70 44 37 30 60 41 44 46
winter 50
63 52 31 34 50 40 7 7 20 17 14 9 4 10 25 23 22 9 8 21 20 50 286 346 239 177 195 367 30 32 31 25 36 33 28 33 42 33 51 41 27 15 16 45 28 30 29
98
375 169 101 256 240 230 111 91 200 108 151 56 43 200 275 79 97 96 53 139 142 250 809 999 725 533 494 983 115 171 153 130 161 126 127 160 185 144 173 160 178 92 114 155 150 212 185
regression slope
-23 -14 -5 -11 -11 -6 -4 -5 -12 -5 -8 -2 -2 -7 -12 -7 -7 -5 -4 -9 -6 -24
-107 -134 -89 -67 -61 -142 -6 -10 -9 -2 -11 -8 -5 -11 -11 -8 -11 -10 -9 -6 -6 -8 -9 -10 -7
int.
109 68 42 61 68 55 18 20 45 26 31 14 9 27 53 33 33 19 15 40 37 98 373 469 319 239 246 491 40 48 48 37 53 46 38 51 56 46 63 56 44 29 30 60 47 50 44
persist no
28 2 0 7 7 10 2 0 5 0 0 0 0 3 7 0 0 0 0 0 1 12 81 131 85 63 84 139 0 1 0 0 1 0 0 0 0 0 0 0 0 0 1 1 1 2 1

130 Annuel Report 82
First characteristics of the time series Pollutant ¿: SO2 (column caption: see A5.1)
Station code PPCVVSSSPLTM
085015280102 085022040102 085035300102 085041210102 085053040102 085068060102 086991240102 086992060102 086993120102 086995010102 086996170102 086998150102 086999010102
Town
BUSSUM DEN BOSCH HILVERSUM MAASTRICHT MIDDELBURG ZWOLLE LIG.ACHTERGR LIG.ACHTERGR LIG.ACHTERGR LIG.ACHTERGR LIG.ACHTERGR LIG.ACHTERGR LIG.ACHTERGR
S/W no
0.93 1.16 0.92 0.49 1.06 0.93 0.96 1.05 0.92 1.26 1.08 0.99 0.95
summer 50
18 23 18 24 17 9 15 13 16 5 6 8 5
98
47 58 43 61 63 44 55 45 58 23 29 43 29
wir 50
27 43 27 39 25 28 25 29 40 10 11 16 10
iter 98
159 196 156 191 137 161 155 182 198 73 89 114 113
regression slope
-7 -13 -7 -7 -7 -11 -7 -10 -16 -5 -4 -6 -5
int.
44 64 42 55 45 47 40 47 66 22 22 32 22
persist no
1 1 1 3 0 1 1 2 2 0 0 0 0

131 Annual Report 82
First characteristics of the time series Pollutant %x Smoke (column caption: see A5.1)
Station code PPCVVSSSPLTM
012010010203 012010020203 012010080203 012010140203 012010170203 012010220203 012010260203 013018010203 013018090203 013018120203 013018130203 013018180203 013018260203 014015010203 014015040203 014015050203 014015090203 014015130203 014015140203 014027010203 014027060203 014027070203 014027090203 014027120203 014027150203 014032050203 014032290203 014032300203 015016050203 015026030203 015033020203 053010070204 053010100204 053011030204 055010010206 075013530201 075023550201 075033600201 076990010201 091010150207 091021150207 091022130207 092023220207 092024060207 093010180207 093010300207 093031310207
Town
BRUXELLES BRUXELLES BRUXELLES BRUXELLES BRUXELLES BRUXELLES BRUXELLES ANTWERPEN ANTWERPEN ANTWERPEN ANTWERPEN ANTWERPEN ANTWERPEN CHARLEROI CHARLEROI CHARLEROI CHARLEROI CHARLEROI CHARLEROI GENT GENT GENT GENT GENT GENT LIEGE LIEGE LIEGE BRUGGE KORTRIJK LIBRAMONT DUBLIN DUBLIN DUBLIN GALWAY LUXEMBOURG-V ESCH-SUR-ALZ STEINFORT SITE DE FOND LONDON .G MANCHESTER G MANCHESTER G MERSEYSIDE C MERSEYSIDE C LEEDS LEEDS TYNESIDE
S/W no
1.02 1.03 1.02 1.06 1.02 0.91 1.01 1.01 1.03 1.04 1.03 1.01 1.01 1.03 1.14 1.04 0.97 1.02 1.01 1.01 1.01 1.01 1.04 1.01 1.01 0.95 0.91 0.59 0.99 1.27 1.10 1.01 0.93 1.02 1.22 0.45 0.74 1.00 1.05 1.05 1.19 0.99 1.01 1.00 1.05 1.01 0.60
summer 50
18 29 12 8 11 14 12 12 23 9 10 11 7 12 10 12 7 9 12 14 8 22 10 10 10 10 16 11 10 17 5 11 15 14 7 9 8 8 3 13 8 11 23 9 8 6 10
98
52 94 39 23 37 39 38 27 58 25 29 37 36 48 42 37 19 29 42 48 26 66 39 36 28 30 48 32 31 52 16 55 65 74 32 18 26 23 15 40 37 44 60 30 40 27 37
winter 50
29 25 16 9 16 25 19 15 36 12 19 17 13 16 16 25 12 14 19 18 10 28 14 18 16 14 20 16 16 28 8 45 52 56 24 13 22 16 6 17 20 23 32 14 16 11 17
98
103 119 78 48 61 85 74 59 95 64 72 72 76 48 94 89 65 77 69 97 42 111 62 74 58 52 76 76 58 89 34 359 247 331 121 30 36 53 35 85 166 120 163 103 134 92 88
regression slope
-6 2 -3 -1 -2 -5 -3 -1 -6 -2 -4 -3 -3 -1 -4 -9 -2 -3 -3 -3 -1 -5 -2 -4 -3 -2 -3 -2 -2 -5 -2 -24 -23 -33 -10 -1 -5 -3 -1 -4 -12 -8 -11 -6 -8 -5 -7
int.
40 29 22 13 20 33 25 18 43 18 25 24 20 20 26 40 17 21 25 26 14 42 19 25 20 20 29 20 20 35 11 90 90 120 38 14 26 20 8 26 43 37 56 28 36 24 33
persist no
0 0 0 0 0 0 0 0 0 0 0 0 0 0 0 0 0 0 0 0 0 0 0 0 0 0 0 0 0 0 0 6 7 8 0 0 0 0 0 0 0 0 0 0 0 0 0
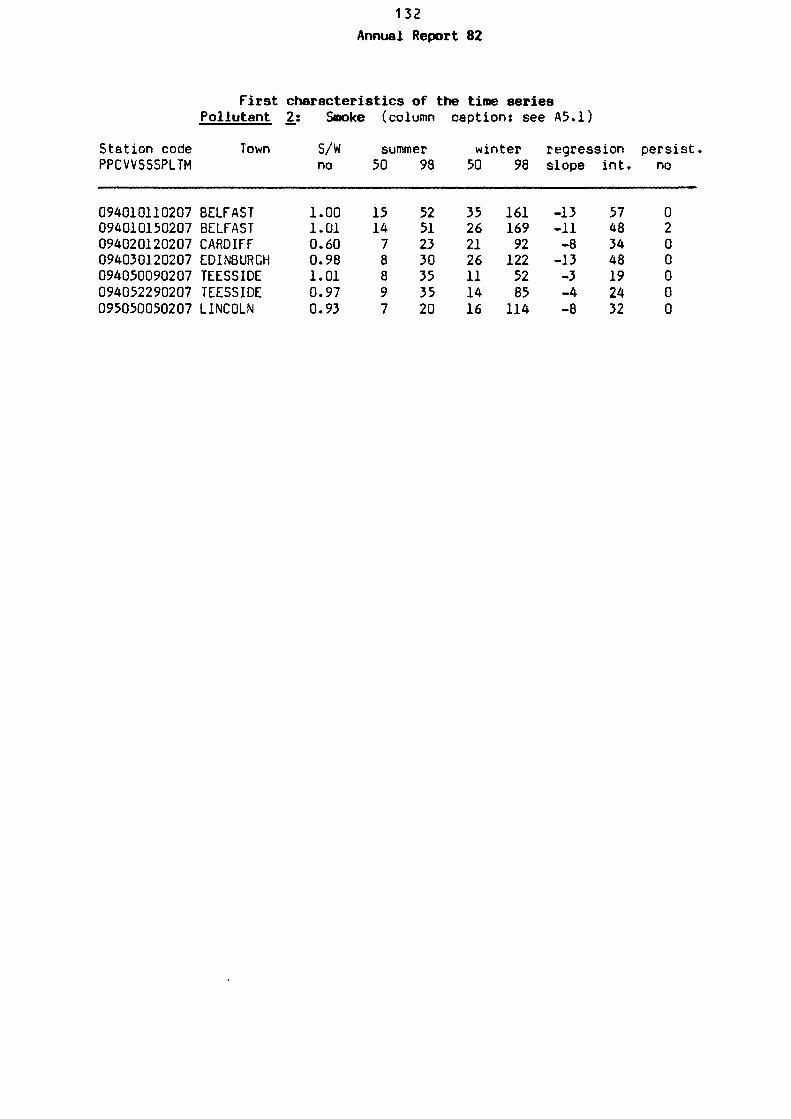
132 Annual Report 82
First characteristics of the time series Pollutant 2_: Smoke (column caption: see A5.1)
Station code Town PPCVVSSSPLTM
094010110207 BELFAST 094010150207 BELFAST 094020120207 CARDIFF 094030120207 EDINBURGH 094050090207 TEESSIDE 094052290207 TEESSIDE 095050050207 LINCOLN
S/W no
1.00 1.01 0.60 0.98 1.01 0.97 0.93
summer 50
15 14 7 8 8 9 7
98
52 51 23 30 35 35 20
winter 50
35 26 21 26 11 14 16
98
161 169 92 122 52 85 114
regression slope
-13 -11 -8 -13 -3 -4 -8
int.
57 48 34 48 19 24 32
persist no
0 2 0 0 0 0 0

133 Annual Report 82
Station code PPCVVSSSPLTM
First characteristics of the time series Pollutant 3_: SPM (column caption: see A5.1)
Town S/W summer winter regression persist, no 50 98 50 98 slope int. no
■i
022010080302 022010100302 022010140302 022010150302 022010160302 023040010302 023050810306 023050820306 023060010326 023060020326 024010710306 024020540306 024030010326 024030220326 024040010302 024050060325 024050070325 024050080325 024061100326 024061110326 024061120326 024070310306 024080010302 024090640306 024100110306 024110850306 024120030325 024120040325 024120050325 024130010326 025020910306 025030010326 025040010326 025050010325 026990020308 026990030308 026990040308 026990050308 026990060308 026990070308 026990080308 026990090308 026990100308 026990120308 026990130308 026990140308 026990150308
MUENCHEN, BA MUENCHEN, BA MUENCHEN, BA MUENCHEN, BA MUENCHEN, BA FRANKFURT-MA NUERNBERG, Β NUERNBERG, Β STUTTGART STUTTGART AUGSBURG, BA ERLANGEN, ΒΑ KARLSRUHE KARLSRUHE KASSEL, HESS LUDWIGSHAFEN LUDWIGSHAFEN LUDWIGSHAFEN MANNHEIM MANNHEIM MANNHEIM REGENSBURG, WIESBADEN, Η WUERZBURG, Β INGOLSTADT, FUERTH, BAYE MAINZ MAINZ MAINZ FREIBERG KELHEIM, BAY HEILBROENN ULM SPEIZER B.R. DEUTSCH B.R. DEUTSCH B.R. DEUTSCH B.R. DEUTSCH B.R. DEUTSCH B.R. DEUTSCH B.R. DEUTSCH B.R. DEUTSCH B.R. DEUTSCH B.R. DEUTSCH B.R. DEUTSCH B.R. DEUTSCH B.R. DEUTSCH
1.22 1.00 1.00 0.85 0.95 0.80 0.92 1.46 1.30 0.96 1.56 1.28 0.84 1.02 2.11 0.85 0.87 0.89 0.95 0.83 0.85 1.52 0.87 1.15 0.97 0.98 0.89 1.04 0.95 1.17 0.98 0.96 0.95 0.69 1.06 1.01 1.02 1.02 1.02 1.01 0.92 0.86 1.04 1.07 1.05 0.99 0.99
60 108 35 47 35 63 46 45 15 10 70 45 15 20 66 43 61 89 15 19 20 43 62 33 39 37 36 75 44 6 26 16 15 48 39 45 44 44 41 27 33 46 42 43 36 28 43
135 192 93 103 96 125 96 79 43 43 142 100 35 78 142 151 193 238 56 83 64 86 130 94 82 78 115 184 144 26 63 62 35 110 81 132 116 125 90 66 127 139 86 128 80 66 103
69 100 37 56 34 61 56 37 14 16 33 45 20 30 108 39 55 75 13 25 22 53 64 39 38 46 33 49 39 4 35 24 23 27 29 37 30 46 21 10 39 44 31 37 31 19 31
239 242 231 266 232 182 207 159 89 142 206 161 108 198 226 189 231 342 90 147 116 190 244 185 160 168 200 302 266 29 99 160 191 208 164 142 112 177 88 60 169 479 113 159 115 80 122
-3 6 -2 -4 -0. 3 -5 2
-0. -3 12 1 -3 -5 -25 3 3 10 0. -3 -0. -4 -1 -3 0. -5 3 11 3 1 -4 -5 -6 8 2 5 8 3 10 6 1 -3 6 5 3 4 6
77 99 48 66 44 66 69 43 20 25 40 58 28 43 145 49 63 80 20 37 28 60 80 50 45 57 42 54 52 5 42 39 41 40 40 43 29 52 17 10 46 78 31 41 34 21 33
7 33 6 4 3 6 7 0 0 1 4 0 0 6 19 4 16 35 0 3 1 5 15 3 2 3 5 10 8 0 0 3 5 7 6 3 0 5 0 0 4 12 0 4 0 0 0

134 Annual Report 82
Station code PPCVVSSSPLTM
First characteristics of the time series Pollutant 3: SPM (column caption: see A5.1)
Town S/W no
1.00 1.26 1.64 0.84 0.94
summer 50
62 5
106 174 135
98
164 31 220 343 271
winter 50
44 13 145 247 211
98
172 85 282 576 503
regression slope
9 -4 -20 -33 -40
int.
48 22 168 289 261
pers; no
10 0 48 207 174
026990160308 B.R. DEUTSCH 026990240326 B.R. DEUTSCH 062010010315 TORINO 062010020315 TORINO 062010030315 TORINO

135 Annual Report 82
First characteristics of the time series Pollutant 4̂ Acid (column caption: see A5.1)
Station code PPCVVSSSPLTM
012010010403 012010020403 012010080403 012010140403 012010170403 012010220403 012010260403 013018010403 013018090403 013018120403 013018130403 013018180403 013018260403 014015010403 014015040403 014015050403 014015090403 014015130403 014015140403 014027010403 014027060403 014027070403 014027090403 014027120403 014027150403 014032050403 014032290403 014032300403 015016050403 015026030403 015033020403 053010070404 053010100404 053011030404 055010010406 075013530401 075023550401 075033600401 076990010401 091010150407 091021150407 091022130407 092023220407 092024060407 093010180407 093010300407 093031310407
Town
BRUXELLES BRUXELLES BRUXELLES BRUXELLES BRUXELLES BRUXELLES BRUXELLES ANTWERPEN ANTWERPEN ANTWERPEN ANTWERPEN ANTWERPEN ANTWERPEN CHARLEROI CHARLEROI CHARLEROI CHARLEROI CHARLEROI CHARLEROI GENT GENT GENT GENT GENT GENT LIEGE LIEGE LIEGE BRUGGE K0RTRI3K LIBRAMONT DUBLIN DUBLIN DUBLIN GALWAY LUXEMBOURG-V ESCH-SUR-ALZ STEINFORT SITE DE FOND LONDON G MANCHESTER G MANCHESTER G MERSEYSIDE C MERSEYSIDE C LEEDS LEEDS TYNESIDE
S/W no
1.02 1.03 1.02 1.06 1.02 0.91 1.01 1.05 1.08 1.12 1.12 1.05 1.05 1.03 1.14 1.04 0.98 1.06 1.01 0.99 0.96 0.93 1.03 0.95 0.97 0.95 0.91 0.60 0.99 1.27 1.10 1.03 0.93 1.03 1.27 0.45 0.74 1.00 1.01 1.05 1.21 0.99 1.01 1.00 1.04 1.01 0.60
summer 50
47 55 34 21 31 26 36 66 60 45 57 61 76 41 18 21 30 30 43 49 41 41 60 56 38 74 66 41 19 20 26 42 42 36 6 22 25 18 13 29 44 46 42 54 40 36 36
98
116 147 81 66 88 83 114 177 124 106 132 125 189 115 82 81 111 81 79 150 113 184 263 323 113 157 167 110 62 81 65 104 118 75 23 54 54 52 49 77 129 130 110 159 128 121 87
winter 50
111 75 39 23 53 54 37 97 104 69 94 97 101 46 35 53 71 43 61 53 49 56 53 60 60 79 89 61 54 59 34 51 47 66 17 50 52 41 27 29 80 72 52 75 62 42 48
98
272 261 154 139 195 217 184 209 261 200 295 205 274 135 213 208 183 170 181 188 165 199 135 214 154 214 313 161 193 189 97 153 103 181 47 132 115 77 64 81 252 267 272 296 248 172 191
regression slope
-30 -9 -4 -3 -13 -12 -3 -9 -20 -10 -17 -16 -11 -1 -14 -19 -19 -6 -9 -6 -9 -5 6 5
-10 0. -13 -11 -17 -18 -4 -7 -2 -15 -4 -19 -17 -12 -6 -2 -25 -19 -10 -9 -16 -7 -10
int.
142 94 50 36 75 72 52 104 126 84 112 111 123 49 63 83 95 56 73 70 67 68 59 68 73 85 113 81 75 80 40 62 51 85 20 74 71 54 33 35 121 108 80 91 94 65 67
persist no
32 22 1 0 8 9 2 24 23 8 17 11 27 0 4 7 9 6 8 4 0 8 7 21 0 15 20 6 4 3 0 3 0 2 0 0 0 0 0 0 15 15 8 11 7 6 2

136 Annuel Report 82
First characteristics of the time series Pollutant 4: Acid (column caption: see A5.1)
Station code Town PPCVVSSSPLTM
S/W no
1.01 1.01 0.60 0.98 1.01 0.93 0.93
summer 50
31 36 32 39 41 8 34
98
55 59 53 66 119 44 88
win 50
42 32 42 32 39 22 64
iter 98
77 86 132 151 125 76 139
regression slope
-3 4 -6 -4 -2 -7 -11
int.
42 30 52 50 50 34 75
persist. no
0 0 2 0 0 1 0
094010110407 BELFAST 094010150407 BELFAST 094020120407 CARDIFF 094030120407 EDINBURGH 094050090407 TEESSIDE 094052290407 TEESSIDE 095050050407 LINCOLN
851015

137 Annual Report 82
ANNUAL CHARACTERISTICS OF THE SERIES
October 1981 - September 1982
Annex 6; Status of the isolated extremum of the monthly »edian values
Column caption:
Label Explanation
Station code PPCVVSSSPLTM: PP country code C town class code VV town code SSS station code PL pollutant code TM measurement technique code
Status code The status code found in the following Annex is a scaling of the isolation tendency of the extreme monthly median values with respect to the spreading of the other monthly medians (see explanation in Chapter II.4).
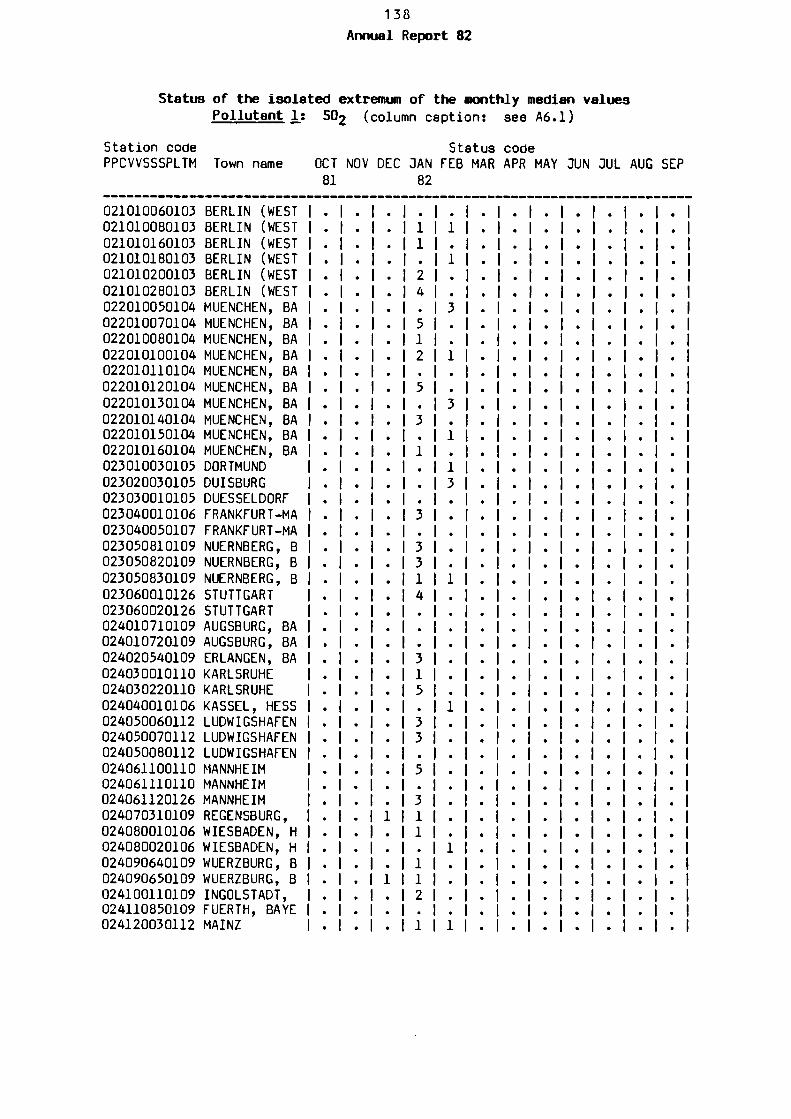
138 Annual Report 82
Status of the isolated extremum of the monthly median values
Station code PPCVVSSSPLTM
Pollutant 1; S02 (column caption: see A6.1)
Status code Town name OCT NOV DEC JAN FEB MAR APR MAY JUN JUL AUG SEP
81 82
021010060103 BERLIN (WEST | . | . | . | . 021010080103 BERLIN (WEST | . | . | . | 1 021010160103 BERLIN (WEST I . I . I . | 1 021010180103 BERLIN (WEST I . | . | . | . 021010200103 BERLIN (WEST | . | . | . | 2 021010280103 BERLIN (WEST | . | . | . | 4 022010050104 MUENCHEN, BA | . | . | . | . 022010070104 MUENCHEN, BA | . | . | . | 5 022010080104 MUENCHEN, BA | . | . | . | 1 022010100104 MUENCHEN, BA | . | . | . | 2 022010110104 MUENCHEN, BA | . | . | . | . 022010120104 MUENCHEN, BA | . | . | . | 5 022010130104 MUENCHEN, BA | . | . | . | . 022010140104 MUENCHEN, BA | . | . | . | 3 022010150104 MUENCHEN, BA | . | . | . | . 022010160104 MUENCHEN, BA | . | . | . | 1 023010030105 DORTMUND I . I . I . I . I 1 023020030105 DUISBURG | . | . | . | . | 3 023030010105 DUESSELDORF I . I . | . | . 023040010106 FRANKFURT-MA I . | . | . | 3 023040050107 FRANKFURT-MA | . | . | . | . 023050810109 NUERNBERG, B I . | . | . | 3 023050820109 NUERNBERG, B | . | . | . | 3 023050830109 NUERNBERG, B | . | . | . | 1 023060010126 STUTTGART | . | . | . | 4 023060020126 STUTTGART | . | . | . | . 024010710109 AUGSBURG, BA I . | . | . | . 024010720109 AUGSBURG, BA I . | . | . | . 024020540109 ERLANGEN, BA I . | . | . | 3 024030010110 KARLSRUHE I . | . | . | 1 024030220110 KARLSRUHE I . | . | . | 5 024040010106 KASSEL, HESS | . | . | . | . 024050060112 LUDWIGSHAFEN | . | . | . | 3 024050070112 LUDWIGSHAFEN | . | . | . | 3 024050080112 LUDWIGSHAFEN | . | . | . | . 024061100110 MANNHEIM | . | . | . | 5 024061110110 MANNHEIM | . | . | . | . 024061120126 MANNHEIM | . | . | . | 3 024070310109 REGENSBURG, I . | . | 1 | 1 024080010106 WIESBADEN, H | . | . | . | 1 024080020106 WIESBADEN, H I . | . | . | . 024090640109 WUERZBURG, B I . I . | . | 1 024090650109 WUERZBURG, B I . | . | 1 | 1 024100110109 INGOLSTADT, | . | . | . | 2 024110850109 FUERTH, BAYE I . | . | . | . 024120030112 MAINZ I . I . I . I 1

139 Annual Report 82
Statue of the isolated extremum of the monthly median values Pollutant 1: SO-2 (column caption: see A6.1)
Station code PPCVVSSSPLTM
Status code Town name OCT NOV DEC JAN FEB MAR APR MAY JUN JUL AUG SEP
81 82
024120040112 024120050112 025010610109 025020910109 025020920109 025030010126 025040010126 026990010113 026990020113 026990030113 026990040113 026990050113 026990060113 026990070113 026990080113 026990090113 026990100113 026990120113 026990130113 026990140113 026990150113 026990160113 061010090120 061010100120 061010130120 061010140120 061010150120 061010160120 083015160102 083015180102 083015200102 083015210102 083015230102 083015250102 083024040102 083024050102 083034180102 083034230102 084018140102 084029080102 084032130102 084032140102 084046070102 084046100102 085015280102 085022040102 085035300102
B.R. B.R.
MAINZ MAINZ ASCHAFFENBUR KELHEIM, BAY KELHEIM, BAY HEILBR0ENN ULM B.R. DEUTSCH B.R. DEUTSCH B.R. DEUTSCH B.R. DEUTSCH B.R. DEUTSCH B.R. DEUTSCH B.R. DEUTSCH B.R. DEUTSCH B.R. DEUTSCH B.R. DEUTSCH B.R. DEUTSCH B.R. DEUTSCH
DEUTSCH DEUTSCH
B.R. DEUTSCH MILANO MILANO MILANO MILANO MILANO MILANO AMSTERDAM AMSTERDAM AMSTERDAM AMSTERDAM AMSTERDAM AMSTERDAM DEN HAAG DEN HAAG ROTTERDAM ROTTERDAM ENSCHEDE GRONINGEN TILBURG TILBURG UTRECHT UTRECHT BUSSUM DEN BOSCH HILVERSUM
2 1
3 2 1

14Q Annual Report 82
Status of the isolated extremum of the monthly median values Pollutant 1; SO2 (column caption: see A6.1)
Station code PPCVVSSSPLTM
Status code Town name OCT NOV DEC JAN FEB MAR APR MAY JUN JUL AUG SEP
81 82
085041210102 085053040102 085068060102 086991240102 086992060102 086996170102 086998150102 086999010102
MAASTRICHT MIDDELBURG ZWOLLE LIG.ACHTERGR LIG.ACHTERGR LIG.ACHTERGR LIG.ACHTERGR LIG.ACHTERGR
* I * I *
• 1 1 1 5 . I . I 5
l l . l i 1 I . I 5 . 1 . 1 5

141
Annual Report 82
Status of the isolated extremum of the monthly median values Pollutant 2; Smoke (column caption: see A6.1)
Station code PPCVVSSSPLTM Town name
Status code . OCT NOV DEC JAN FEB MAR APR MAY GUN JUL AUG SEP 81 82
012010010203 012010020203 012010080203 012010140203 012010170203 012010220203 012010260203 013018010203 013018090203 013018120203 013018130203 013018180203 013018260203 014015010203 014015040203 014015050203 014015090203 014015130203 014015140203 014027010203 014027060203 014027070203 014027090203 014027120203 014027150203 014032050203 014032290203 014032300203 015016050203 015026030203 015033020203 053010070204 053010100204 053011030204 055010010206 075023550201 075033600201 076990010201 091010150207 091022130207 092023220207 092024060207 093010180207 093010300207 094010110207 094010150207 094030120207
BRUXELLES BRUXELLES BRUXELLES BRUXELLES BRUXELLES BRUXELLES BRUXELLES ANTWERPEN ANTWERPEN ANTWERPEN ANTWERPEN ANTWERPEN ANTWERPEN CHARLEROI CHARLEROI CHARLEROI CHARLEROI CHARLEROI CHARLEROI GENT GENT GENT GENT GENT GENT LIEGE LIEGE LIEGE BRUGGE KORTRIJK LIBRAMONT DUBLIN DUBLIN DUBLIN GALWAY ESCH-SUR-ALZ STEINFORT SITE DE FOND LONDON G MANCHESTER G MERSEYSIDE C MERSEYSIDE C LEEDS LEEDS BELFAST BELFAST EDINBURGH
3
2
3 5 1
3 5 3
3 2 1
1 5
1 5 3 1 3
5 1 2 3
1 5
3 2 1 5 1 5
2 1
-l
-2

142 Annuel Report 82
Status of the isolated extremum of the monthly median values Pollutant 2; Smoke (column caption: see A6.1)
Station code Status code PPCVVSSSPLTM Town name OCT NOV DEC JAN FEB MAR APR MAY JUN JUL AUG SEP
81 82
094050090207 TEESSIDE | . | . | 2 | . | . | . | . | . | . | . | . | . I 094052290207 TEESSIDE I . I . I . I . I . I . I 1 I . I . I . I . I . I 095050050207 LINCOLN | . | . | 4 | 1 | . | . | . | . | . | . | . | . I

143 Annual Report 82
Status of the isolated extremum of the monthly median values Pollutant 3; SPM (column caption: 9ee A6.1)
Station code PPCVVSSSPLTM
Status code Town name OCT NOV DEC JAN FEB MAR APR MAY JUN JUL AUG SEP
81 82
022010080302 022010100302 022010140302 022010150302 022010160302 023020010303 023030020303 023040010302 023050810306 023050820306 023060010326 023060020326 024020540306 024030220326 024050060325 024050070325 024050080325 024061110326 024061120326 024070310306 024080010302 024090640306 024100110306 024110850306 024120030325 024120040325 024120050325 025020910306 025030010326 025040010326 025050010325 026990020308 026990030308 026990040308 026990050308 026990060308 026990070308 026990080308 026990090308 026990100308 026990120308 026990130308 026990140308 026990150308 026990160308 062010010315 062010020315
MUENCHEN, BA MUENCHEN, BA MUENCHEN, BA MUENCHEN, BA MUENCHEN, BA DUISBURG DUESSELD0RF FRANKFURT-MA NUERNBERG, Β NUERNBERG, Β STUTTGART STUTTGART ERLANGEN, BA KARLSRUHE LUDWIGSHAFEN LUDWIGSHAFEN LUDWIGSHAFEN MANNHEIM MANNHEIM REGENSBURG, WIESBADEN, Η WUERZBURG, Β INGOLSTADT, FUERTH, BAYE MAINZ MAINZ MAINZ KELHEIM, BAY HEILBROENN ULM SPEIZER B.R. DEUTSCH B.R. DEUTSCH B.R. DEUTSCH B.R. DEUTSCH B.R. DEUTSCH B.R. DEUTSCH B.R. DEUTSCH B.R. DEUTSCH B.R. DEUTSCH B.R. DEUTSCH B.R. DEUTSCH B.R. DEUTSCH B.R. DEUTSCH B.R. DEUTSCH TORINO TORINO
-2
-l
-l
1 1
1 1 5 5 5 2 • 2 5 5 1 5 5 5 5 5 • 5 5 5 5 5 5 5 5 • 5 5 5 5 2 5 5
5 5 5 5 • 2 5 1 1 1
-l

U4 Annuel Report 82
Status of the isolated extremum of the Monthly median values Pollutant 3; SPM (column caption: see A6.1)
Station code Status code PPCVVSSSPLTM Town name OCT NOV DEC JAN FEB MAR APR MAY DUN JUL AUG SEP
81 82
062010030315 TORINO I . I . I . | 2 | . | . | . | . | . | . | . | . | 064080010315 PESCARA I · I · I . I . I . I . I . I . | . | . | . | . |

145 Annuel Report 82
Statue of the isolated extremum of the monthly median values Pollutant 4; Acid (column caption: see A6.1)
Station code PPCVVSSSPLTM
Status code Town name OCT NOV DEC JAN FEB MAR APR MAY JUN JUL AUG SEP
81 82
012010010403 012010020403 012010080403 012010140403 012010170403 012010220403 012010260403 013018010403 013018090403 013018120403 013018130403 013018180403 013018260403 014015010403 014015040403 014015050403 014015090403 014015130403 014015140403 014027010403 014027060403 014027070403 014027090403 014027120403 014027150403 014032050403 014032290403 014032300403 015016050403 015026030403 015033020403 053010070404 053010100404 053011030404 055010010406 075023550401 075033600401 076990010401 091010150407 091022130407 092023220407 092024060407 093010180407 093010300407 094010110407 094010150407 094030120407
BRUXELLES BRUXELLES BRUXELLES BRUXELLES BRUXELLES BRUXELLES BRUXELLES ANTWERPEN ANTWERPEN ANTWERPEN ANTWERPEN ANTWERPEN ANTWERPEN CHARLEROI CHARLEROI CHARLEROI CHARLEROI CHARLEROI CHARLEROI GENT GENT GENT GENT GENT GENT LIEGE LIEGE LIEGE BRUGGE KORTRIJK LIBRAMONT DUBLIN DUBLIN DUBLIN GALWAY ESCH-SUR-ALZ STEINFORT SITE DE FOND LONDON G MANCHESTER G MERSEYSIDE C MERSEYSIDE C LEEDS LEEDS BELFAST BELFAST EDINBURGH
-l
-l
-l
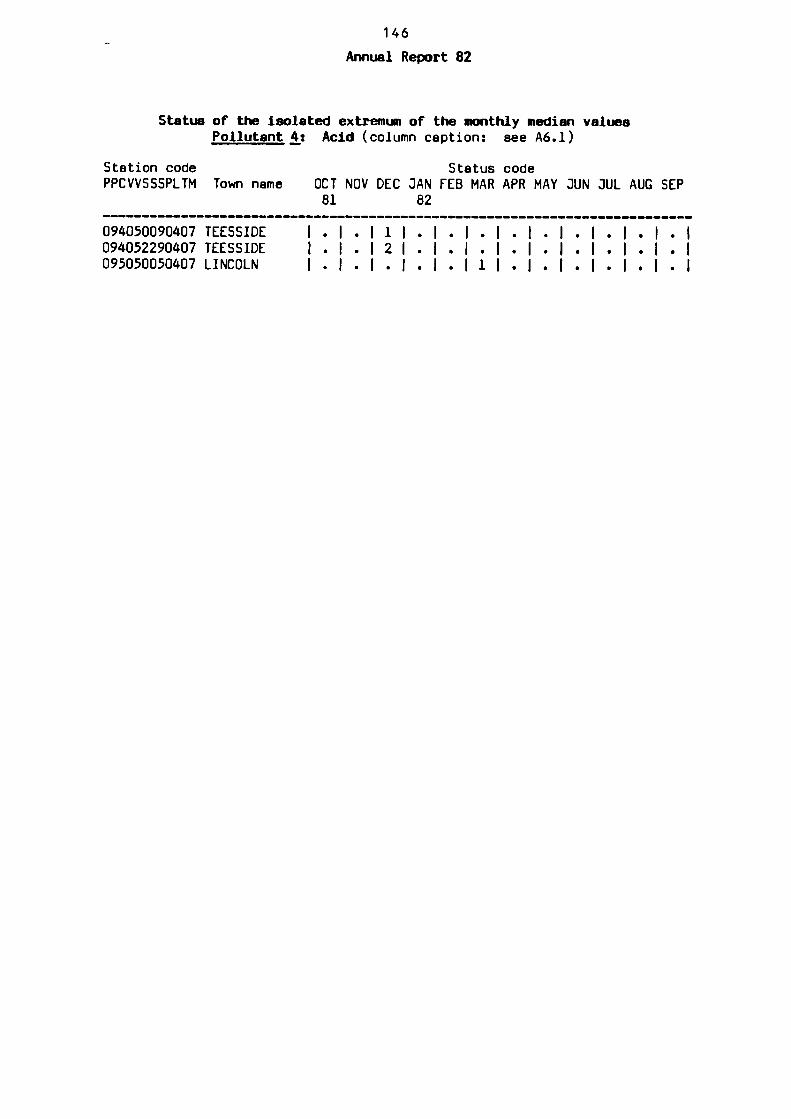
146 Annual Report 82
Statue of the isolated extremum of the monthly median values Pollutant 4: Acid (column caption: see A6.1)
Station code Status code PPCVVSSSPLTM Town name OCT NOV DEC JAN FEB MAR APR MAY JUN JUL AUG SEP
81 82
094050090407 TEESSIDE I . I . I 1 I . I . I . I . I . I . | . | . | . | 094052290407 TEESSIDE I . I . I 2 I . I . I . | . | . | . | . | . | . | 095050050407 LINCOLN I . I . I . I . I . I 1 I . I . I . I . I . I . I

147 Annual Report 82
ABBREVIATED DESCRIPTIVE TABLES
(based on Commission file TSA)

148 Annuel Report 82
POLLUTANTS (PL) 01 502 02 SMOKE 03 SPM 04 ACID 19 LEAD 28 CADMIUM COUNTRY (PP) 01 BELGIQUE - BELGIE 02 BUNDESREPUBLIK DEUTSCHLAND 03 DANMARK 04 FRANCE 05 IRELAND 06 ITALIA 07 LUXEMBOURG 08 NEDERLAND 09 UNITED KINGDOM 11 GREECE CLASS 0£ TOWN (C) 1 >2 M 2 1-2 M 3 0.5-1 M 4 0.1-0.5 M 5 <0.1 M 6 <0.01 M
COUNTRY/CLASS OF TOWN/TOWN (PPCVV) Numeric order
01201 BRUXELLES 01301 ANTWERPEN 01401 CHARLEROI 01402 GENT 01403 LIEGE 01501 BRUGGE 01502 KORTRIJK 01503 LIBRAMONT 01504 NAMUR 01699 SITES DE FOND 01701 ST.COMP.LOCALES 01702 O.M.S./G.E.M.S. 01703 PILOT CITIES STUDY 01704 CCE INTERCOMP.PART.
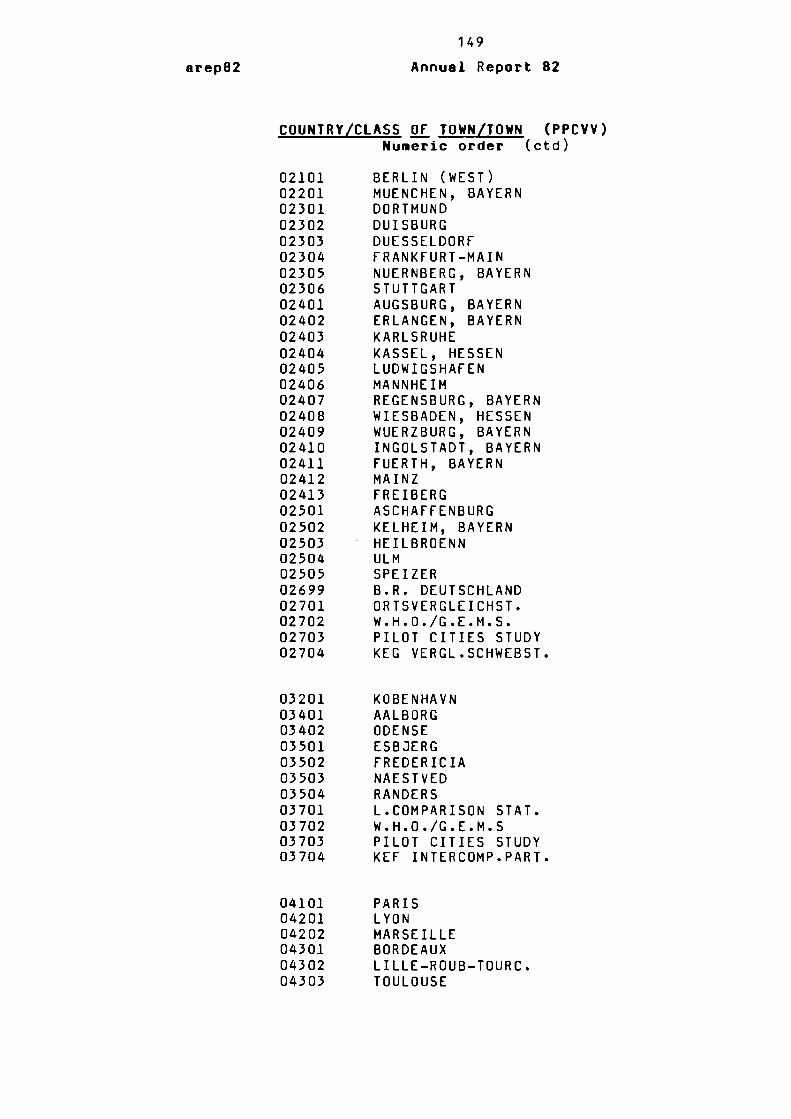
149 arep82 Annual Report 82
COUNTRY/CLASS OF TOWN/TOWN (PPCVV) Numeric order (ctd)
02101 BERLIN (WEST) 02201 MUENCHEN, BAYERN 02301 DORTMUND 02302 DUISBURG 02303 DUESSELDORF 02304 FRANKFURT-MAIN 02305 NUERNBERG, BAYERN 02306 STUTTGART 02401 AUGSBURG, BAYERN 02402 ERLANGEN, BAYERN 02403 KARLSRUHE 02404 KASSEL, HESSEN 02405 LUDWIGSHAFEN 02406 MANNHEIM 02407 REGENSBURG, BAYERN 02408 WIESBADEN, HESSEN 02409 WUERZBURG, BAYERN 02410 INGOLSTADT, BAYERN 02411 FUERTH, BAYERN 02412 MAINZ 02413 FREIBERG 02501 ASCHAFFENBURG 02502 KELHEIM, BAYERN 02503 HEILBROENN 02504 ULM 02505 SPEIZER 02699 B.R. DEUTSCHLAND 02701 ORTSVERGLEICHST. 02702 W.H.O./G.E.M.S. 02703 PILOT CITIES STUDY 02704 KEG VERGL.SCHWEBST.
03201 KOBENHAVN 03401 AALBORG 03402 ODENSE 03501 ESBJERG 03502 FREDERICIA 03503 NAESTVED 03504 RANDERS 03701 L.COMPARISON STAT. 03702 W.H.O./G.E.M.S 03703 PILOT CITIES STUDY 03704 KEF INTERCOMP.PART.
04101 PARIS 04201 LYON 04202 MARSEILLE 04301 BORDEAUX 04302 LILLE-ROUB-TOURC. 04303 TOULOUSE

150 Annual Report 82
COUNTRY/CLASS OF TOWN/TOWN (PPCVV) Numeric order (ctd)
04401 CLERMONT-FERRAND 04402 LE HAVRE 04403 NANTES 04404 ROUEN 04405 STRASBOURG 04501 CALAIS 04502 MARTIGUES 04503 VIGNEUX DE BRETAGNE 04699 SITE DU FOND 04701 STAT.COMPAR.LOCALES 04702 O.M.S./G.E.M.S. 04703 PILOT CITIES STUDY 04704 CCE INTERCOMP.PART.
05301 DUBLIN 05401 CORK 05501 GALWAY 05502 CORK COUNTY COUNCIL 05699 BACKGROUND SITES 05701 LOC.COMP.STATIONS 05702 W.H.O./G.E.M.S. 05703 PILOT CITIES STUDY 05704 CEC INTERCOMP.SPM
06101 MILANO 06102 ROMA 06201 TORINO 06302 GENOVA 06401 ANCONA 06402 BARI 06403 BOLOGNA 06404 BOLZANO 06405 LA SPEZIA 06406 MODENA 06407 PADOVA 06408 PESCARA 06409 PIACENZA 06410 TERNI 06411 TRIESTE 06412 VENEZIA 06413 VERONA 06414 FERRARA 06501 AOSTA 06502 ASCOLI PICENO 06503 ASTI 06504 BELLUNO 06505 CREMONA 06506 CUNEO 06507 GELA

151 Annual Report 82
COUNTRY/CLASS OF TOWN/TOWN (PPCVV)
06508 06509 06510 06511 06512 06513 06514 06515 06516 06517 06518 06519 06520 06521 06699 06701 06702 06703 06704
07501 07502 07503 07699 07701 07702 07703 07704
08301 08302 08303 08401 08402 08403 08404 08501 08502 08503 08504 08505 08506 08699 08701 08702 08703 08704
Numeric order (ct MACERATA PISTOIA ROVIGO SASSARI TARANTO TRENTO VERCELLI POMEZIA CIVITAVECCHIA M0NTER0T0ND0 GUIDONIA TIVOLI COLLEFERRO NETTUNO POSTI DI SFONDO STAZ.DI CONFR.LOC. O.M.S./G.E.M.S. PILOT CITIES STUDY CCE CONFRONTO PART.
LUXEMBOURG-V ESCH-SUR-ALZETTE STEINFORT SITE DE FOND STAT.COMP. LOCALES O.M.S./G.E.M.S. PILOT CITIES STUDY CCE INTERCOMP PART.
AMSTERDAM DEN HAAG ROTTERDAM ENSCHEDE GRONINGEN TILBURG UTRECHT BUSSUM DEN BOSCH HILVERSUM MAASTRICHT MIDDELBURG ZWOLLE LIG.ACHTERGRONDMET, LOC.COMP.STATIONS W.H.O./G.E.M.S. PILOT CITIES STUDY CEG INT.PROG.PART.

152 Annual Report 82
COUNTRY/CLASS OF TOWN/TOWN (PPCVV) Numeric order (ctd)
09101 LONDON G 09102 MANCHESTER G 09103 W.MIDL.CONURBATION 09201 GLASGOW+SURROUNDINGS 09202 MERSEYSIDE CONURB. 09301 LEEDS 09302 SHEFFIELD 09303 TYNESIDE 09401 BELFAST 09402 CARDIFF 09403 EDINBURGH 09404 PORTSMOUTH 09405 TEESSIDE 09501 . BARNSLEY 09502 BATH 09503 BEDFORD 09504 EXETER 09505 LINCOLN 09699 BACKGR.SITES FOR U.K 09701 LOC.COMP.STATIONS 09702 W.H.O./G.E.M.S. 09703 PILOT CITIES STUDY 09704 CEC INTERCOMP.PART.
11101 ATHENS 11301 THESSALONIKI 11501 MEGALOPOLI 11502 PTOLEMAIDA

153 Annual Report 82
COUNTRY/CLASS OF TOWN/TOWN (PPCVV) Alphabetical order
03401 AALBORG 08301 AMSTERDAM 06401 ANCONA 01301 ANTWERPEN 06501 AOSTA 02501 ASCHAFFENBURG 06502 ASCOLI PICENO 06503 ASTI 11101 ATHENS 02401 AUGSBURG, BAYERN 02699 B.R. DEUTSCHLAND 09699 BACKGR.SITES FOR U.K 05699 BACKGROUND SITES 06402 BARI 09501 BARNSLEY 09502 BATH 09503 BEDFORD 09401 BELFAST 06504 BELLUNO 02101 BERLIN (WEST) 06403 BOLOGNA 06404 BOLZANO 04301 BORDEAUX 01501 BRUGGE 01201 BRUXELLES 08501 BUSSUM 04501 CALAIS 09402 CARDIFF 06704 CCE CONFRONTO PART. 07704 CCE INTERCOMP PART. 01704 CCE INTERCOMP.PART. 04704 CCE INTERCOMP.PART. 09704 CEC INTERCOMP.PART. 05704 CEC INTERCOMP.SPM 08704 CEG INT.PROG.PART. 01401 CHARLEROI 06516 CIVITAVECCHIA 04401 CLERMONT-FERRAND 06520 COLLEFERRO 05401 CORK 05502 CORK COUNTY COUNCIL 06505 CREMONA 06506 CUNEO 08502 DEN BOSCH 08302 DEN HAAG 02301 DORTMUND 05301 DUBLIN 02303 DUESSELDORF 02302 DUISBURG 09403 EDINBURGH 08401 ENSCHEDE 02402 ERLANGEN, BAYERN

154 Annuel Report 82
COUNTRY/CLASS OF TOWN/TOWN (PPCVV) Alphabetical order(ctd)
03501 ESBJERG 07502 ESCH-SUR-ALZETTE 09504 EXETER 06414 FERRARA 02304 FRANKFURT-MAIN 03502 FREDERICIA 02413 FREIBERG 02411 FUERTH, BAYERN 05501 GALWAY 06507 GELA 06302 GENOVA 01402 GENT 09201 GLASGOW+SURROUNDINGS 08402 GRONINGEN 06518 GUIDONIA 02503 HEILBROENN 08503 HILVERSUM 02410 INGOLSTADT, BAYERN 02403 KARLSRUHE 02404 KASSEL, HESSEN 03704 KEF INTERCOMP.PART. 02704 KEG VERGL. SCHWEBST. 02502 KELHEIM, BAYERN 03201 KOBENHAVN 01502 KORTRIJK 03701 L.COMPARISON STAT. 06405 LA SPEZIA 04402 LE HAVRE 09301 LEEDS 01503 LIBRAMONT 01403 LIEGE 08699 LIG.ACHTERGRONDMET. 04302 LILLE-ROUB-TOURC. 09505 LINCOLN 05701 LOC.COMP.STATIONS 08701 LOC.COMP.STATIONS 09701 LOC.COMP.STATIONS 09101 LONDON G 02405 LUDWIGSHAFEN 07501 LUXEMBOURG-V 04201 LYON 08504 MAASTRICHT 06508 MACERATA 02412 MAINZ 09102 MANCHESTER G 02406 MANNHEIM 04202 MARSEILLE 04502 MARTIGUES 11501 MEGALOPOLI 09202 MERSEYSIDE CONURB. 08505 MIDDELBURG 06101 MILANO

155 Annual Report 82
COUNTRY/CLASS OF TOWN/TOWN (PPCVV) Alphabetical order (ctd)
06406 MODENA 06517 M0NTER0T0ND0 02201 MUENCHEN, BAYERN 03503 NAESTVED 01504 NAMUR 04403 NANTES 06521 NETTUNO 02305 NUERNBERG, BAYERN 01702 O.M.S./G.E.M.S. 04702 O.M.S./G.E.M.S. 06702 O.M.S./G.E.M.S. 07702 O.M.S./G.E.M.S. 03402 ODENSE 02701 ORTSVERGLEICHST. 06407 PADOVA 04101 PARIS 06408 PESCARA 06409 PIACENZA 01703 PILOT CITIES STUDY 02703 PILOT CITIES STUDY 03703 PILOT CITIES STUDY 04703 PILOT CITIES STUDY 05703 PILOT CITIES STUDY 06703 PILOT CITIES STUDY 07703 PILOT CITIES STUDY 08703 PILOT CITIES STUDY 09703 PILOT CITIES STUDY 06509 PISTOIA 06515 POMEZIA 09404 PORTSMOUTH 06699 POSTI DI SFONDO 11502 PTOLEMAIDA 03504 RANDERS 02407 REGENSBURG, BAYERN 06102 ROMA 08303 ROTTERDAM 04404 ROUEN 06510 ROVIGO 06511 SASSARI 09302 SHEFFIELD 07699 SITE DE FOND 04699 SITE DU FOND 01699 SITES DE FOND 02505 SPEIZER 01701 ST.COMP.LOCALES 07701 STAT.COMP. LOCALES 04701 STAT.COMPAR.LOCALES 06701 STAZ.DI CONFR.LOC. 07503 STEINFORT 04405 STRASBOURG 02306 STUTTGART 06512 TARANTO

156 Annual Report 82
COUNTRY/CLASS OF TOWN/TOWN (PPCVV) Alphabetical order (ctd)
09405 TEESSIDE 06410 TERNI 11301 THESSALONIKI 08403 TILBURG 06519 TIVOLI 06201 TORINO 04303 TOULOUSE 06513 TRENTO 06411 TRIESTE 09303 TYNESIDE 02504 ULM 08404 UTRECHT 06412 VENEZIA 06514 VERCELLI 06413 VERONA 04503 VIGNEUX DE BRETAGNE 03702 W.H.O./G.E.M.S 02702 W.H.O./G.E.M.S. 05702 W.H.O./G.E.M.S. 08702 W.H.O./G.E.M.S. 09702 W.H.O./G.E.M.S. 09103 W.MIDL.CONURBATION 02408 WIESBADEN, HESSEN 02409 WUERZBURG, BAYERN 08506 ZWOLLE

i l i u m n u n in im 11 im II