Embed Size (px)
Citation preview
Excel ChartsSowmya Devaraja
CS101 – Section 08 & 10
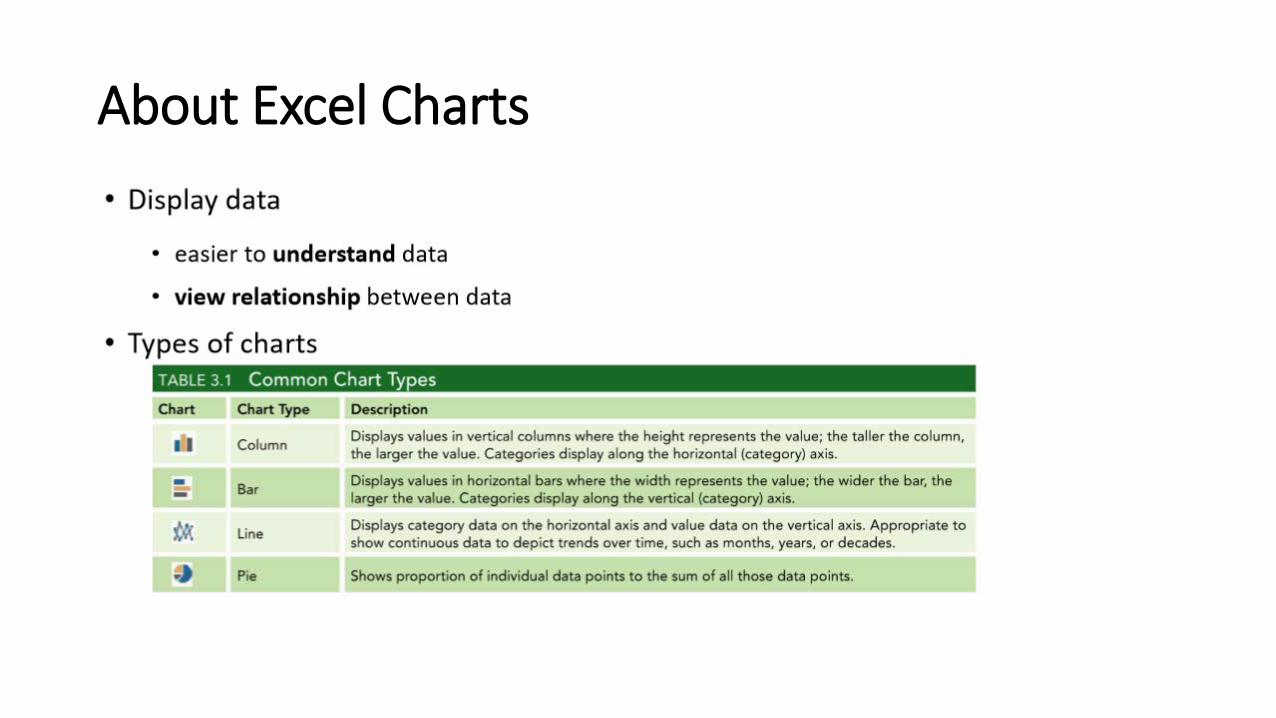
About Excel Charts
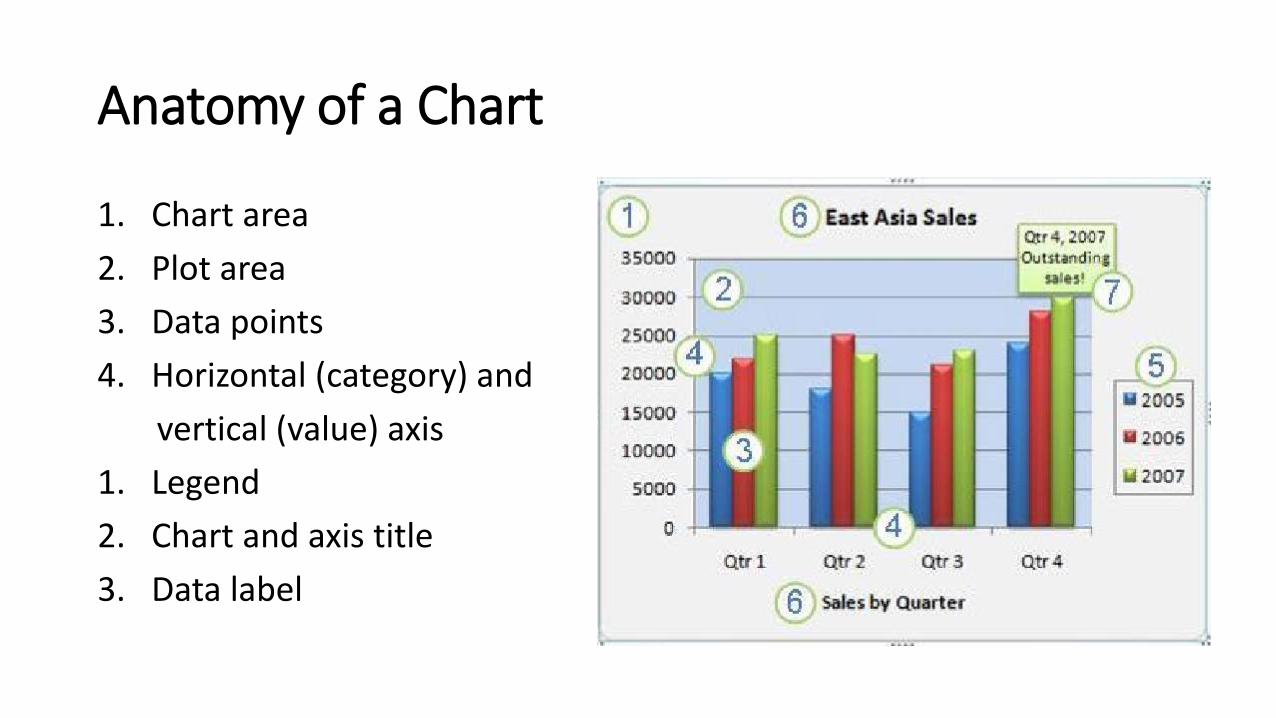
Anatomy of a Chart
1. Chart area 2. Plot area3. Data points4. Horizontal (category) and
vertical (value) axis1. Legend2. Chart and axis title3. Data label
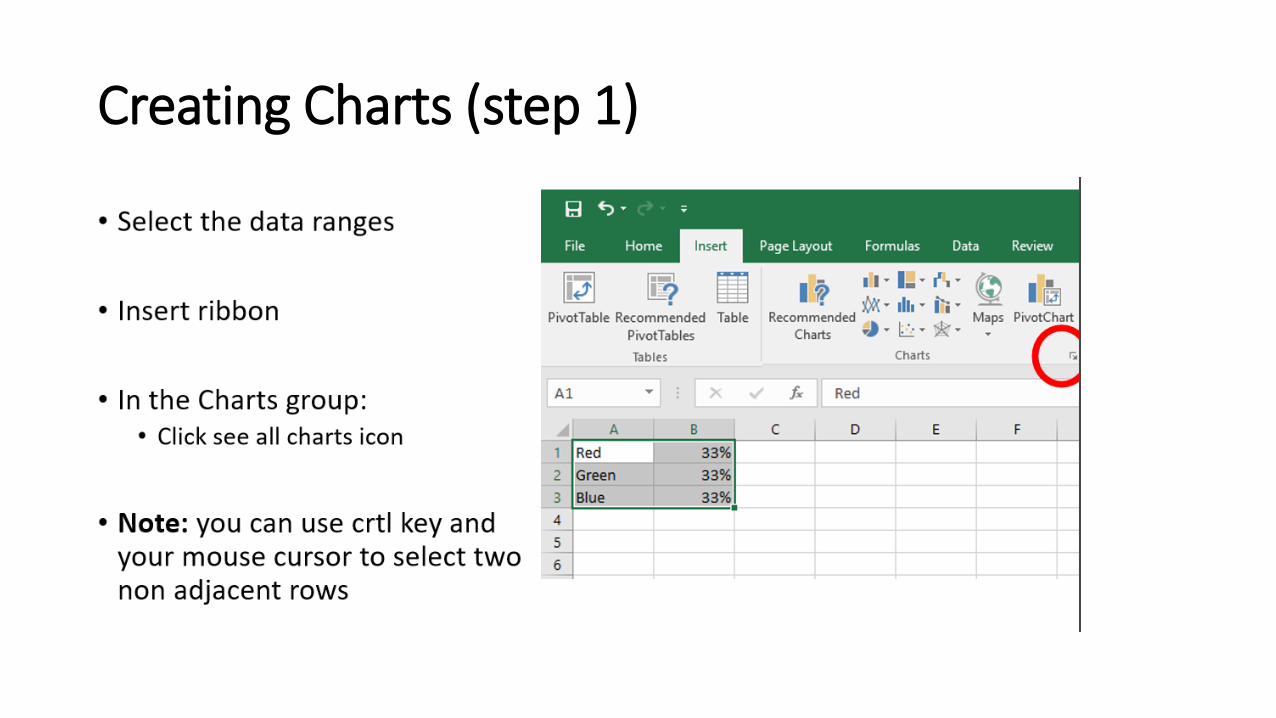
Creating Charts (step 1)
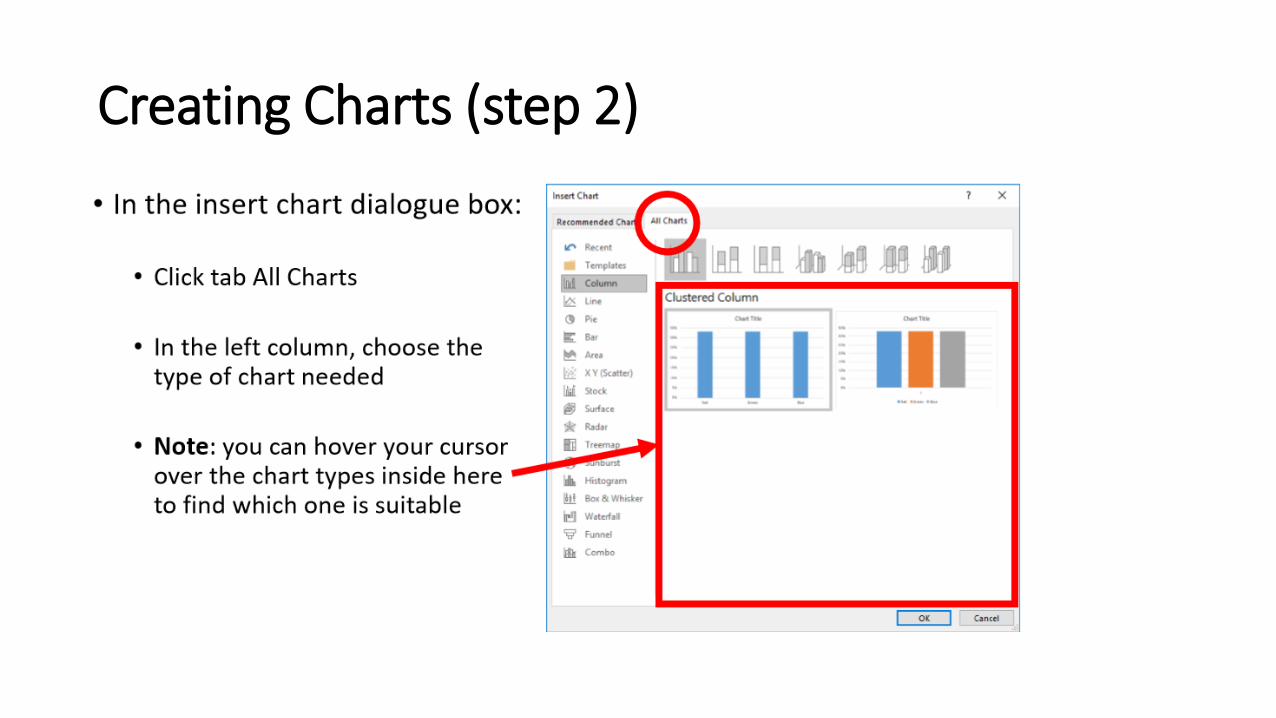
Creating Charts (step 2)

Creating Charts (step 3)

Modifying Charts
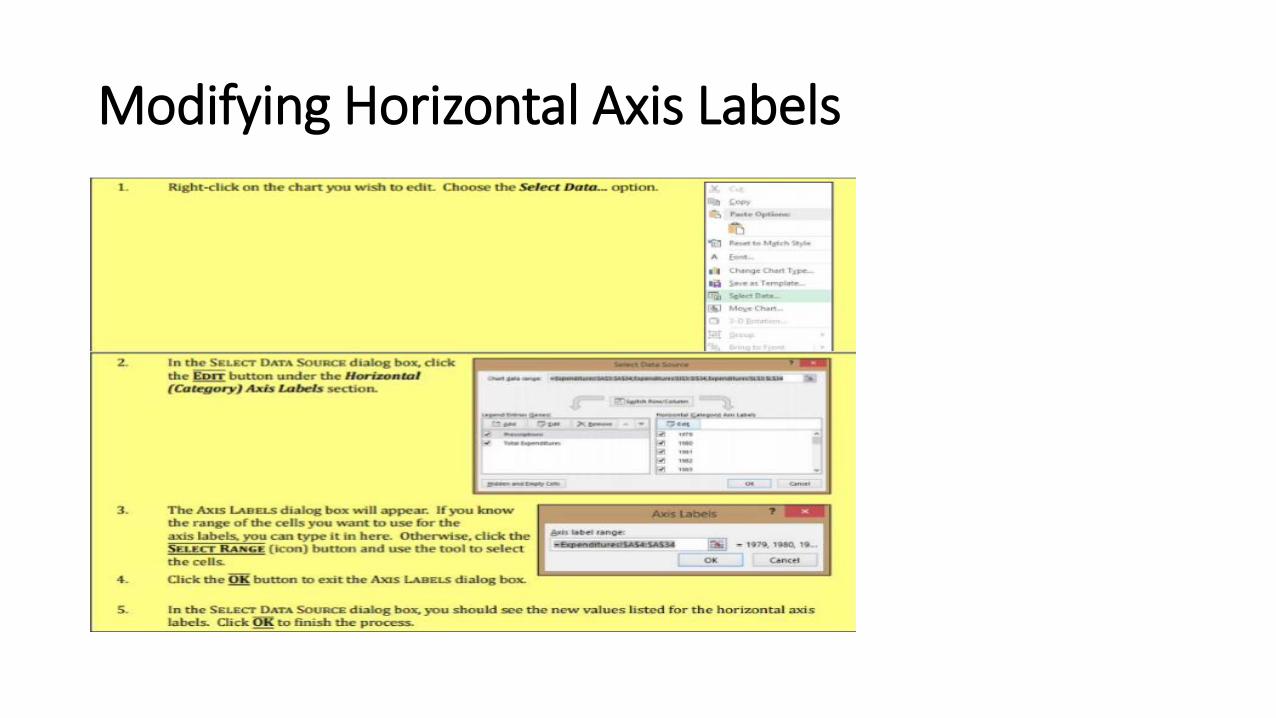
Modifying Horizontal Axis Labels
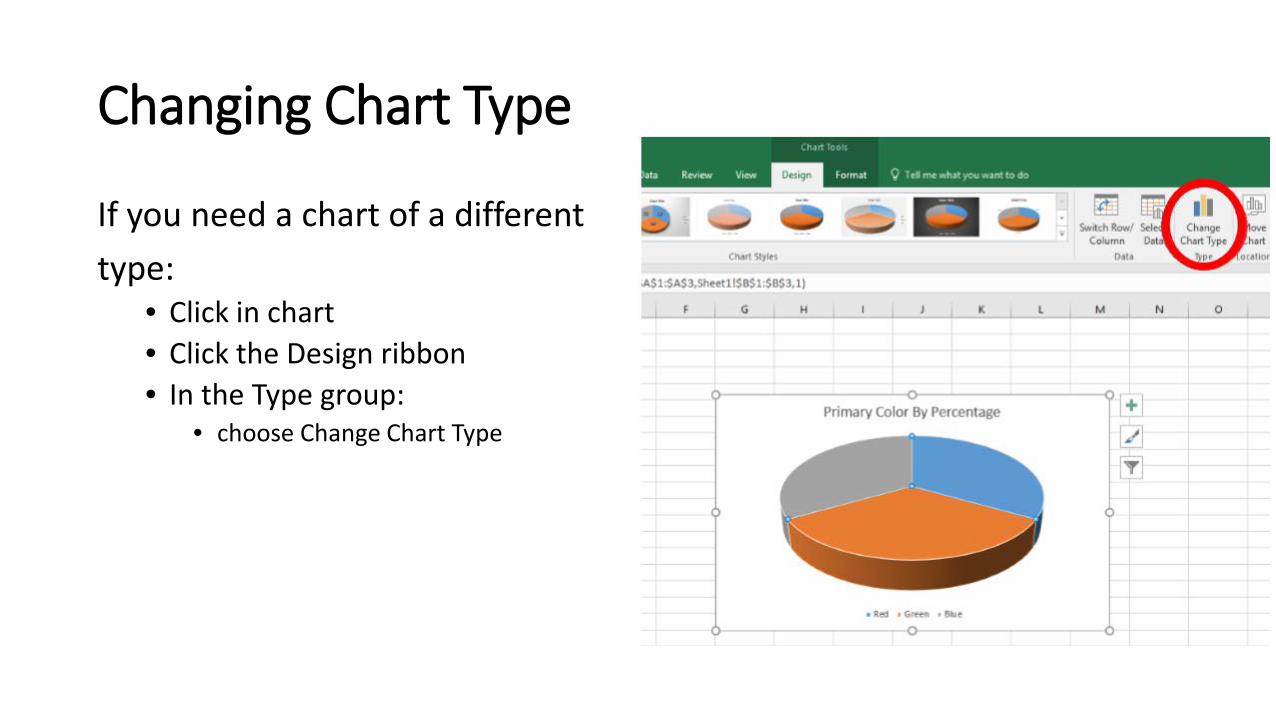
Changing Chart Type
If you need a chart of a different type:
• Click in chart • Click the Design ribbon • In the Type group:
• choose Change Chart Type
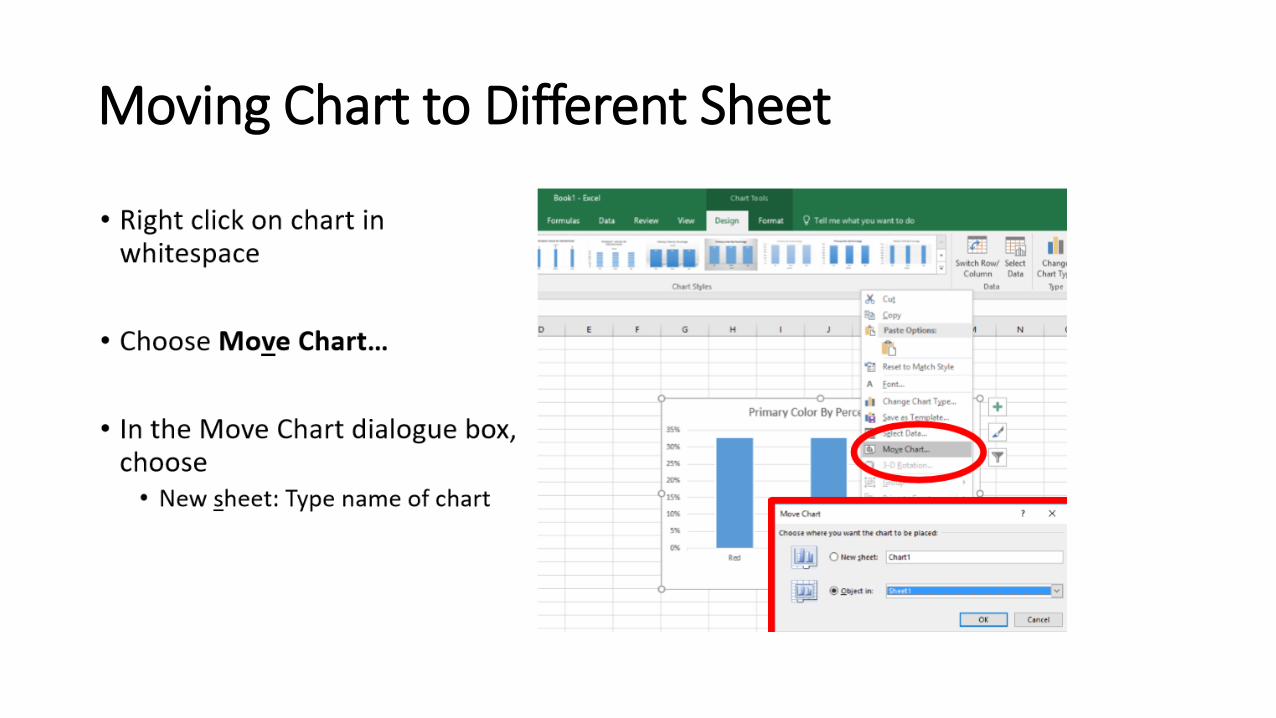
Moving Chart to Different Sheet

Adding A Trendline
• Click on the chart
• Click Add Chart ElementButton ( + )
• From the chart elements, choose Trendline

Project Trendline Forward
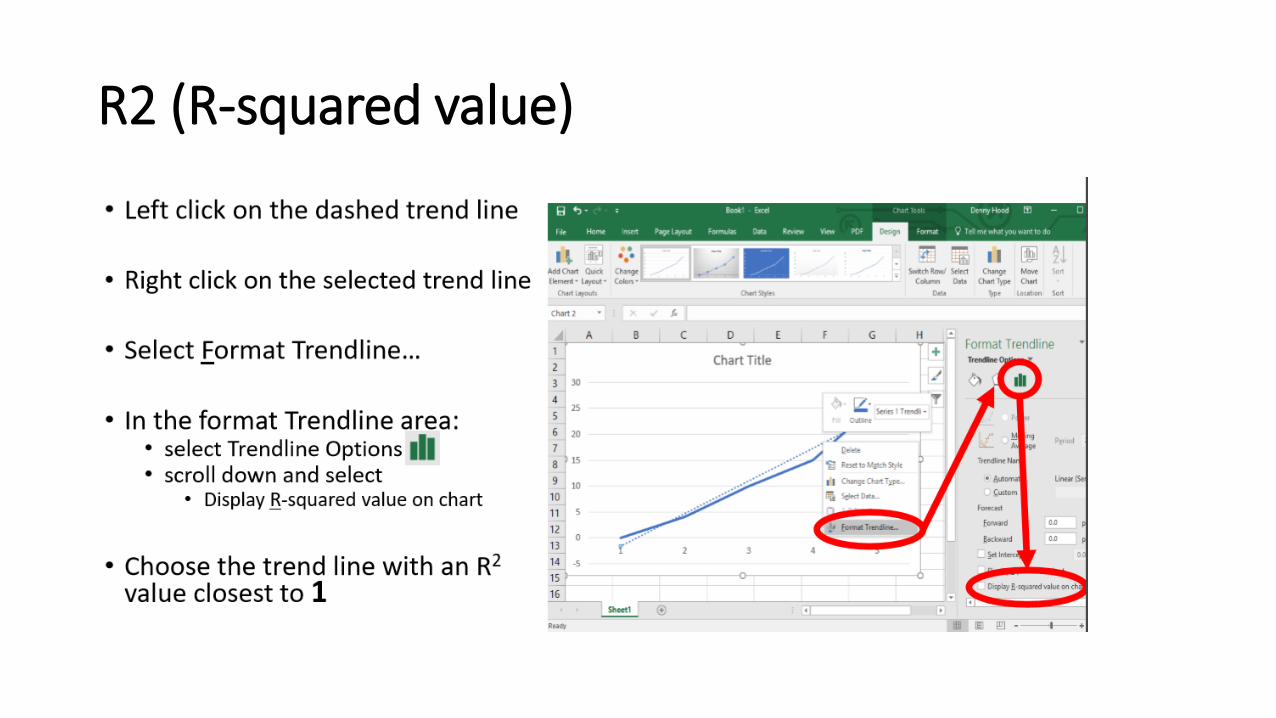
R2 (R-squared value)
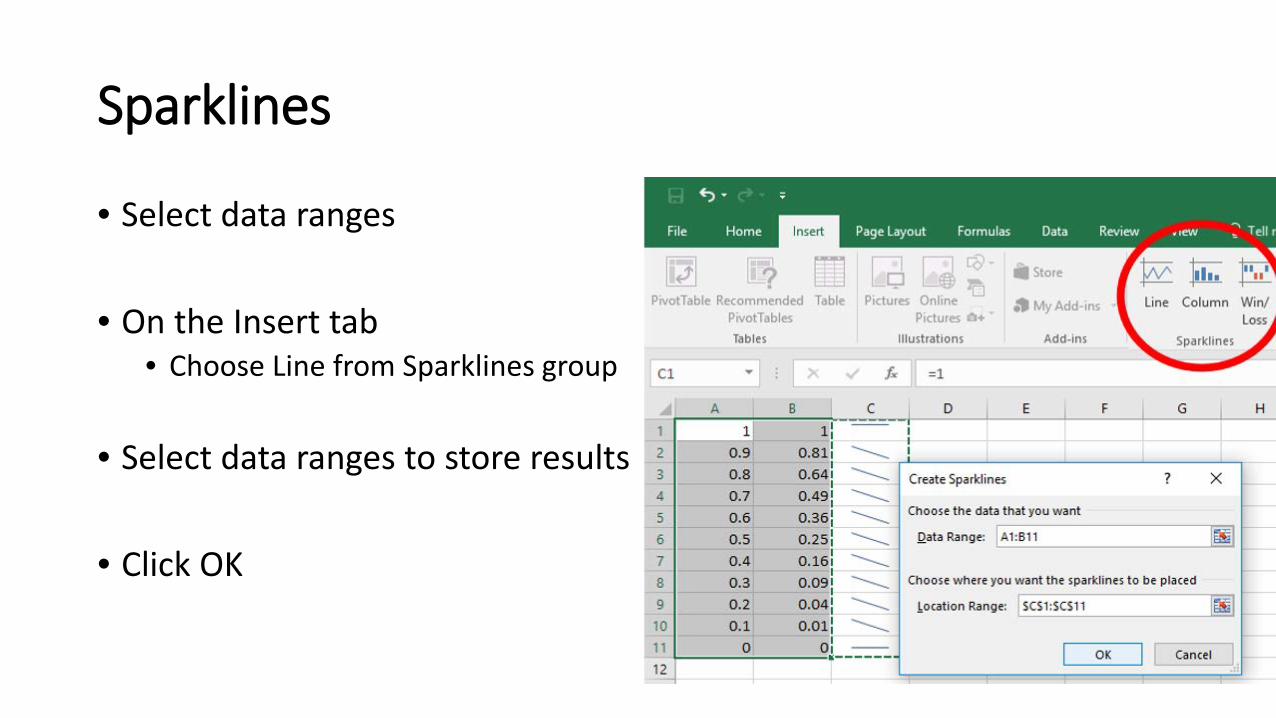
Sparklines
• Select data ranges
• On the Insert tab • Choose Line from Sparklines group
• Select data ranges to store results
• Click OK