Embed Size (px)
Citation preview

CONTROL ICONS User Guide
Copyright © 2018 Honeywell Inc. • All Rights Reserved EN2Z-0940GE51 R0518

EN2Z-0940GE51 R0518
EN2Z-0940GE51 R0518
Control Icons V. 10.08.01
USER GUIDE Software License Advisory This document supports software that is proprietary to Honeywell Inc. and/or to
third party software vendors. Before software delivery, the end user must execute a software license agreement that governs software use. Software license agreement provisions include limiting use of the software to equipment furnished, limiting copying, preserving confidentiality, and prohibiting transfer to a third party. Disclosure, use, or reproduction beyond that permitted in the license agreement is prohibited.


CONTROL ICONS CONTENTS
5 EN2Z-0940GE51 R0518
CONTENTS
INTRODUCTION ....................................................................................................................................................................... 9 Applicable Literature ............................................................................................ 10 Control Icon Operation ........................................................................................ 11 Control Icon Table ............................................................................................... 12 Control Icon Table (Falcon / Eagle) ..................................................................... 14 General................................................................................................................ 19
ALPHABETIC REFERENCE .................................................................................................................................................... 21 Absolute (Falcon / Eagle) .................................................................................... 22 Addition / ADD ..................................................................................................... 22 ADH2 (Falcon / Eagle)......................................................................................... 23 Analog Switch / SWI ............................................................................................ 24 AND (Falcon / Eagle) .......................................................................................... 25 Arcus Cosinus (Falcon / Eagle) ........................................................................... 25 Arcus Sinus (Falcon / Eagle) ............................................................................... 25 Arcus Tangens (Falcon / Eagle) .......................................................................... 26 Average / AVR ..................................................................................................... 26 Cascade / CAS .................................................................................................... 27 Cascade Plus / CAS ............................................................................................ 31 Changeover Switch / CHA ................................................................................... 34 Compare 2 (Eagle) .............................................................................................. 35 Comparison (Falcon / Eagle) ............................................................................... 35 Cosinus (Falcon / Eagle) ..................................................................................... 36 Counter (Falcon / Eagle) ..................................................................................... 36 Cycle / CYC ......................................................................................................... 37 Data Transfer / IDT .............................................................................................. 39 Decimal Places (Falcon / Eagle) ......................................................................... 41 Delay (Falcon / Eagle) ......................................................................................... 41 Dewpoint (Falcon / Eagle) ................................................................................... 42 Differential (Falcon / Eagle) ................................................................................. 43 Digital Switch / 2PT / Hysteresis (Falcon / Eagle) ............................................... 43 Division (Falcon / Eagle)...................................................................................... 47 Duty Cycle / DUC ................................................................................................ 48 Economizer / ECO ............................................................................................... 55 EQL (Falcon / Eagle) ........................................................................................... 66 Event Counter / EVC ........................................................................................... 67 Exponential (Falcon / Eagle) ............................................................................... 67 Factorial (Falcon / Eagle) .................................................................................... 68 Fixed Applications (XFM) .................................................................................... 68
ENHANCED PID ............................................................................................. 70 ENTHALPY ...................................................................................................... 74 FLOW CALCULATION .................................................................................... 74 LEAD-LAG ....................................................................................................... 77 Power Demand Control XFMs ......................................................................... 78 RATIO .............................................................................................................. 84 Totalizer XFM .................................................................................................. 85 UP-DOWN RAMP ............................................................................................ 87 XFM 35 Description ......................................................................................... 88
Priority Groups and their Switching Behavior .............................................. 92 XFM 35 Algorithms ..................................................................................... 93 XFM 35 General Functions ......................................................................... 99
XFM 36-1 Description ...................................................................................... 103 Automatic Load Switch-On after Maximum OFF Time Expiration ............... 107 RM Functions .............................................................................................. 107 XFM 36-1 General Functions ...................................................................... 108 XFM 36-1 Priority Group Assignment ......................................................... 109 XFM 36-1/S/R Switching Behavior .............................................................. 109 XFM 36-1/S Sequential Load Switching ...................................................... 110 FM 36-1/R Rotational Load Switching ......................................................... 112
HC (Falcon / Eagle) ............................................................................................. 114 Heating Curve with Adaptation / HCA ................................................................. 115 Humidity and Enthalpy / H,X ................................................................................ 118 Integral (Falcon / Eagle) ...................................................................................... 120 J-K Flip Flop (Eagle) ............................................................................................ 121 Last Value (Eagle) ............................................................................................... 121

CONTENTS CONTROL ICONS
EN2Z-0940GE51 R0518 286
Limit (Falcon / Eagle) ........................................................................................... 122 Linear Converter (Eagle) ...................................................................................... 122 Ln (Falcon/Eagle) ................................................................................................. 123 Logic Counter (Falcon / Eagle) ............................................................................. 123 Mathematical Editor / MAT ................................................................................... 123
Connection of the MAT Icon to a Control Icon ................................................. 125 Differential Function (DIFT) Dialog Box ........................................................... 125 Formula Entry Procedure ................................................................................ 127 Integral Function (INTEG) Dialog Box ............................................................. 131 LINEAR Dialog Box ......................................................................................... 133 Polynomial Equation (POL) Dialog Box ........................................................... 135
Maximum / MAX ................................................................................................... 137 Merge (Falcon / Eagle) ......................................................................................... 138 Minimum / MIN ..................................................................................................... 139 Monoflop (Falcon / Eagle) .................................................................................... 140 Modulo (Falcon / Eagle) ....................................................................................... 140 Multi-Switch In (Falcon / Eagle) ............................................................................ 141 Multi-Switch Out (Falcon / Eagle) ......................................................................... 141 Multiplication (Falcon / Eagle) .............................................................................. 142 Negate (Falcon / Eagle) ....................................................................................... 142 Next Schedule (Eagle) ......................................................................................... 142 Ln (Falcon/Eagle) ................................................................................................. 143 Night Purge / NIPU ............................................................................................... 143 NOT (Falcon / Eagle) ........................................................................................... 146 Odd Parity (Falcon / Eagle) .................................................................................. 147 On-Board DI (Falcon / Eagle) ............................................................................... 147 On-Board DO (Falcon / Eagle) ............................................................................. 147 On/Off Delay (Falcon / Eagle) .............................................................................. 148 Optimum Start/Stop / EOH ................................................................................... 149 Optimum Start/Stop / EOH3 ................................................................................. 163 Optimum Start/Stop Energy Optimized Ventilation / EOV .................................... 180 OR (Falcon / Eagle) ............................................................................................. 189 PID Controller / PID .............................................................................................. 190
PID Operation .................................................................................................. 195 PID Plus Controller / PID ...................................................................................... 197 Random (Falcon / Eagle) ..................................................................................... 203 Ratio / RAMP ....................................................................................................... 203 Read Global Reg. (Eagle) .................................................................................... 207 Read Priority (Eagle) ............................................................................................ 208 Read Priority Value (Eagle) .................................................................................. 208 Read / RIA............................................................................................................ 209 Reset Timer (Falcon / Eagle) ............................................................................... 212 Round (Falcon / Eagle) ........................................................................................ 212 Round down (Falcon / Eagle) ............................................................................... 213 Round up (Falcon / Eagle) ................................................................................... 213 RS flip-flop (Falcon / Eagle) ................................................................................. 213 Sequence / SEQ .................................................................................................. 214 SET (Falcon / Eagle) ............................................................................................ 222 Sinus (Falcon / Eagle) .......................................................................................... 223 Split (Falcon / Eagle) ............................................................................................ 223 Square Root (Falcon / Eagle) ............................................................................... 224 Subtract / DIF ....................................................................................................... 225 Switching Table (Falcon / Eagle) .......................................................................... 226 Tangens (Falcon / Eagle) ..................................................................................... 227 Time Counter (Falcon / Eagle) ............................................................................. 228 Timer Value (Falcon / Eagle)................................................................................ 228 Truncate (Falcon / Eagle) ..................................................................................... 229 Tuncos (Falcon / Eagle) ....................................................................................... 229 Value Ramp (Falcon / Eagle) ............................................................................... 229 Value Ramp2 (Eagle) ........................................................................................... 231 WIDO (Falcon / Eagle) ......................................................................................... 231 Write Global Reg. (Eagle) .................................................................................... 231 Write Priority (Eagle) ............................................................................................ 232 Write / WIA ........................................................................................................... 233 X root Y (Falcon / Eagle) ...................................................................................... 237 X^2 (Falcon / Eagle) ............................................................................................. 237 X^Y (Falcon / Eagle) ............................................................................................ 238 XOR Table (Falcon / Eagle) ................................................................................. 238 Zero Energy Band / ZEB ...................................................................................... 238

CONTROL ICONS CONTENTS
7 EN2Z-0940GE51 R0518
Examples .................................................................................................................................................................................. 246 Attenuator ............................................................................................................ 248 Average Value Calculation .................................................................................. 249 Floating Limits and Alarm Suppression ............................................................... 253 Operating Pump Switchover ................................................................................ 259 Optimized Start/Stop ........................................................................................... 263 Positioning Signal Limitation ................................................................................ 264 Setpoint Adjustments .......................................................................................... 267 System Regulation .............................................................................................. 270 Trend Buffer Control ............................................................................................ 272
Appendix A: Parameter List Description ............................................................................................................................... 275
Appendix B: Startup User Address........................................................................................................................................ 278
Index ......................................................................................................................................................................................... 283

CONTENTS CONTROL ICONS
EN2Z-0940GE51 R0518 286
CONTROL ICONS
9 EN2Z-0940GE51 R0518
INTRODUCTION
Purpose This manual provides descriptions and application examples for control icons in Excel Computer Aided Regulation Engineering (CARE) software. You use control icons in the CARE Control Strategy function.
The control strategy for a plant consists of control loops that monitor the environment and adjust equipment operation to maintain comfort levels. For example, a control loop for an air handling system can turn on a return air fan when discharge air temperature in the return air duct is greater than or equal to 68F (20C).
Control loops consist of a series of “control icons” that dictate a sequence of events. Control icons provide preprogrammed functions and algorithms to implement sequences of control in a plant schematic. Examples of control icons include a Proportional-Integral-Derivative (PID) function and a Maximum function (MAX).
Assumptions This manual assumes you are familiar with the CARE process, especially the control
strategy and switching logic functions. See Excel CARE User Guide EN2Z-0937GE51 for details and procedures for the control strategy and switching logic functions.
Temperature Differentials In the English measurement system, degrees Fahrenheit (F) usually represent both
the temperature measure and the differential measure. Dialog boxes shown in this manual represent temperatures as °F and differentials as F Deg.
Manual Organization This manual contains the following chapters:
This Introduction lists other technical literature related to control icons, describes the dialog boxes related to control icon operation, and provides a table that summarizes the available control icons.
The Alphabetic Reference chapter describes each control icon. The beginning of the chapter summarizes the type of information provided for each icon.
The Examples chapter describes applications that combine more than one control icon to perform functions. These examples are in addition to the individual examples for each icon in the Alphabetic Reference chapter.
Appendix A: Parameter List Description provides information about the parameter list file generated by CARE when a plant is translated. This file documents the parameters used in the control icons and switching logic tables. It is useful during plant testing.
Appendix B: STARTUP User Address describes how the STARTUP user address works and how to use it in control applications.

INTRODUCTION CONTROL ICONS
EN2Z-0940GE51 R0518 286
Applicable Literature
Form No. Title EN2Z-0937 Excel CARE User Guide Detailed description of Excel CARE software EN2Z-0938 ASPECD Editor User Guide Provides functions to modify the user interface for Excel Operator Terminals EN2Z-0939 RACL Editor User Guide Graphical Editor for creation oft strategy logic programs for Excel 500 controllers
CONTROL ICONS INTRODUCTION
11 EN2Z-0940GE51 R0518
Control Icon Operation
Each control icon has an I/O dialog box that defines its input(s) and output(s). In addition, some control icons have an internal parameters dialog box that defines parameter values that govern the function of the control icon.
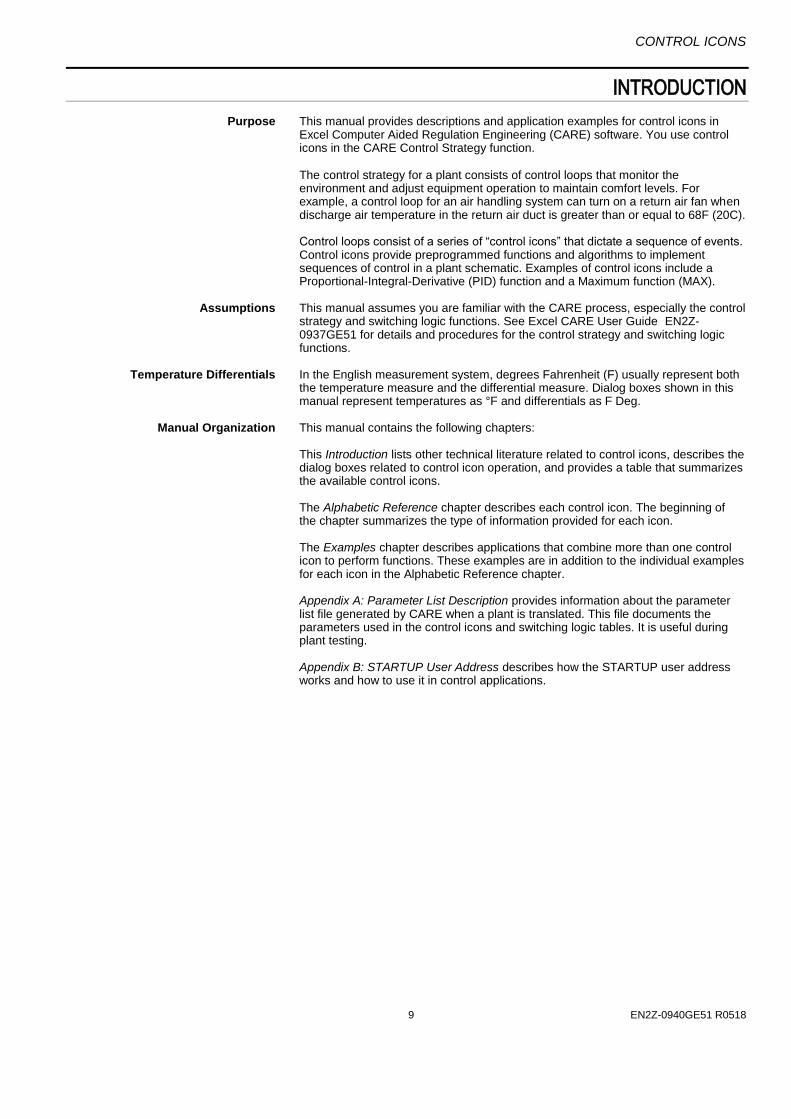
Internal Parameters Dialog Box When you first place a control icon in the Control Strategy work space, the internal
parameters dialog box, if any, displays. For example, for the PID icon, the following internal parameters dialog box displays:
There are always default values for the parameters. You can change any of the default values, as desired.
If you click Cancel, the dialog box closes and software does NOT place the control icon in the control strategy.
You can redisplay the internal parameters dialog box at any time by clicking the right-hand mouse button while the cursor is over the control icon in the control strategy.
I/O Dialog Box After you place the control icon (and close the internal parameters dialog box, if
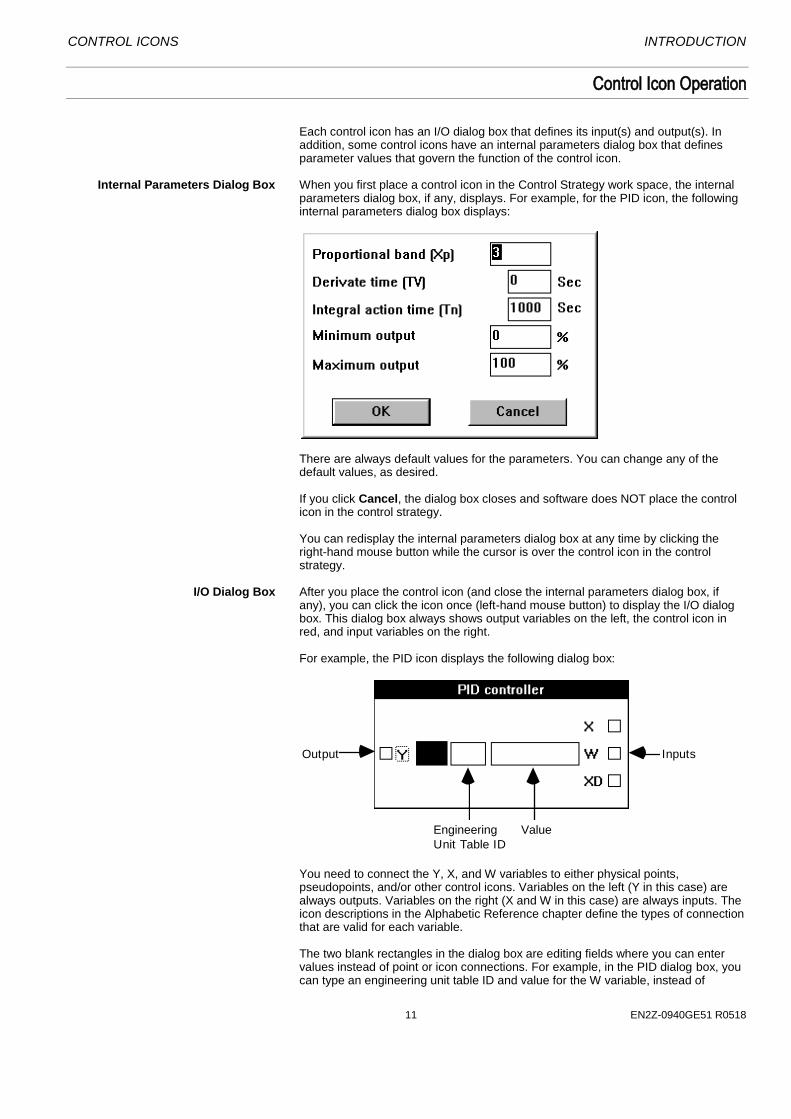
any), you can click the icon once (left-hand mouse button) to display the I/O dialog box. This dialog box always shows output variables on the left, the control icon in red, and input variables on the right.
For example, the PID icon displays the following dialog box:
Output
Engineering
Unit Table ID
Value
Inputs
You need to connect the Y, X, and W variables to either physical points, pseudopoints, and/or other control icons. Variables on the left (Y in this case) are always outputs. Variables on the right (X and W in this case) are always inputs. The icon descriptions in the Alphabetic Reference chapter define the types of connection that are valid for each variable.
The two blank rectangles in the dialog box are editing fields where you can enter values instead of point or icon connections. For example, in the PID dialog box, you can type an engineering unit table ID and value for the W variable, instead of

INTRODUCTION CONTROL ICONS
EN2Z-0940GE51 R0518 286
connecting W to a point or control icon. For engineering unit, enter the corresponding index number. Appendix E: Engineering Units in Excel CARE User Guide EN2Z-0937GE51 lists engineering units and their index numbers.
If a variable does not have editing fields next to it, you cannot type values for a connection; you must connect it to another icon or a point.
See Also Excel CARE User Guide EN2Z-0937GE51, Control Strategy chapter, for
procedures to place and connect control icons
Control Icon Table
This chapter lists icons alphabetically by function name and includes function names, symbols, and short descriptions. Function name is usually the same as the icon name. There are exceptions such as 2PT which is functionally a Digital Switch.
Function Name Control Icon Icon
Name Description
Add
ADD Sum multiple analog input values (2 through 6).
Analog Switch
SWI Switch an analog value depending on a digital value (for example, if digital is 0, analog is 2; if digital is 1, analog is 1).
Average
AVR Calculate the average of multiple analog inputs (2 through 6).
Cascade
CAS Cascade controller that acts as a PI controller with a master and cascade controller.
Cascade (with additional digital input and parameter registers)
CAS Same as previously defined Cascade controller with the addition of a digital input and two parameter registers.
Changeover Switch
CHA Depending on the value of a digital input, transmit an analog input value by way of one of two analog outputs.
Cycle
CYC Establish cyclical operation.
Data Transfer
IDT Transfer a value from one control icon to other icons or points.
Digital Switch
2PT On/off controller that transmits a digital status depending on two analog values (one is a controlled variable; the other, a reference variable).
Duty Cycle
DUC Switch HVAC systems on and off at variable intervals to save energy while maintaining room conditions.
Economizer
ECO Determine the most economical system operation for full and partial air conditioning systems.
Event Counter
EVC Event counter.
Fixed Applications
XFM Fixed applications that can combine with other submodules or points.
Heating Curve with Adaptation
HCA Use a heating curve to calculate discharge air temperature setpoint from the room temperature setpoint and outdoor air temperature.

CONTROL ICONS INTRODUCTION
13 EN2Z-0940GE51 R0518
Function Name Control Icon Icon
Name Description
Humidity and Enthalpy
H,X Calculate enthalpy and absolute humidity.
Mathematical Editor
MAT Mathematical editor to modify inputs to other control icons.
Maximum
MAX Select the highest value among analog inputs (2 through 6).
Minimum
MIN Select the lowest value among analog inputs (2 through 6).
Night Purge
NIPU Use cold outdoor air during non-working (nighttime) hours to precondition room space and save energy costs.
Optimum Start/Stop
EOH Calculate optimized values for starting and stopping heating system.
Optimum Start/Stop Energy Optimized Ventilation
EOV Calculate optimized values for starting and stopping air conditioning plants.
PID
PID Proportional-Integral-Derivative controller that regulates an analog output based on two analog values (one is a controlled variable; the other, a reference variable.)
PID (with integration time parameter)
PID Same as previously defined PID with the addition of an integration time parameter.
Ratio
RAMP Limit the variation in room temperature over time (“ramp” function).
Read
RIA Read an attribute of a user address.
Sequence
SEQ Sequence from one to three analog outputs dependent on an analog input.
Subtract
DIF Determine the difference between multiple analog input values (2 to 6; X1 - (X2 + X3 + ... X6)).
Write
WIA Write to an attribute of a user address.
Zero Energy Band
ZEB Determine setpoints to maintain a predetermined comfort band divided into heating, cooling, and zero energy bands.

INTRODUCTION CONTROL ICONS
EN2Z-0940GE51 R0518 286
Control Icon Table (Falcon / Eagle)
This chapter lists icons alphabetically by function name and includes function names, the previous function name, in which folder it can be found, and short descriptions. Function name is usually the same as the icon name.
Function Name Previous Function name Folder Description
Absolute Arithmetic Returns the absolute value.
Addition Add Arithmetic Sum up the input values.
ADH2 ADH2 Legacy XL500 Legacy RACL function: Adapts the slope S of the heating curve for the determination of the flow temperature setpoint to the building characteristics.
AND Logic AND output becomes TRUE(1) if all inputs are TRUE(1). NAND output is the inverted AND output.
Arcus Cosinus Arithmetic Calculates the arcus cosinus function of X.
Arcus Sinus Arithmetic Calculates the arcus sinus function of X.
Arcus Tangems Arithmetic Calculates the arcus tangens function of X.
Average AVR Arithmetic Calculates the average of input values.
CAS Plus Cascade controller Controller Cascade controller that acts as a PI controller with a master and cascade controller.
Compare2 (Eagle with OS 3.01.00 or higher only)
Comparison Compares two analog inputs (A and B).
Comparison Comparison Compares input A and B.
Cosinus Arithmetic Calculate the cosinus function of X in rad.
Counter Misc Increments the output Y by 1 when input "X" changes from 0 to 1. The counter is set to 0, when "Reset" input becomes TRUE (1).
Cycle Cyclic timer Timer Outputs an alternating value.
Decimal Places Arithmetic Returns the decimal places value of the input (3.175 => 0.175).
Delay Misc Switch-on delay of input A to Y. if input "A" is unequal to "B" within delay time, then Alarm output = TRUE (1).
Dewpoint Misc Calculates the dewpoint temperature from the absolute humidity.
CONTROL ICONS INTRODUCTION
15 EN2Z-0940GE51 R0518
Function Name Previous Function name Folder Description
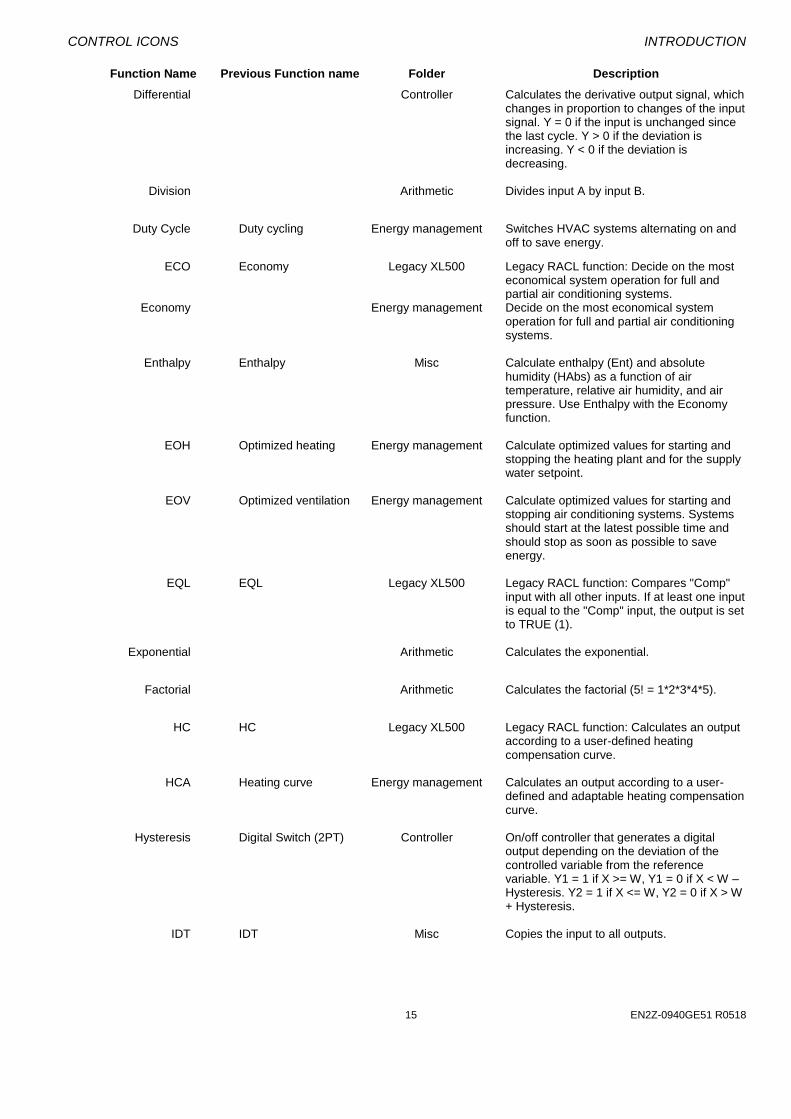
Differential Controller Calculates the derivative output signal, which changes in proportion to changes of the input signal. Y = 0 if the input is unchanged since the last cycle. Y > 0 if the deviation is increasing. Y < 0 if the deviation is decreasing.
Division Arithmetic Divides input A by input B.
Duty Cycle Duty cycling Energy management Switches HVAC systems alternating on and off to save energy.
ECO Economy Legacy XL500 Legacy RACL function: Decide on the most economical system operation for full and partial air conditioning systems.
Economy Energy management Decide on the most economical system operation for full and partial air conditioning systems.
Enthalpy Enthalpy Misc Calculate enthalpy (Ent) and absolute humidity (HAbs) as a function of air temperature, relative air humidity, and air pressure. Use Enthalpy with the Economy function.
EOH Optimized heating Energy management Calculate optimized values for starting and stopping the heating plant and for the supply water setpoint.
EOV Optimized ventilation Energy management Calculate optimized values for starting and stopping air conditioning systems. Systems should start at the latest possible time and should stop as soon as possible to save energy.
EQL EQL Legacy XL500 Legacy RACL function: Compares "Comp" input with all other inputs. If at least one input is equal to the "Comp" input, the output is set to TRUE (1).
Exponential Arithmetic Calculates the exponential.
Factorial Arithmetic Calculates the factorial (5! = 1*2*3*4*5).
HC HC Legacy XL500 Legacy RACL function: Calculates an output according to a user-defined heating compensation curve.
HCA Heating curve Energy management Calculates an output according to a user-defined and adaptable heating compensation curve.
Hysteresis Digital Switch (2PT) Controller On/off controller that generates a digital output depending on the deviation of the controlled variable from the reference variable. Y1 = 1 if X >= W, Y1 = 0 if X < W – Hysteresis. Y2 = 1 if X <= W, Y2 = 0 if X > W + Hysteresis.
IDT IDT Misc Copies the input to all outputs.
INTRODUCTION CONTROL ICONS
EN2Z-0940GE51 R0518 286
Function Name Previous Function name Folder Description
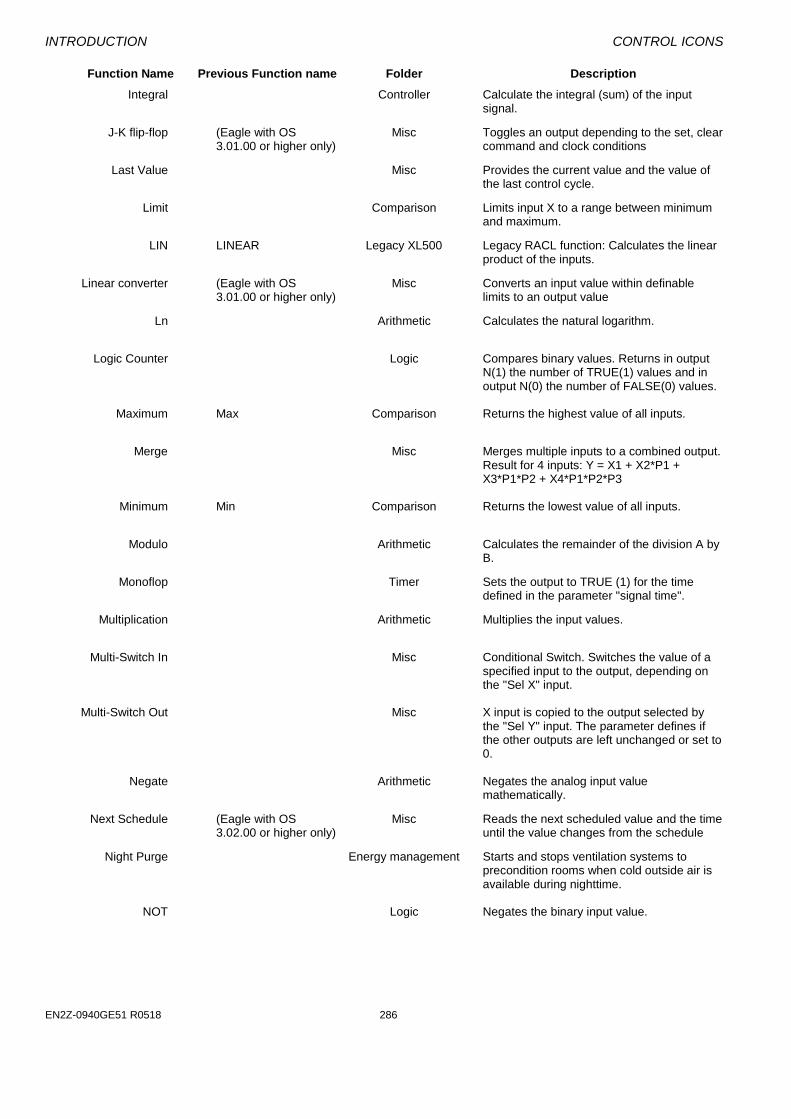
Integral Controller Calculate the integral (sum) of the input signal.
J-K flip-flop (Eagle with OS 3.01.00 or higher only)
Misc Toggles an output depending to the set, clear command and clock conditions
Last Value Misc Provides the current value and the value of the last control cycle.
Limit Comparison Limits input X to a range between minimum and maximum.
LIN LINEAR Legacy XL500 Legacy RACL function: Calculates the linear product of the inputs.
Linear converter (Eagle with OS 3.01.00 or higher only)
Misc Converts an input value within definable limits to an output value
Ln Arithmetic Calculates the natural logarithm.
Logic Counter Logic Compares binary values. Returns in output N(1) the number of TRUE(1) values and in output N(0) the number of FALSE(0) values.
Maximum Max Comparison Returns the highest value of all inputs.
Merge Misc Merges multiple inputs to a combined output. Result for 4 inputs: Y = X1 + X2*P1 + X3*P1*P2 + X4*P1*P2*P3
Minimum Min Comparison Returns the lowest value of all inputs.
Modulo Arithmetic Calculates the remainder of the division A by B.
Monoflop Timer Sets the output to TRUE (1) for the time defined in the parameter "signal time".
Multiplication Arithmetic Multiplies the input values.
Multi-Switch In Misc Conditional Switch. Switches the value of a specified input to the output, depending on the "Sel X" input.
Multi-Switch Out Misc X input is copied to the output selected by the "Sel Y" input. The parameter defines if the other outputs are left unchanged or set to 0.
Negate Arithmetic Negates the analog input value mathematically.
Next Schedule (Eagle with OS 3.02.00 or higher only)
Misc Reads the next scheduled value and the time until the value changes from the schedule
Night Purge Energy management Starts and stops ventilation systems to precondition rooms when cold outside air is available during nighttime.
NOT Logic Negates the binary input value.

CONTROL ICONS INTRODUCTION
17 EN2Z-0940GE51 R0518
Function Name Previous Function name Folder Description
Odd Parity Logic Compares binary values and returns TRUE (1), if the number of TRUE (1) elements are odd.
On-Board DI Misc Read on-board digital input.
On-Board DO Misc Write on-board digital output.
On/Off Delay Timer Switch On- and Off delay of input A to output Y.
OR Logic OR output becomes TRUE(1) if at least one input is TRUE(1). NOR output is the inverted OR output.
PID PID controller Legacy XL500 Legacy RACL function: PID-Controller that generates a signal depending on the deviation of the controlled variable from the reference variable.
PID Plus PID controller Controller PID-Controller that generates a signal depending on the deviation of the controlled variable from the reference variable.
POL POLYNOMIAL Legacy XL500 Legacy RACL function: Calculates the polynomial.
Ramp Misc Calculates the output value in relation to the input, depending on a pre-defined graph.
Random Misc Returns a random value in a range between lower and upper limit.
Read Global Req.
(Eagle with OS 3.00.00 or higher only)
Misc Reads values from global registers
Read Priority (Eagle with OS 3.01.00 or higher only)
Misc Returns the value of the highest valid priority in the priority array
Read Priority Value
(Eagle with OS 3.02.00 or higher only)
Misc Reads the selected priority of the datapoint
Reset Timer Timer Resets the timer of a "Timer value" function.
Round Arithmetic Rounds the input value to the next integer value.
Round down Arithmetic Rounds the input value down to the next integer value (3.1 => 3, -3.1 => -4).
Round up Arithmetic Rounds the input value up to the next integer value (3.1 => 4, -3.1 => -3).
RS flip-flop Misc Sets the output to TRUE(1) if the "SET" input is TRUE(1) until the "RESET" input becomes TRUE(1).
SET SET Legacy XL500 Legacy RACL function: Set the output depending on the comparison of the inputs. Y=FALSE(0) if A < B Y=TRUE(1) if A > B Y is not changed if A = B.
Sequence Misc Calculates three output values in relation to the input, depending on pre-defined graphs.

INTRODUCTION CONTROL ICONS
EN2Z-0940GE51 R0518 286
Function Name Previous Function name Folder Description
Sinus Arithmetic Calculate the sinus function of X in rad.
Split Misc Splits the input into multiple outputs. Result for a split into 3 outputs: Y3 = (((X-Y1) / P1) -Y2) / P2) modulo P3.
Square root Arithmetic Calculates the square root.
Subtraction Minus Arithmetic Subtracts the sum of S inputs from the input value M.
Switching Table Logic Switching logic module
Time Counter Timer Counts the runtime of the input signal.
Timer Value RTIM Timer Legacy RACL function "RTIM": Counts the time in seconds. Can be reset by the "Reset Timer" function.
Truncate Arithmetic Truncates the decimal places (3.1 => 3, -3.1 => -3).
Tuncos Misc Provides time until next change of state information from schedule for the connected input.
Value Ramp Misc Defines the slope by which the output will follow the input.
Value Ramp2 (Eagle with OS 3.00.00 or higher only)
Misc Defines the slope by which the output will follow the input.
WIDO Legacy XL500 Legacy RACL function: Checks if the input value is within the range between minimum and maximum.
Write Global Reg.
(Eagle with OS 3.00.00 or higher only)
Misc Writes a value to a global register.
Write Priority (Eagle with OS 3.00.00 or higher only)
Misc Write the value of an input with a defined priority to an output which must be connected with the present value of a datapoint.
X root Y Arithmetic Calculates X to the root of Y.
X^2 Arithmetic Calculates X * X.
X^Y Arithmetic Calculates X to the power of Y.
XOR Table Logic XOR output becomes TRUE (1) if exactly one input is TRUE(1). XNOR output is the inverted XOR output.
ZEB Zero Energy Band Energy management Divides a specified range into Heating range, Zero energy band and Cooling range.
CONTROL ICONS INTRODUCTION
19 EN2Z-0940GE51 R0518
General
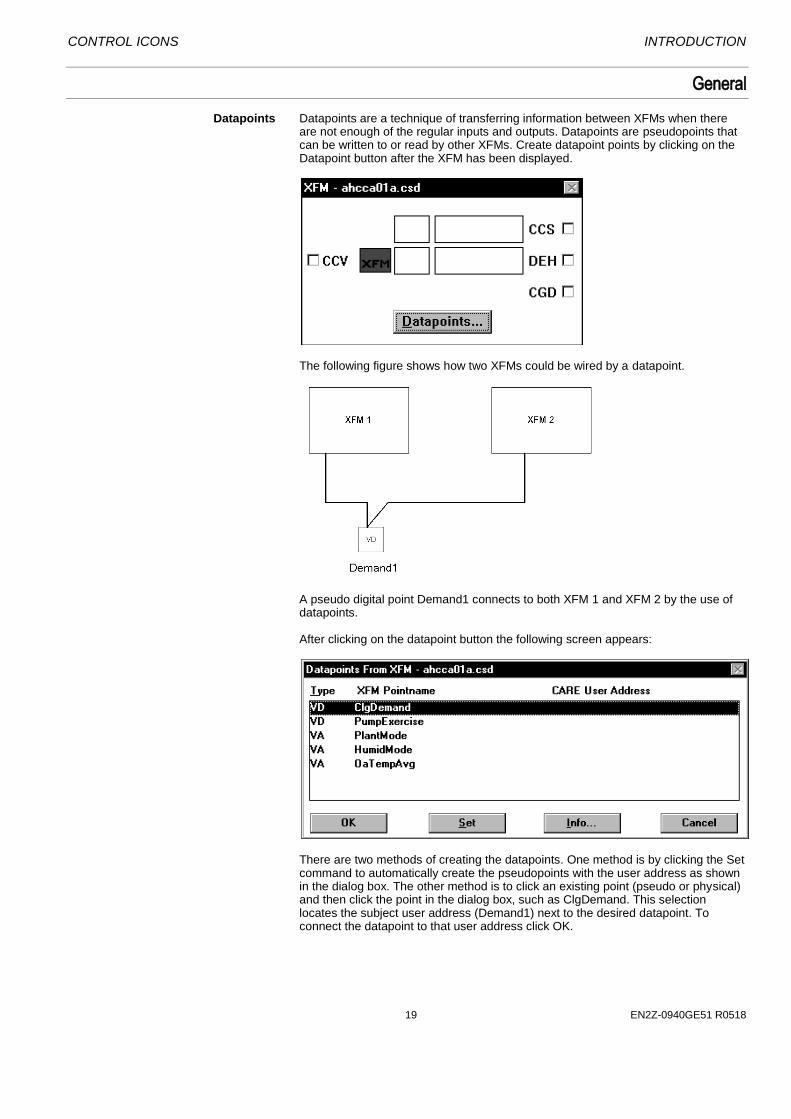
Datapoints Datapoints are a technique of transferring information between XFMs when there are not enough of the regular inputs and outputs. Datapoints are pseudopoints that can be written to or read by other XFMs. Create datapoint points by clicking on the Datapoint button after the XFM has been displayed.
The following figure shows how two XFMs could be wired by a datapoint.
A pseudo digital point Demand1 connects to both XFM 1 and XFM 2 by the use of datapoints. After clicking on the datapoint button the following screen appears:
There are two methods of creating the datapoints. One method is by clicking the Set command to automatically create the pseudopoints with the user address as shown in the dialog box. The other method is to click an existing point (pseudo or physical) and then click the point in the dialog box, such as ClgDemand. This selection locates the subject user address (Demand1) next to the desired datapoint. To connect the datapoint to that user address click OK.

INTRODUCTION CONTROL ICONS
EN2Z-0940GE51 R0518 286
For detailed information see XFMs section in the CONTROL STRATEGY chapter of the CARE USER GUIDE.
CONROL ICONS
21 EN2Z-0940GE51 R1215
ALPHABETIC REFERENCE
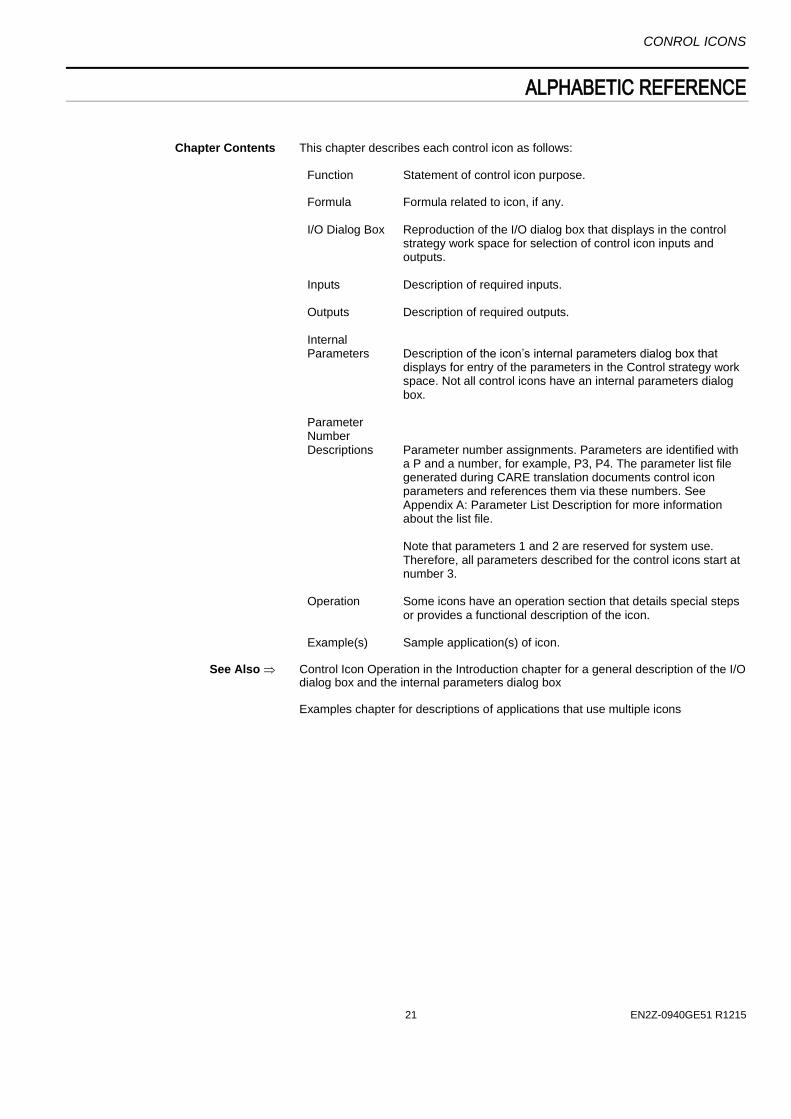
Chapter Contents This chapter describes each control icon as follows:
Function Statement of control icon purpose.
Formula Formula related to icon, if any. I/O Dialog Box Reproduction of the I/O dialog box that displays in the control
strategy work space for selection of control icon inputs and outputs.
Inputs Description of required inputs. Outputs Description of required outputs. Internal Parameters Description of the icon’s internal parameters dialog box that
displays for entry of the parameters in the Control strategy work space. Not all control icons have an internal parameters dialog box.
Parameter Number Descriptions Parameter number assignments. Parameters are identified with
a P and a number, for example, P3, P4. The parameter list file generated during CARE translation documents control icon parameters and references them via these numbers. See Appendix A: Parameter List Description for more information about the list file.
Note that parameters 1 and 2 are reserved for system use.
Therefore, all parameters described for the control icons start at number 3.
Operation Some icons have an operation section that details special steps
or provides a functional description of the icon. Example(s) Sample application(s) of icon.
See Also Control Icon Operation in the Introduction chapter for a general description of the I/O
dialog box and the internal parameters dialog box
Examples chapter for descriptions of applications that use multiple icons
ALPHABETIC REFERENCE CONTROL ICONS
EN2Z-0940GE51 R0518 286
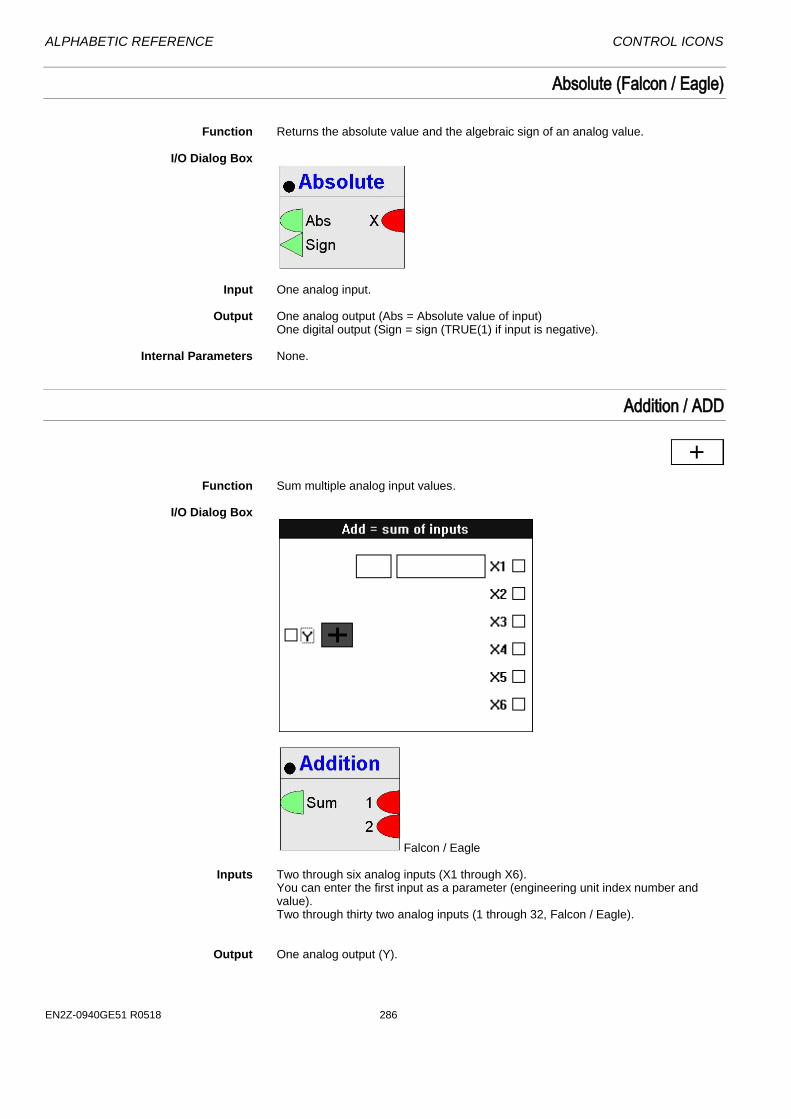
Absolute (Falcon / Eagle)
Function Returns the absolute value and the algebraic sign of an analog value. I/O Dialog Box
Input One analog input. Output One analog output (Abs = Absolute value of input)
One digital output (Sign = sign (TRUE(1) if input is negative). Internal Parameters None.
Addition / ADD
Function Sum multiple analog input values. I/O Dialog Box
Falcon / Eagle Inputs Two through six analog inputs (X1 through X6).
You can enter the first input as a parameter (engineering unit index number and value). Two through thirty two analog inputs (1 through 32, Falcon / Eagle).
Output One analog output (Y).
CONTROL ICONS ALPHABETIC REFERENCE
23 EN2Z-0940GE51 R0518
Internal Parameters None. Example See the Examples chapter for a description of how to use the ADD icon in a floating
limits and alarm suppression application.
Also see the Data Transfer (IDT) section for examples that show how to use ADD with IDT.
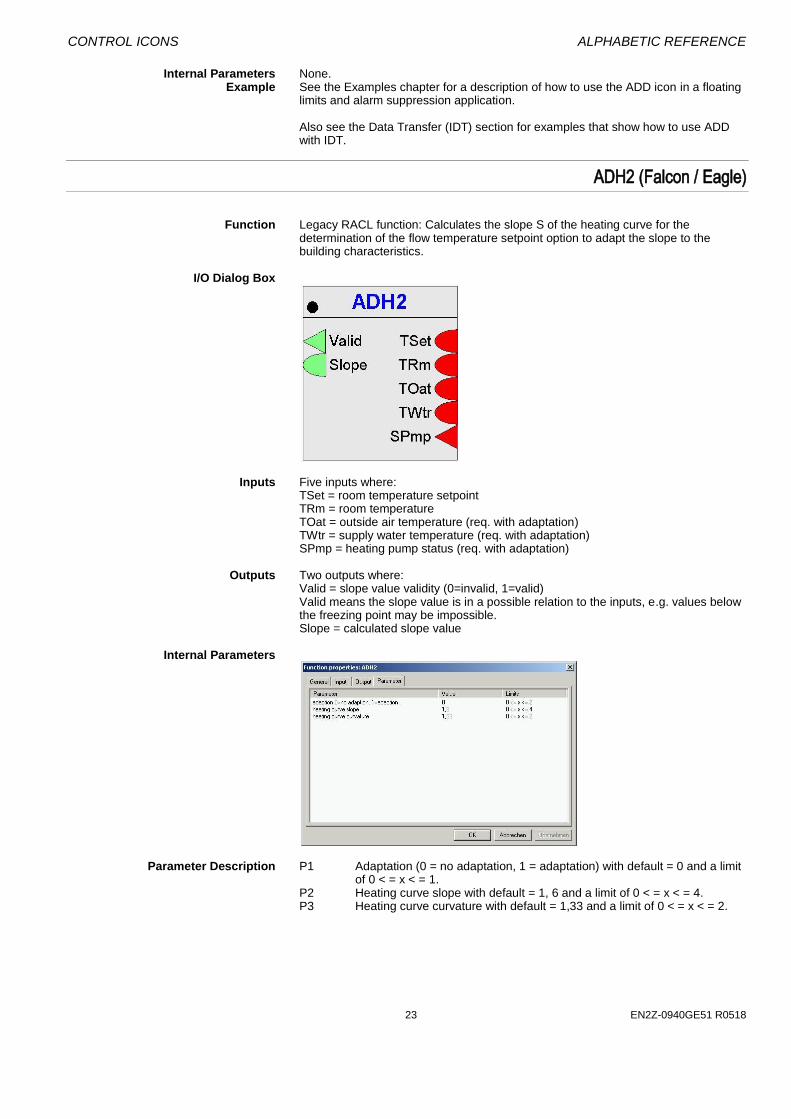
ADH2 (Falcon / Eagle)
Function Legacy RACL function: Calculates the slope S of the heating curve for the
determination of the flow temperature setpoint option to adapt the slope to the building characteristics.
I/O Dialog Box
Inputs Five inputs where:
TSet = room temperature setpoint TRm = room temperature TOat = outside air temperature (req. with adaptation) TWtr = supply water temperature (req. with adaptation) SPmp = heating pump status (req. with adaptation)
Outputs Two outputs where:
Valid = slope value validity (0=invalid, 1=valid) Valid means the slope value is in a possible relation to the inputs, e.g. values below the freezing point may be impossible. Slope = calculated slope value
Internal Parameters
Parameter Description P1 Adaptation (0 = no adaptation, 1 = adaptation) with default = 0 and a limit
of 0 < = x < = 1. P2 Heating curve slope with default = 1, 6 and a limit of 0 < = x < = 4. P3 Heating curve curvature with default = 1,33 and a limit of 0 < = x < = 2.

ALPHABETIC REFERENCE CONTROL ICONS
EN2Z-0940GE51 R0518 286
Analog Switch / SWI
Function Switch an analog value depending on a digital value.
For example: If XD1 = 1, set output Y to X2. If XD1 = 0, set output Y to X3.
Formula Y = X2, if XD1 = 1.
Y = X3, if XD1 = 0. I/O Dialog Box
Inputs One digital input (XD1).
Two analog inputs (X2 and X3). You can enter the two analog inputs as parameters (engineering unit index number and value for each parameter).
Output One analog output (Y). Internal Parameters None. Parameter Number Descriptions P3 X2 if X2 is not connected with a point. P4 X3 if X3 is not connected with a point. If X2 is connected with a point, X3 is
numbered parameter 4. Example See the Examples chapter in this manual for applications that use the SWI control
icon.
Also see the Digital Conversion note in the Mathematical Editor (MAT) section. You can use SWI to convert a digital point to analog values for use in a mathematical formula.
CONTROL ICONS ALPHABETIC REFERENCE
25 EN2Z-0940GE51 R0518
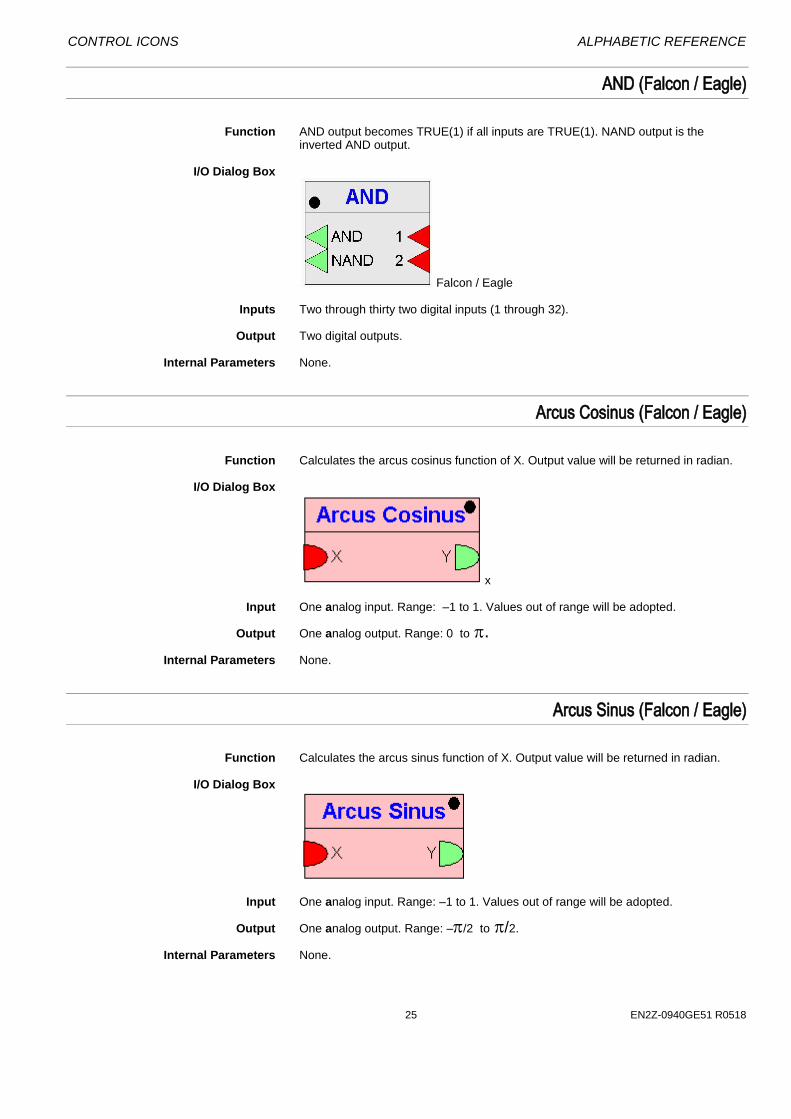
AND (Falcon / Eagle)
Function AND output becomes TRUE(1) if all inputs are TRUE(1). NAND output is the
inverted AND output. I/O Dialog Box
Falcon / Eagle Inputs Two through thirty two digital inputs (1 through 32). Output Two digital outputs. Internal Parameters None.
Arcus Cosinus (Falcon / Eagle)
Function Calculates the arcus cosinus function of X. Output value will be returned in radian. I/O Dialog Box
x Input One analog input. Range: –1 to 1. Values out of range will be adopted. Output One analog output. Range: 0 to .
Internal Parameters None.
Arcus Sinus (Falcon / Eagle)
Function Calculates the arcus sinus function of X. Output value will be returned in radian. I/O Dialog Box
Input One analog input. Range: –1 to 1. Values out of range will be adopted. Output One analog output. Range: –/2 to /2. Internal Parameters None.
ALPHABETIC REFERENCE CONTROL ICONS
EN2Z-0940GE51 R0518 286
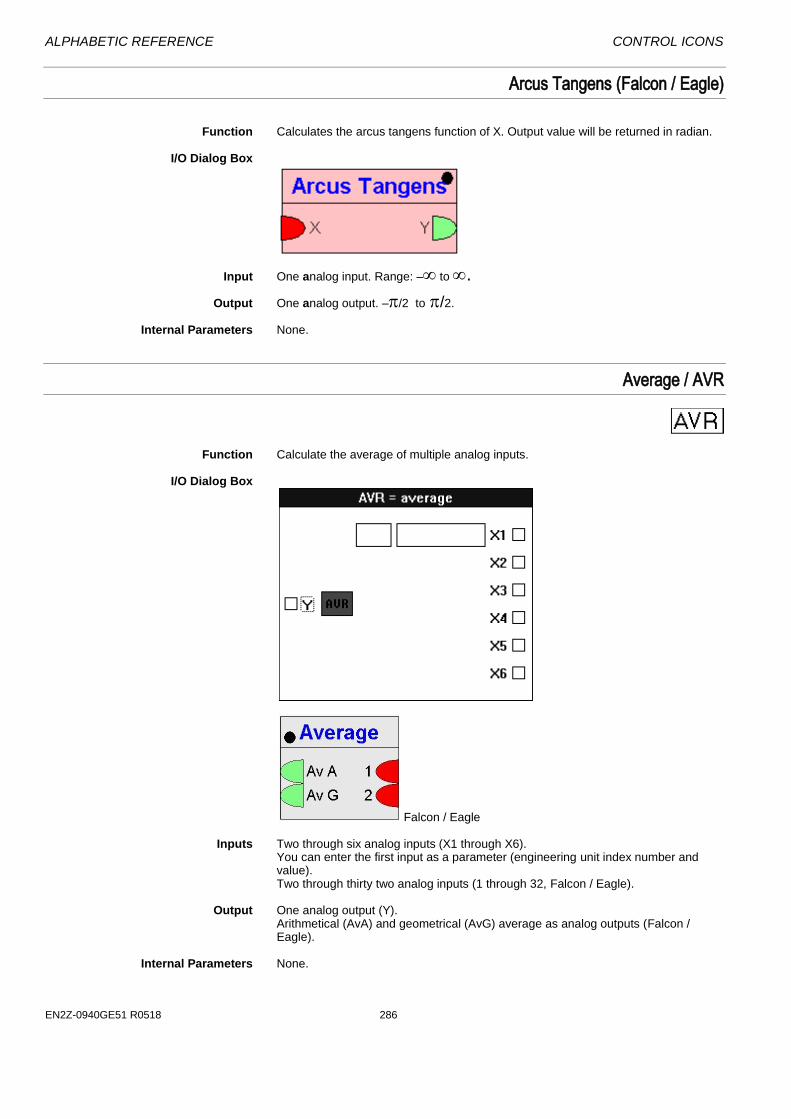
Arcus Tangens (Falcon / Eagle)
Function Calculates the arcus tangens function of X. Output value will be returned in radian. I/O Dialog Box
Input One analog input. Range: – to . Output One analog output. –/2 to /2.
Internal Parameters None.
Average / AVR
Function Calculate the average of multiple analog inputs. I/O Dialog Box
Falcon / Eagle Inputs Two through six analog inputs (X1 through X6).
You can enter the first input as a parameter (engineering unit index number and value). Two through thirty two analog inputs (1 through 32, Falcon / Eagle).
Output One analog output (Y).
Arithmetical (AvA) and geometrical (AvG) average as analog outputs (Falcon / Eagle).
Internal Parameters None.
CONTROL ICONS ALPHABETIC REFERENCE
27 EN2Z-0940GE51 R0518
Cascade / CAS
Function Provide both a master Proportional-Integral (PI) controller and a secondary PI
controller to handle difficult control sections. The master PI manages the setpoint for the secondary (cascade) PI. The secondary PI provides the setpoint reset schedule which, because of the PI function, can be nonlinear.
CAS operates the same as a PI controller with the addition of a compensation input. See the Cascade Operation note in this section for more details. Also see the PID section for more details on PID operation.
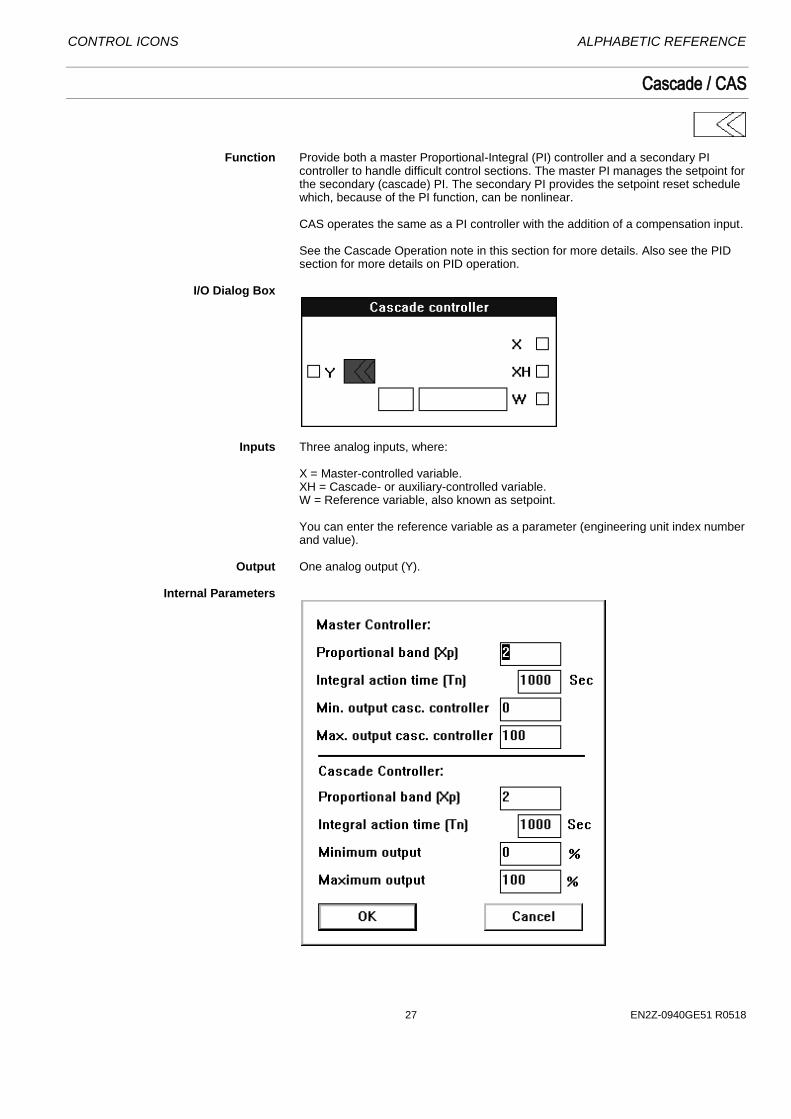
I/O Dialog Box
Inputs Three analog inputs, where:
X = Master-controlled variable. XH = Cascade- or auxiliary-controlled variable. W = Reference variable, also known as setpoint. You can enter the reference variable as a parameter (engineering unit index number and value).
Output One analog output (Y). Internal Parameters

ALPHABETIC REFERENCE CONTROL ICONS
EN2Z-0940GE51 R0518 286
Master controller Proportional band Xp Number type: decimal, Unit: same as the controlled variable (X) Default: 2.0, Range: 0 through 100.0 Proportional band value is equivalent to the throttling range.
Integral action time Tn
Number type: whole number, Unit: seconds Default 1000 sec, Range: 0 through 7200 sec If Integral action time is less than 15 seconds, integral control is disabled.
Minimum output
Number type: decimal, Unit: same as the cascade-controlled variable (XH) Default: 0.0, Range: 0 through 100.0
Maximum output
Number type: decimal, Unit: same as the cascade-controlled variable (XH) Default: 100.0, Range: 0 through 100.0
Cascade controller Proportional band Xp
Number type: decimal, Unit: same as the cascade-controlled variable (XH) Default: 2.0, Range: 0 through 100.0 Proportional band value is equivalent to the throttling range.
Integral action time Tn
Number type: whole number, Unit: seconds Default: 1000 sec, Range: 0 through 7200 sec If Integral action time is less than 15 seconds, integral control is disabled.
Minimum output
Number type: decimal, Unit: percent Default: 0.0 percent, Range: 0 through 100.0 percent
Maximum output
Number type: decimal, Unit: percent Default: 100.0 percent, Range: 0 through 100.0 percent
Parameter Number Descriptions P3 Xp (proportional band master controller) P4 Tn (in seconds, integral action time of the master controller) P5* Min (minimum limit of the cascade controller) P6* Max (maximum limit of the cascade controller) P7 Xp (proportional band of the cascade controller) P8 Tn (in seconds, integral action time of the cascade controller) P9 Min (minimum limit of the positioning signal, in percent) P10 Max (maximum limit of the positioning signal, in percent) P11 W (reference variable if entered as a parameter, not connected to a point)
Not for Falcon / Eagle! * Parameters P5 and P6 serve as the minimum and maximum limits,
respectively, of the setpoint assignment to the cascade controller. Cascade Operation As an example, the following diagram shows a master PID that is the room
temperature controller and a secondary PID that is the fresh air temperature controller. The advantage of this arrangement is that the master controller and secondary controller can each adapt to their own control sections.

CONTROL ICONS ALPHABETIC REFERENCE
29 EN2Z-0940GE51 R0518
The next diagram illustrates the use of a Cascade controller to perform the same functions. The CAS controller contains two PI controllers in a “cascade” arrangement. The X variable reads the master-controlled variable (room temperature). The XH variable reads the fresh air temperature (auxiliary-controlled variable). The W variable is the room temperature setpoint (reference variable).
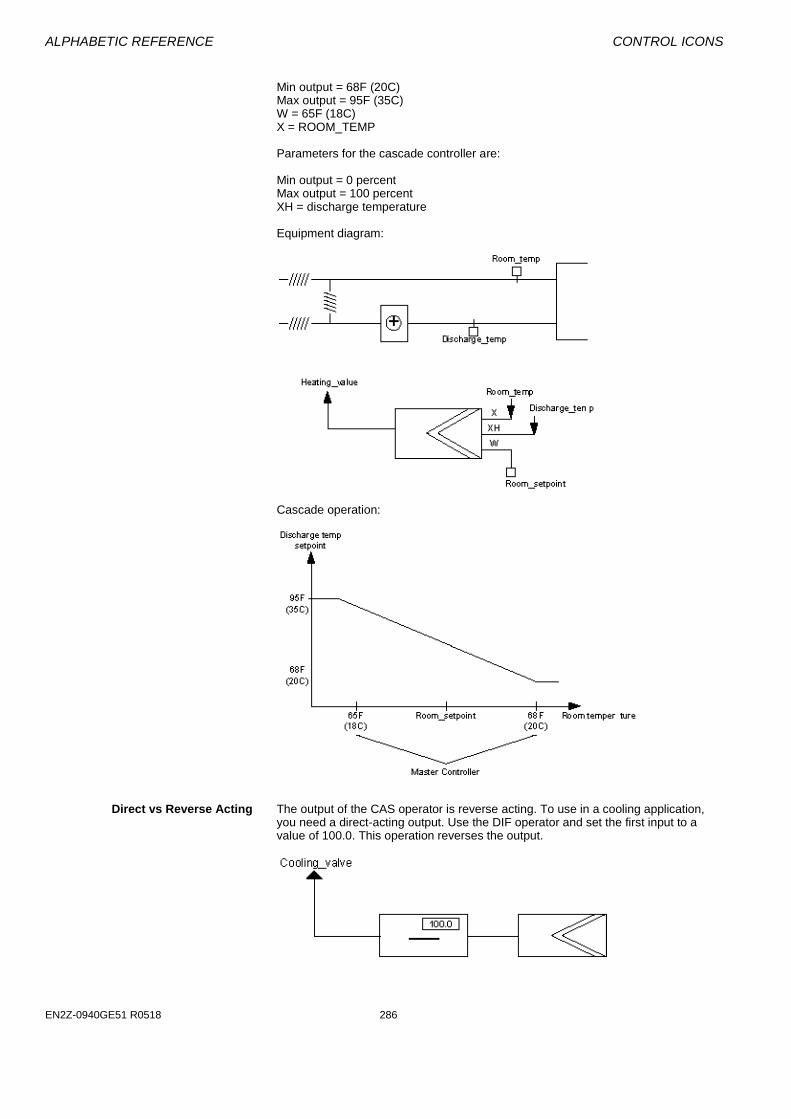
Setpoint Reset Example This example shows how to use cascade control to reset a discharge air controller
setpoint up to 95F (35C) if room temperature falls below its setpoint to 65F (18C). The submaster controls the controller setpoint. The output of the master controller resets the setpoint of the submaster up and down.
Parameters for the master controller are:
ALPHABETIC REFERENCE CONTROL ICONS
EN2Z-0940GE51 R0518 286
Min output = 68F (20C) Max output = 95F (35C) W = 65F (18C) X = ROOM_TEMP Parameters for the cascade controller are: Min output = 0 percent Max output = 100 percent XH = discharge temperature Equipment diagram:
Cascade operation:
Direct vs Reverse Acting The output of the CAS operator is reverse acting. To use in a cooling application,
you need a direct-acting output. Use the DIF operator and set the first input to a value of 100.0. This operation reverses the output.
CONTROL ICONS ALPHABETIC REFERENCE
31 EN2Z-0940GE51 R0518
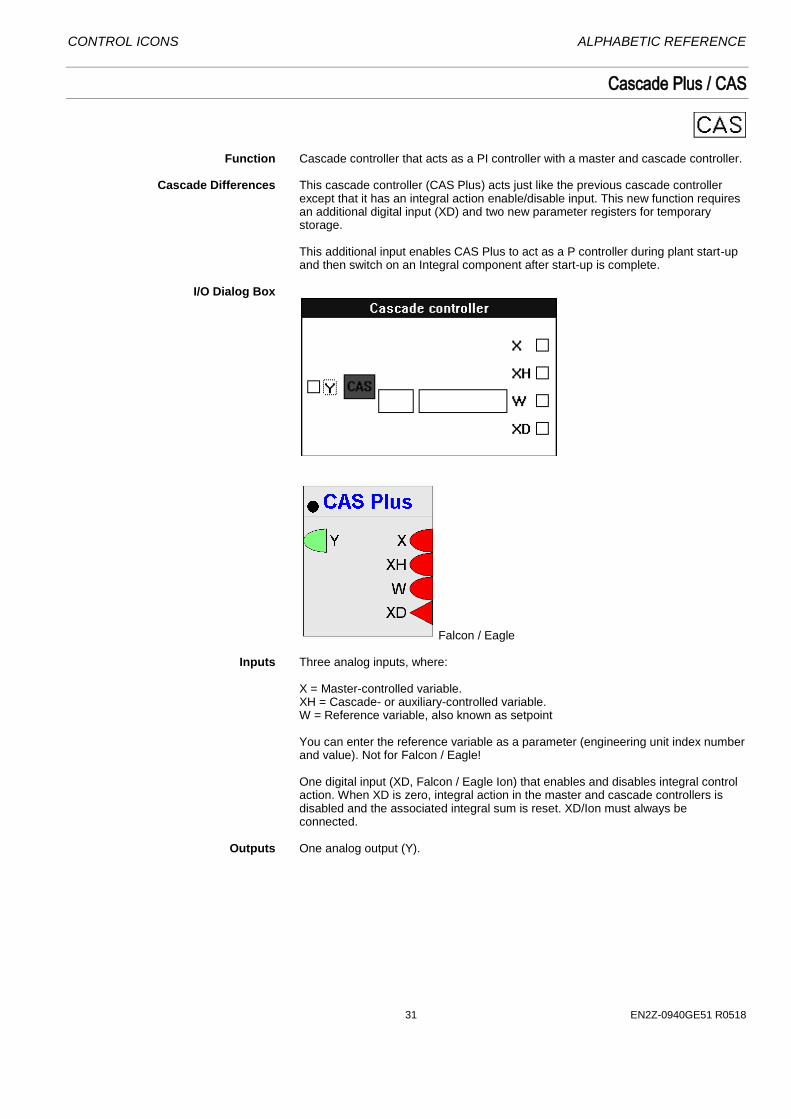
Cascade Plus / CAS
Function Cascade controller that acts as a PI controller with a master and cascade controller. Cascade Differences This cascade controller (CAS Plus) acts just like the previous cascade controller
except that it has an integral action enable/disable input. This new function requires an additional digital input (XD) and two new parameter registers for temporary storage.
This additional input enables CAS Plus to act as a P controller during plant start-up and then switch on an Integral component after start-up is complete.
I/O Dialog Box
Falcon / Eagle Inputs Three analog inputs, where:
X = Master-controlled variable. XH = Cascade- or auxiliary-controlled variable. W = Reference variable, also known as setpoint You can enter the reference variable as a parameter (engineering unit index number and value). Not for Falcon / Eagle! One digital input (XD, Falcon / Eagle Ion) that enables and disables integral control action. When XD is zero, integral action in the master and cascade controllers is disabled and the associated integral sum is reset. XD/Ion must always be connected.
Outputs One analog output (Y).
ALPHABETIC REFERENCE CONTROL ICONS
EN2Z-0940GE51 R0518 286
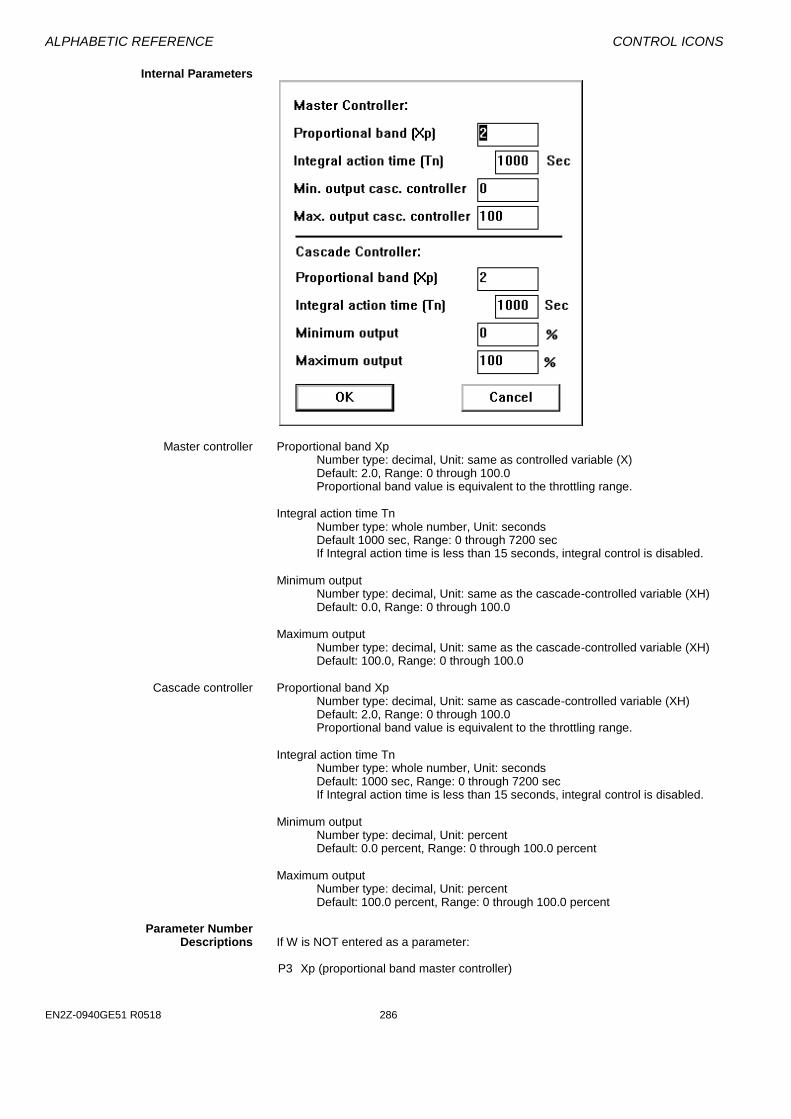
Internal Parameters
Master controller Proportional band Xp Number type: decimal, Unit: same as controlled variable (X) Default: 2.0, Range: 0 through 100.0 Proportional band value is equivalent to the throttling range.
Integral action time Tn
Number type: whole number, Unit: seconds Default 1000 sec, Range: 0 through 7200 sec If Integral action time is less than 15 seconds, integral control is disabled.
Minimum output
Number type: decimal, Unit: same as the cascade-controlled variable (XH) Default: 0.0, Range: 0 through 100.0
Maximum output
Number type: decimal, Unit: same as the cascade-controlled variable (XH) Default: 100.0, Range: 0 through 100.0
Cascade controller Proportional band Xp
Number type: decimal, Unit: same as cascade-controlled variable (XH) Default: 2.0, Range: 0 through 100.0 Proportional band value is equivalent to the throttling range.
Integral action time Tn
Number type: whole number, Unit: seconds Default: 1000 sec, Range: 0 through 7200 sec If Integral action time is less than 15 seconds, integral control is disabled.
Minimum output
Number type: decimal, Unit: percent Default: 0.0 percent, Range: 0 through 100.0 percent
Maximum output
Number type: decimal, Unit: percent Default: 100.0 percent, Range: 0 through 100.0 percent
Parameter Number Descriptions If W is NOT entered as a parameter: P3 Xp (proportional band master controller)
CONTROL ICONS ALPHABETIC REFERENCE
33 EN2Z-0940GE51 R0518
P4 Tn (in seconds, integral action time of the master controller) P5* Min (minimum limit of the cascade controller) P6* Max (maximum limit of the cascade controller) P7 Xp (proportional band of the cascade controller) P8 Tn (in seconds, integral action time of the cascade controller) P9 Min (minimum limit of the positioning signal, in percent) P10 Max (maximum limit of the positioning signal, in percent) P11 Actual integral action time of the master controller (in seconds). If XD is zero,
P11 is also zero and the master controller acts like a P controller. If XD is one, P11 contains the user-defined value of Tn stored in P4.
P12 Default integral action time of the cascade controller (in seconds). If XD is zero, P12 is also zero and the cascade controller acts like a P controller. If XD is one, P12 contains the user-defined value of Tn stored in P8.
* Parameters P5 and P6 serve as the minimum and maximum limits,
respectively, of the setpoint assignment to the cascade controller. If W is entered as a parameter: P3 Xp (proportional band master controller) P4 Tn (in seconds, integral action time of the master controller) P5* Min (minimum limit of the cascade controller) P6* Max (maximum limit of the cascade controller) P7 Xp (proportional band of the cascade controller) P8 Tn (in seconds, integral action time of the cascade controller) P9 Min (minimum limit of the positioning signal, in percent) P10 Max (maximum limit of the positioning signal, in percent) P11 W (reference variable if entered as a parameter, not connected to a point)
Not for Falcon / Eagle! P12 Actual integral action time of the master controller (in seconds). If XD is zero,
P12 is also zero and the master controller acts like a P controller. If XD is one, P12 contains the user-defined value of Tn stored in P4.
P13 Default integral action time of the cascade controller (in seconds). If XD is zero, P13 is also zero and the cascade controller acts like a P controller. If XD is one, P13 contains the user-defined value of Tn stored in P8.
* Parameters P5 and P6 serve as the minimum and maximum limits,
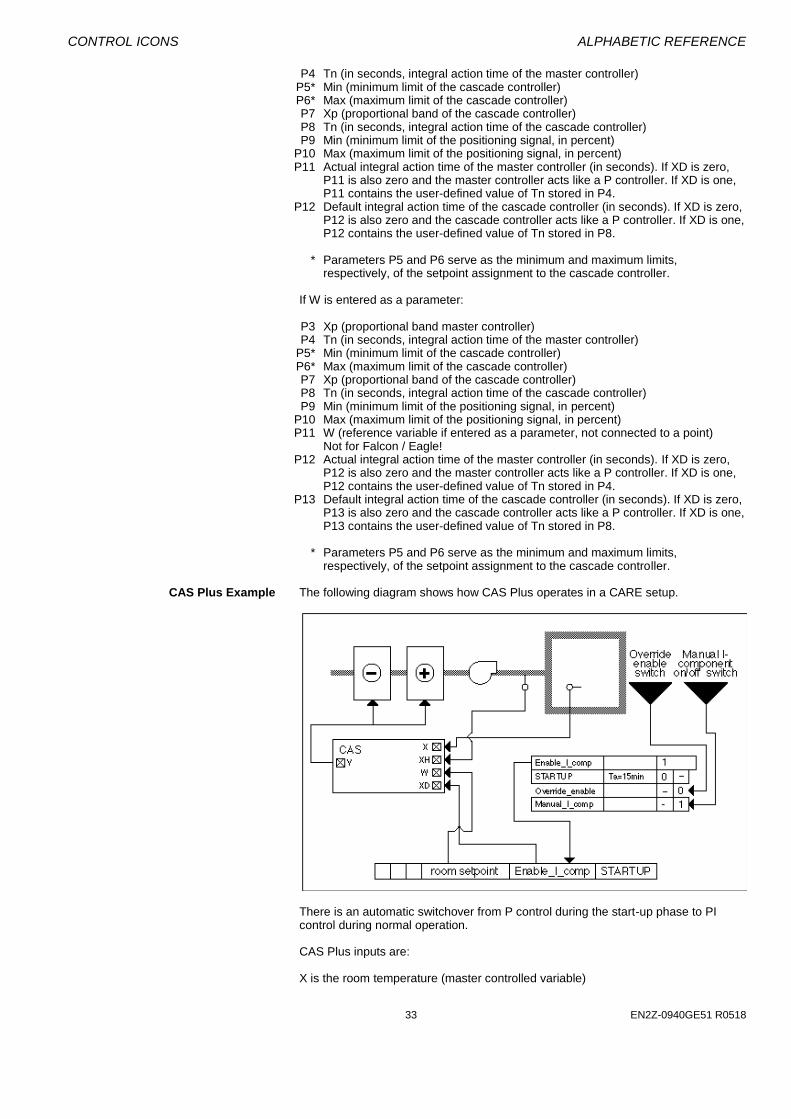
respectively, of the setpoint assignment to the cascade controller. CAS Plus Example The following diagram shows how CAS Plus operates in a CARE setup.
There is an automatic switchover from P control during the start-up phase to PI control during normal operation. CAS Plus inputs are: X is the room temperature (master controlled variable)
ALPHABETIC REFERENCE CONTROL ICONS
EN2Z-0940GE51 R0518 286
XH is the supply air temperature (auxiliary controled variable) W is the room temperature setpoint ( reference variable). The switching table sets the digital software point Enable_I_comp according to the following rules:
• Enable the I component 15 minutes after the negative transition of user address
STARTUP. Before this transition, the main and auxiliary controllers act as P controllers because the I component is switched to zero by the XD digital input in CAS Plus.
• A manual override in the second column. The override function is active if
Override_enable is 1 (enabled by manual switch). If override is enabled, a user can switch the I component on and off via Manual_I_Comp no matter what the status is of STARTUP.
See Appendix B: STARTUP User Address for information on how the user address operates. This application works only if STARTUP is set according to the information in Appendix B.
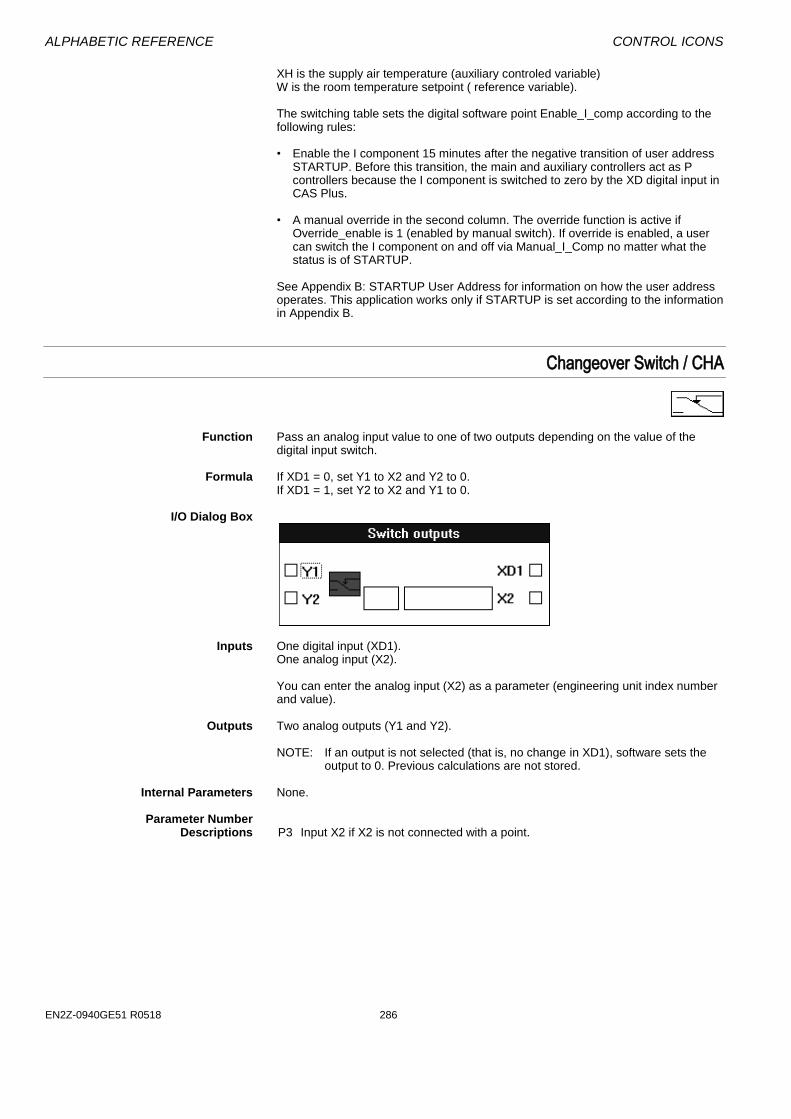
Changeover Switch / CHA
Function Pass an analog input value to one of two outputs depending on the value of the
digital input switch. Formula If XD1 = 0, set Y1 to X2 and Y2 to 0.
If XD1 = 1, set Y2 to X2 and Y1 to 0. I/O Dialog Box
Inputs One digital input (XD1).
One analog input (X2). You can enter the analog input (X2) as a parameter (engineering unit index number and value).
Outputs Two analog outputs (Y1 and Y2).
NOTE: If an output is not selected (that is, no change in XD1), software sets the output to 0. Previous calculations are not stored.
Internal Parameters None. Parameter Number Descriptions P3 Input X2 if X2 is not connected with a point.
CONTROL ICONS ALPHABETIC REFERENCE
35 EN2Z-0940GE51 R0518
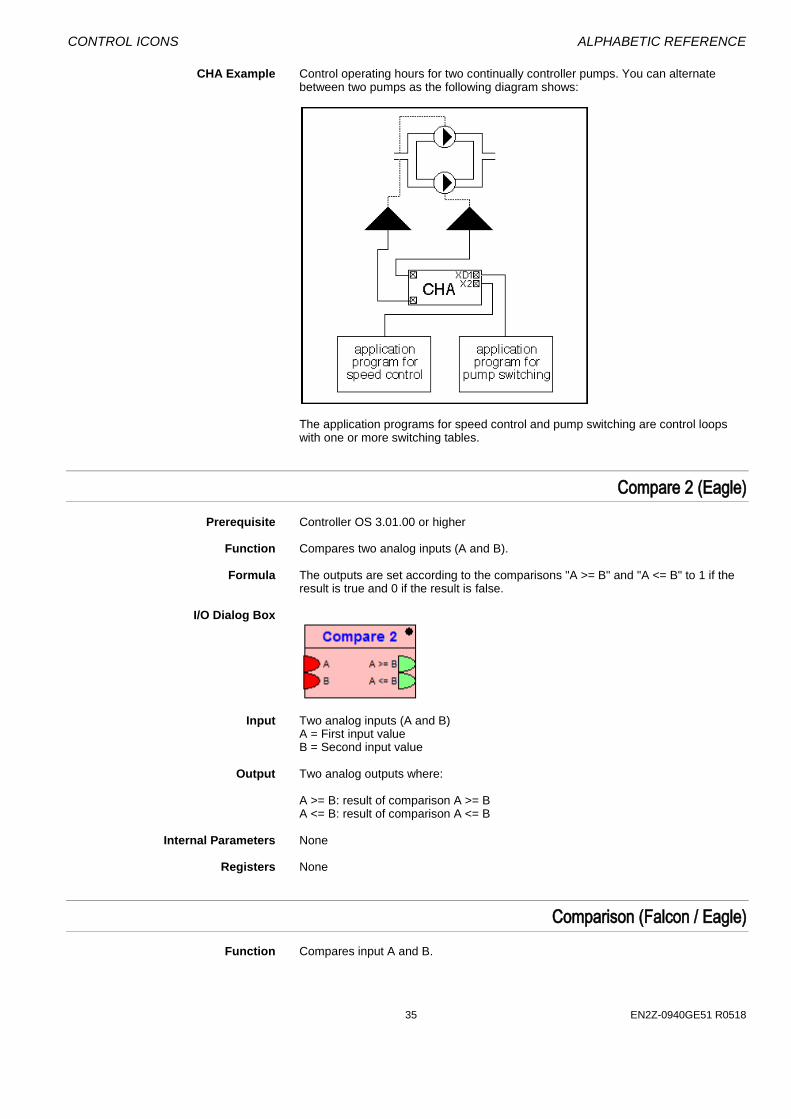
CHA Example Control operating hours for two continually controller pumps. You can alternate between two pumps as the following diagram shows:
The application programs for speed control and pump switching are control loops with one or more switching tables.
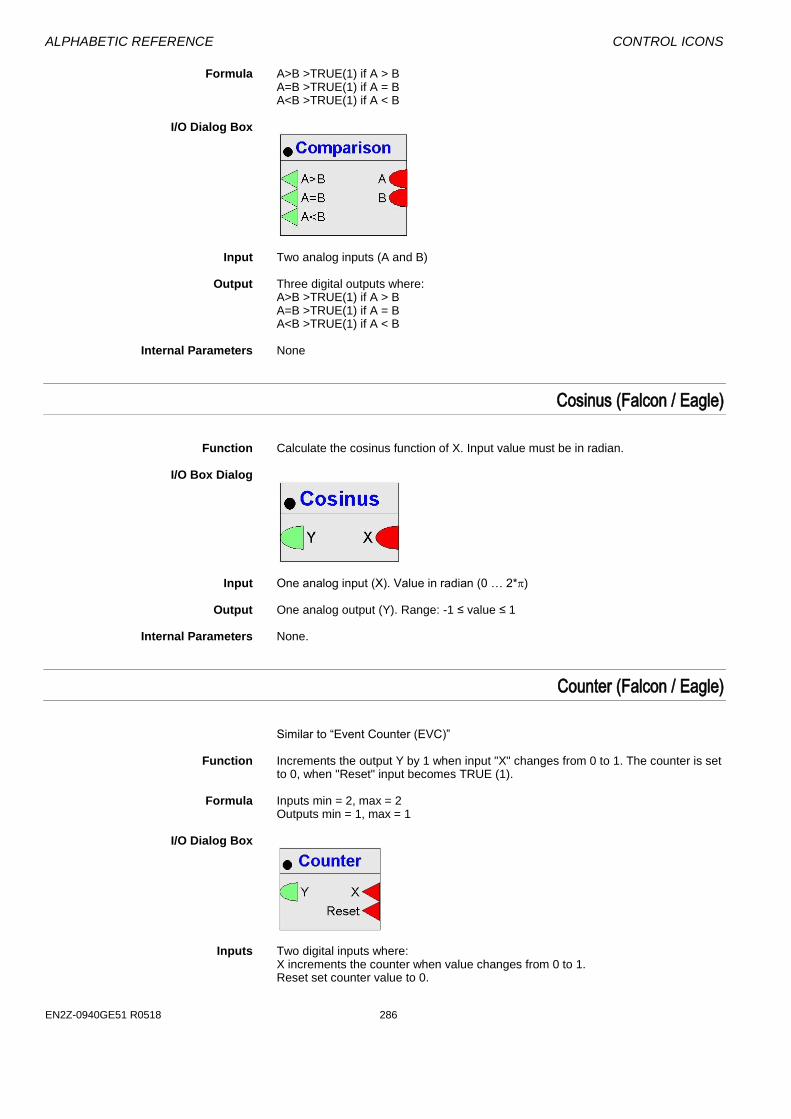
Compare 2 (Eagle)
Prerequisite Controller OS 3.01.00 or higher
Function Compares two analog inputs (A and B). Formula The outputs are set according to the comparisons "A >= B" and "A <= B" to 1 if the
result is true and 0 if the result is false. I/O Dialog Box
Input Two analog inputs (A and B)
A = First input value B = Second input value
Output Two analog outputs where:
A >= B: result of comparison A >= B A <= B: result of comparison A <= B
Internal Parameters None
Registers None
Comparison (Falcon / Eagle)
Function Compares input A and B.
ALPHABETIC REFERENCE CONTROL ICONS
EN2Z-0940GE51 R0518 286
Formula A>B >TRUE(1) if A > B A=B >TRUE(1) if A = B A<B >TRUE(1) if A < B
I/O Dialog Box
Input Two analog inputs (A and B) Output Three digital outputs where:
A>B >TRUE(1) if A > B A=B >TRUE(1) if A = B A<B >TRUE(1) if A < B
Internal Parameters None
Cosinus (Falcon / Eagle)
Function Calculate the cosinus function of X. Input value must be in radian. I/O Box Dialog
Input One analog input (X). Value in radian (0 … 2*) Output One analog output (Y). Range: -1 ≤ value ≤ 1 Internal Parameters None.
Counter (Falcon / Eagle)
Similar to “Event Counter (EVC)” Function Increments the output Y by 1 when input "X" changes from 0 to 1. The counter is set
to 0, when "Reset" input becomes TRUE (1). Formula Inputs min = 2, max = 2
Outputs min = 1, max = 1 I/O Dialog Box
Inputs Two digital inputs where:
X increments the counter when value changes from 0 to 1. Reset set counter value to 0.
CONTROL ICONS ALPHABETIC REFERENCE
37 EN2Z-0940GE51 R0518
Outputs One output (Y) counter value. Number of input X value changes since the last Reset.
Internal Parameters None
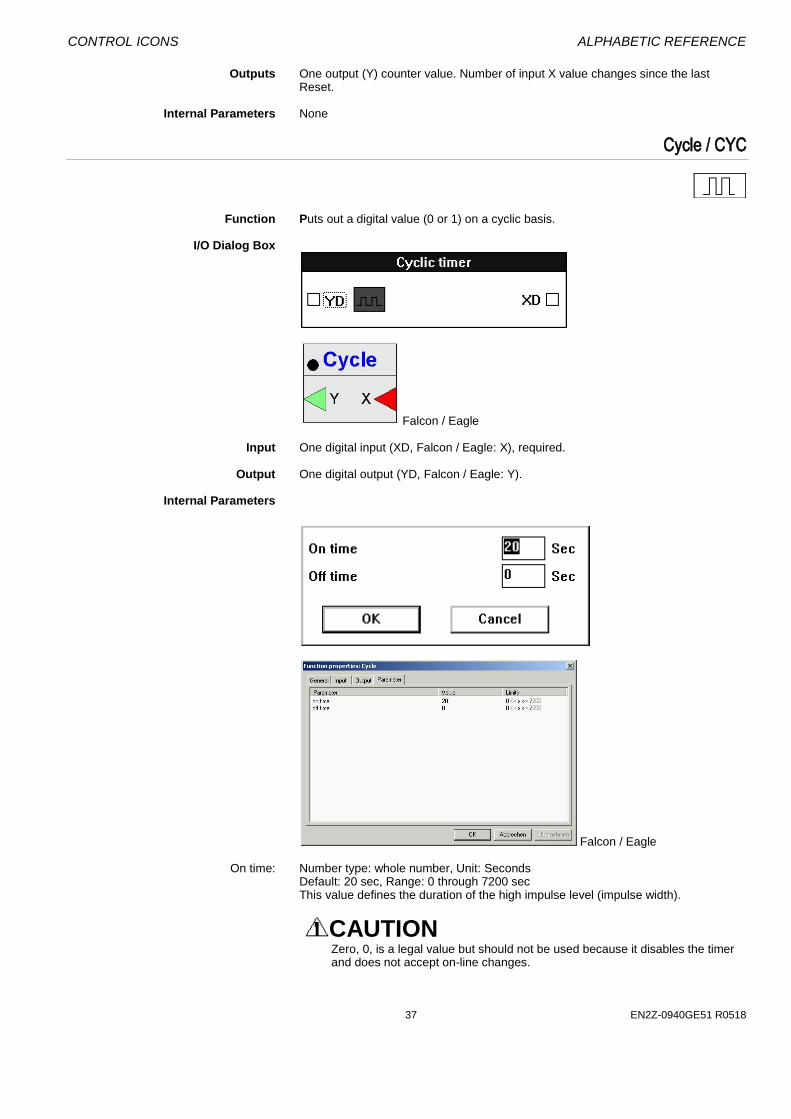
Cycle / CYC
Function Puts out a digital value (0 or 1) on a cyclic basis. I/O Dialog Box
Falcon / Eagle Input One digital input (XD, Falcon / Eagle: X), required. Output One digital output (YD, Falcon / Eagle: Y). Internal Parameters
Falcon / Eagle On time: Number type: whole number, Unit: Seconds
Default: 20 sec, Range: 0 through 7200 sec This value defines the duration of the high impulse level (impulse width).
CAUTION Zero, 0, is a legal value but should not be used because it disables the timer and does not accept on-line changes.

ALPHABETIC REFERENCE CONTROL ICONS
EN2Z-0940GE51 R0518 286
Off time: Number type: Whole number, Unit: Seconds Default: 0 sec, Range: 0 through 7200 sec This value defines the duration of the low impulse level (impulse pause).
Parameter Number Descriptions P3 On time (seconds) P4 Off time (seconds) CYC Operation On time establishes the duration of the high level while Off time establishes the
duration of the low level. Software sends the sequence to Output Y as long as a signal greater than or equal to 1 is present in Input X. Illustration:
Output Variations The output cycles only while the input is 1:
If the OFF time is set to 0, a single positive pulse is generated:
If the ON time is set to 0, a single negative pulse is generated:
CONTROL ICONS ALPHABETIC REFERENCE
39 EN2Z-0940GE51 R0518
If the input is removed mid-cycle, the output continues to complete that cycle.
Cycle Trend Example In many cases, trend logs include points whose values change frequently. Over a
lengthy time interval, these frequent variations in signal exhaust the capacity of the trend buffer.
See the Examples chapter for details on the use of the CYC icon in controlling output to the trend log (Trend Buffer Control example). The Examples chapter also describes an average value calculation that uses the CYC icon.
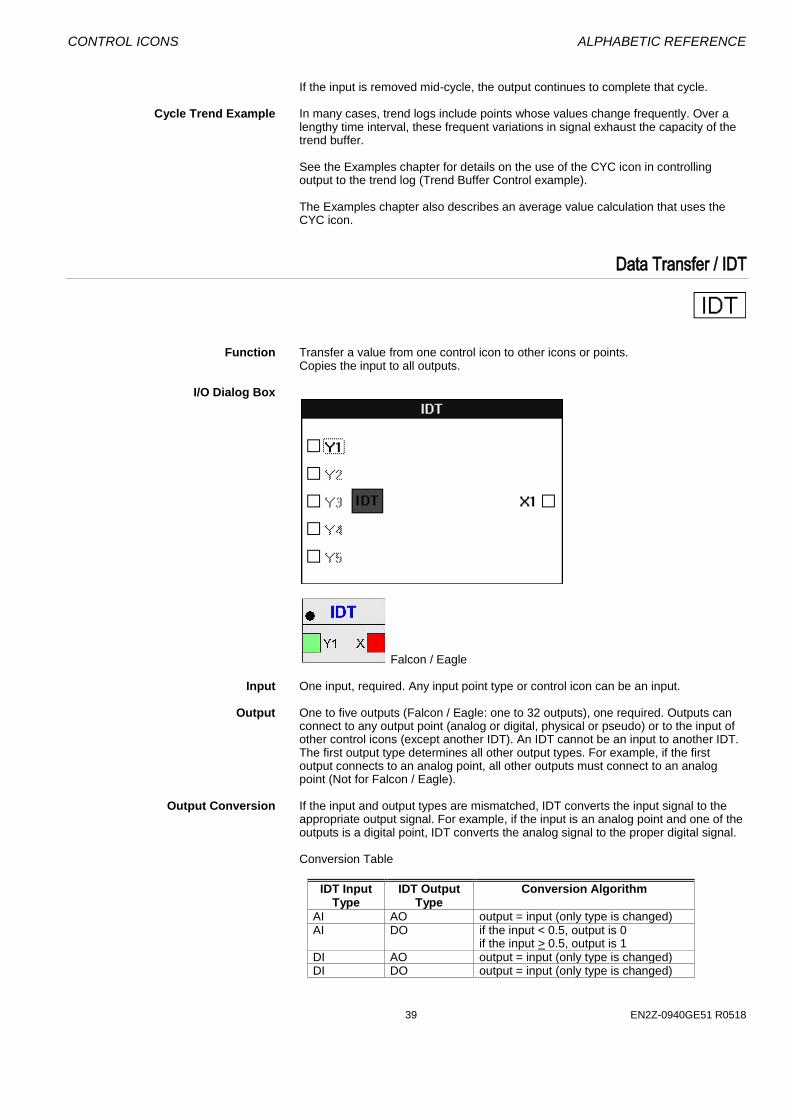
Data Transfer / IDT
Function Transfer a value from one control icon to other icons or points.
Copies the input to all outputs. I/O Dialog Box
Falcon / Eagle Input One input, required. Any input point type or control icon can be an input. Output One to five outputs (Falcon / Eagle: one to 32 outputs), one required. Outputs can
connect to any output point (analog or digital, physical or pseudo) or to the input of other control icons (except another IDT). An IDT cannot be an input to another IDT. The first output type determines all other output types. For example, if the first output connects to an analog point, all other outputs must connect to an analog point (Not for Falcon / Eagle).
Output Conversion If the input and output types are mismatched, IDT converts the input signal to the
appropriate output signal. For example, if the input is an analog point and one of the outputs is a digital point, IDT converts the analog signal to the proper digital signal.
Conversion Table
IDT Input Type
IDT Output Type
Conversion Algorithm
AI AO output = input (only type is changed) AI DO if the input < 0.5, output is 0
if the input > 0.5, output is 1 DI AO output = input (only type is changed) DI DO output = input (only type is changed)
ALPHABETIC REFERENCE CONTROL ICONS
EN2Z-0940GE51 R0518 286
Still valid for XL Web AI is an analog input (physical, pseudo, or flag). AO is an analog output (physical, pseudo, or flag). DI is a digital input (physical, pseudo, or flag). DO is a digital output (physical, pseudo, or flag).
Internal Parameters None.
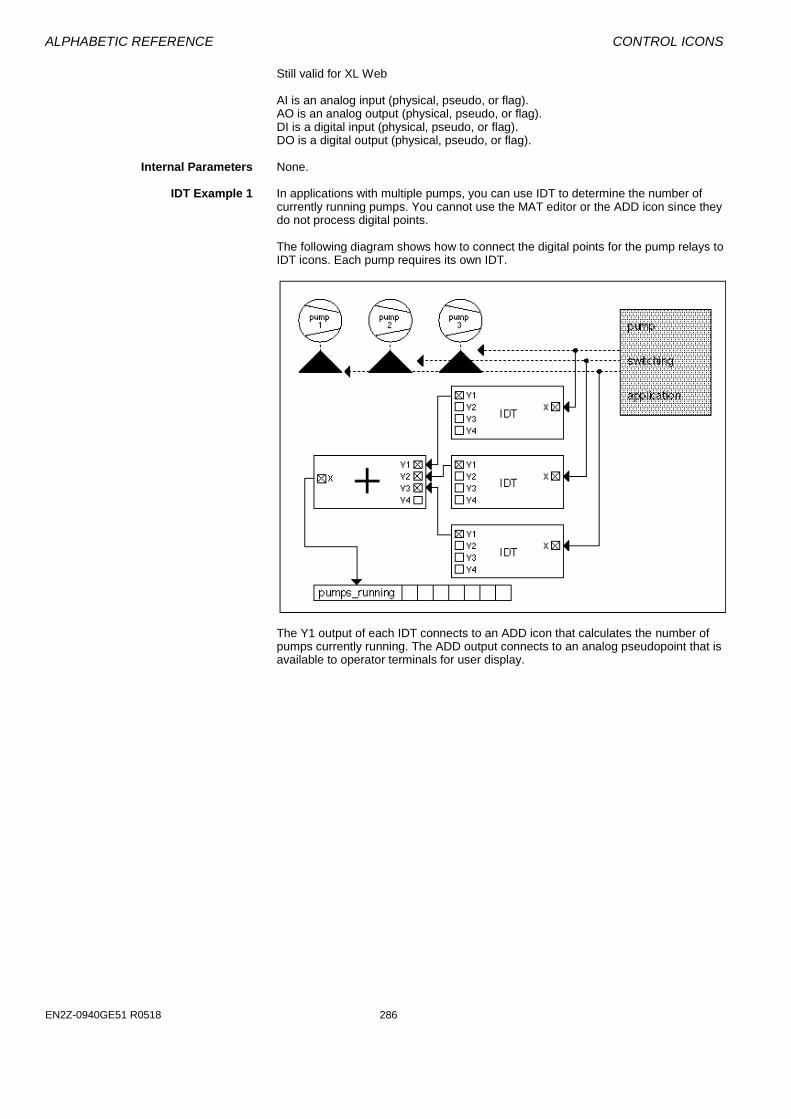
IDT Example 1 In applications with multiple pumps, you can use IDT to determine the number of
currently running pumps. You cannot use the MAT editor or the ADD icon since they do not process digital points.
The following diagram shows how to connect the digital points for the pump relays to IDT icons. Each pump requires its own IDT.
The Y1 output of each IDT connects to an ADD icon that calculates the number of pumps currently running. The ADD output connects to an analog pseudopoint that is available to operator terminals for user display.
CONTROL ICONS ALPHABETIC REFERENCE
41 EN2Z-0940GE51 R0518
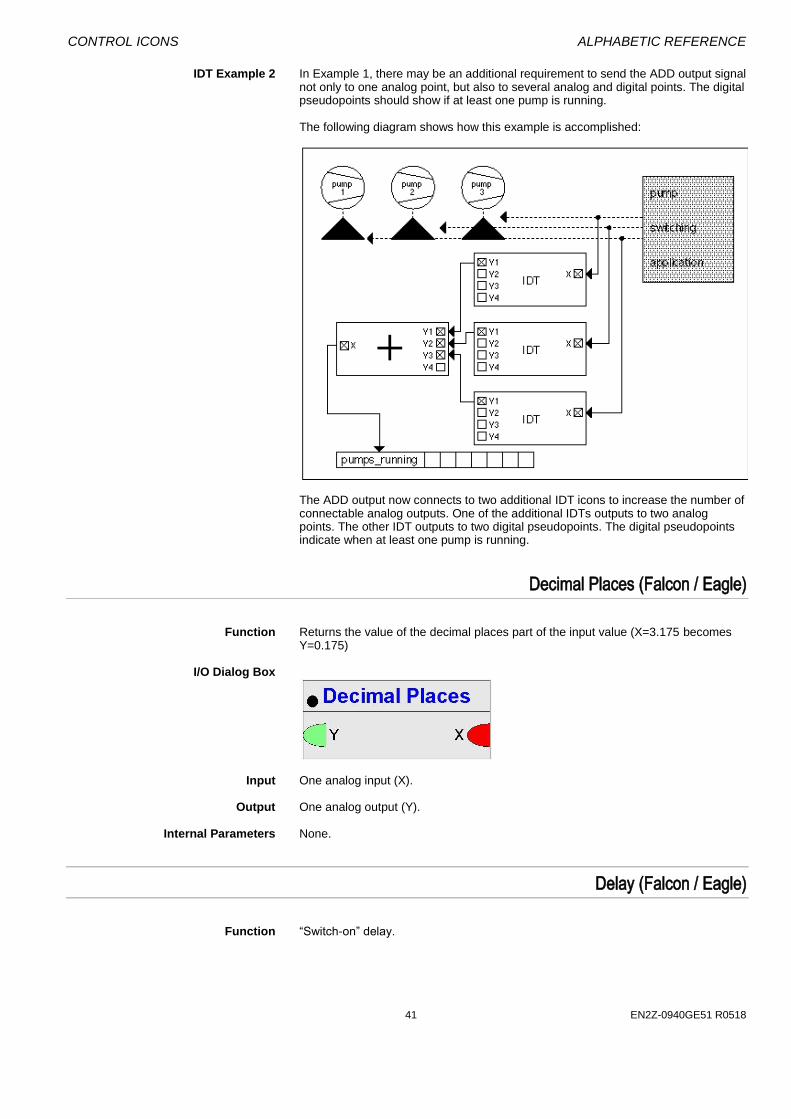
IDT Example 2 In Example 1, there may be an additional requirement to send the ADD output signal not only to one analog point, but also to several analog and digital points. The digital pseudopoints should show if at least one pump is running.
The following diagram shows how this example is accomplished:
The ADD output now connects to two additional IDT icons to increase the number of connectable analog outputs. One of the additional IDTs outputs to two analog points. The other IDT outputs to two digital pseudopoints. The digital pseudopoints indicate when at least one pump is running.
Decimal Places (Falcon / Eagle)
Function Returns the value of the decimal places part of the input value (X=3.175 becomes
Y=0.175) I/O Dialog Box
Input One analog input (X). Output One analog output (Y). Internal Parameters None.
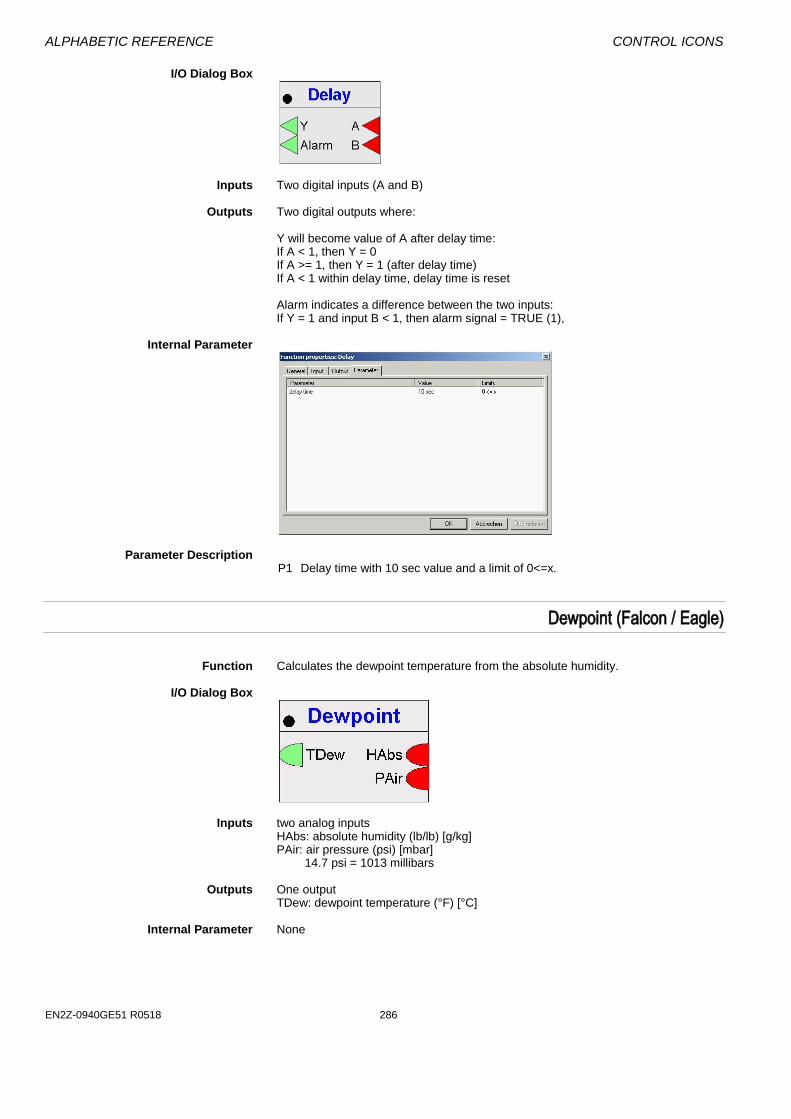
Delay (Falcon / Eagle)
Function “Switch-on” delay.
ALPHABETIC REFERENCE CONTROL ICONS
EN2Z-0940GE51 R0518 286
I/O Dialog Box
Inputs Two digital inputs (A and B) Outputs Two digital outputs where:
Y will become value of A after delay time:
If A < 1, then Y = 0 If A >= 1, then Y = 1 (after delay time) If A < 1 within delay time, delay time is reset Alarm indicates a difference between the two inputs: If Y = 1 and input B < 1, then alarm signal = TRUE (1),
Internal Parameter
Parameter Description P1 Delay time with 10 sec value and a limit of 0<=x.
Dewpoint (Falcon / Eagle)
Function Calculates the dewpoint temperature from the absolute humidity. I/O Dialog Box
Inputs two analog inputs
HAbs: absolute humidity (lb/lb) [g/kg] PAir: air pressure (psi) [mbar]
14.7 psi = 1013 millibars Outputs One output
TDew: dewpoint temperature (°F) [°C] Internal Parameter None
CONTROL ICONS ALPHABETIC REFERENCE
43 EN2Z-0940GE51 R0518
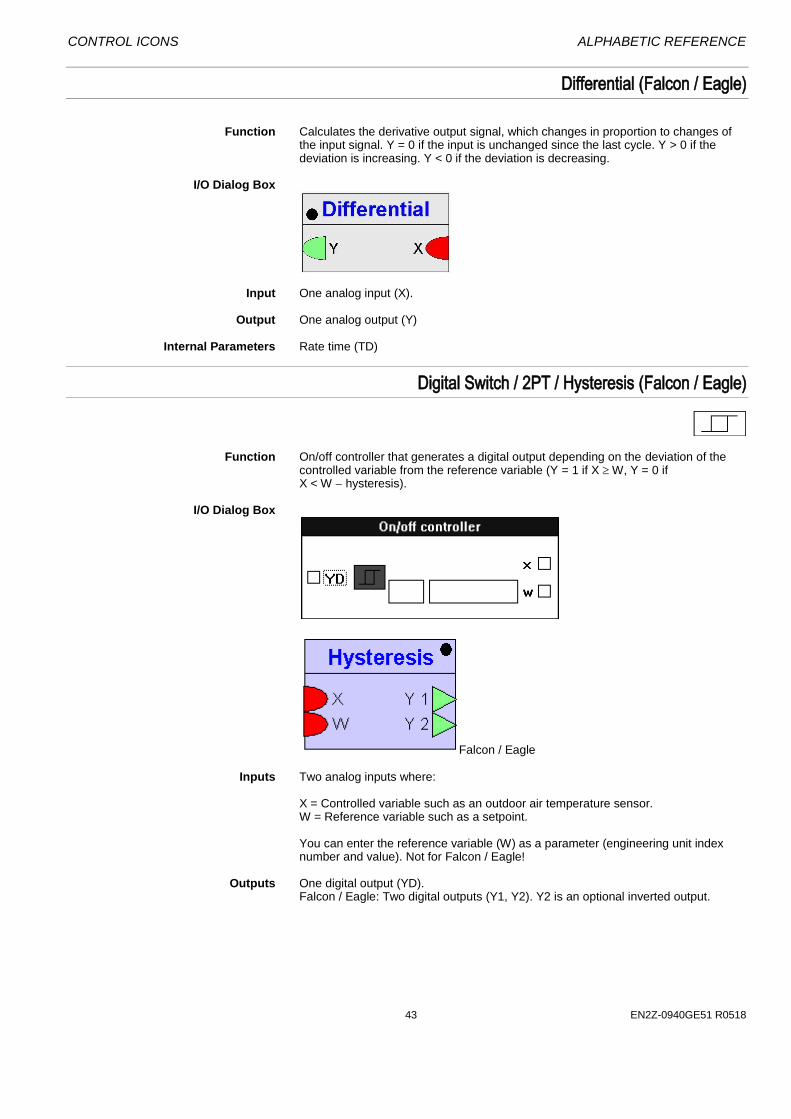
Differential (Falcon / Eagle)
Function Calculates the derivative output signal, which changes in proportion to changes of
the input signal. Y = 0 if the input is unchanged since the last cycle. Y > 0 if the deviation is increasing. Y < 0 if the deviation is decreasing.
I/O Dialog Box
Input One analog input (X). Output One analog output (Y) Internal Parameters Rate time (TD)
Digital Switch / 2PT / Hysteresis (Falcon / Eagle)
Function On/off controller that generates a digital output depending on the deviation of the
controlled variable from the reference variable (Y = 1 if X W, Y = 0 if X < W hysteresis).
I/O Dialog Box
Falcon / Eagle
Inputs Two analog inputs where:
X = Controlled variable such as an outdoor air temperature sensor. W = Reference variable such as a setpoint. You can enter the reference variable (W) as a parameter (engineering unit index number and value). Not for Falcon / Eagle!
Outputs One digital output (YD). Falcon / Eagle: Two digital outputs (Y1, Y2). Y2 is an optional inverted output.
ALPHABETIC REFERENCE CONTROL ICONS
EN2Z-0940GE51 R0518 286
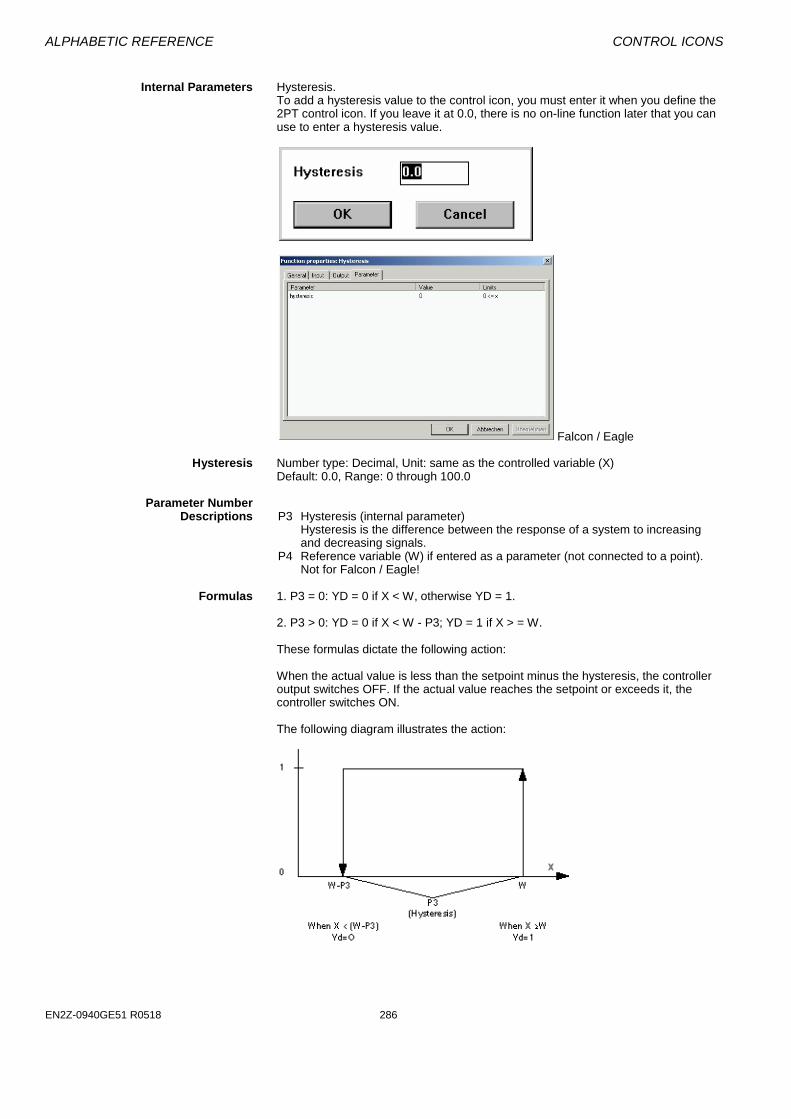
Internal Parameters Hysteresis.
To add a hysteresis value to the control icon, you must enter it when you define the 2PT control icon. If you leave it at 0.0, there is no on-line function later that you can use to enter a hysteresis value.
Falcon / Eagle
Hysteresis Number type: Decimal, Unit: same as the controlled variable (X) Default: 0.0, Range: 0 through 100.0 Parameter Number Descriptions P3 Hysteresis (internal parameter) Hysteresis is the difference between the response of a system to increasing
and decreasing signals. P4 Reference variable (W) if entered as a parameter (not connected to a point).
Not for Falcon / Eagle! Formulas 1. P3 = 0: YD = 0 if X < W, otherwise YD = 1. 2. P3 > 0: YD = 0 if X < W - P3; YD = 1 if X > = W.
These formulas dictate the following action: When the actual value is less than the setpoint minus the hysteresis, the controller output switches OFF. If the actual value reaches the setpoint or exceeds it, the controller switches ON. The following diagram illustrates the action:
CONTROL ICONS ALPHABETIC REFERENCE
45 EN2Z-0940GE51 R0518
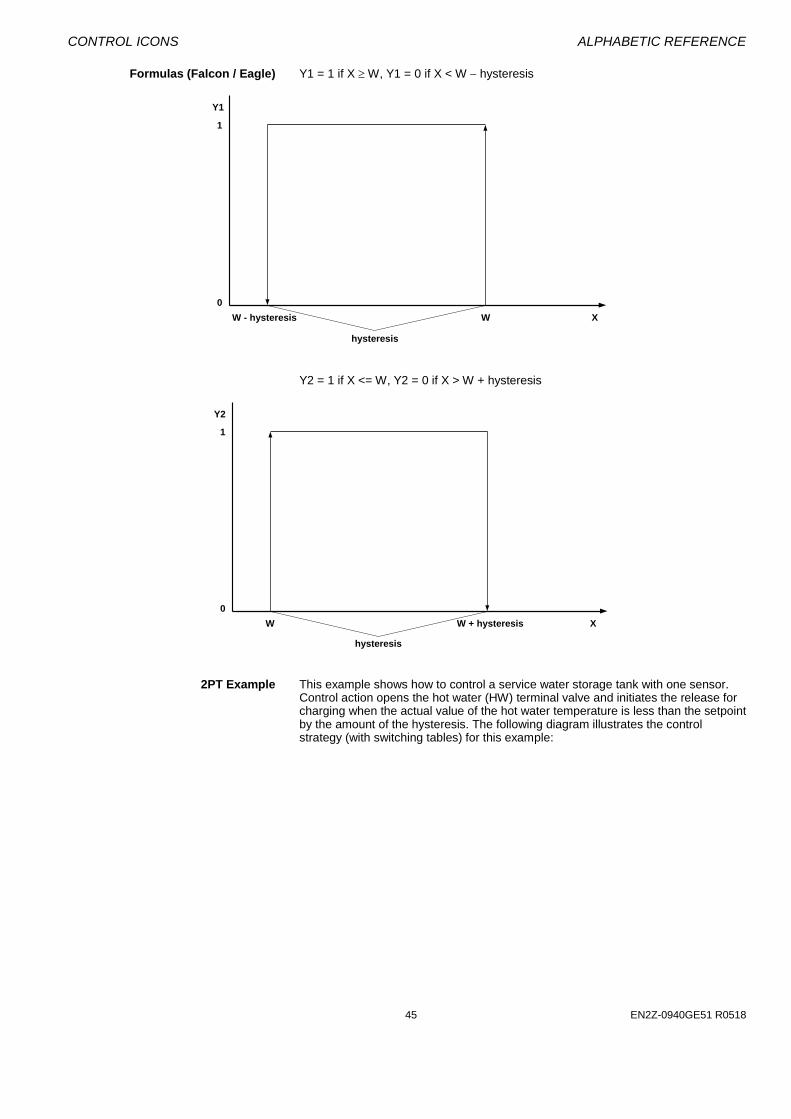
Formulas (Falcon / Eagle) Y1 = 1 if X W, Y1 = 0 if X < W hysteresis
Y2 = 1 if X <= W, Y2 = 0 if X > W + hysteresis
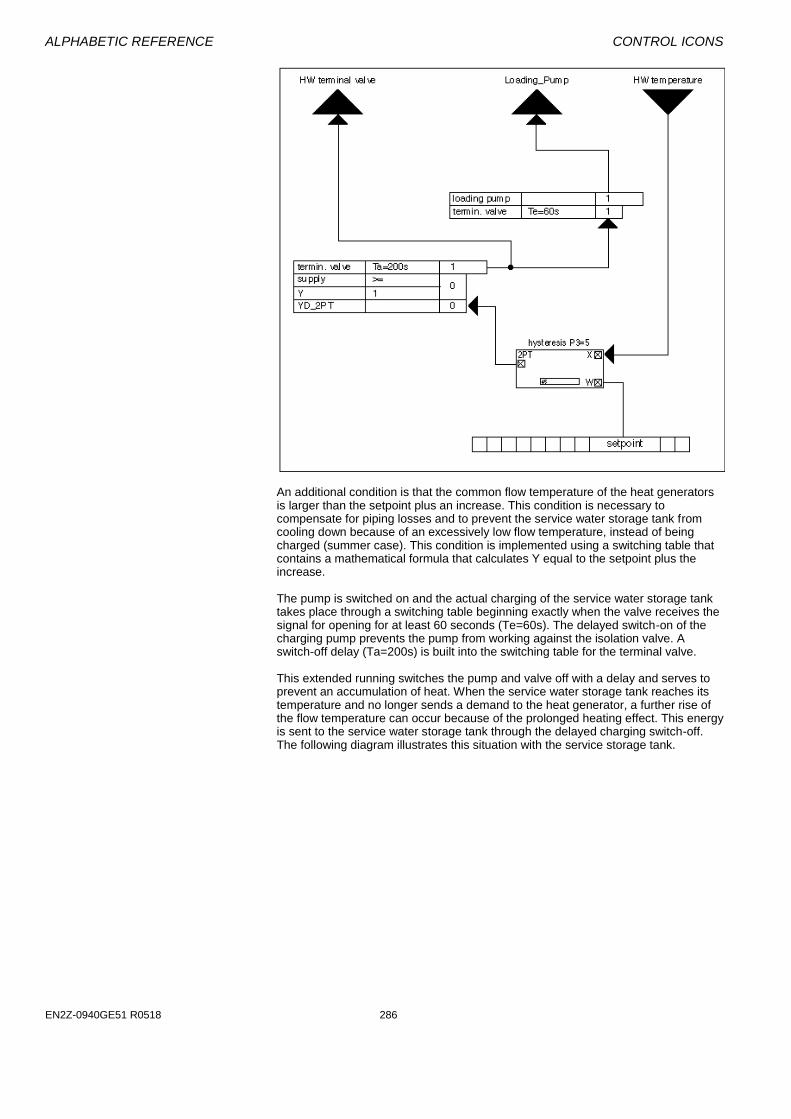
2PT Example This example shows how to control a service water storage tank with one sensor.
Control action opens the hot water (HW) terminal valve and initiates the release for charging when the actual value of the hot water temperature is less than the setpoint by the amount of the hysteresis. The following diagram illustrates the control strategy (with switching tables) for this example:
X
1
0
W - hysteresis W
hysteresis
Y1
X
1
0
W W + hysteresis
hysteresis
Y2
ALPHABETIC REFERENCE CONTROL ICONS
EN2Z-0940GE51 R0518 286
An additional condition is that the common flow temperature of the heat generators is larger than the setpoint plus an increase. This condition is necessary to compensate for piping losses and to prevent the service water storage tank from cooling down because of an excessively low flow temperature, instead of being charged (summer case). This condition is implemented using a switching table that contains a mathematical formula that calculates Y equal to the setpoint plus the increase.
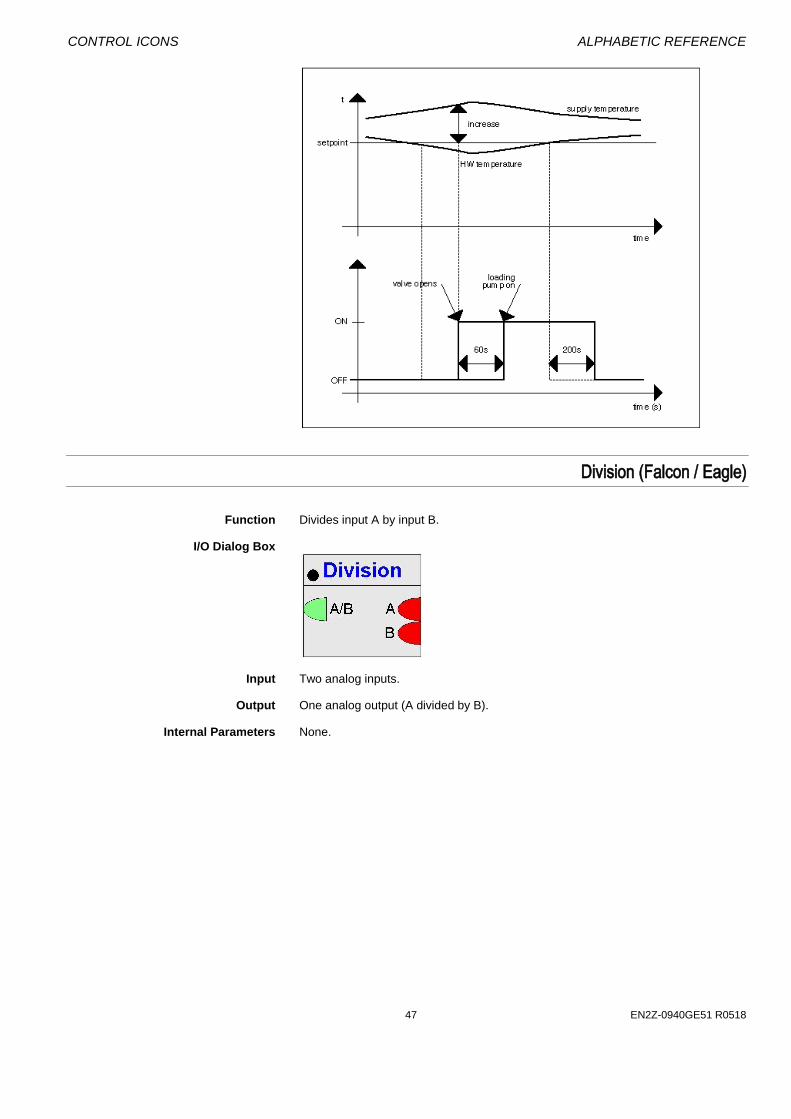
The pump is switched on and the actual charging of the service water storage tank takes place through a switching table beginning exactly when the valve receives the signal for opening for at least 60 seconds (Te=60s). The delayed switch-on of the charging pump prevents the pump from working against the isolation valve. A switch-off delay (Ta=200s) is built into the switching table for the terminal valve.
This extended running switches the pump and valve off with a delay and serves to prevent an accumulation of heat. When the service water storage tank reaches its temperature and no longer sends a demand to the heat generator, a further rise of the flow temperature can occur because of the prolonged heating effect. This energy is sent to the service water storage tank through the delayed charging switch-off. The following diagram illustrates this situation with the service storage tank.
CONTROL ICONS ALPHABETIC REFERENCE
47 EN2Z-0940GE51 R0518
Division (Falcon / Eagle)
Function Divides input A by input B. I/O Dialog Box
Input Two analog inputs. Output One analog output (A divided by B). Internal Parameters None.
ALPHABETIC REFERENCE CONTROL ICONS
EN2Z-0940GE51 R0518 286
Duty Cycle / DUC
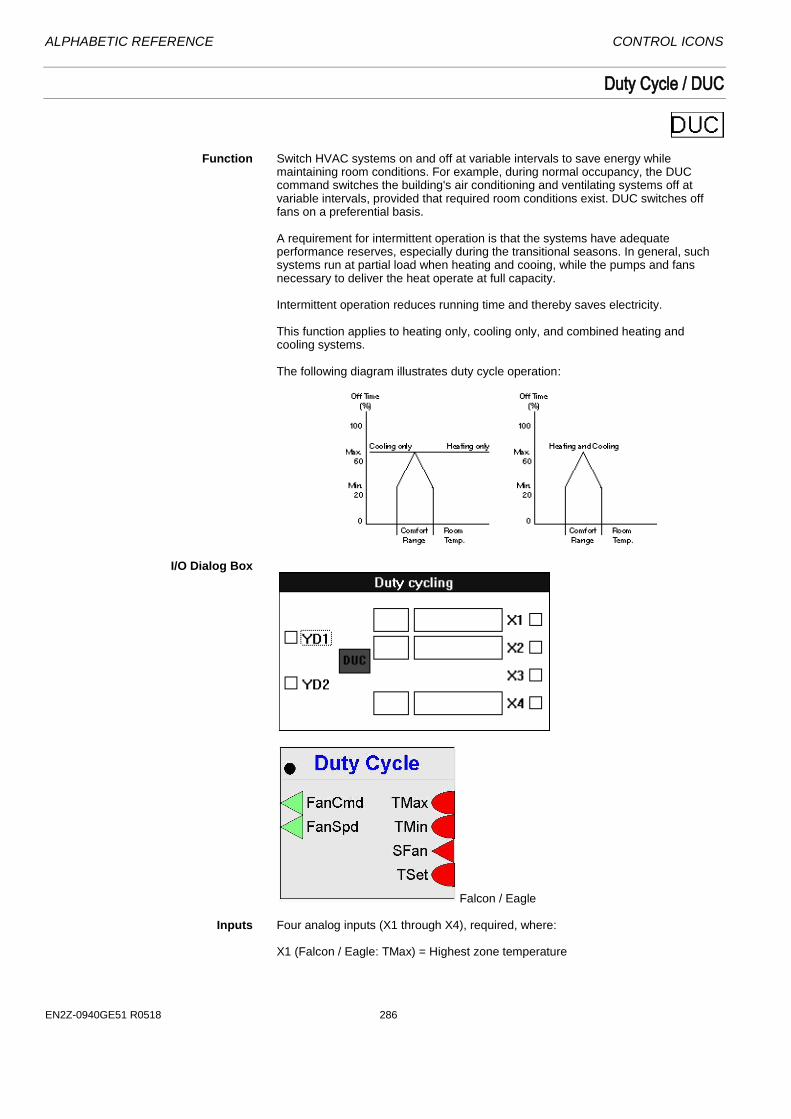
Function Switch HVAC systems on and off at variable intervals to save energy while
maintaining room conditions. For example, during normal occupancy, the DUC command switches the building's air conditioning and ventilating systems off at variable intervals, provided that required room conditions exist. DUC switches off fans on a preferential basis.
A requirement for intermittent operation is that the systems have adequate performance reserves, especially during the transitional seasons. In general, such systems run at partial load when heating and cooing, while the pumps and fans necessary to deliver the heat operate at full capacity. Intermittent operation reduces running time and thereby saves electricity. This function applies to heating only, cooling only, and combined heating and cooling systems. The following diagram illustrates duty cycle operation:
I/O Dialog Box
Falcon / Eagle Inputs Four analog inputs (X1 through X4), required, where:
X1 (Falcon / Eagle: TMax) = Highest zone temperature

CONTROL ICONS ALPHABETIC REFERENCE
49 EN2Z-0940GE51 R0518
The highest zone temperature indicates a need for cooling. For example, X1 (TMax) can be a selection of the maximum of all room temperatures in a zone (MAX icon).
X2 (Falcon / Eagle: TMin) = Lowest zone temperature The lowest zone temperature indicates a need for heating. For example,
X2 (TMin) can be a selection of the minimum of all room temperatures in a zone (MIN icon).
X3 (Falcon / Eagle: SFan) = Fan status 1 = off, 2 = fast (for two-speed fans), 3 = slow (for single-speed fans)
X4 (Falcon / Eagle: TSet) = Setpoint You can enter the X1, X2, and X4 input values as parameters (engineering unit index number and value for each parameter). Not for Falcon / Eagle!
Outputs Two digital outputs, where:
YD1 = Single-stage fan speed 1: 0 = off, 1 = on YD2= Two-stage fan speed 2: 0 = slow, 1 = fast Falcon / Eagle: FanCmd = Single-stage fan command 1: 0 = off, 1 = on FanSpd= Two-stage fan speed 2: 0 = slow, 1 = fast These outputs can also be heating system pumps.
Internal Parameters
Falcon / Eagle Comfort range [+/-] Number type: Decimal, Unit: F Deg
Default: 5 F Deg (10.0K), Range: 0 through 54 F Deg (30.0K) DUC uses this value to calculate zone comfort limits around the setpoint (X4).

ALPHABETIC REFERENCE CONTROL ICONS
EN2Z-0940GE51 R0518 286
Maximum off time Number type: Decimal, Unit: percent Default: 50.0 percent, Range: 25 through 80.0 percent Select a Maximum off time for the output (YD1 or YD2, for example, a supply fan) that guarantees an adequate air change (minimum outdoor air rate per person). This value refers to cycle duration.
Minimum off time Number type: Decimal, Unit: percent
Default: 0.0 percent, Range: 5 through 50.0 percent Select a Minimum off time that prevents the fan motor from overheating. This value refers to cycle duration.
Cycle time Number type: Whole number, Unit: Minutes
Default: 30 min., Range: 5 through 60 min. Select a Cycle time that ensures that the fan motor does not switch on more often than the allowable number of times per hour.
Duty cycle type Determines the system type (Heating, Cooling, or Heating and cooling). Fan type Determines whether or not the system has a two-speed fan. Internal Parameters Additional parameters in Falcon / Eagle.
temperature setpoint Zone temperature setpoint
with value 3 and a limit of 5 < = x < = 40.
duty cycle type Indication of available heating and cooling possibilities, with value 1 and a limit of 1 < = x < = 3 (1=heating, 2=cooling, 3=heating and cooling).
Parameter Number Descriptions P3 Comfort range (±). P4 Maximum off time. P5 Minimum off time. P6 Cycle time. P7 System type: 1=heating 2=cooling 3=heating and cooling P8 Fan type: 1=Two-speed fan 0=Single-speed fan P9 Highest zone temperature* P10 Lowest zone temperature* P11 Setpoint* * These values are only available in the controller if you enter them as
parameters. NIPU and DUC Operation Using both NIPU and DUC in a system can result in command conflicts. You should
use switching tables to force NIPU to override DUC commands. No Fixed Off Times DUC does not work with fixed off times. Off time duration varies as a function of the
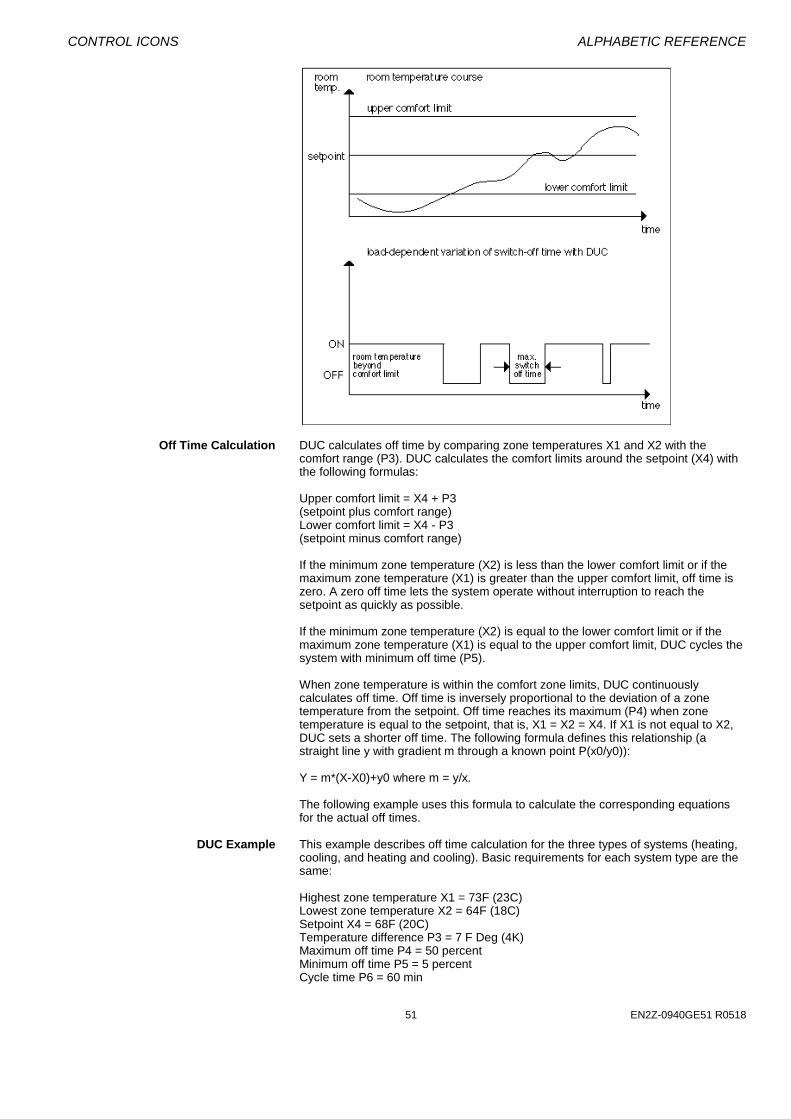
system load within limits you define. The following diagram illustrates how the load-corrected off-time duration function operates in DUC.
CONTROL ICONS ALPHABETIC REFERENCE
51 EN2Z-0940GE51 R0518
Off Time Calculation DUC calculates off time by comparing zone temperatures X1 and X2 with the
comfort range (P3). DUC calculates the comfort limits around the setpoint (X4) with the following formulas:
Upper comfort limit = X4 + P3 (setpoint plus comfort range) Lower comfort limit = X4 - P3 (setpoint minus comfort range) If the minimum zone temperature (X2) is less than the lower comfort limit or if the maximum zone temperature (X1) is greater than the upper comfort limit, off time is zero. A zero off time lets the system operate without interruption to reach the setpoint as quickly as possible. If the minimum zone temperature (X2) is equal to the lower comfort limit or if the maximum zone temperature (X1) is equal to the upper comfort limit, DUC cycles the system with minimum off time (P5). When zone temperature is within the comfort zone limits, DUC continuously calculates off time. Off time is inversely proportional to the deviation of a zone temperature from the setpoint. Off time reaches its maximum (P4) when zone temperature is equal to the setpoint, that is, X1 = X2 = X4. If X1 is not equal to X2, DUC sets a shorter off time. The following formula defines this relationship (a straight line y with gradient m through a known point P(x0/y0)): Y = m*(X-X0)+y0 where m = y/x. The following example uses this formula to calculate the corresponding equations for the actual off times.
DUC Example This example describes off time calculation for the three types of systems (heating,
cooling, and heating and cooling). Basic requirements for each system type are the same:
Highest zone temperature X1 = 73F (23C) Lowest zone temperature X2 = 64F (18C) Setpoint X4 = 68F (20C) Temperature difference P3 = 7 F Deg (4K) Maximum off time P4 = 50 percent Minimum off time P5 = 5 percent Cycle time P6 = 60 min
ALPHABETIC REFERENCE CONTROL ICONS
EN2Z-0940GE51 R0518 286
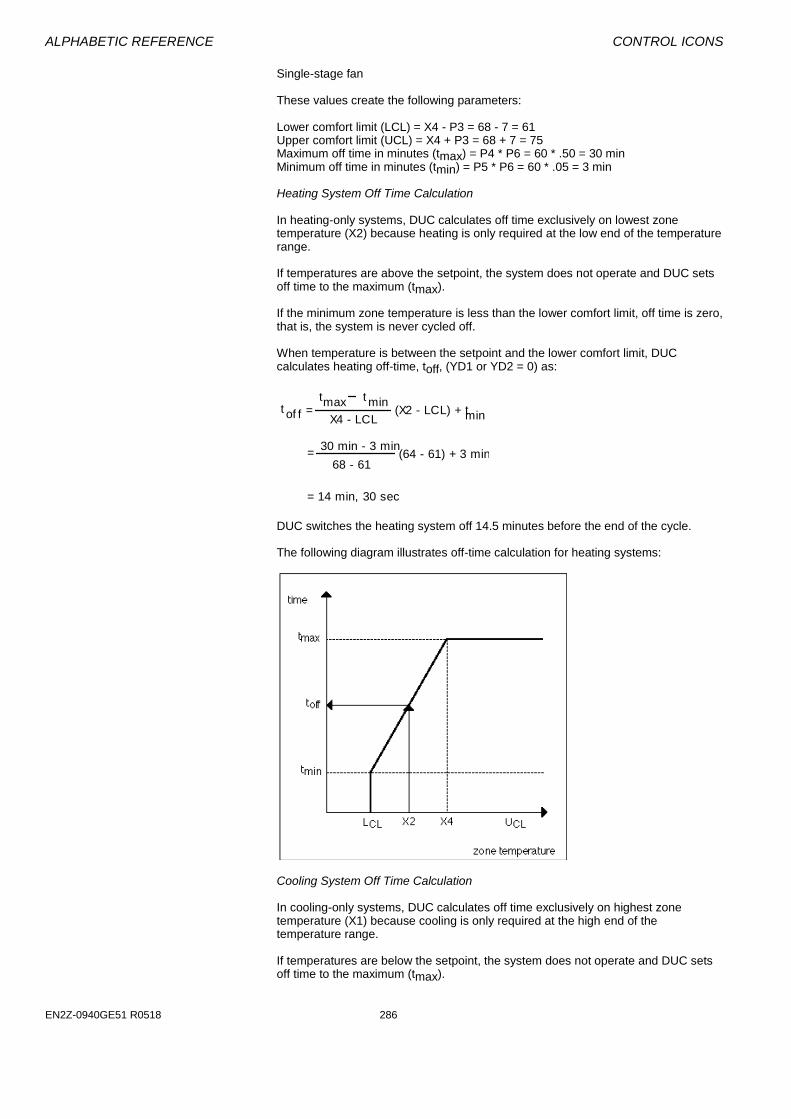
Single-stage fan These values create the following parameters: Lower comfort limit (LCL) = X4 - P3 = 68 - 7 = 61 Upper comfort limit (UCL) = X4 + P3 = 68 + 7 = 75 Maximum off time in minutes (tmax) = P4 * P6 = 60 * .50 = 30 min Minimum off time in minutes (tmin) = P5 * P6 = 60 * .05 = 3 min Heating System Off Time Calculation In heating-only systems, DUC calculates off time exclusively on lowest zone temperature (X2) because heating is only required at the low end of the temperature range. If temperatures are above the setpoint, the system does not operate and DUC sets off time to the maximum (tmax). If the minimum zone temperature is less than the lower comfort limit, off time is zero, that is, the system is never cycled off. When temperature is between the setpoint and the lower comfort limit, DUC calculates heating off-time, toff, (YD1 or YD2 = 0) as:
t = t t
X4 - LCL(X2 - LCL) + t
minmaxof f min
= 30 min - 3 min
68 - 61(64 - 61) + 3 min
= 14 min, 30 sec
DUC switches the heating system off 14.5 minutes before the end of the cycle. The following diagram illustrates off-time calculation for heating systems:
Cooling System Off Time Calculation In cooling-only systems, DUC calculates off time exclusively on highest zone temperature (X1) because cooling is only required at the high end of the temperature range. If temperatures are below the setpoint, the system does not operate and DUC sets off time to the maximum (tmax).
CONTROL ICONS ALPHABETIC REFERENCE
53 EN2Z-0940GE51 R0518
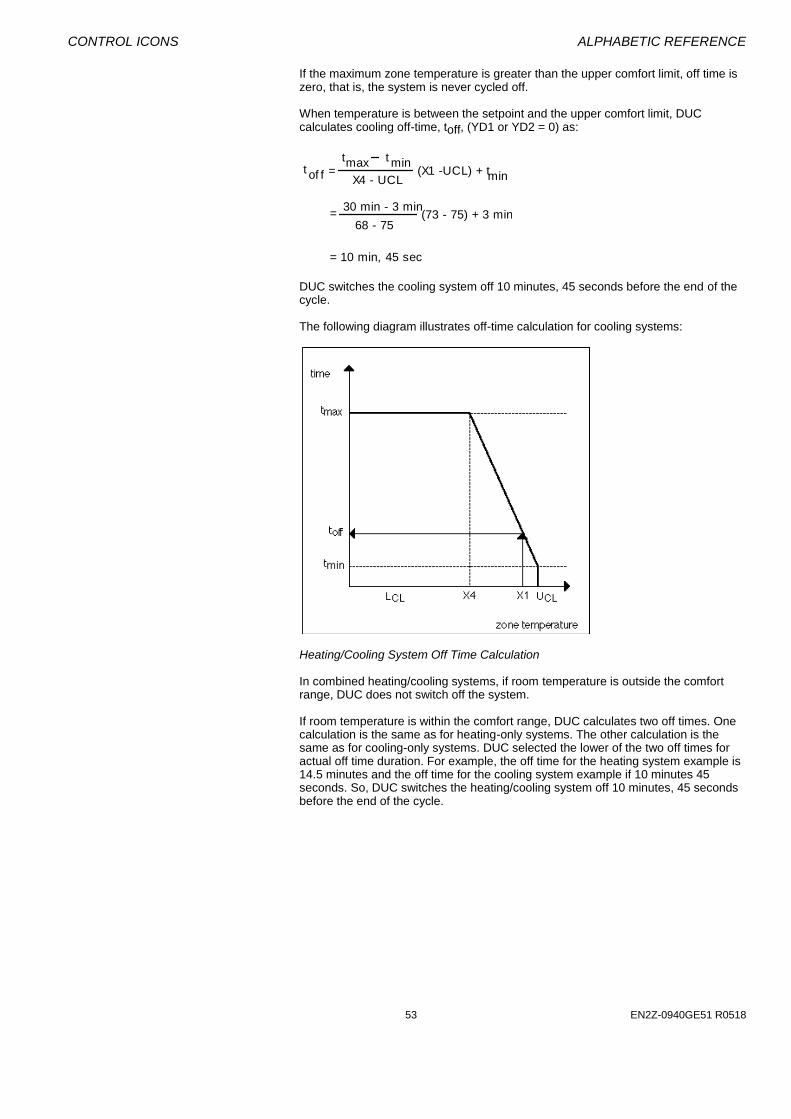
If the maximum zone temperature is greater than the upper comfort limit, off time is zero, that is, the system is never cycled off. When temperature is between the setpoint and the upper comfort limit, DUC calculates cooling off-time, toff, (YD1 or YD2 = 0) as:
t = t t
X4 - UCL(X1 -UCL) + t
minmaxof f min
= 30 min - 3 min
68 - 75(73 - 75) + 3 min
= 10 min, 45 sec
DUC switches the cooling system off 10 minutes, 45 seconds before the end of the cycle. The following diagram illustrates off-time calculation for cooling systems:
Heating/Cooling System Off Time Calculation In combined heating/cooling systems, if room temperature is outside the comfort range, DUC does not switch off the system. If room temperature is within the comfort range, DUC calculates two off times. One calculation is the same as for heating-only systems. The other calculation is the same as for cooling-only systems. DUC selected the lower of the two off times for actual off time duration. For example, the off time for the heating system example is 14.5 minutes and the off time for the cooling system example if 10 minutes 45 seconds. So, DUC switches the heating/cooling system off 10 minutes, 45 seconds before the end of the cycle.

ALPHABETIC REFERENCE CONTROL ICONS
EN2Z-0940GE51 R0518 286
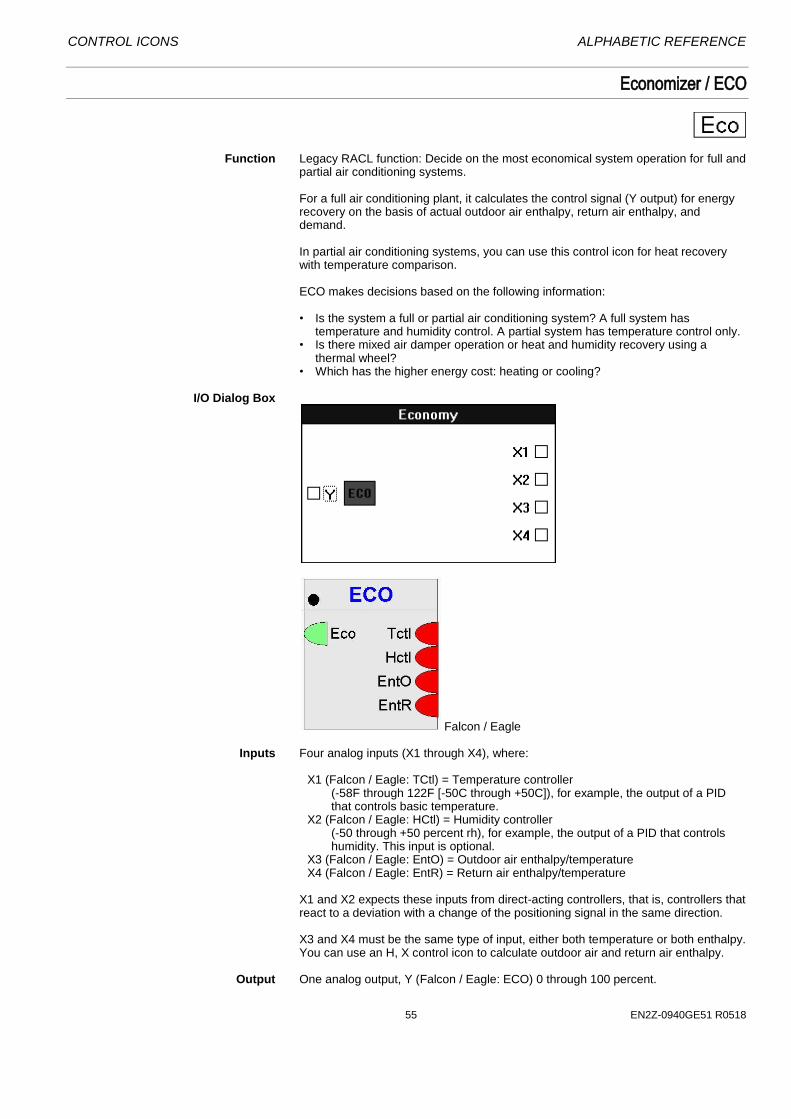
CONTROL ICONS ALPHABETIC REFERENCE
55 EN2Z-0940GE51 R0518
Economizer / ECO
Function Legacy RACL function: Decide on the most economical system operation for full and
partial air conditioning systems.
For a full air conditioning plant, it calculates the control signal (Y output) for energy recovery on the basis of actual outdoor air enthalpy, return air enthalpy, and demand. In partial air conditioning systems, you can use this control icon for heat recovery with temperature comparison. ECO makes decisions based on the following information:
• Is the system a full or partial air conditioning system? A full system has
temperature and humidity control. A partial system has temperature control only. • Is there mixed air damper operation or heat and humidity recovery using a
thermal wheel? • Which has the higher energy cost: heating or cooling?
I/O Dialog Box
Falcon / Eagle Inputs Four analog inputs (X1 through X4), where:
X1 (Falcon / Eagle: TCtl) = Temperature controller (-58F through 122F [-50C through +50C]), for example, the output of a PID that controls basic temperature.
X2 (Falcon / Eagle: HCtl) = Humidity controller (-50 through +50 percent rh), for example, the output of a PID that controls humidity. This input is optional.
X3 (Falcon / Eagle: EntO) = Outdoor air enthalpy/temperature X4 (Falcon / Eagle: EntR) = Return air enthalpy/temperature
X1 and X2 expects these inputs from direct-acting controllers, that is, controllers that react to a deviation with a change of the positioning signal in the same direction. X3 and X4 must be the same type of input, either both temperature or both enthalpy. You can use an H, X control icon to calculate outdoor air and return air enthalpy.
Output One analog output, Y (Falcon / Eagle: ECO) 0 through 100 percent.
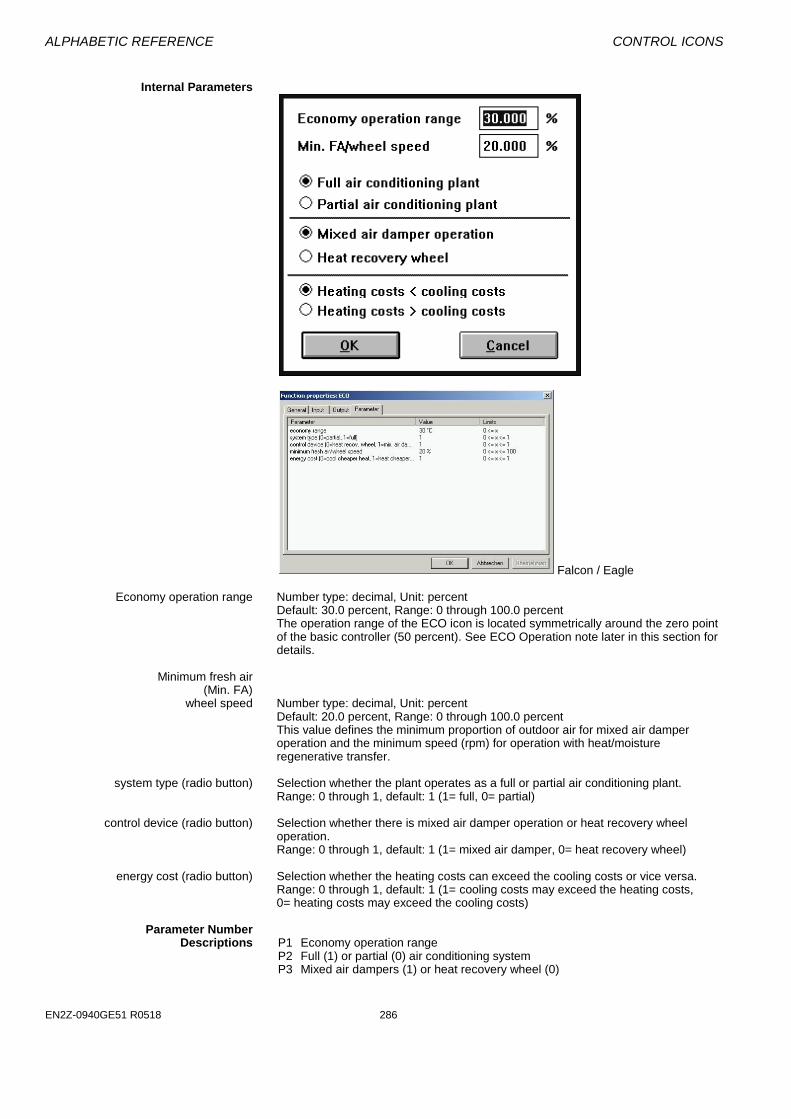
ALPHABETIC REFERENCE CONTROL ICONS
EN2Z-0940GE51 R0518 286
Internal Parameters
Falcon / Eagle Economy operation range Number type: decimal, Unit: percent
Default: 30.0 percent, Range: 0 through 100.0 percent The operation range of the ECO icon is located symmetrically around the zero point of the basic controller (50 percent). See ECO Operation note later in this section for details.
Minimum fresh air (Min. FA) wheel speed Number type: decimal, Unit: percent
Default: 20.0 percent, Range: 0 through 100.0 percent This value defines the minimum proportion of outdoor air for mixed air damper operation and the minimum speed (rpm) for operation with heat/moisture regenerative transfer.
system type (radio button) Selection whether the plant operates as a full or partial air conditioning plant.
Range: 0 through 1, default: 1 (1= full, 0= partial) control device (radio button) Selection whether there is mixed air damper operation or heat recovery wheel
operation. Range: 0 through 1, default: 1 (1= mixed air damper, 0= heat recovery wheel)
energy cost (radio button) Selection whether the heating costs can exceed the cooling costs or vice versa.
Range: 0 through 1, default: 1 (1= cooling costs may exceed the heating costs, 0= heating costs may exceed the cooling costs)
Parameter Number Descriptions P1 Economy operation range P2 Full (1) or partial (0) air conditioning system P3 Mixed air dampers (1) or heat recovery wheel (0)
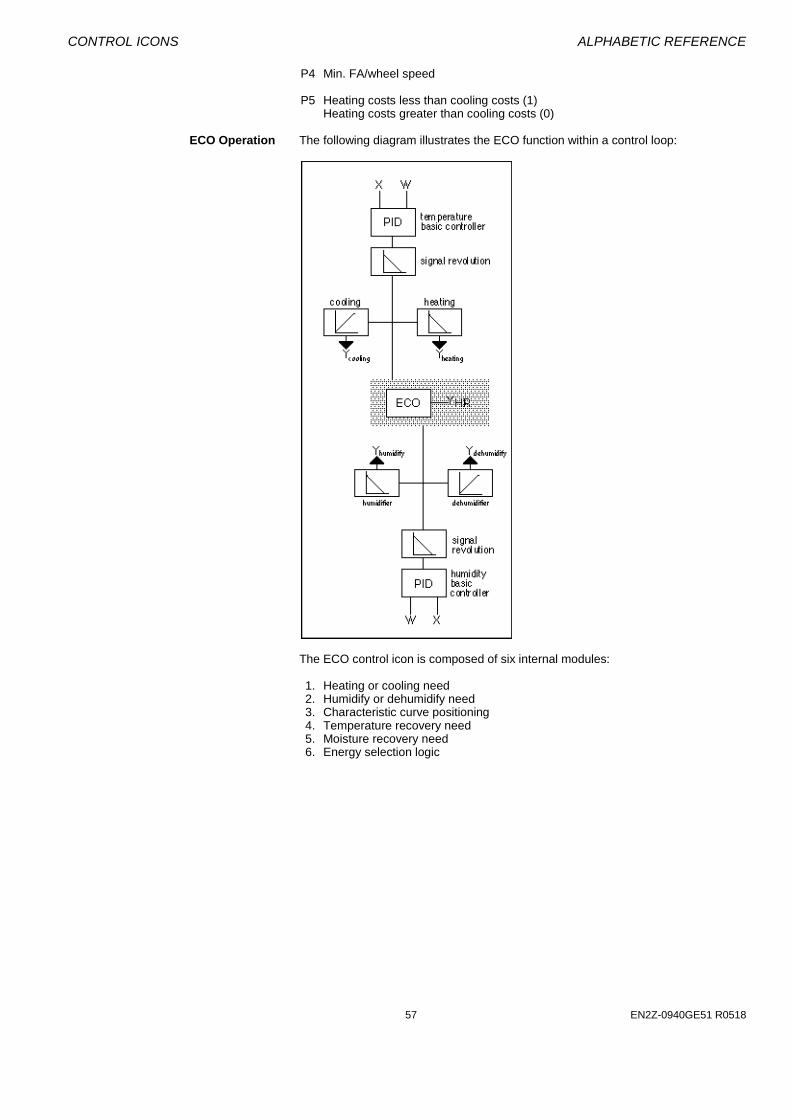
CONTROL ICONS ALPHABETIC REFERENCE
57 EN2Z-0940GE51 R0518
P4 Min. FA/wheel speed P5 Heating costs less than cooling costs (1) Heating costs greater than cooling costs (0) ECO Operation The following diagram illustrates the ECO function within a control loop:
The ECO control icon is composed of six internal modules: 1. Heating or cooling need 2. Humidify or dehumidify need 3. Characteristic curve positioning 4. Temperature recovery need 5. Moisture recovery need 6. Energy selection logic
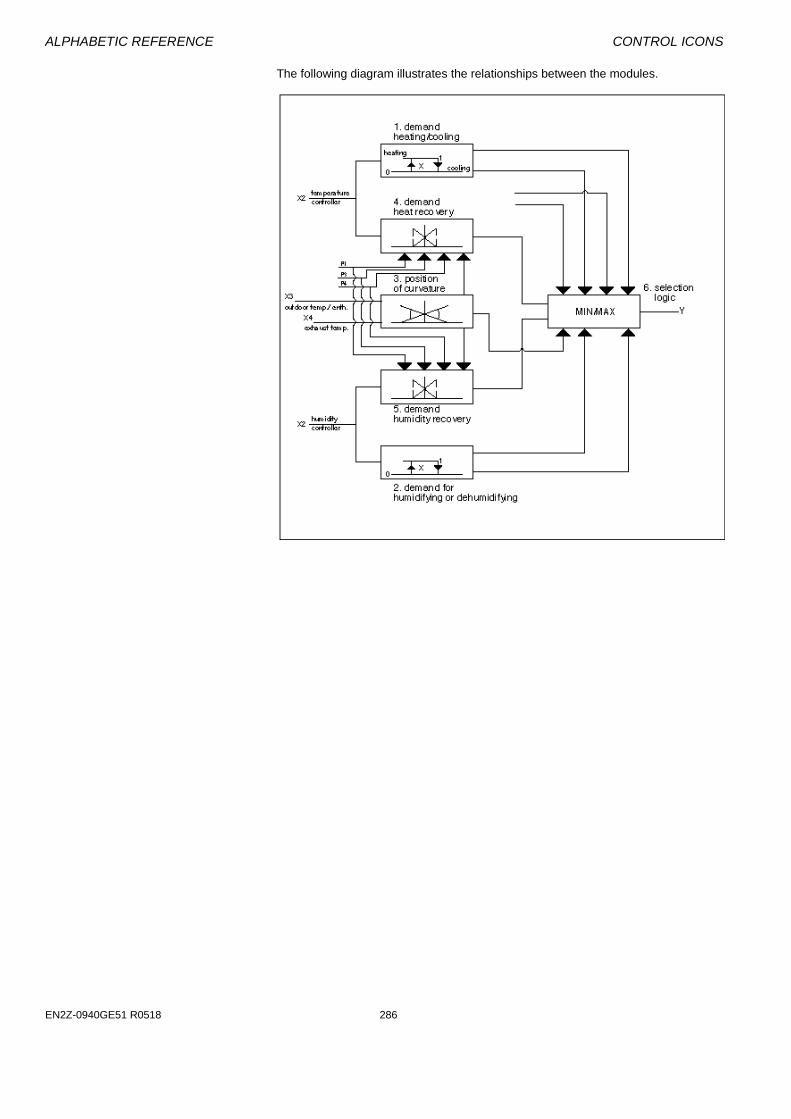
ALPHABETIC REFERENCE CONTROL ICONS
EN2Z-0940GE51 R0518 286
The following diagram illustrates the relationships between the modules.
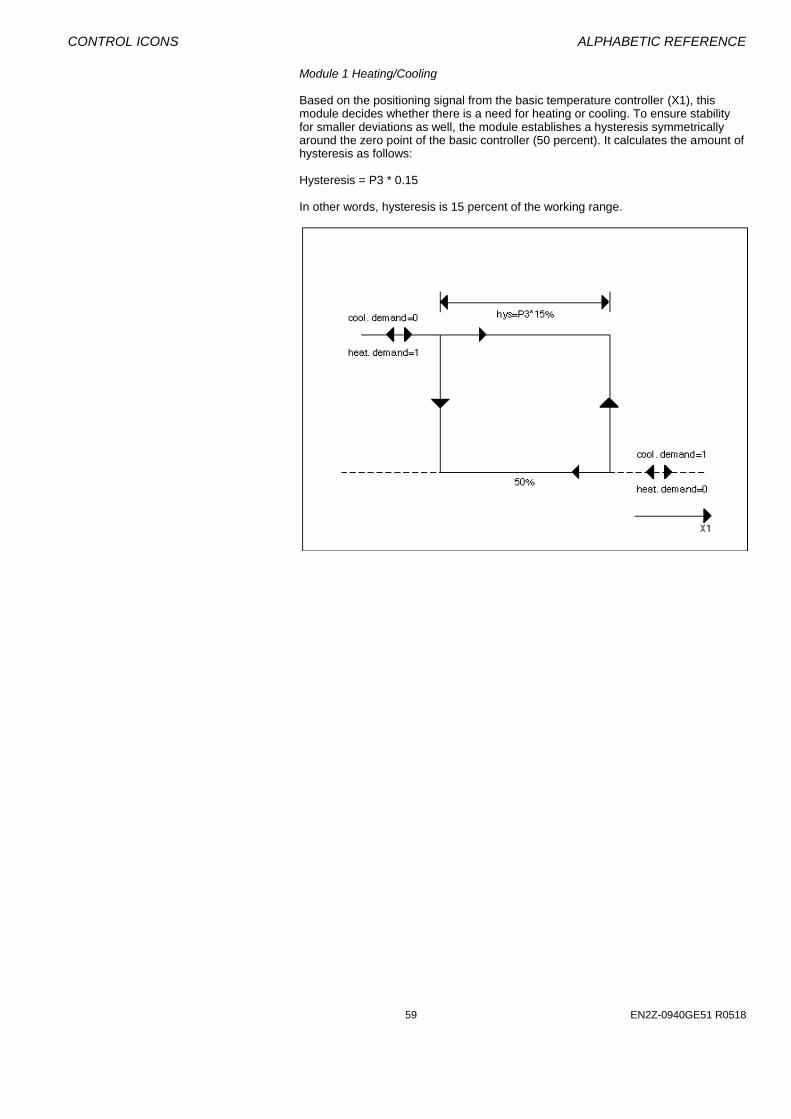
CONTROL ICONS ALPHABETIC REFERENCE
59 EN2Z-0940GE51 R0518
Module 1 Heating/Cooling
Based on the positioning signal from the basic temperature controller (X1), this module decides whether there is a need for heating or cooling. To ensure stability for smaller deviations as well, the module establishes a hysteresis symmetrically around the zero point of the basic controller (50 percent). It calculates the amount of hysteresis as follows:
Hysteresis = P3 * 0.15 In other words, hysteresis is 15 percent of the working range.
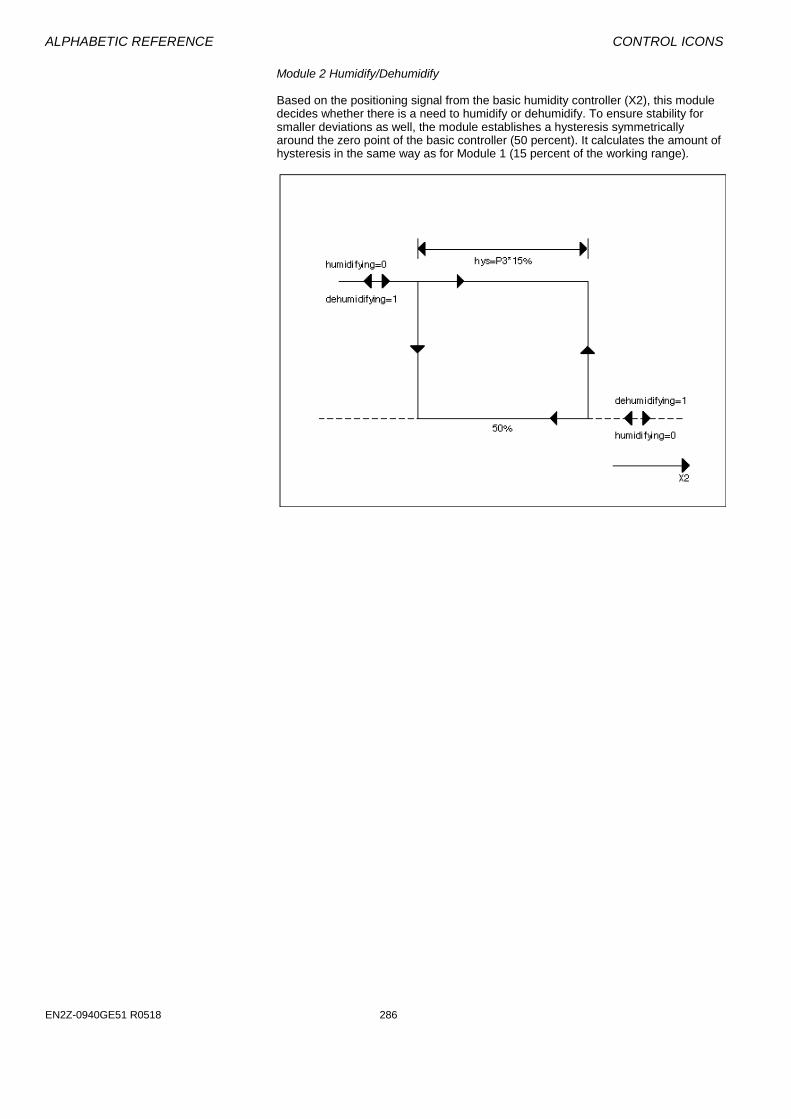
ALPHABETIC REFERENCE CONTROL ICONS
EN2Z-0940GE51 R0518 286
Module 2 Humidify/Dehumidify
Based on the positioning signal from the basic humidity controller (X2), this module decides whether there is a need to humidify or dehumidify. To ensure stability for smaller deviations as well, the module establishes a hysteresis symmetrically around the zero point of the basic controller (50 percent). It calculates the amount of hysteresis in the same way as for Module 1 (15 percent of the working range).

CONTROL ICONS ALPHABETIC REFERENCE
61 EN2Z-0940GE51 R0518
Module 3 Characteristic Curve This module calculates the position of the characteristic curve of the ECO icon on the basis of outdoor air enthalpy and return air enthalpy in full air conditioning systems, or on the basis of outdoor air temperature and return air temperature in partial air conditioning systems. The following conditions apply: Gradient of the characteristic curve is positive if: hAL > hAbL in full air conditioning systems tAL > tAbL in partial air conditioning systems Gradient of the characteristic curve is negative if: hAL < hAbL in full air conditioning systems tAL < tAbL in partial air conditioning systems Where: hAL is outdoor air enthalpy hAbL is return air enthalpy tAL is outdoor air temperature tAbL is return air temperature
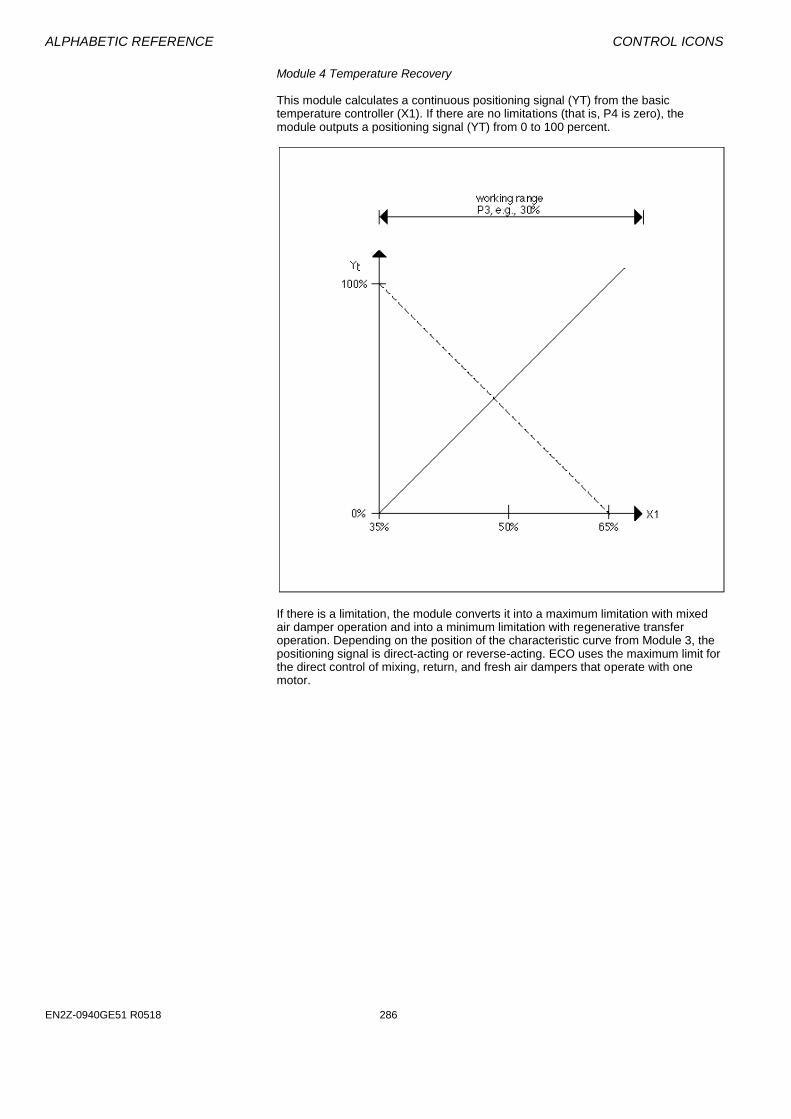
ALPHABETIC REFERENCE CONTROL ICONS
EN2Z-0940GE51 R0518 286
Module 4 Temperature Recovery This module calculates a continuous positioning signal (YT) from the basic temperature controller (X1). If there are no limitations (that is, P4 is zero), the module outputs a positioning signal (YT) from 0 to 100 percent.
If there is a limitation, the module converts it into a maximum limitation with mixed air damper operation and into a minimum limitation with regenerative transfer operation. Depending on the position of the characteristic curve from Module 3, the positioning signal is direct-acting or reverse-acting. ECO uses the maximum limit for the direct control of mixing, return, and fresh air dampers that operate with one motor.
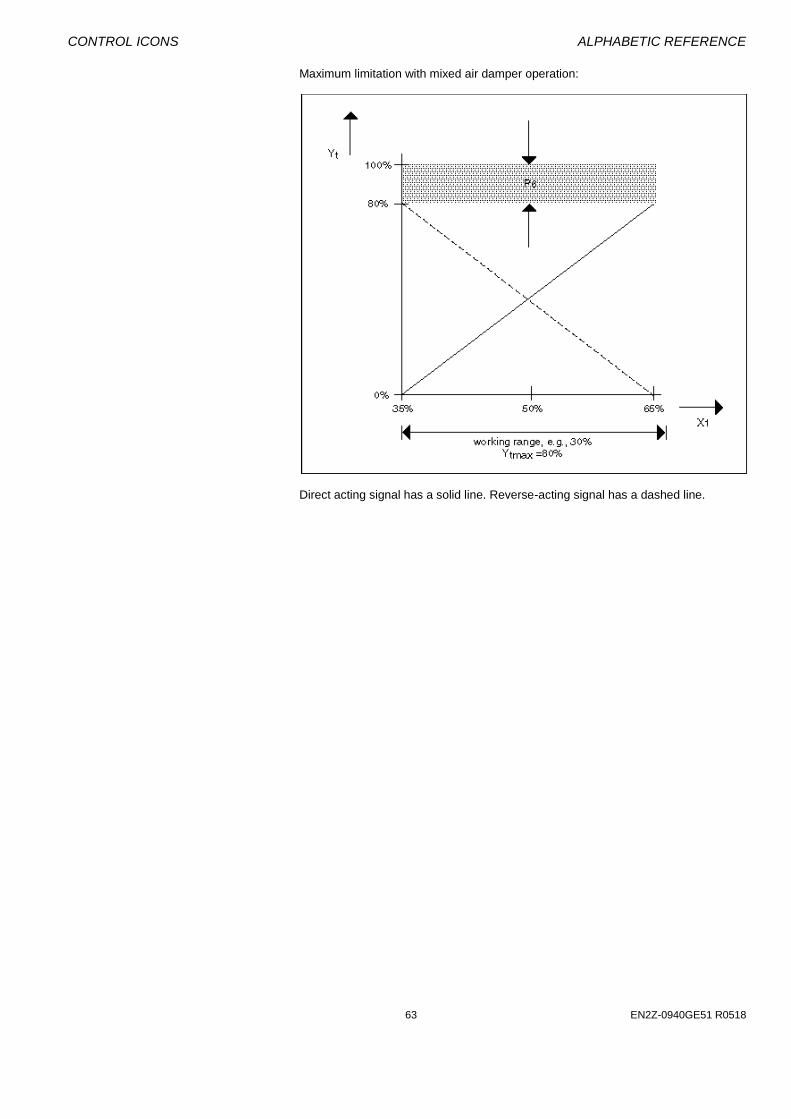
CONTROL ICONS ALPHABETIC REFERENCE
63 EN2Z-0940GE51 R0518
Maximum limitation with mixed air damper operation:
Direct acting signal has a solid line. Reverse-acting signal has a dashed line.
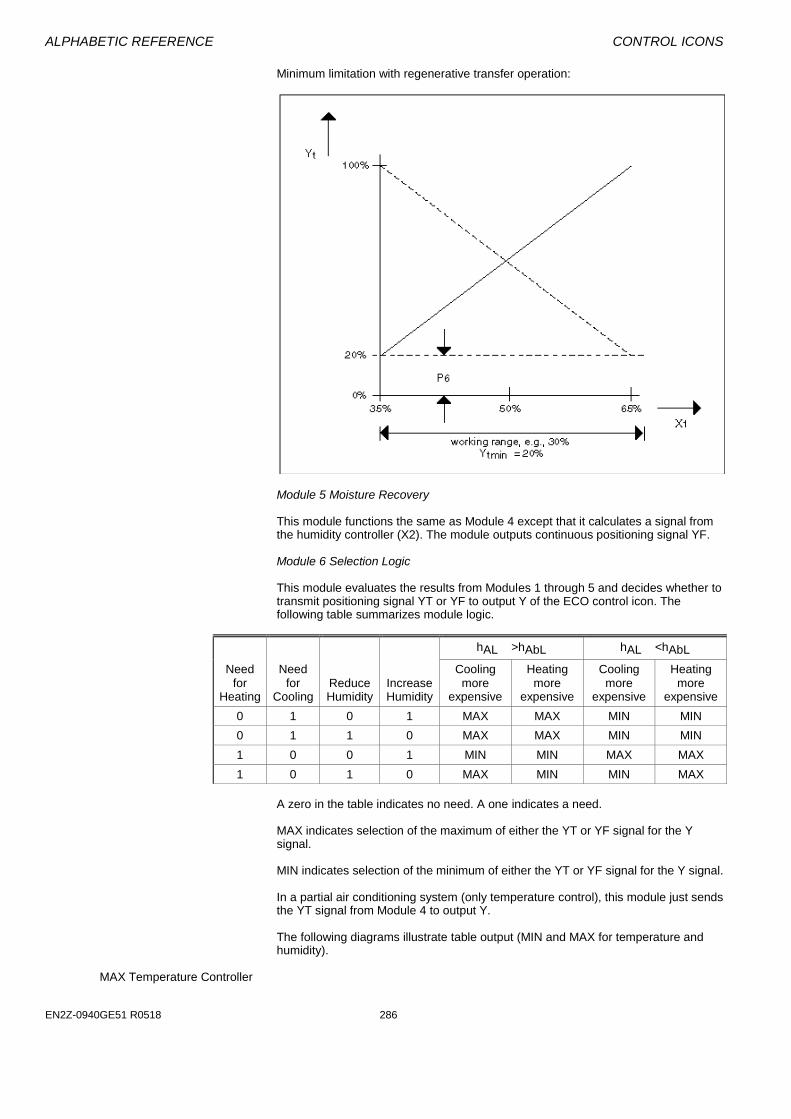
ALPHABETIC REFERENCE CONTROL ICONS
EN2Z-0940GE51 R0518 286
Minimum limitation with regenerative transfer operation:
Module 5 Moisture Recovery This module functions the same as Module 4 except that it calculates a signal from the humidity controller (X2). The module outputs continuous positioning signal YF. Module 6 Selection Logic This module evaluates the results from Modules 1 through 5 and decides whether to transmit positioning signal YT or YF to output Y of the ECO control icon. The following table summarizes module logic.
hAL >hAbL hAL <hAbL
Need for
Heating
Need for
Cooling
Reduce Humidity
Increase Humidity
Cooling more
expensive
Heating more
expensive
Cooling more
expensive
Heating more
expensive
0 1 0 1 MAX MAX MIN MIN
0 1 1 0 MAX MAX MIN MIN
1 0 0 1 MIN MIN MAX MAX
1 0 1 0 MAX MIN MIN MAX
A zero in the table indicates no need. A one indicates a need. MAX indicates selection of the maximum of either the YT or YF signal for the Y signal. MIN indicates selection of the minimum of either the YT or YF signal for the Y signal. In a partial air conditioning system (only temperature control), this module just sends the YT signal from Module 4 to output Y. The following diagrams illustrate table output (MIN and MAX for temperature and humidity).
MAX Temperature Controller

CONTROL ICONS ALPHABETIC REFERENCE
65 EN2Z-0940GE51 R0518
(hAL > hAbL) and MAX Humidity Controller (hAL > hAbL)
MIN Temperature Controller (hAL < hAbL) and MIN Humidity Controller (hAL < hAbL)
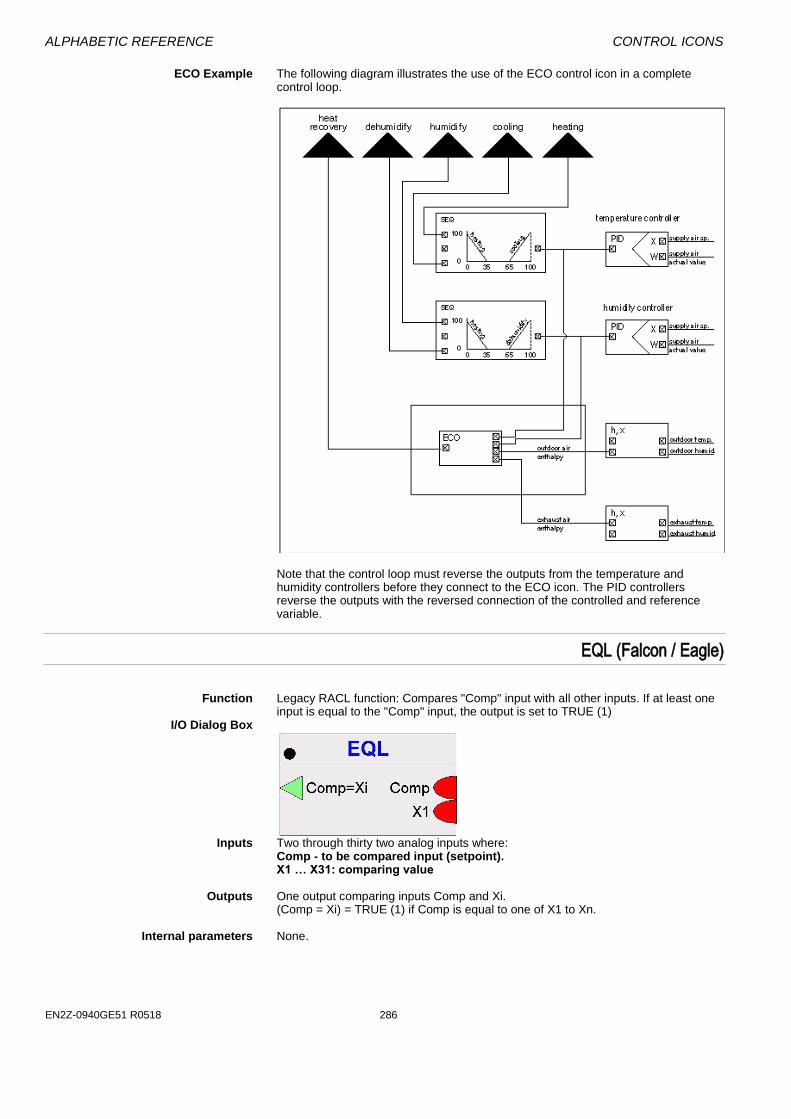
ALPHABETIC REFERENCE CONTROL ICONS
EN2Z-0940GE51 R0518 286
ECO Example The following diagram illustrates the use of the ECO control icon in a complete control loop.
Note that the control loop must reverse the outputs from the temperature and humidity controllers before they connect to the ECO icon. The PID controllers reverse the outputs with the reversed connection of the controlled and reference variable.
EQL (Falcon / Eagle)
Function Legacy RACL function: Compares "Comp" input with all other inputs. If at least one
input is equal to the "Comp" input, the output is set to TRUE (1) I/O Dialog Box
Inputs Two through thirty two analog inputs where:
Comp - to be compared input (setpoint). X1 … X31: comparing value
Outputs One output comparing inputs Comp and Xi.
(Comp = Xi) = TRUE (1) if Comp is equal to one of X1 to Xn.
Internal parameters None.
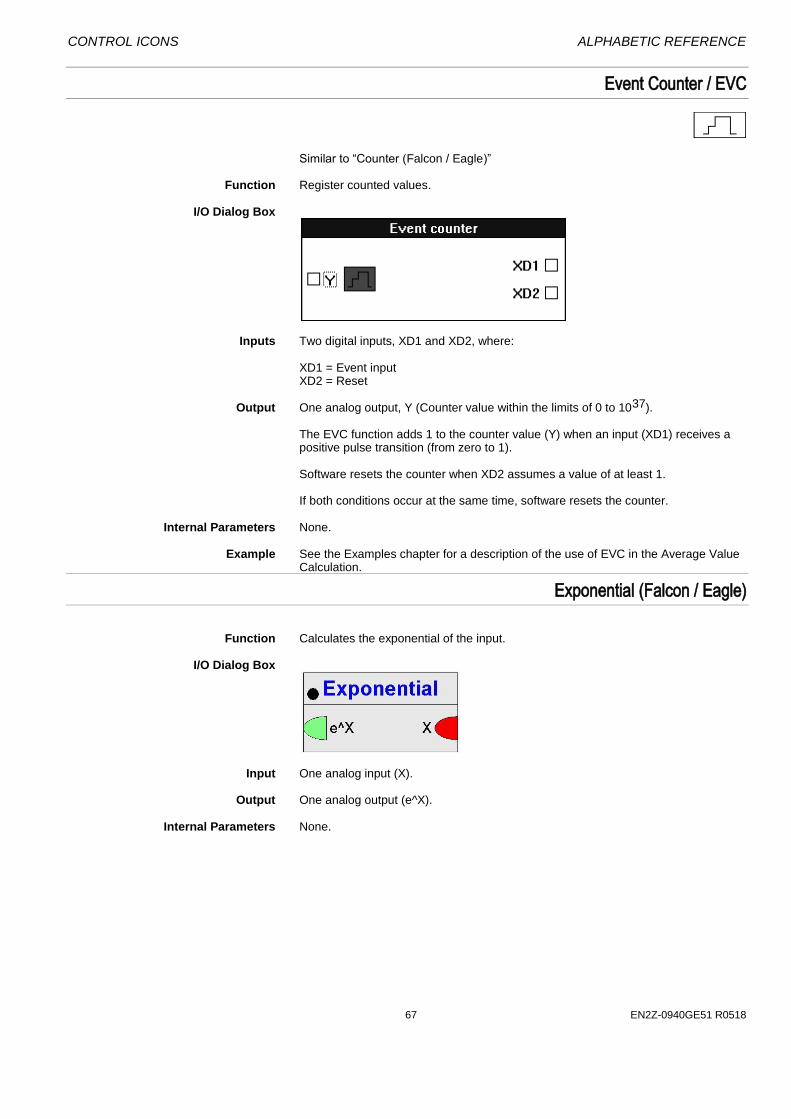
CONTROL ICONS ALPHABETIC REFERENCE
67 EN2Z-0940GE51 R0518
Event Counter / EVC
Similar to “Counter (Falcon / Eagle)” Function Register counted values. I/O Dialog Box
Inputs Two digital inputs, XD1 and XD2, where:
XD1 = Event input XD2 = Reset
Output One analog output, Y (Counter value within the limits of 0 to 1037).
The EVC function adds 1 to the counter value (Y) when an input (XD1) receives a positive pulse transition (from zero to 1). Software resets the counter when XD2 assumes a value of at least 1.
If both conditions occur at the same time, software resets the counter.
Internal Parameters None. Example See the Examples chapter for a description of the use of EVC in the Average Value
Calculation.
Exponential (Falcon / Eagle)
Function Calculates the exponential of the input. I/O Dialog Box
Input One analog input (X). Output One analog output (e^X). Internal Parameters None.

ALPHABETIC REFERENCE CONTROL ICONS
EN2Z-0940GE51 R0518 286
Factorial (Falcon / Eagle)
Function Calculates the factorial of the input (e.g. 5!=1*2*3*4*5). I/O Dialog Box
Input One analog input (X). Output One analog output (X!). Internal Parameters None.
Fixed Applications (XFM)
Function Extended Function Modules (XFMs) are applications (or subprograms) that can
combine with other control icons, subprograms, or points to provide additional control strategy functionality.
When you select and place the XFM icon from the Control Strategy tool bar, the Load submodules dialog box displays with a list of subprograms from the XFM library.
Dialog Box
Subprogram List enth.csd ENTHALPY H,X control in English units (temperatures in Fahrenheit). epid.csd ENHANCED PID PID with additional features such as built-in start-up ramp,
direct-reverse action selection, integral recalculation to prevent windup below minimum/above maximum, and an auxiliary input for limit applications and integral reset.
flow.csd FLOW Output is a calculated flow rate. Input is from a flow sensor
(air, gas, water, etc.). lead-lag.csd LEAD-LAG This XFM controls two devices with lead-lag logic.
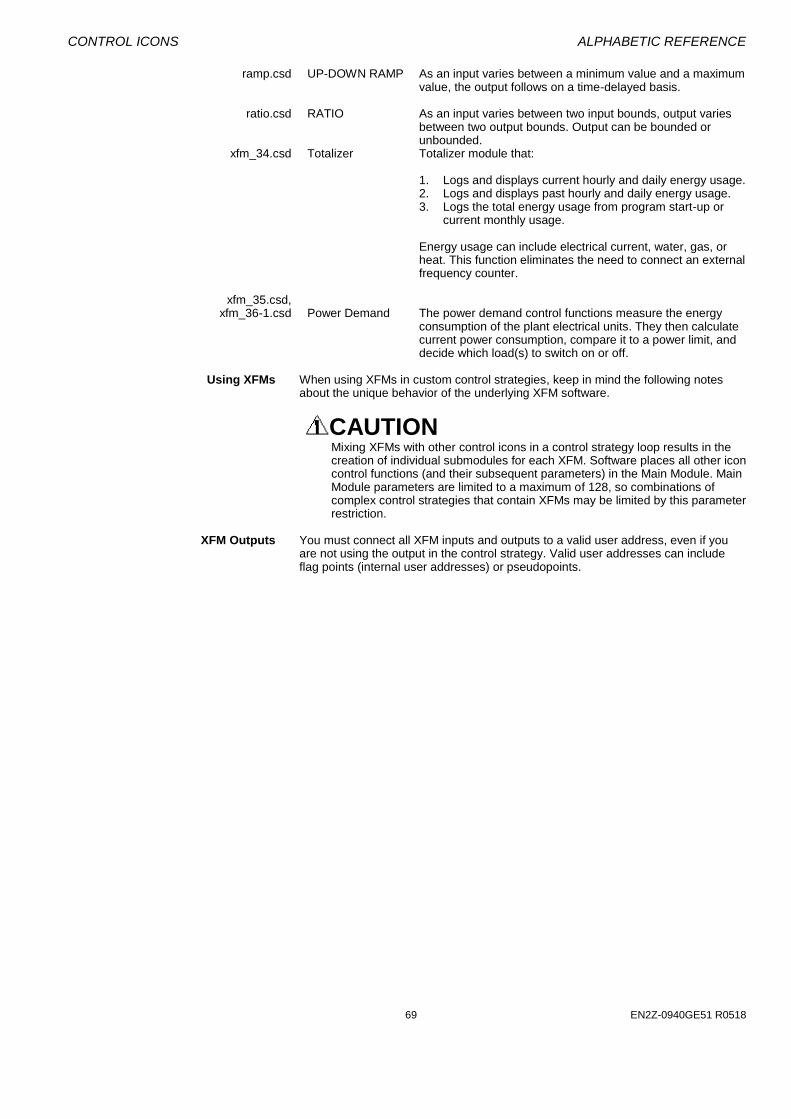
CONTROL ICONS ALPHABETIC REFERENCE
69 EN2Z-0940GE51 R0518
ramp.csd UP-DOWN RAMP As an input varies between a minimum value and a maximum value, the output follows on a time-delayed basis.
ratio.csd RATIO As an input varies between two input bounds, output varies
between two output bounds. Output can be bounded or unbounded.
xfm_34.csd Totalizer Totalizer module that: 1. Logs and displays current hourly and daily energy usage. 2. Logs and displays past hourly and daily energy usage. 3. Logs the total energy usage from program start-up or
current monthly usage. Energy usage can include electrical current, water, gas, or
heat. This function eliminates the need to connect an external frequency counter.
xfm_35.csd, xfm_36-1.csd Power Demand The power demand control functions measure the energy
consumption of the plant electrical units. They then calculate current power consumption, compare it to a power limit, and decide which load(s) to switch on or off.
Using XFMs When using XFMs in custom control strategies, keep in mind the following notes
about the unique behavior of the underlying XFM software.
CAUTION Mixing XFMs with other control icons in a control strategy loop results in the creation of individual submodules for each XFM. Software places all other icon control functions (and their subsequent parameters) in the Main Module. Main Module parameters are limited to a maximum of 128, so combinations of complex control strategies that contain XFMs may be limited by this parameter restriction.
XFM Outputs You must connect all XFM inputs and outputs to a valid user address, even if you
are not using the output in the control strategy. Valid user addresses can include flag points (internal user addresses) or pseudopoints.
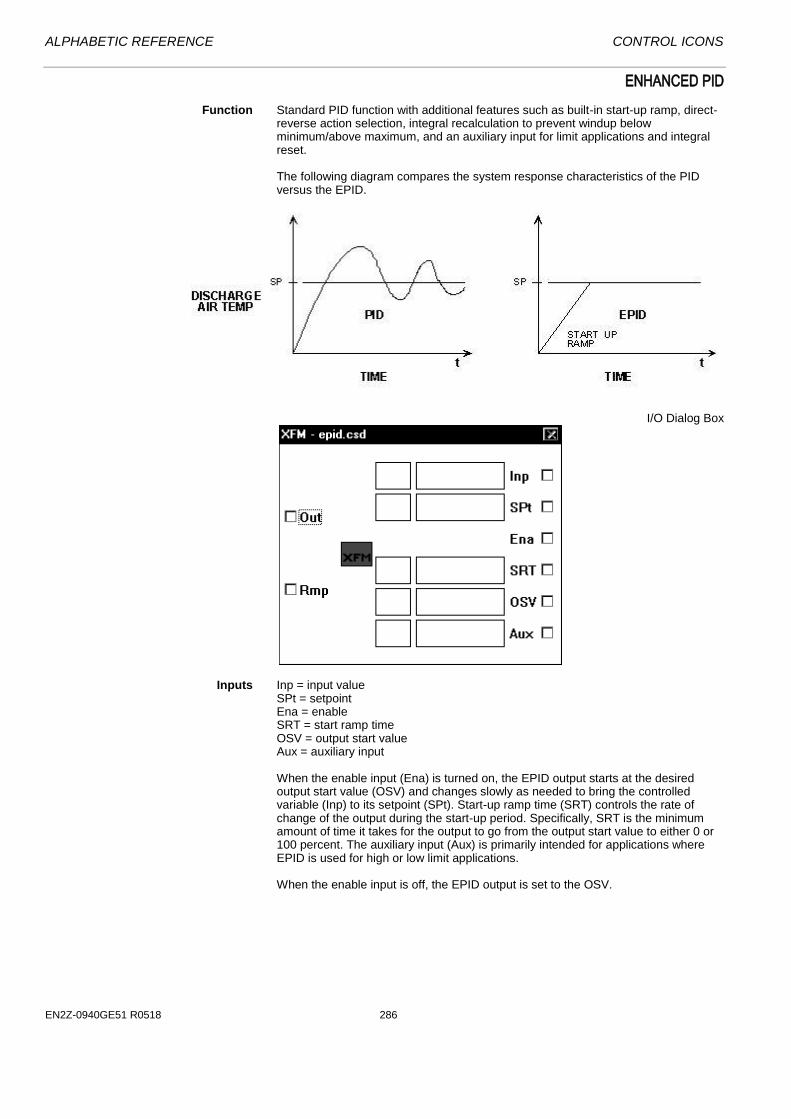
ALPHABETIC REFERENCE CONTROL ICONS
EN2Z-0940GE51 R0518 286
ENHANCED PID
Function Standard PID function with additional features such as built-in start-up ramp, direct-reverse action selection, integral recalculation to prevent windup below minimum/above maximum, and an auxiliary input for limit applications and integral reset.
The following diagram compares the system response characteristics of the PID versus the EPID.
I/O Dialog Box
Inputs Inp = input value
SPt = setpoint Ena = enable SRT = start ramp time OSV = output start value Aux = auxiliary input When the enable input (Ena) is turned on, the EPID output starts at the desired output start value (OSV) and changes slowly as needed to bring the controlled variable (Inp) to its setpoint (SPt). Start-up ramp time (SRT) controls the rate of change of the output during the start-up period. Specifically, SRT is the minimum amount of time it takes for the output to go from the output start value to either 0 or 100 percent. The auxiliary input (Aux) is primarily intended for applications where EPID is used for high or low limit applications. When the enable input is off, the EPID output is set to the OSV.
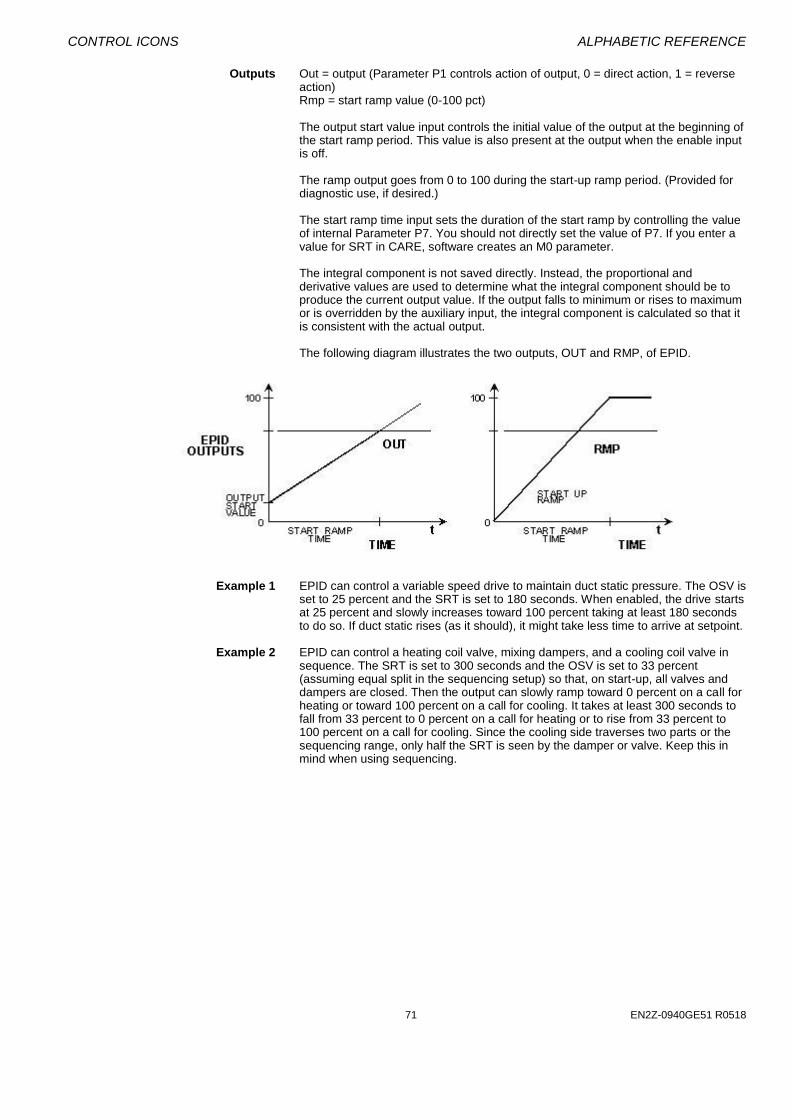
CONTROL ICONS ALPHABETIC REFERENCE
71 EN2Z-0940GE51 R0518
Outputs Out = output (Parameter P1 controls action of output, 0 = direct action, 1 = reverse action) Rmp = start ramp value (0-100 pct) The output start value input controls the initial value of the output at the beginning of the start ramp period. This value is also present at the output when the enable input is off. The ramp output goes from 0 to 100 during the start-up ramp period. (Provided for diagnostic use, if desired.) The start ramp time input sets the duration of the start ramp by controlling the value of internal Parameter P7. You should not directly set the value of P7. If you enter a value for SRT in CARE, software creates an M0 parameter. The integral component is not saved directly. Instead, the proportional and derivative values are used to determine what the integral component should be to produce the current output value. If the output falls to minimum or rises to maximum or is overridden by the auxiliary input, the integral component is calculated so that it is consistent with the actual output. The following diagram illustrates the two outputs, OUT and RMP, of EPID.
Example 1 EPID can control a variable speed drive to maintain duct static pressure. The OSV is
set to 25 percent and the SRT is set to 180 seconds. When enabled, the drive starts at 25 percent and slowly increases toward 100 percent taking at least 180 seconds to do so. If duct static rises (as it should), it might take less time to arrive at setpoint.
Example 2 EPID can control a heating coil valve, mixing dampers, and a cooling coil valve in
sequence. The SRT is set to 300 seconds and the OSV is set to 33 percent (assuming equal split in the sequencing setup) so that, on start-up, all valves and dampers are closed. Then the output can slowly ramp toward 0 percent on a call for heating or toward 100 percent on a call for cooling. It takes at least 300 seconds to fall from 33 percent to 0 percent on a call for heating or to rise from 33 percent to 100 percent on a call for cooling. Since the cooling side traverses two parts or the sequencing range, only half the SRT is seen by the damper or valve. Keep this in mind when using sequencing.
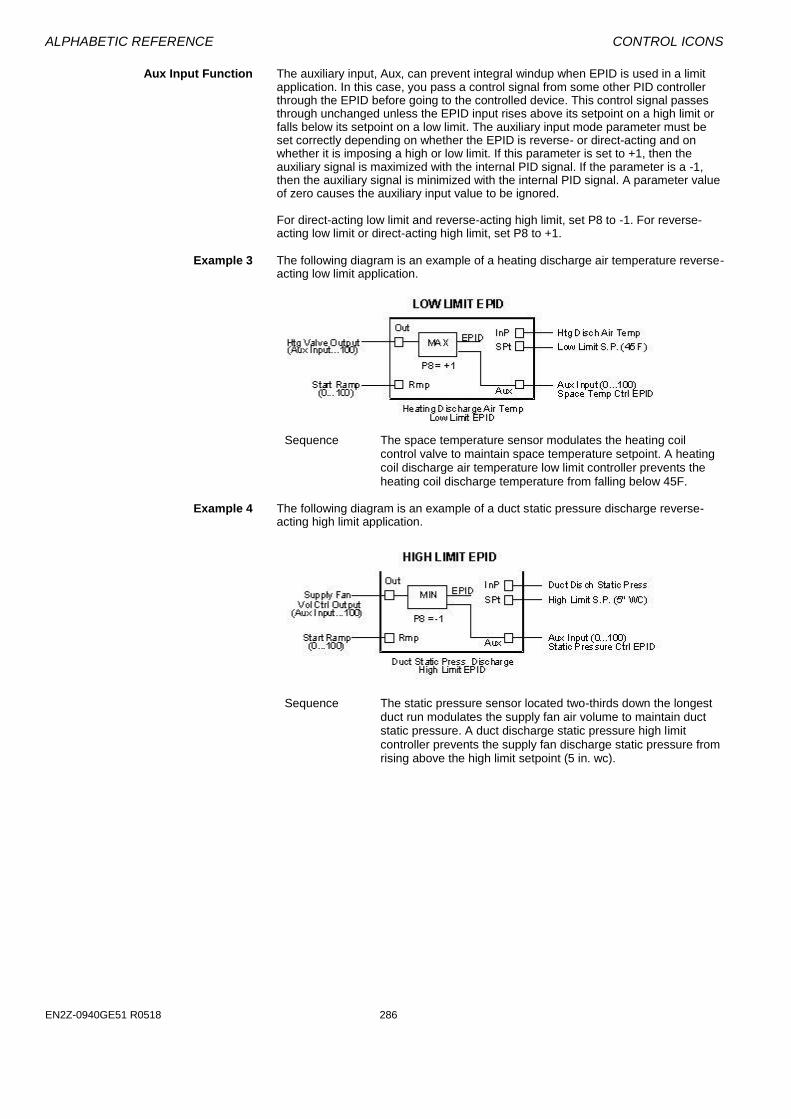
ALPHABETIC REFERENCE CONTROL ICONS
EN2Z-0940GE51 R0518 286
Aux Input Function The auxiliary input, Aux, can prevent integral windup when EPID is used in a limit application. In this case, you pass a control signal from some other PID controller through the EPID before going to the controlled device. This control signal passes through unchanged unless the EPID input rises above its setpoint on a high limit or falls below its setpoint on a low limit. The auxiliary input mode parameter must be set correctly depending on whether the EPID is reverse- or direct-acting and on whether it is imposing a high or low limit. If this parameter is set to +1, then the auxiliary signal is maximized with the internal PID signal. If the parameter is a -1, then the auxiliary signal is minimized with the internal PID signal. A parameter value of zero causes the auxiliary input value to be ignored.
For direct-acting low limit and reverse-acting high limit, set P8 to -1. For reverse-acting low limit or direct-acting high limit, set P8 to +1.
Example 3 The following diagram is an example of a heating discharge air temperature reverse-
acting low limit application.
Sequence The space temperature sensor modulates the heating coil
control valve to maintain space temperature setpoint. A heating coil discharge air temperature low limit controller prevents the heating coil discharge temperature from falling below 45F.
Example 4 The following diagram is an example of a duct static pressure discharge reverse-
acting high limit application.
Sequence The static pressure sensor located two-thirds down the longest
duct run modulates the supply fan air volume to maintain duct static pressure. A duct discharge static pressure high limit controller prevents the supply fan discharge static pressure from rising above the high limit setpoint (5 in. wc).
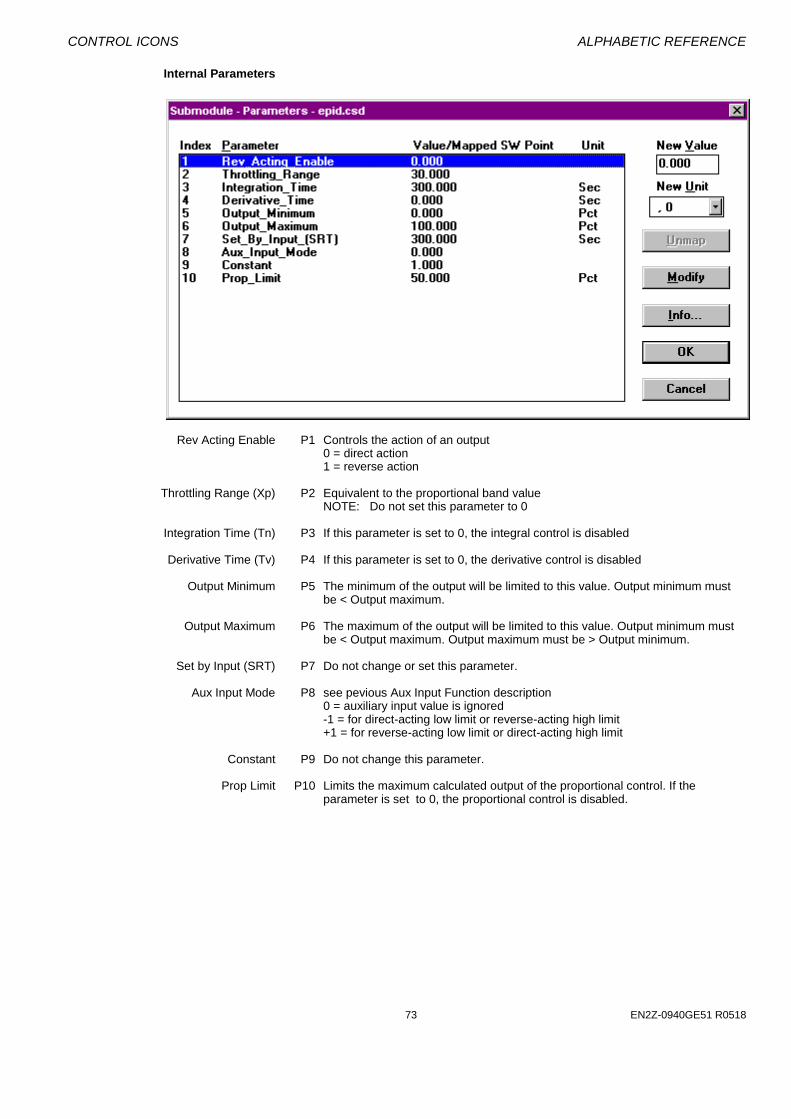
CONTROL ICONS ALPHABETIC REFERENCE
73 EN2Z-0940GE51 R0518
Internal Parameters
Rev Acting Enable P1 Controls the action of an output 0 = direct action 1 = reverse action Throttling Range (Xp) P2 Equivalent to the proportional band value NOTE: Do not set this parameter to 0 Integration Time (Tn) P3 If this parameter is set to 0, the integral control is disabled Derivative Time (Tv) P4 If this parameter is set to 0, the derivative control is disabled Output Minimum P5 The minimum of the output will be limited to this value. Output minimum must
be < Output maximum. Output Maximum P6 The maximum of the output will be limited to this value. Output minimum must
be < Output maximum. Output maximum must be > Output minimum. Set by Input (SRT) P7 Do not change or set this parameter. Aux Input Mode P8 see pevious Aux Input Function description 0 = auxiliary input value is ignored -1 = for direct-acting low limit or reverse-acting high limit +1 = for reverse-acting low limit or direct-acting high limit Constant P9 Do not change this parameter. Prop Limit P10 Limits the maximum calculated output of the proportional control. If the
parameter is set to 0, the proportional control is disabled.
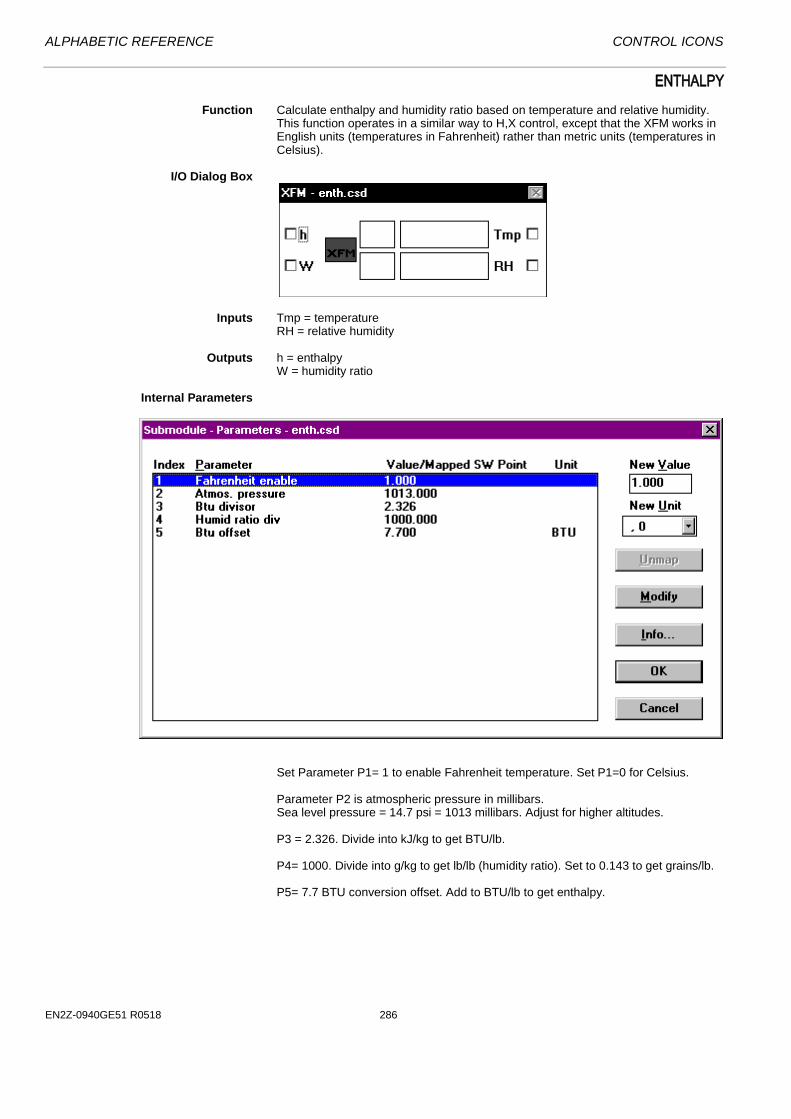
ALPHABETIC REFERENCE CONTROL ICONS
EN2Z-0940GE51 R0518 286
ENTHALPY
Function Calculate enthalpy and humidity ratio based on temperature and relative humidity. This function operates in a similar way to H,X control, except that the XFM works in English units (temperatures in Fahrenheit) rather than metric units (temperatures in Celsius).
I/O Dialog Box
Inputs Tmp = temperature RH = relative humidity
Outputs h = enthalpy
W = humidity ratio
Internal Parameters
Set Parameter P1= 1 to enable Fahrenheit temperature. Set P1=0 for Celsius. Parameter P2 is atmospheric pressure in millibars. Sea level pressure = 14.7 psi = 1013 millibars. Adjust for higher altitudes. P3 = 2.326. Divide into kJ/kg to get BTU/lb. P4= 1000. Divide into g/kg to get lb/lb (humidity ratio). Set to 0.143 to get grains/lb. P5= 7.7 BTU conversion offset. Add to BTU/lb to get enthalpy.

CONTROL ICONS ALPHABETIC REFERENCE
75 EN2Z-0940GE51 R0518
FLOW CALCULATION
Function Output a flow rate calculated from a flow sensor or transmitter (air, gas, water flow,
etc). I/O Dialog Box
Input The input, In, comes from a flow sensor (air, gas, water, etc). The input can be direct reading (that is, in actual engineering units [PSI, INW, etc]) or generic (0-100 PCT). For inputs that read in actual engineering units, P2 and P3 must be equal (OK to leave default values). For generic inputs, set P2 equal to the actual sensor range (that is, the value in engineering units that produces 100 percent at the input).
The input can be linear or nonlinear. If nonlinear, FLOW linearizes it by taking the square root. The square root function parameters are optimized to produce accurate results for input values between 0.003 and 5000.0. For linear sensors, the square root can be disabled.
Output Calculated flow rate (CFM, GPM, etc).
You can set a parameter value (internal parameters dialog box) so that the output is set to zero if the flow calculations fall below this value. You can use this feature to produce a zero output when the associated system is off.
Internal Parameters
P1=1 to enable square root, 0 to disable.

ALPHABETIC REFERENCE CONTROL ICONS
EN2Z-0940GE51 R0518 286
Input signals can be in actual engineering units or generic (0-100 percent type). For inputs that read in actual engineering units, P2 and P3 must be equal (OK to leave default values). For generic inputs, set P2 equal to the actual sensor range (that is, the value in engineering units that produces 100 percent at the input). The default velocity constant P4=4005 is for pitot tube type air flow sensors. Use proper value for type of sensor used. For linear sensors, set this value to 1. Set the area factor P5 to the duct or pipe cross-sectional area to read flow. Some linear sensors may be calibrated in flow units. For those sensors, set P5 to 1. If desired, set P6 to about 5 percent of the maximum expected flow so that the output is zero when the flow value is very low, for example, when the associated system is off.
NOTE: For direct reading inputs, P2 and P3 must be equal (OK to use defaults).
To set up a nonlinear sensor with direct reading input value:
• Make sure the velocity constant (P4) is correct. The default value is for pitot tube
type air flow sensors. • Set the area factor (P5) to the duct or pipe cross-sectional area. • If desired, set the low display value (P6) to about 5 percent of the maximum
expected output so that the output reads zero when the associated system is off. • For other parameters, use default values.
To set up a nonlinear sensor with generic (0-100 percent) input value, proceed as in the previous paragraph for nonlinear direct-reading sensors except set sensor range (P2) to the actual range of the input sensor (that is, the sensor value that produces 100 percent at the input).
To set up a linear sensor with direct reading input value:
• Set the velocity constant (P4) to 1. • Set the area factor (P5) to the duct or pipe cross-sectional area if the sensor is
calibrated for velocity, or set P5 to 1 if the sensor is calibrated for flow. • Set the square root enable (P1) to 0. • If desired, set the low display value (P6) to about 5 percent of the maximum
expected output so that the output reads zero when the associated system is off. • For other parameters, use default values. To set up a linear sensor with generic (0-100 percent) input value: Proceed as in the previous paragraph for linear direct reading sensors except set sensor range (P2) to the actual range of the input sensor.
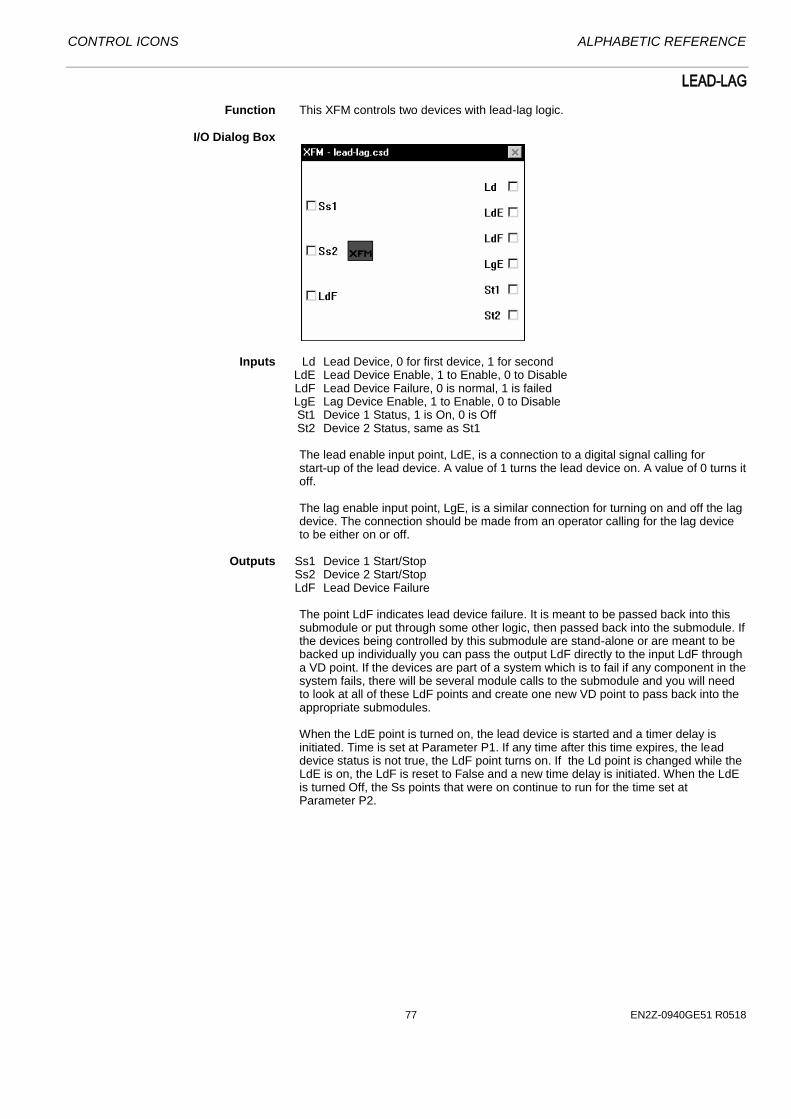
CONTROL ICONS ALPHABETIC REFERENCE
77 EN2Z-0940GE51 R0518
LEAD-LAG
Function This XFM controls two devices with lead-lag logic. I/O Dialog Box
Inputs Ld Lead Device, 0 for first device, 1 for second LdE Lead Device Enable, 1 to Enable, 0 to Disable LdF Lead Device Failure, 0 is normal, 1 is failed LgE Lag Device Enable, 1 to Enable, 0 to Disable St1 Device 1 Status, 1 is On, 0 is Off St2 Device 2 Status, same as St1
The lead enable input point, LdE, is a connection to a digital signal calling for start-up of the lead device. A value of 1 turns the lead device on. A value of 0 turns it off.
The lag enable input point, LgE, is a similar connection for turning on and off the lag device. The connection should be made from an operator calling for the lag device to be either on or off.
Outputs Ss1 Device 1 Start/Stop Ss2 Device 2 Start/Stop LdF Lead Device Failure
The point LdF indicates lead device failure. It is meant to be passed back into this submodule or put through some other logic, then passed back into the submodule. If the devices being controlled by this submodule are stand-alone or are meant to be backed up individually you can pass the output LdF directly to the input LdF through a VD point. If the devices are part of a system which is to fail if any component in the system fails, there will be several module calls to the submodule and you will need to look at all of these LdF points and create one new VD point to pass back into the appropriate submodules. When the LdE point is turned on, the lead device is started and a timer delay is initiated. Time is set at Parameter P1. If any time after this time expires, the lead device status is not true, the LdF point turns on. If the Ld point is changed while the LdE is on, the LdF is reset to False and a new time delay is initiated. When the LdE is turned Off, the Ss points that were on continue to run for the time set at Parameter P2.

ALPHABETIC REFERENCE CONTROL ICONS
EN2Z-0940GE51 R0518 286
Internal Parameters
Power Demand Control XFMs
Function The power demand control functions measure the energy consumption of the plant electrical units. They then calculate current power consumption, compare it to a power limit, and decide which loads to switch on or off.
Power demand control consists of four XFMs: XFM 35, XFM 36-1, XFM 36-1S and XMF 36-1R. Many load switching behaviors are available because multiple XFM 36-1, XFM 35-1S and XFM 36-IRs with various parameter settings can connect to a single XFM 35. XFM 35 is the strategy program. It takes in the totalizer point values, applies them to the chosen algorithm, and outputs control signals to the XFM 36-1/S/R single-stage load programs in each of up to three priority groups. Each priority group can contain up to 50 single-stage load programs (XFM 36-1/S/Rs) connected in a loop. NOTE: Although 50 XFM 36-1/S/Rs are allowed, controller cycle time will be long
with large numbers of XFM 36-1s. Use the smaller XFM 36-1R or XFM 36-1S to use less controller memory and cycle time. A total of 127 XFMs are allowed in a controller.

CONTROL ICONS ALPHABETIC REFERENCE
79 EN2Z-0940GE51 R0518
The following diagram illustrates the principal connections of XFM 35 and multiple XFM 36-1/S/Rs:
The principle of operation is that XFM 35 implements the desired algorithm and then outputs the actual kW shed/restore values to the XFM 36-1/S/Rs. A positive kW value is a command to restore loads totaling that much kW. A negative kW value is a command to shed loads of that much kW. The kW shed/restore values can appear at output Po1, Po2, or Po3. Po1 is the output for priority group 1. It has the lowest priority and is shed first. Po2 loads are shed next and Po3 loads are shed last. Each sheddable load is controlled by an XFM 36-1/S/R. The XFM 36-1/S/Rs are connected in the CARE control strategy in a series string. For priority group 1, for example, XFM 35 output Po1 is connected to the Po input of the first XFM 36-1/S/R. The Po output of the first XFM 36-1/S/R is then connected to the Po output of the second XFM 36-1/S/R. The Po output of the second XFM 36-1/S/R is then connected to the Po input of the third XFM 36-1/S/R. Up to 50 XFM 36-1s can be connected in a string this manner. To complete priority group 1, the Po output of the last XFM 36-1/S/R must be connected to the Po1 input of XFM 35. The XFM 36-1/S/Rs for priority groups 2 and 3 are connected similarly to XFM 35 Po2 and Po3 inputs and outputs. In any group, the sequential load with the highest load number (parameter 14) is shed first. In basic system operation, XFM 35 outputs 0 kW to Po1, 2, or 3 if no loads are to be shed or restored. However, if, for example, 500 kW must be shed in a system where all loads are ON, -500 kW will be output from XFM 35 PO1. The first XFM 36-1/S/R will shed its load of, for example, 150 kW, and the remaining kW (-350) is output to the PO input of the second XFM 36-1/S/R. The process continues until a total of 500 kW is shed, or the remaining kW to be shed value is output into the XFM 35 PO1 input. XFM 35 then outputs that value to its PO2 output, and the priority group 2 XFM 36-1/S/Rs shed their loads as explained above. If necessary, the process continues through the priority 3 loads. The order in which loads are shed within a group depends primarily on whether a sequential or rotational strategy exists for that group. Refer to the XFM 36-1/S/R section for more detail.
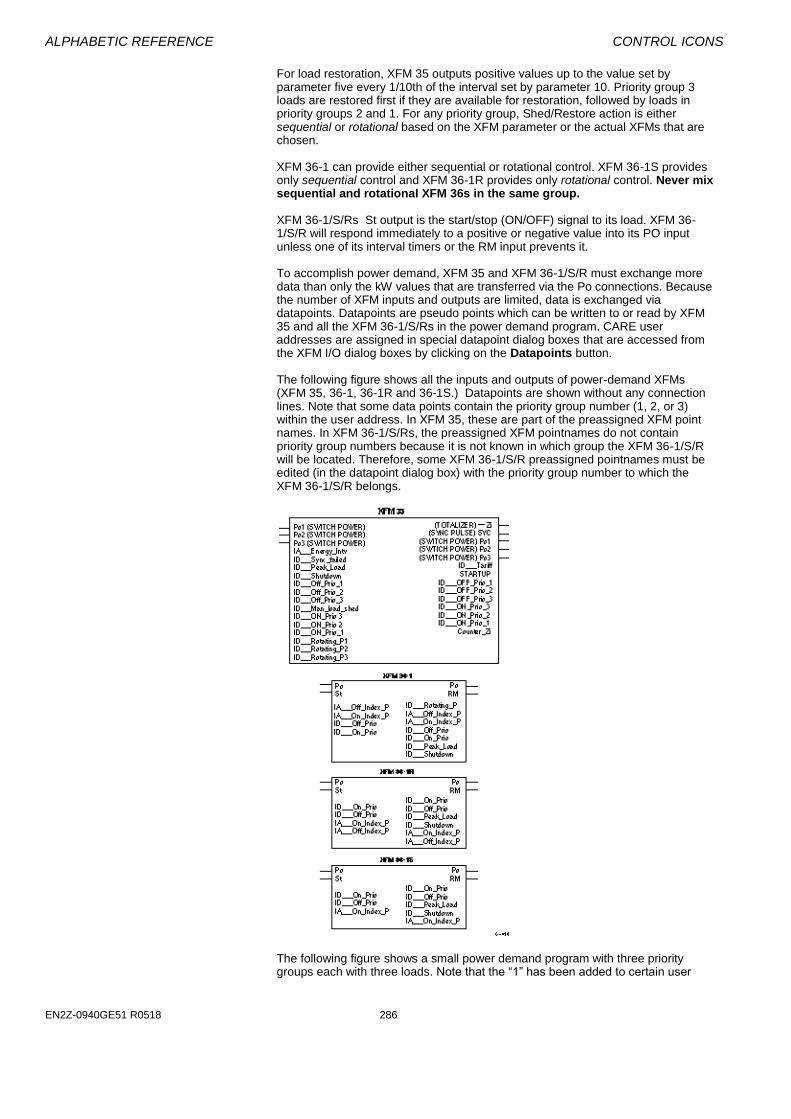
ALPHABETIC REFERENCE CONTROL ICONS
EN2Z-0940GE51 R0518 286
For load restoration, XFM 35 outputs positive values up to the value set by parameter five every 1/10th of the interval set by parameter 10. Priority group 3 loads are restored first if they are available for restoration, followed by loads in priority groups 2 and 1. For any priority group, Shed/Restore action is either sequential or rotational based on the XFM parameter or the actual XFMs that are chosen. XFM 36-1 can provide either sequential or rotational control. XFM 36-1S provides only sequential control and XFM 36-1R provides only rotational control. Never mix sequential and rotational XFM 36s in the same group. XFM 36-1/S/Rs St output is the start/stop (ON/OFF) signal to its load. XFM 36-1/S/R will respond immediately to a positive or negative value into its PO input unless one of its interval timers or the RM input prevents it. To accomplish power demand, XFM 35 and XFM 36-1/S/R must exchange more data than only the kW values that are transferred via the Po connections. Because the number of XFM inputs and outputs are limited, data is exchanged via datapoints. Datapoints are pseudo points which can be written to or read by XFM 35 and all the XFM 36-1/S/Rs in the power demand program. CARE user addresses are assigned in special datapoint dialog boxes that are accessed from the XFM I/O dialog boxes by clicking on the Datapoints button. The following figure shows all the inputs and outputs of power-demand XFMs (XFM 35, 36-1, 36-1R and 36-1S.) Datapoints are shown without any connection lines. Note that some data points contain the priority group number (1, 2, or 3) within the user address. In XFM 35, these are part of the preassigned XFM point names. In XFM 36-1/S/Rs, the preassigned XFM pointnames do not contain priority group numbers because it is not known in which group the XFM 36-1/S/R will be located. Therefore, some XFM 36-1/S/R preassigned pointnames must be edited (in the datapoint dialog box) with the priority group number to which the XFM 36-1/S/R belongs.
The following figure shows a small power demand program with three priority groups each with three loads. Note that the “1” has been added to certain user
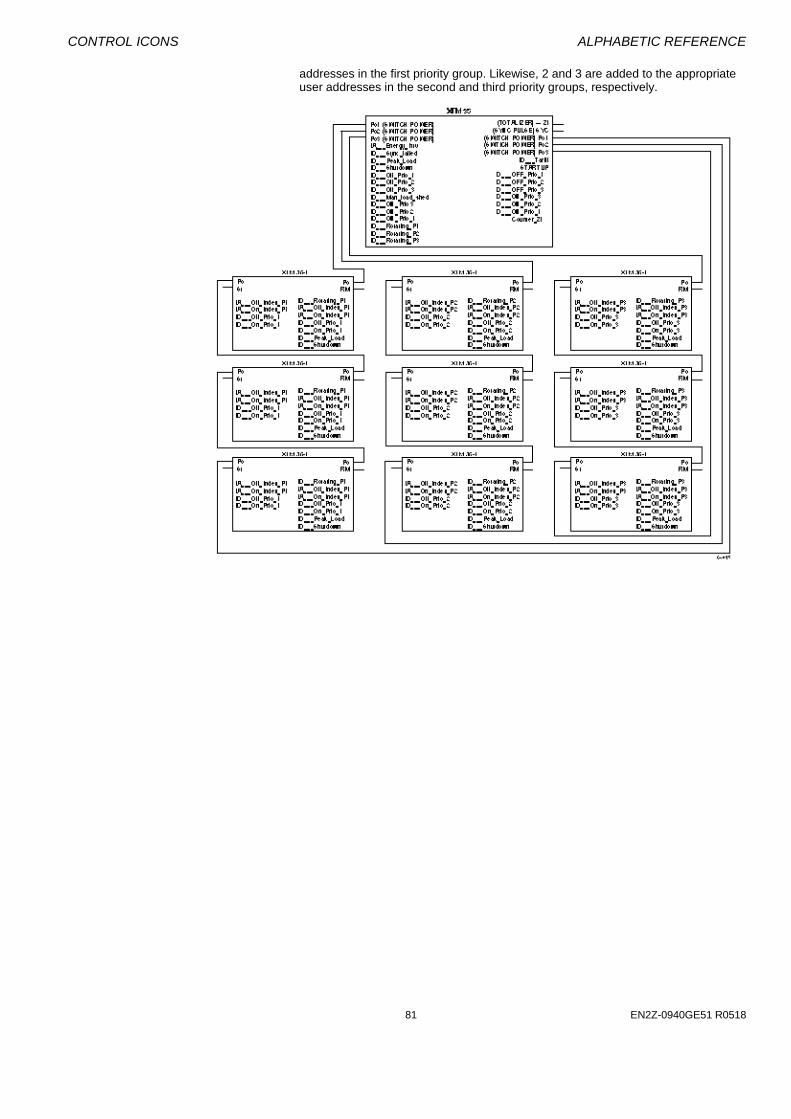
CONTROL ICONS ALPHABETIC REFERENCE
81 EN2Z-0940GE51 R0518
addresses in the first priority group. Likewise, 2 and 3 are added to the appropriate user addresses in the second and third priority groups, respectively.
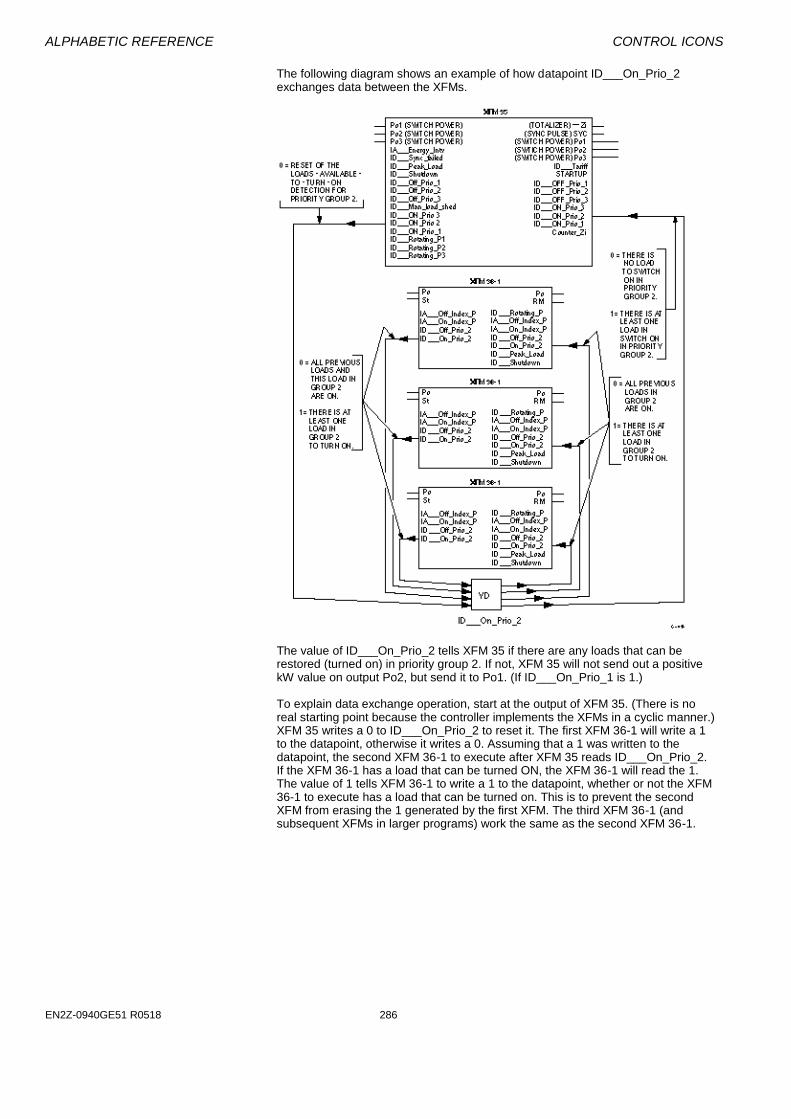
ALPHABETIC REFERENCE CONTROL ICONS
EN2Z-0940GE51 R0518 286
The following diagram shows an example of how datapoint ID___On_Prio_2 exchanges data between the XFMs.
The value of ID___On_Prio_2 tells XFM 35 if there are any loads that can be restored (turned on) in priority group 2. If not, XFM 35 will not send out a positive kW value on output Po2, but send it to Po1. (If ID___On_Prio_1 is 1.) To explain data exchange operation, start at the output of XFM 35. (There is no real starting point because the controller implements the XFMs in a cyclic manner.) XFM 35 writes a 0 to ID___On_Prio_2 to reset it. The first XFM 36-1 will write a 1 to the datapoint, otherwise it writes a 0. Assuming that a 1 was written to the datapoint, the second XFM 36-1 to execute after XFM 35 reads ID___On_Prio_2. If the XFM 36-1 has a load that can be turned ON, the XFM 36-1 will read the 1. The value of 1 tells XFM 36-1 to write a 1 to the datapoint, whether or not the XFM 36-1 to execute has a load that can be turned on. This is to prevent the second XFM from erasing the 1 generated by the first XFM. The third XFM 36-1 (and subsequent XFMs in larger programs) work the same as the second XFM 36-1.
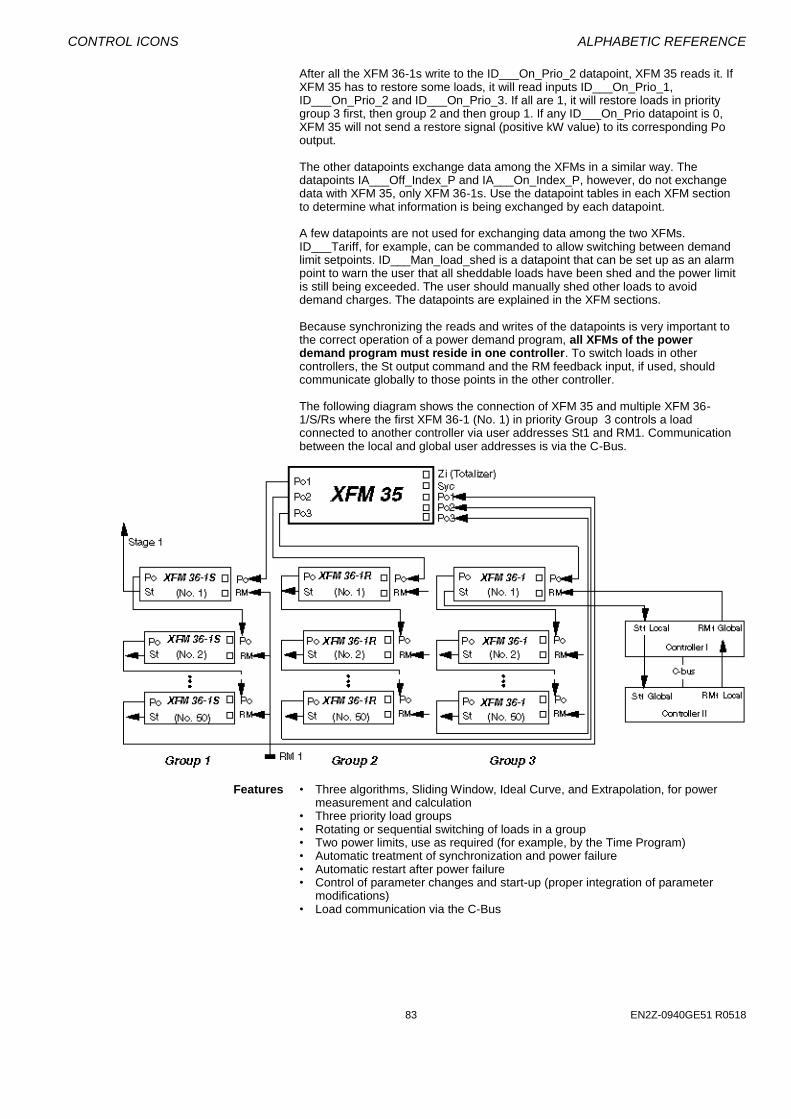
CONTROL ICONS ALPHABETIC REFERENCE
83 EN2Z-0940GE51 R0518
After all the XFM 36-1s write to the ID___On_Prio_2 datapoint, XFM 35 reads it. If XFM 35 has to restore some loads, it will read inputs ID___On_Prio_1, ID___On_Prio_2 and ID___On_Prio_3. If all are 1, it will restore loads in priority group 3 first, then group 2 and then group 1. If any ID___On_Prio datapoint is 0, XFM 35 will not send a restore signal (positive kW value) to its corresponding Po output. The other datapoints exchange data among the XFMs in a similar way. The datapoints IA___Off_Index_P and IA___On_Index_P, however, do not exchange data with XFM 35, only XFM 36-1s. Use the datapoint tables in each XFM section to determine what information is being exchanged by each datapoint. A few datapoints are not used for exchanging data among the two XFMs. ID___Tariff, for example, can be commanded to allow switching between demand limit setpoints. ID___Man_load_shed is a datapoint that can be set up as an alarm point to warn the user that all sheddable loads have been shed and the power limit is still being exceeded. The user should manually shed other loads to avoid demand charges. The datapoints are explained in the XFM sections. Because synchronizing the reads and writes of the datapoints is very important to the correct operation of a power demand program, all XFMs of the power demand program must reside in one controller. To switch loads in other controllers, the St output command and the RM feedback input, if used, should communicate globally to those points in the other controller.
The following diagram shows the connection of XFM 35 and multiple XFM 36-1/S/Rs where the first XFM 36-1 (No. 1) in priority Group 3 controls a load connected to another controller via user addresses St1 and RM1. Communication between the local and global user addresses is via the C-Bus.
Features • Three algorithms, Sliding Window, Ideal Curve, and Extrapolation, for power
measurement and calculation • Three priority load groups • Rotating or sequential switching of loads in a group • Two power limits, use as required (for example, by the Time Program) • Automatic treatment of synchronization and power failure • Automatic restart after power failure • Control of parameter changes and start-up (proper integration of parameter
modifications) • Load communication via the C-Bus
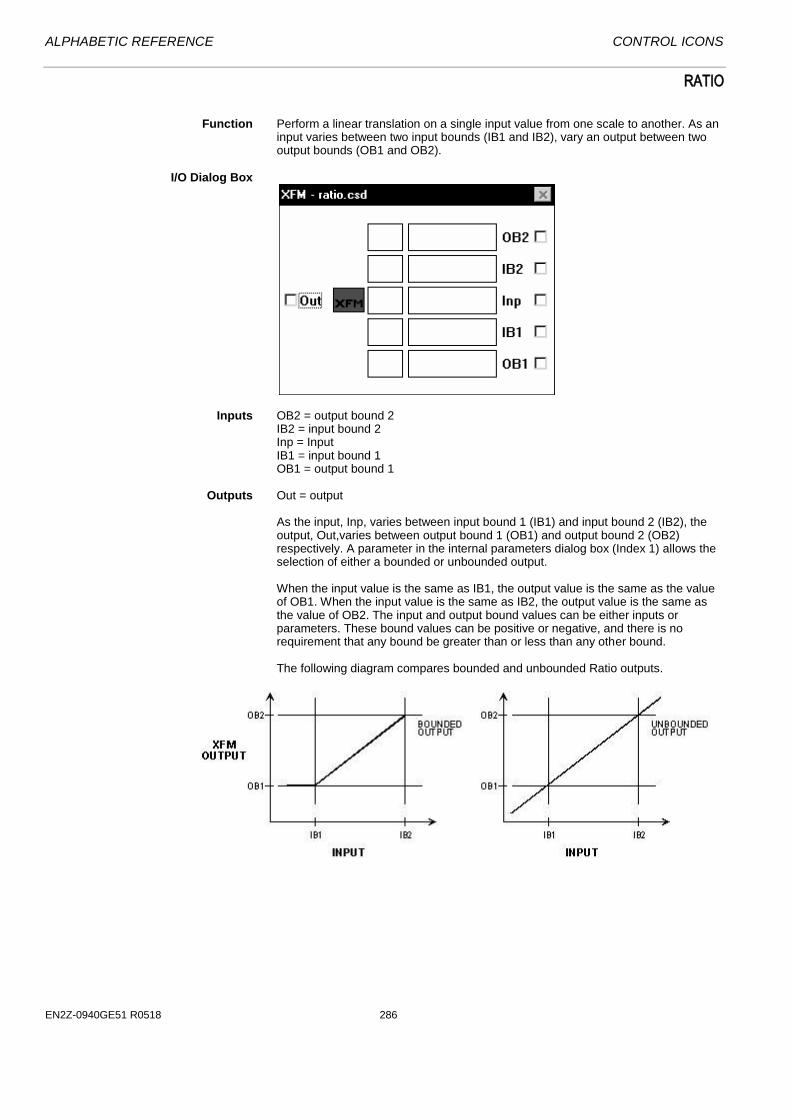
ALPHABETIC REFERENCE CONTROL ICONS
EN2Z-0940GE51 R0518 286
RATIO
Function Perform a linear translation on a single input value from one scale to another. As an
input varies between two input bounds (IB1 and IB2), vary an output between two output bounds (OB1 and OB2).
I/O Dialog Box
Inputs OB2 = output bound 2 IB2 = input bound 2 Inp = Input IB1 = input bound 1 OB1 = output bound 1
Outputs Out = output
As the input, Inp, varies between input bound 1 (IB1) and input bound 2 (IB2), the output, Out,varies between output bound 1 (OB1) and output bound 2 (OB2) respectively. A parameter in the internal parameters dialog box (Index 1) allows the selection of either a bounded or unbounded output. When the input value is the same as IB1, the output value is the same as the value of OB1. When the input value is the same as IB2, the output value is the same as the value of OB2. The input and output bound values can be either inputs or parameters. These bound values can be positive or negative, and there is no requirement that any bound be greater than or less than any other bound. The following diagram compares bounded and unbounded Ratio outputs.
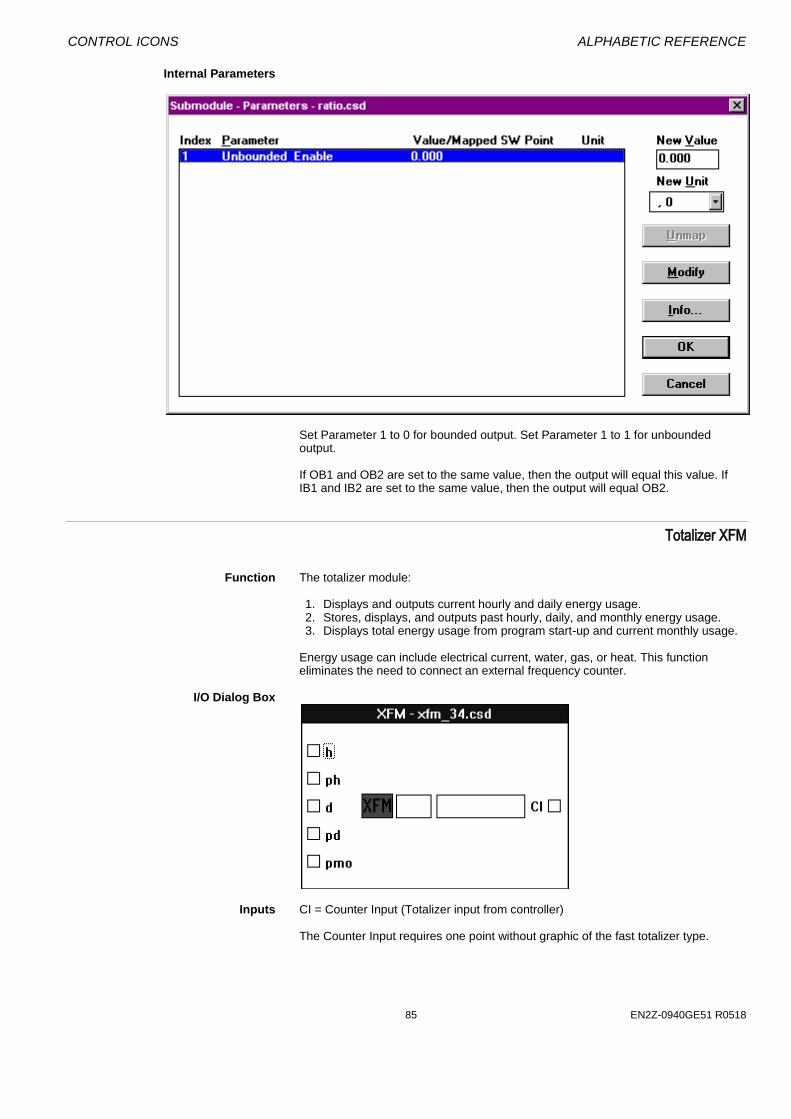
CONTROL ICONS ALPHABETIC REFERENCE
85 EN2Z-0940GE51 R0518
Internal Parameters
Set Parameter 1 to 0 for bounded output. Set Parameter 1 to 1 for unbounded output. If OB1 and OB2 are set to the same value, then the output will equal this value. If IB1 and IB2 are set to the same value, then the output will equal OB2.
Totalizer XFM
Function The totalizer module: 1. Displays and outputs current hourly and daily energy usage. 2. Stores, displays, and outputs past hourly, daily, and monthly energy usage. 3. Displays total energy usage from program start-up and current monthly usage.
Energy usage can include electrical current, water, gas, or heat. This function eliminates the need to connect an external frequency counter.
I/O Dialog Box
Inputs CI = Counter Input (Totalizer input from controller)
The Counter Input requires one point without graphic of the fast totalizer type.
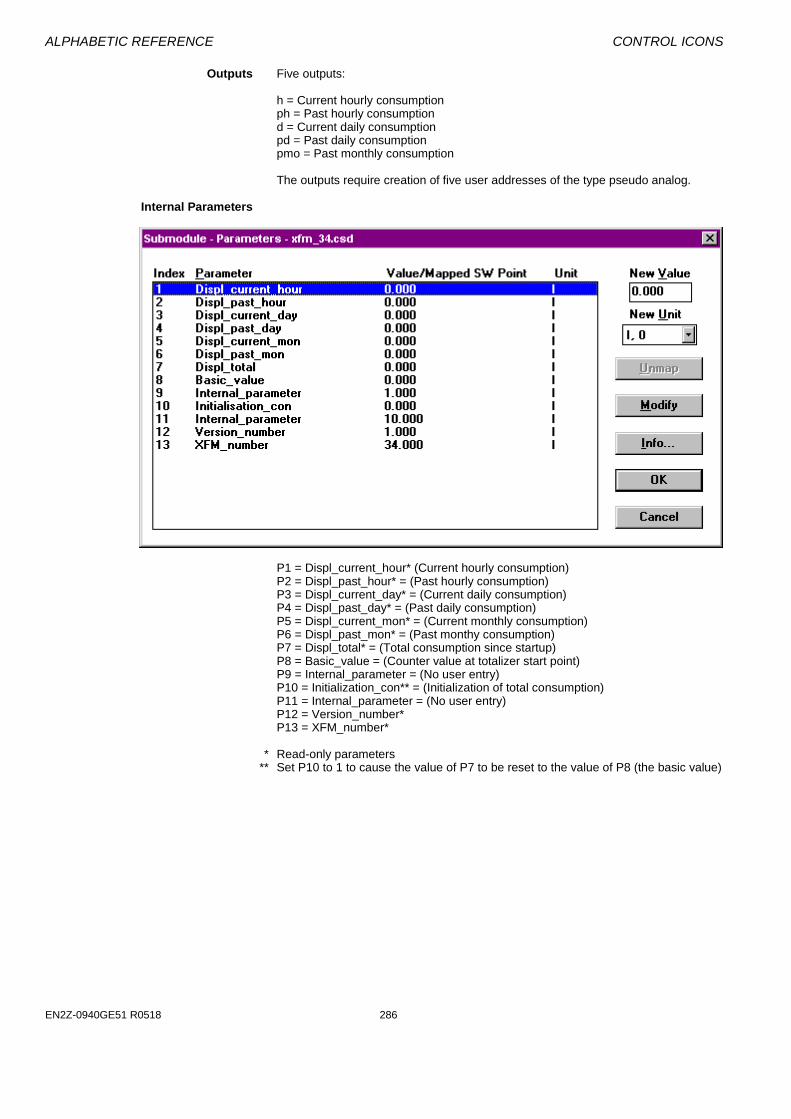
ALPHABETIC REFERENCE CONTROL ICONS
EN2Z-0940GE51 R0518 286
Outputs Five outputs:
h = Current hourly consumption ph = Past hourly consumption d = Current daily consumption pd = Past daily consumption pmo = Past monthly consumption The outputs require creation of five user addresses of the type pseudo analog.
Internal Parameters
P1 = Displ_current_hour* (Current hourly consumption) P2 = Displ_past_hour* = (Past hourly consumption) P3 = Displ_current_day* = (Current daily consumption) P4 = Displ_past_day* = (Past daily consumption) P5 = Displ_current_mon* = (Current monthly consumption) P6 = Displ_past_mon* = (Past monthy consumption) P7 = Displ_total* = (Total consumption since startup) P8 = Basic_value = (Counter value at totalizer start point) P9 = Internal_parameter = (No user entry) P10 = Initialization_con** = (Initialization of total consumption) P11 = Internal_parameter = (No user entry) P12 = Version_number* P13 = XFM_number*
* Read-only parameters ** Set P10 to 1 to cause the value of P7 to be reset to the value of P8 (the basic value)

CONTROL ICONS ALPHABETIC REFERENCE
87 EN2Z-0940GE51 R0518
UP-DOWN RAMP
Function As an input varies between a minimum value and a maximum value, vary an output on a time-delayed basis.
I/O Dialog Box
Inputs Max = output maximum (input or parameter) Inp = Input to be ramped Min = output minimum (input or parameter) Minimum and maximum input values impose limits on the output value.
Outputs Out = ramped output
Separate up and down ramp time parameters are provided in the internal parameters dialog box. On controller power-up, the output is set based on Parameter 3:
P3=0 output set to minimum limit P3=1 output set to current input (within min-max limits) P3=2 output set to maximum limit P3=3 output set to value of Parameter 4 (within limits)
The rate of change of the output is a function of the span between the Min value, the Max value, and the up and down ramp times. Subtract the Min value from the Max value and divide the result by the appropriate ramp time to determine the rate of change. To select a particular rate of change, first establish the desired Min and Max limits, then divide the difference between these two limits by the desired rate of change to get the up or down ramp parameter values.
Internal Parameters
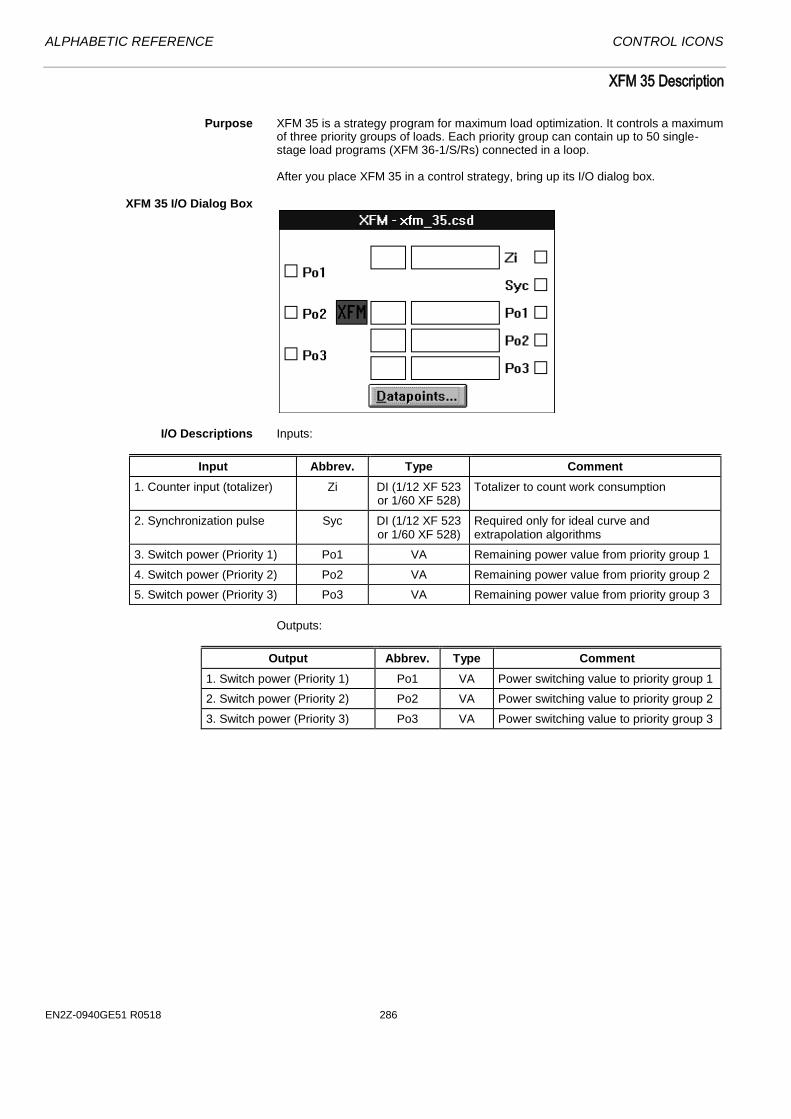
ALPHABETIC REFERENCE CONTROL ICONS
EN2Z-0940GE51 R0518 286
XFM 35 Description
Purpose XFM 35 is a strategy program for maximum load optimization. It controls a maximum
of three priority groups of loads. Each priority group can contain up to 50 single-stage load programs (XFM 36-1/S/Rs) connected in a loop. After you place XFM 35 in a control strategy, bring up its I/O dialog box.
XFM 35 I/O Dialog Box
I/O Descriptions Inputs:
Input Abbrev. Type Comment
1. Counter input (totalizer) Zi DI (1/12 XF 523 or 1/60 XF 528)
Totalizer to count work consumption
2. Synchronization pulse Syc DI (1/12 XF 523 or 1/60 XF 528)
Required only for ideal curve and extrapolation algorithms
3. Switch power (Priority 1) Po1 VA Remaining power value from priority group 1
4. Switch power (Priority 2) Po2 VA Remaining power value from priority group 2
5. Switch power (Priority 3) Po3 VA Remaining power value from priority group 3
Outputs:
Output Abbrev. Type Comment
1. Switch power (Priority 1) Po1 VA Power switching value to priority group 1
2. Switch power (Priority 2) Po2 VA Power switching value to priority group 2
3. Switch power (Priority 3) Po3 VA Power switching value to priority group 3

CONTROL ICONS ALPHABETIC REFERENCE
89 EN2Z-0940GE51 R0518
Type abbreviations: DI: Digital input VA: Virtual (pseudo) analog
Datapoints Button Click the Datapoints button to display the datapoints dialog box for XFM 35. Click
on Set for each of the XFM pointnames. CARE automatically creates user addresses with the same names. Later sections describe how to use these points depending on operation desired. The table following the dialog box summarizes user address types and functions.
The Counter_Zi, last pointname is handled differently from the other pointnames. After hightlighting Counter_Zi, click on the totalizer point in the schematic.
User Address Type Input/ Output
Comment
ID___Tariff VD Input 0: Use power limit P13 1: Use power limit P14
IA___Energy_Intv VA Output User address to indicate the current energy consumption (kWh) within the Measurement Interval [window] (change engineering units to kWh)
STARTUP (see Note) VD Input 0: Normal operation (application is not running) 1: Start-up operation (application is running)
ID___Sync_failed VD Output 0: Signal to initiate an alarm when the synchronization impulse is missing 1: Signal is not active
(Set Active State of this point to 1)
ID___Peak_load VD Output 1: Signal to all XFM 36-1/S/R to stop switching on the loads 0: Signal is not active
ID___Shutdown VD Output 1: Signal to all XFM 36-1/S/R to shed the loads immediately 0: Signal is not active
ID___Off_Prio_1 VD Input/ Output
Input:
0: There is no load to switch off in priority group 1 1: There is at least one load to switch off in priority group 1 Output:
0: Reset of the loads-available-to-turn-off detection for the priority group 1
ID___Off_Prio_2 VD Input/ Output
Input:
0: There is no load to switch off in priority group 2 1: There is at least one load to switch off in priority group 2 Output:
0: Reset of the loads-available-to-turn-off detection for the priority group 2
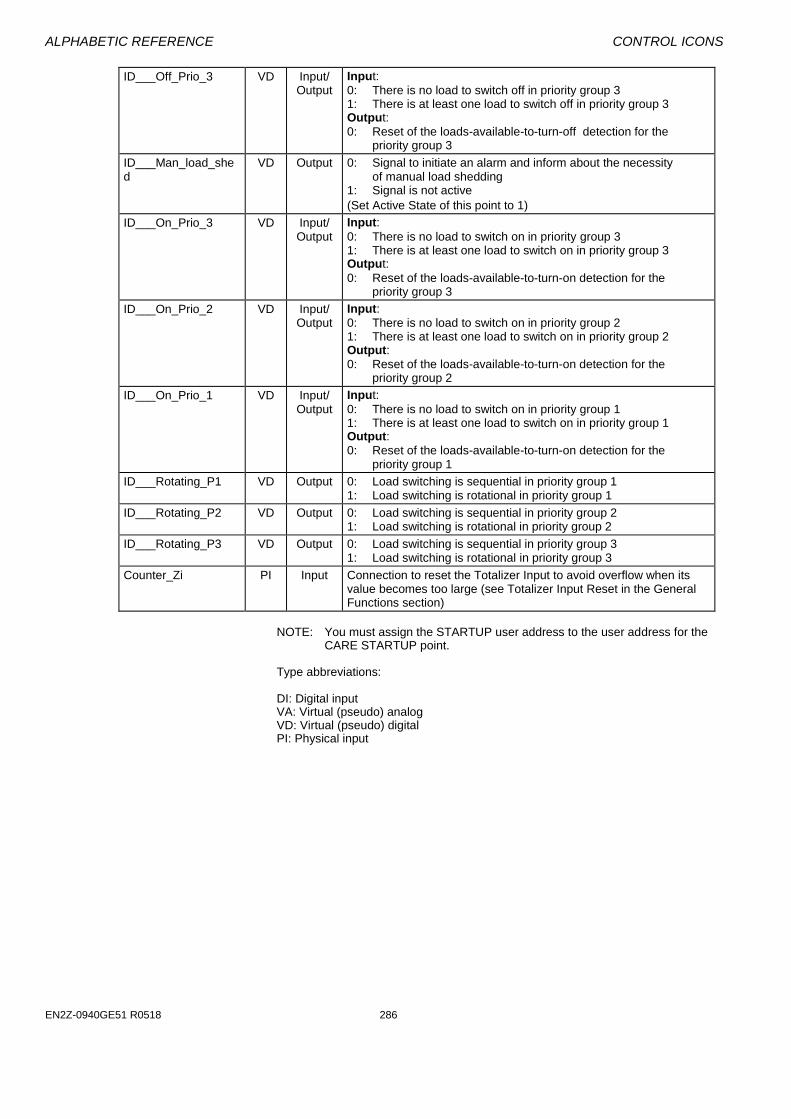
ALPHABETIC REFERENCE CONTROL ICONS
EN2Z-0940GE51 R0518 286
ID___Off_Prio_3 VD Input/ Output
Input:
0: There is no load to switch off in priority group 3 1: There is at least one load to switch off in priority group 3 Output:
0: Reset of the loads-available-to-turn-off detection for the priority group 3
ID___Man_load_shed
VD Output 0: Signal to initiate an alarm and inform about the necessity of manual load shedding 1: Signal is not active
(Set Active State of this point to 1)
ID___On_Prio_3 VD Input/ Output
Input:
0: There is no load to switch on in priority group 3 1: There is at least one load to switch on in priority group 3 Output:
0: Reset of the loads-available-to-turn-on detection for the priority group 3
ID___On_Prio_2 VD Input/ Output
Input:
0: There is no load to switch on in priority group 2 1: There is at least one load to switch on in priority group 2 Output:
0: Reset of the loads-available-to-turn-on detection for the priority group 2
ID___On_Prio_1 VD Input/ Output
Input:
0: There is no load to switch on in priority group 1 1: There is at least one load to switch on in priority group 1 Output:
0: Reset of the loads-available-to-turn-on detection for the priority group 1
ID___Rotating_P1 VD Output 0: Load switching is sequential in priority group 1 1: Load switching is rotational in priority group 1
ID___Rotating_P2 VD Output 0: Load switching is sequential in priority group 2 1: Load switching is rotational in priority group 2
ID___Rotating_P3 VD Output 0: Load switching is sequential in priority group 3 1: Load switching is rotational in priority group 3
Counter_Zi PI Input Connection to reset the Totalizer Input to avoid overflow when its value becomes too large (see Totalizer Input Reset in the General Functions section)
NOTE: You must assign the STARTUP user address to the user address for the
CARE STARTUP point.
Type abbreviations: DI: Digital input VA: Virtual (pseudo) analog VD: Virtual (pseudo) digital PI: Physical input
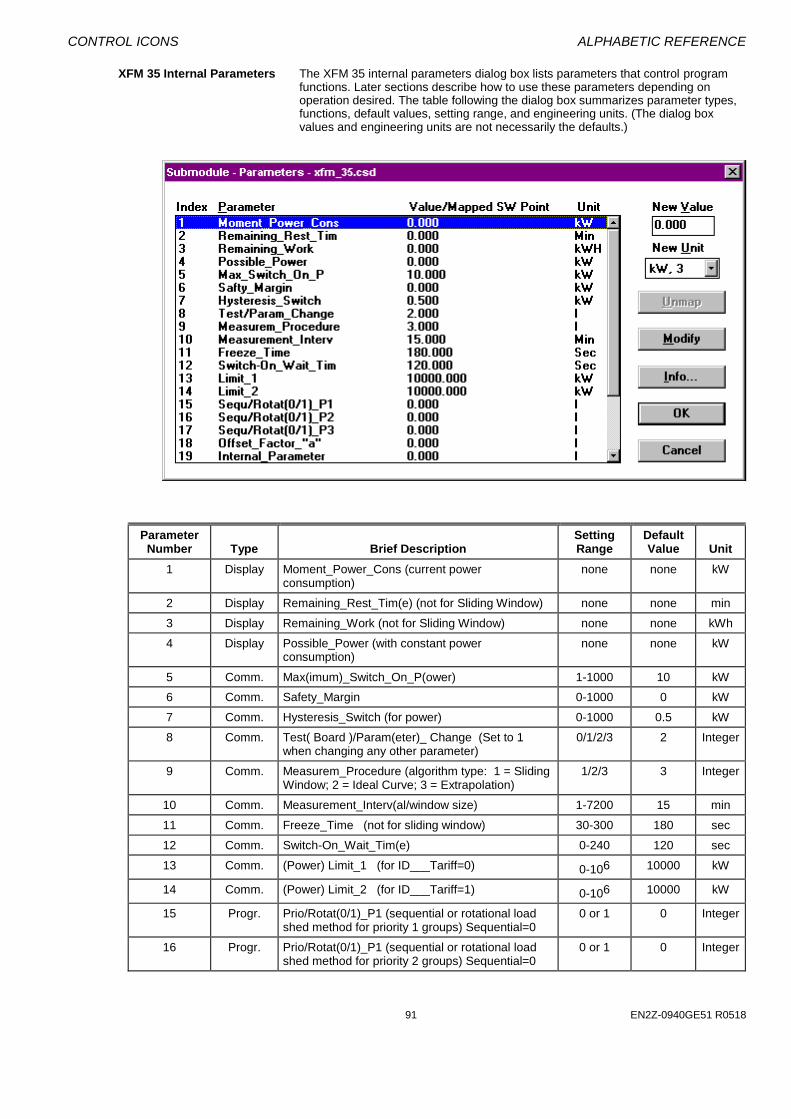
CONTROL ICONS ALPHABETIC REFERENCE
91 EN2Z-0940GE51 R0518
XFM 35 Internal Parameters The XFM 35 internal parameters dialog box lists parameters that control program functions. Later sections describe how to use these parameters depending on operation desired. The table following the dialog box summarizes parameter types, functions, default values, setting range, and engineering units. (The dialog box values and engineering units are not necessarily the defaults.)
Parameter Number
Type
Brief Description
Setting Range
Default Value
Unit
1 Display Moment_Power_Cons (current power consumption)
none none kW
2 Display Remaining_Rest_Tim(e) (not for Sliding Window) none none min
3 Display Remaining_Work (not for Sliding Window) none none kWh
4 Display Possible_Power (with constant power consumption)
none none kW
5 Comm. Max(imum)_Switch_On_P(ower) 1-1000 10 kW
6 Comm. Safety_Margin 0-1000 0 kW
7 Comm. Hysteresis_Switch (for power) 0-1000 0.5 kW
8 Comm. Test( Board )/Param(eter)_ Change (Set to 1 when changing any other parameter)
0/1/2/3 2 Integer
9 Comm. Measurem_Procedure (algorithm type: 1 = Sliding Window; 2 = Ideal Curve; 3 = Extrapolation)
1/2/3 3 Integer
10 Comm. Measurement_Interv(al/window size) 1-7200 15 min
11 Comm. Freeze_Time (not for sliding window) 30-300 180 sec
12 Comm. Switch-On_Wait_Tim(e) 0-240 120 sec
13 Comm. (Power) Limit_1 (for ID___Tariff=0) 0-106 10000 kW
14 Comm. (Power) Limit_2 (for ID___Tariff=1) 0-106 10000 kW
15 Progr. Prio/Rotat(0/1)_P1 (sequential or rotational load shed method for priority 1 groups) Sequential=0
0 or 1 0 Integer
16 Progr. Prio/Rotat(0/1)_P1 (sequential or rotational load shed method for priority 2 groups) Sequential=0
0 or 1 0 Integer
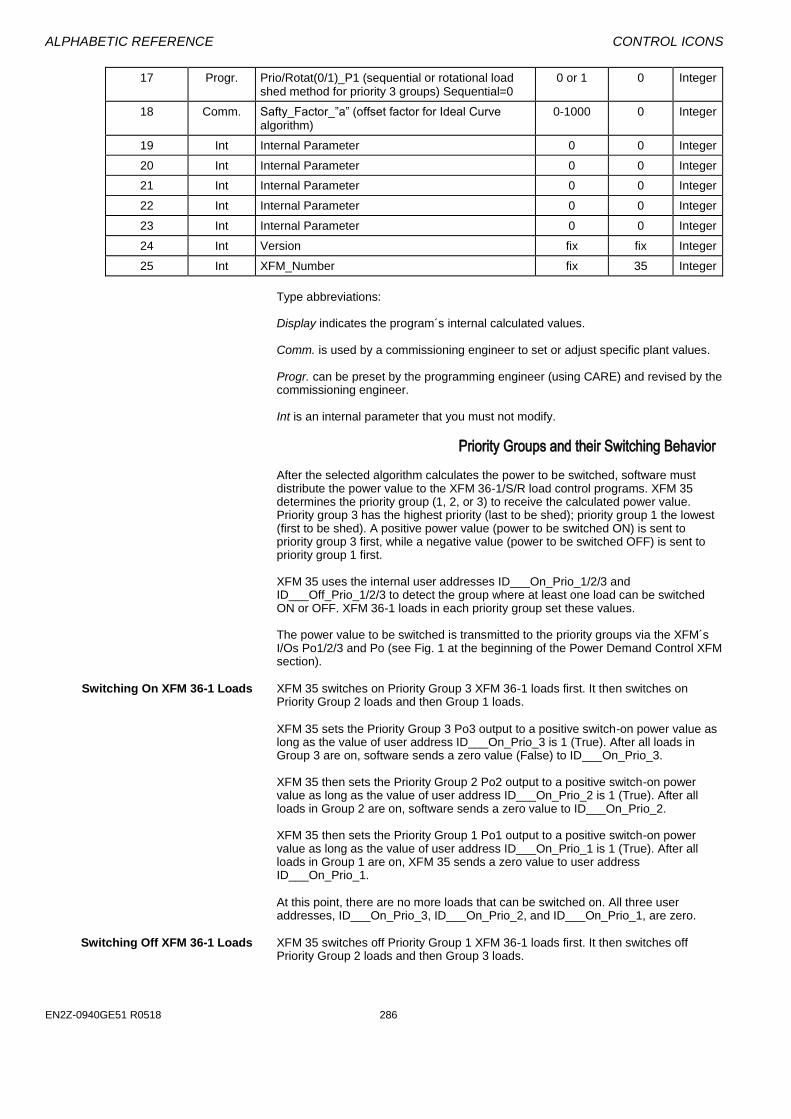
ALPHABETIC REFERENCE CONTROL ICONS
EN2Z-0940GE51 R0518 286
17 Progr. Prio/Rotat(0/1)_P1 (sequential or rotational load shed method for priority 3 groups) Sequential=0
0 or 1 0 Integer
18 Comm. Safty_Factor_”a” (offset factor for Ideal Curve algorithm)
0-1000 0 Integer
19 Int Internal Parameter 0 0 Integer
20 Int Internal Parameter 0 0 Integer
21 Int Internal Parameter 0 0 Integer
22 Int Internal Parameter 0 0 Integer
23 Int Internal Parameter 0 0 Integer
24 Int Version fix fix Integer
25 Int XFM_Number fix 35 Integer
Type abbreviations: Display indicates the program´s internal calculated values. Comm. is used by a commissioning engineer to set or adjust specific plant values. Progr. can be preset by the programming engineer (using CARE) and revised by the commissioning engineer. Int is an internal parameter that you must not modify.
Priority Groups and their Switching Behavior
After the selected algorithm calculates the power to be switched, software must distribute the power value to the XFM 36-1/S/R load control programs. XFM 35 determines the priority group (1, 2, or 3) to receive the calculated power value. Priority group 3 has the highest priority (last to be shed); priority group 1 the lowest (first to be shed). A positive power value (power to be switched ON) is sent to priority group 3 first, while a negative value (power to be switched OFF) is sent to priority group 1 first. XFM 35 uses the internal user addresses ID___On_Prio_1/2/3 and ID___Off_Prio_1/2/3 to detect the group where at least one load can be switched ON or OFF. XFM 36-1 loads in each priority group set these values. The power value to be switched is transmitted to the priority groups via the XFM´s I/Os Po1/2/3 and Po (see Fig. 1 at the beginning of the Power Demand Control XFM section).
Switching On XFM 36-1 Loads XFM 35 switches on Priority Group 3 XFM 36-1 loads first. It then switches on
Priority Group 2 loads and then Group 1 loads.
XFM 35 sets the Priority Group 3 Po3 output to a positive switch-on power value as long as the value of user address ID___On_Prio_3 is 1 (True). After all loads in Group 3 are on, software sends a zero value (False) to ID___On_Prio_3. XFM 35 then sets the Priority Group 2 Po2 output to a positive switch-on power value as long as the value of user address ID___On_Prio_2 is 1 (True). After all loads in Group 2 are on, software sends a zero value to ID___On_Prio_2. XFM 35 then sets the Priority Group 1 Po1 output to a positive switch-on power value as long as the value of user address ID___On_Prio_1 is 1 (True). After all loads in Group 1 are on, XFM 35 sends a zero value to user address ID___On_Prio_1.
At this point, there are no more loads that can be switched on. All three user addresses, ID___On_Prio_3, ID___On_Prio_2, and ID___On_Prio_1, are zero.
Switching Off XFM 36-1 Loads XFM 35 switches off Priority Group 1 XFM 36-1 loads first. It then switches off
Priority Group 2 loads and then Group 3 loads.

CONTROL ICONS ALPHABETIC REFERENCE
93 EN2Z-0940GE51 R0518
XFM 35 sets the Priority Group 1 Po1 output to a negative switch-off power value as long as the value of user address ID___Off_Prio_1 is 1 (True). After all loads in Group 1 are off, software sends a zero value (False) to ID___Off_Prio_1. XFM 35 then sets the Priority Group 2 Po2 output to a negative switch-off power value as long as the value of user address ID___Off_Prio_2 is 1 (True). After all loads in Group 2 are off, software sends a zero value to ID___Off_Prio_2. XFM 35 then sets the Priority Group 3 Po3 output to a negative switch-off power value as long as the value of user address ID___Off_Prio_3 is 1 (True). After all loads in Group 3 are off, XFM 35 sends a zero value to user address ID___Off_Prio_3. At this point, there are no more loads that can be switched off. All three user addresses, ID___Off_Prio_1, ID___Off_Prio_2, and ID___Off_Prio_3, are zero. XFM 35 cannot distribute the next calculated negative power value to any load (as all loads are shed [off]). XFM 35 initiates an alarm by setting user address ID___Man_load _shed to zero. This alarm means that manual load shedding is required.
XFM 35 Algorithms XFM 35 provides three measurement and calculation algorithms (Sliding Window, Ideal Curve, and Extrapolation) that you can select as required. To select an algorithm, set Parameter P9 to the values 1 (Sliding Window), 2 (Ideal Curve), or 3 (Extrapolation). Each algorithm measures the current power consumption, compares it to a power limit (Parameter P13 or P14), and calculates a power value for the XFM 36-1/S/R single-stage load control programs. A positive power value switches ON a load. A negative value switches OFF one or several loads. The maximum switch-on parameter (P5) limits the power value from an algorithm. Each algorithm samples the gradient of energy used and calculates the power to be switched. Sampling occurs 10 times per measurement interval or window time frame (Parameter P10).
Sliding Window Algorithm The Sliding Window algorithm provides a simple, but useful, control of the power
peak without the need for synchronization pulses. The Sliding Window algorithm is used primarily in the US.
Using a sliding time axis, the algorithm stores the increasing, measured power value (at the first XFM 35 input [Zi]) every tenth of the window time frame (1/10 of Parameter P10). The following diagram illustrates this technique.
The algorithm uses the measured energy values (Z1 Z10, and Z11) to calculate current power consumption (Parameter P1), possible power consumption

ALPHABETIC REFERENCE CONTROL ICONS
EN2Z-0940GE51 R0518 286
(Parameter P4), and finally the power value to be shed or restored by the XFM 36-1/S/R loads (P4 minus P1). (This algorithm does not use display Parameters P2 and P3. Therefore, their values remain zero at run-time.) Current power consumption (P1) is calculated by taking the energy (kWh) used in the last 1/10 of the window (Z10 - Z9) and dividing by the time (in hours) of that 1/10 of the window (t10 - t9). Possible power (kW) consumption (P4) is the average power allowed in the next 1/10 of the window (t11 - t10). It is determined by first calculating the remaining energy in kWh that may be consumed in the next 1/10 of the window without exceeding the demand limit setpoint. To calculate the remaining energy, subtract the energy (kWh) already used in the previous 9/10 of the window (Z10 - Z1) from the amount of energy allowed for a whole window (limit setpoint P13 or P14 [kW] times window [hours]). To determine the possible power (the rate of consumption that will result in consuming the remaining energy), the remaining energy is divided by the time [in hours] of 1/10 of a window. Example 1: Window = 1/4 hour (15 minutes) Limit setpoint = 600 kW Z1 = 45 kWh Z9 = 165 kWh Z10 = 181 kWh Datapoint user address IA___Energy_Intv indicates the current energy used so far within the sliding window (equal to Z10 minus Z1 in the previous diagram). The General Functions subsection explains the other Datapoint user addresses used in this algorithm.
Possible (allowed) Power (P4) (Limit Setpoint) x (Window) - (Z - Z )
1/10 x Window
=
=(600 kW) (1/4 hr) - (181 kWh - 45 kWh)
(0.1) (0.25 hr)=
150 kWh - 136 kWh
0.025 hr= 560 kWh
Current Power Consumption (P1)=
Z - Z Z - Z
=t - t 1/10 (Window)
=181 kWh - 165 kWh
(0.1) (0.25)=
16
0.025= 640 kW
10 1
10 9 10 9
10 9
The power value to be switched = P4 - P1 = 560 kW - 640 kW = -80 kW. Therefore, a -80 will be sent out to the Po outputs of XFM 35 to have the XFM 36-1/S/Rs shed 80 kW of loads. Parameter 6 provides a safety margin between the power limit setpoint (Parameter 13 or 14) and the actual operating setpoint. The value of Parameter 6 is subtracted from the value of Parameter 13 or 14 (whichever is in effect) before calculating the possible power P4. Therefore, P6 has a greater effect on the value of the kW to be shed than if it were subtracted from the P4 - P1 calculation. Example 2: Refer to Example 1, except for the following: P6 = 40 kW
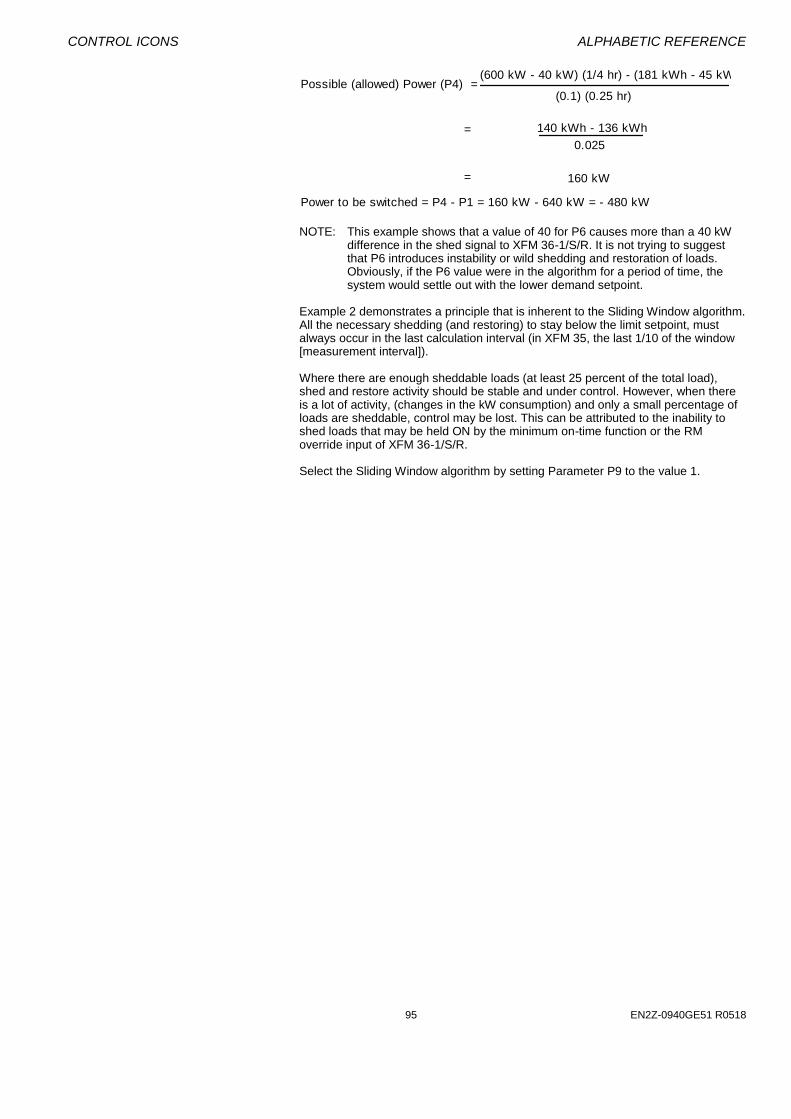
CONTROL ICONS ALPHABETIC REFERENCE
95 EN2Z-0940GE51 R0518
Possible (allowed) Power (P4) = (600 kW - 40 kW) (1/4 hr) - (181 kWh - 45 kWh)
(0.1) (0.25 hr)
= 140 kWh - 136 kWh
0.025
= 160 kW
Power to be switched = P4 - P1 = 160 kW - 640 kW = - 480 kW NOTE: This example shows that a value of 40 for P6 causes more than a 40 kW
difference in the shed signal to XFM 36-1/S/R. It is not trying to suggest that P6 introduces instability or wild shedding and restoration of loads. Obviously, if the P6 value were in the algorithm for a period of time, the system would settle out with the lower demand setpoint.
Example 2 demonstrates a principle that is inherent to the Sliding Window algorithm. All the necessary shedding (and restoring) to stay below the limit setpoint, must always occur in the last calculation interval (in XFM 35, the last 1/10 of the window [measurement interval]). Where there are enough sheddable loads (at least 25 percent of the total load), shed and restore activity should be stable and under control. However, when there is a lot of activity, (changes in the kW consumption) and only a small percentage of loads are sheddable, control may be lost. This can be attributed to the inability to shed loads that may be held ON by the minimum on-time function or the RM override input of XFM 36-1/S/R. Select the Sliding Window algorithm by setting Parameter P9 to the value 1.
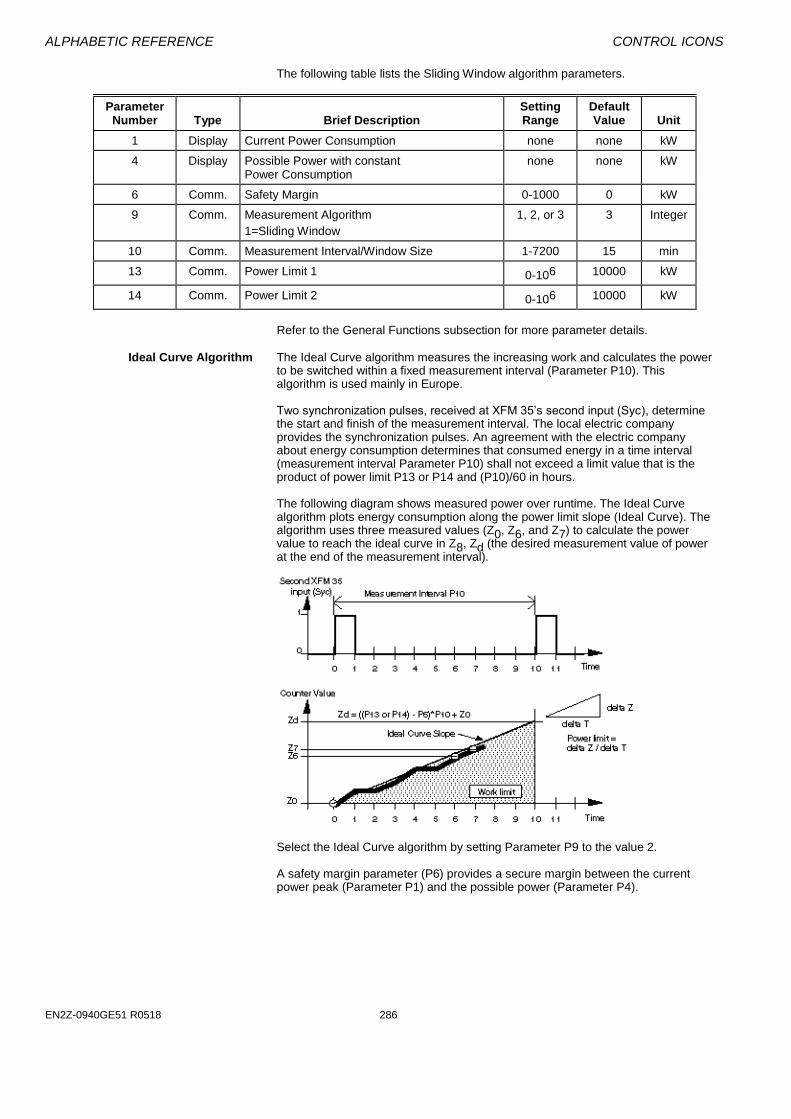
ALPHABETIC REFERENCE CONTROL ICONS
EN2Z-0940GE51 R0518 286
The following table lists the Sliding Window algorithm parameters.
Parameter Number
Type
Brief Description
Setting Range
Default Value
Unit
1 Display Current Power Consumption none none kW
4 Display Possible Power with constant Power Consumption
none none kW
6 Comm. Safety Margin 0-1000 0 kW
9 Comm. Measurement Algorithm
1=Sliding Window
1, 2, or 3 3 Integer
10 Comm. Measurement Interval/Window Size 1-7200 15 min
13 Comm. Power Limit 1 0-106 10000 kW
14 Comm. Power Limit 2 0-106 10000 kW
Refer to the General Functions subsection for more parameter details.
Ideal Curve Algorithm The Ideal Curve algorithm measures the increasing work and calculates the power
to be switched within a fixed measurement interval (Parameter P10). This algorithm is used mainly in Europe. Two synchronization pulses, received at XFM 35’s second input (Syc), determine the start and finish of the measurement interval. The local electric company provides the synchronization pulses. An agreement with the electric company about energy consumption determines that consumed energy in a time interval (measurement interval Parameter P10) shall not exceed a limit value that is the product of power limit P13 or P14 and (P10)/60 in hours. The following diagram shows measured power over runtime. The Ideal Curve algorithm plots energy consumption along the power limit slope (Ideal Curve). The algorithm uses three measured values (Z0, Z6, and Z7) to calculate the power value to reach the ideal curve in Z8, Zd (the desired measurement value of power at the end of the measurement interval).
Select the Ideal Curve algorithm by setting Parameter P9 to the value 2. A safety margin parameter (P6) provides a secure margin between the current power peak (Parameter P1) and the possible power (Parameter P4).

CONTROL ICONS ALPHABETIC REFERENCE
97 EN2Z-0940GE51 R0518
The algorithm uses an offset factor (P18) to amplify the power setpoint (possible power that displays in Parameter P4) at the beginning of every measurement interval. The effect of the offset factor lessens as time passes and disappears by the end of the measurement interval. The internal user address IA___Energy_Intv indicates the current energy consumed (equal to Z7 - Z0 in the previous diagram) during the measurement interval. The General Functions subsection explains the other internal user addresses and parameters used in this algorithm.
The following table lists the Ideal Curve algorithm parameters.
Parameter Number
Type
Brief Description
Setting Range
Default Value
Unit
1 Display Current Power Consumption none none kW
2 Display Remaining Rest Time none none min
3 Display Remaining Work none none kWh
4 Display Possible Power with constant Power Consumption
none none kW
6 Comm. Safety Margin 0-1000 0 kW
9 Comm. Measurement Algorithm
2=Ideal Curve
1/2/3 3 Integer
10 Comm. Measurement Interval/Window Size 1-7200 15 min
13 Comm. Power Limit 1 0-106 10000 kW
14 Comm. Power Limit 2 0-106 10000 kW
18 Comm. Offset Factor "a" (just for Ideal Curve Algorithm) 0-1000 0 Integer
Extrapolation Algorithm The Extrapolation algorithm measures the increase in energy consumption and calculates the power to be switched within a fixed measurement interval (Parameter P10). This algorithm is used mainly in Europe. Two synchronization pulses, received XFM 35’s second input (Syc), determine the start and finish of the measurement interval. A local electricity company provides the synchronization pulses. An agreement with an electricity company about energy consumption determines that consumed energy in a time interval (measurement interval Parameter P10) shall not exceed a limit value that is the product of power limit P13 or P14 and (P10)/60 in hours. The Extrapolation algorithm uses three measurement points to calculate the power to be switched by the loads. The following diagram shows the power value at the 7th sample in the measurement interval as a desired slope to reach the energy limit Zd. The algorithm uses work values Z0, Z6, and Z7 to calculate desired slope.
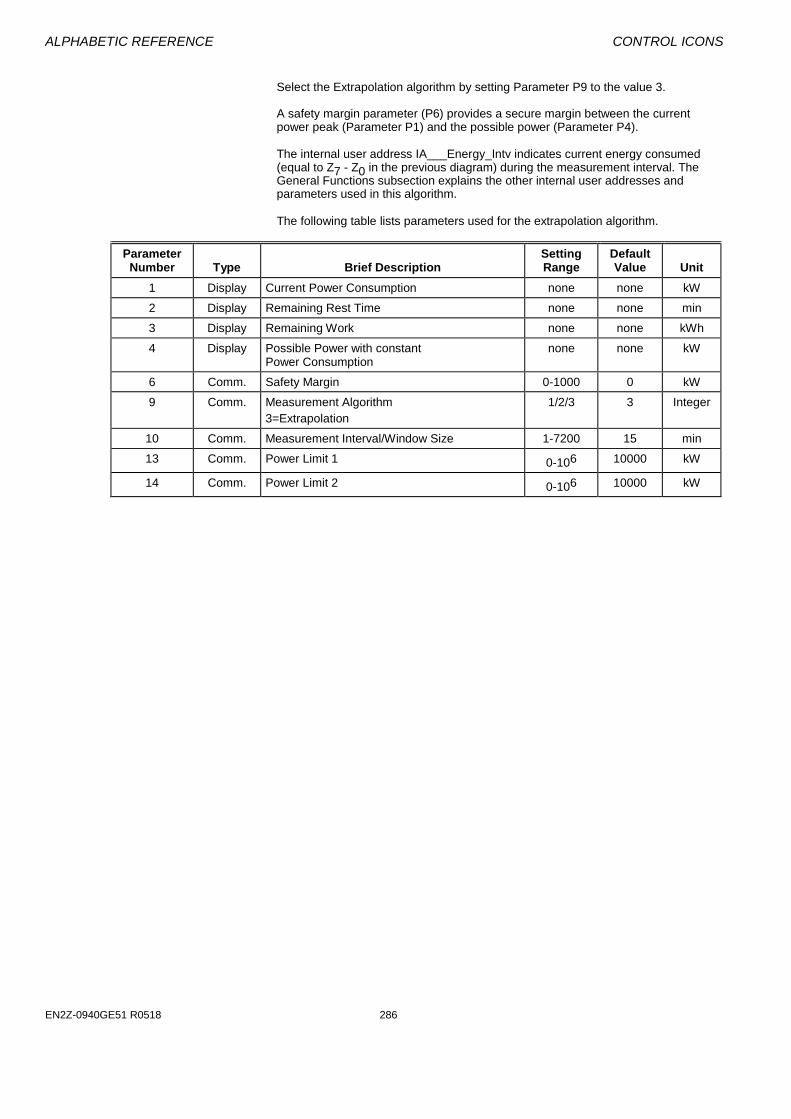
ALPHABETIC REFERENCE CONTROL ICONS
EN2Z-0940GE51 R0518 286
Select the Extrapolation algorithm by setting Parameter P9 to the value 3. A safety margin parameter (P6) provides a secure margin between the current power peak (Parameter P1) and the possible power (Parameter P4).
The internal user address IA___Energy_Intv indicates current energy consumed (equal to Z7 - Z0 in the previous diagram) during the measurement interval. The General Functions subsection explains the other internal user addresses and parameters used in this algorithm.
The following table lists parameters used for the extrapolation algorithm.
Parameter Number
Type
Brief Description
Setting Range
Default Value
Unit
1 Display Current Power Consumption none none kW
2 Display Remaining Rest Time none none min
3 Display Remaining Work none none kWh
4 Display Possible Power with constant Power Consumption
none none kW
6 Comm. Safety Margin 0-1000 0 kW
9 Comm. Measurement Algorithm
3=Extrapolation
1/2/3 3 Integer
10 Comm. Measurement Interval/Window Size 1-7200 15 min
13 Comm. Power Limit 1 0-106 10000 kW
14 Comm. Power Limit 2 0-106 10000 kW
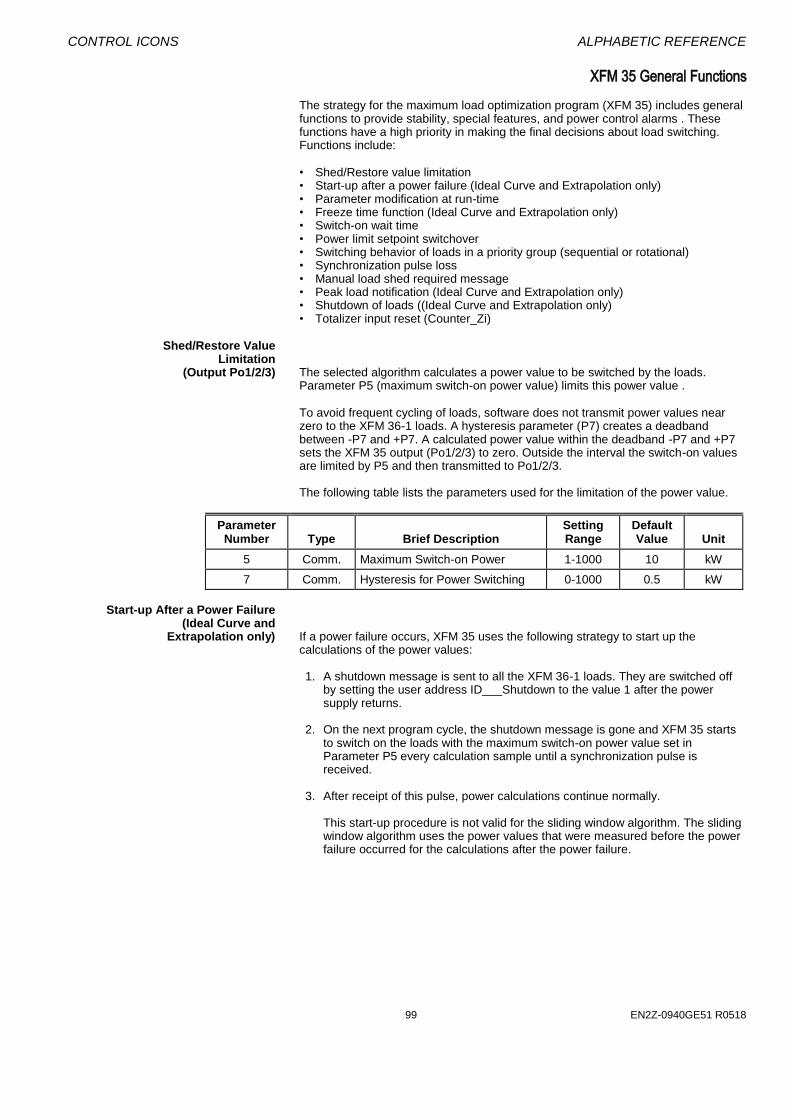
CONTROL ICONS ALPHABETIC REFERENCE
99 EN2Z-0940GE51 R0518
XFM 35 General Functions The strategy for the maximum load optimization program (XFM 35) includes general functions to provide stability, special features, and power control alarms . These functions have a high priority in making the final decisions about load switching. Functions include:
• Shed/Restore value limitation • Start-up after a power failure (Ideal Curve and Extrapolation only) • Parameter modification at run-time • Freeze time function (Ideal Curve and Extrapolation only) • Switch-on wait time • Power limit setpoint switchover • Switching behavior of loads in a priority group (sequential or rotational) • Synchronization pulse loss • Manual load shed required message • Peak load notification (Ideal Curve and Extrapolation only) • Shutdown of loads ((Ideal Curve and Extrapolation only) • Totalizer input reset (Counter_Zi)
Shed/Restore Value Limitation (Output Po1/2/3) The selected algorithm calculates a power value to be switched by the loads.
Parameter P5 (maximum switch-on power value) limits this power value .
To avoid frequent cycling of loads, software does not transmit power values near zero to the XFM 36-1 loads. A hysteresis parameter (P7) creates a deadband between -P7 and +P7. A calculated power value within the deadband -P7 and +P7 sets the XFM 35 output (Po1/2/3) to zero. Outside the interval the switch-on values are limited by P5 and then transmitted to Po1/2/3. The following table lists the parameters used for the limitation of the power value.
Parameter Number
Type
Brief Description
Setting Range
Default Value
Unit
5 Comm. Maximum Switch-on Power 1-1000 10 kW
7 Comm. Hysteresis for Power Switching 0-1000 0.5 kW
Start-up After a Power Failure (Ideal Curve and Extrapolation only) If a power failure occurs, XFM 35 uses the following strategy to start up the
calculations of the power values: 1. A shutdown message is sent to all the XFM 36-1 loads. They are switched off
by setting the user address ID___Shutdown to the value 1 after the power supply returns.
2. On the next program cycle, the shutdown message is gone and XFM 35 starts
to switch on the loads with the maximum switch-on power value set in Parameter P5 every calculation sample until a synchronization pulse is received.
3. After receipt of this pulse, power calculations continue normally. This start-up procedure is not valid for the sliding window algorithm. The sliding
window algorithm uses the power values that were measured before the power failure occurred for the calculations after the power failure.
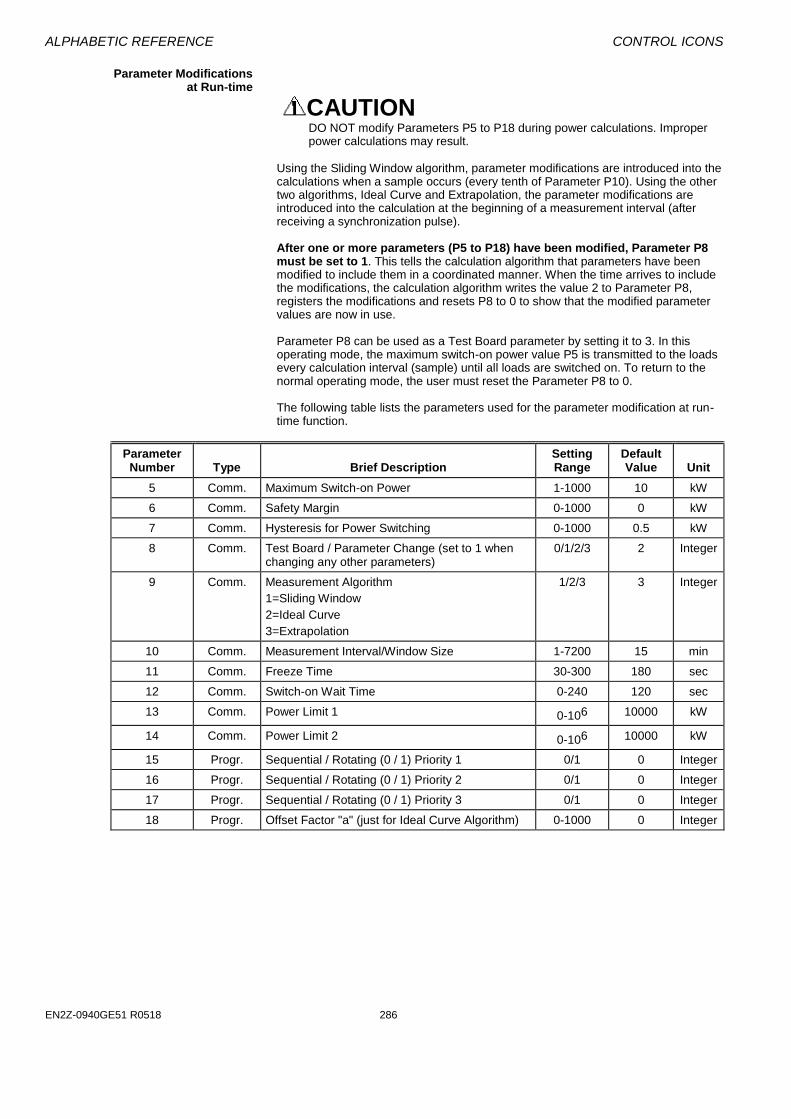
ALPHABETIC REFERENCE CONTROL ICONS
EN2Z-0940GE51 R0518 286
Parameter Modifications at Run-time
CAUTION DO NOT modify Parameters P5 to P18 during power calculations. Improper power calculations may result.
Using the Sliding Window algorithm, parameter modifications are introduced into the calculations when a sample occurs (every tenth of Parameter P10). Using the other two algorithms, Ideal Curve and Extrapolation, the parameter modifications are introduced into the calculation at the beginning of a measurement interval (after receiving a synchronization pulse). After one or more parameters (P5 to P18) have been modified, Parameter P8 must be set to 1. This tells the calculation algorithm that parameters have been modified to include them in a coordinated manner. When the time arrives to include the modifications, the calculation algorithm writes the value 2 to Parameter P8, registers the modifications and resets P8 to 0 to show that the modified parameter values are now in use. Parameter P8 can be used as a Test Board parameter by setting it to 3. In this operating mode, the maximum switch-on power value P5 is transmitted to the loads every calculation interval (sample) until all loads are switched on. To return to the normal operating mode, the user must reset the Parameter P8 to 0. The following table lists the parameters used for the parameter modification at run-time function.
Parameter Number
Type
Brief Description
Setting Range
Default Value
Unit
5 Comm. Maximum Switch-on Power 1-1000 10 kW
6 Comm. Safety Margin 0-1000 0 kW
7 Comm. Hysteresis for Power Switching 0-1000 0.5 kW
8 Comm. Test Board / Parameter Change (set to 1 when changing any other parameters)
0/1/2/3 2 Integer
9 Comm. Measurement Algorithm
1=Sliding Window
2=Ideal Curve
3=Extrapolation
1/2/3 3 Integer
10 Comm. Measurement Interval/Window Size 1-7200 15 min
11 Comm. Freeze Time 30-300 180 sec
12 Comm. Switch-on Wait Time 0-240 120 sec
13 Comm. Power Limit 1 0-106 10000 kW
14 Comm. Power Limit 2 0-106 10000 kW
15 Progr. Sequential / Rotating (0 / 1) Priority 1 0/1 0 Integer
16 Progr. Sequential / Rotating (0 / 1) Priority 2 0/1 0 Integer
17 Progr. Sequential / Rotating (0 / 1) Priority 3 0/1 0 Integer
18 Progr. Offset Factor "a" (just for Ideal Curve Algorithm) 0-1000 0 Integer

CONTROL ICONS ALPHABETIC REFERENCE
101 EN2Z-0940GE51 R0518
Freeze Time Function (Ideal Curve and Extrapolation only) The freeze time function (only for the Ideal Curve and Extrapolation algorithms) is
initiated at the beginning of every measurement interval (window) and ends after the time set in Parameter P11 has elapsed. During the freeze time, no power value to switch the loads (to the output Po1/2/3) is issued, but the calculation algorithm continues to run normally.
This function is used to prevent incorrect (too early) load switching at the beginning of every measurement interval. The minimum duration of the freeze time (minimum value of Parameter P11) is preset to 30 seconds and should not be set to a value less than 30 seconds at run time. The following tables describes the parameter used for the freeze time function.
Parameter Number
Type
Brief Description
Setting Range
Default Value
Unit
11 Comm. Freeze Time (not for Sliding Window) 30-300 180 sec
Switch-on Wait Time The switch-on wait time function is valid for all power calculation algorithms and is
initiated by the transition of the calculated switching power from a negative to a positive value. Parameter P12 sets the duration of the switch-on wait time.
This function provides controlled switching ON of loads after the calculation procedure makes a transition from shedding loads to restoring loads. The following table describes the parameter used for the switch-on wait time.
Parameter Number
Type
Brief Description
Setting Range
Default Value
Unit
12 Comm. Switch-on Wait Time 0-240 120 sec
Power Limit Setpoint Switchover Either of two power limit (demand) setpoint values (Parameter P13 or P14) can be
used depending on the value (0 or 1) of the internal user address ID___Tariff. The value 0 at ID___Tariff switches the power limit setpoint Parameter P13 to the power calculation algorithm, while the value 1 switches Parameter P14.
A simple application for this switchover function is a Time Program that uses ID___Tariff to switch between power limit Parameters P13 and P14, depending on the time of day. The following table lists parameters used for the power limit switchover function.
Parameter Number
Type
Brief Description
Setting Range
Default Value
Unit
13 Comm. Power Limit 1 0-106 10000 kW
14 Comm. Power Limit 2 0-106 10000 kW
Switching Behavior of Loads in a Priority Group You can select one of two switching behaviors for each priority group by setting the
Parameters P15 for group 1, P16 for group 2, and P17 for group 3.
The first switching behavior (P15/16/17 is set to 0) is the sequential switching of loads according to the load number (P14 of XFM 36-1) of a load XFM 36-1 within a priority group. Load number 1 is switched on at first and the loads number 2. 3, - 50 are switched on in a group 1/2/3. The switched-on load with the highest number is switched off and shed first. Make sure that loads are numbered accordingly (Parameter 14 in XFM 36-1.)
The second switching behavior (P15/16/17 is set to 1) is the rotating switching of loads according to their measured times of being On or Off. The load that has been
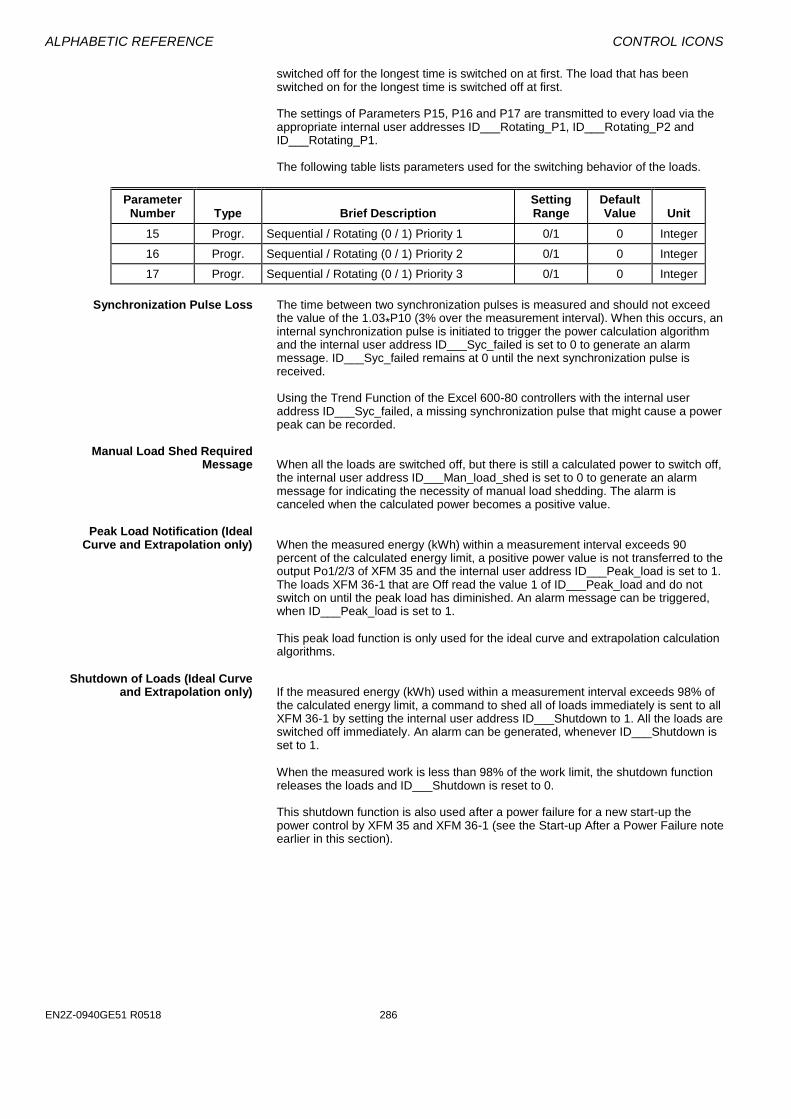
ALPHABETIC REFERENCE CONTROL ICONS
EN2Z-0940GE51 R0518 286
switched off for the longest time is switched on at first. The load that has been switched on for the longest time is switched off at first. The settings of Parameters P15, P16 and P17 are transmitted to every load via the appropriate internal user addresses ID___Rotating_P1, ID___Rotating_P2 and ID___Rotating_P1. The following table lists parameters used for the switching behavior of the loads.
Parameter Number
Type
Brief Description
Setting Range
Default Value
Unit
15 Progr. Sequential / Rotating (0 / 1) Priority 1 0/1 0 Integer
16 Progr. Sequential / Rotating (0 / 1) Priority 2 0/1 0 Integer
17 Progr. Sequential / Rotating (0 / 1) Priority 3 0/1 0 Integer
Synchronization Pulse Loss The time between two synchronization pulses is measured and should not exceed
the value of the 1.03*P10 (3% over the measurement interval). When this occurs, an internal synchronization pulse is initiated to trigger the power calculation algorithm and the internal user address ID___Syc_failed is set to 0 to generate an alarm message. ID___Syc_failed remains at 0 until the next synchronization pulse is received. Using the Trend Function of the Excel 600-80 controllers with the internal user address ID___Syc_failed, a missing synchronization pulse that might cause a power peak can be recorded.
Manual Load Shed Required Message When all the loads are switched off, but there is still a calculated power to switch off,
the internal user address ID___Man_load_shed is set to 0 to generate an alarm message for indicating the necessity of manual load shedding. The alarm is canceled when the calculated power becomes a positive value.
Peak Load Notification (Ideal Curve and Extrapolation only) When the measured energy (kWh) within a measurement interval exceeds 90
percent of the calculated energy limit, a positive power value is not transferred to the output Po1/2/3 of XFM 35 and the internal user address ID___Peak_load is set to 1. The loads XFM 36-1 that are Off read the value 1 of ID___Peak_load and do not switch on until the peak load has diminished. An alarm message can be triggered, when ID___Peak_load is set to 1.
This peak load function is only used for the ideal curve and extrapolation calculation algorithms.
Shutdown of Loads (Ideal Curve and Extrapolation only) If the measured energy (kWh) used within a measurement interval exceeds 98% of
the calculated energy limit, a command to shed all of loads immediately is sent to all XFM 36-1 by setting the internal user address ID___Shutdown to 1. All the loads are switched off immediately. An alarm can be generated, whenever ID___Shutdown is set to 1.
When the measured work is less than 98% of the work limit, the shutdown function releases the loads and ID___Shutdown is reset to 0. This shutdown function is also used after a power failure for a new start-up the power control by XFM 35 and XFM 36-1 (see the Start-up After a Power Failure note earlier in this section).
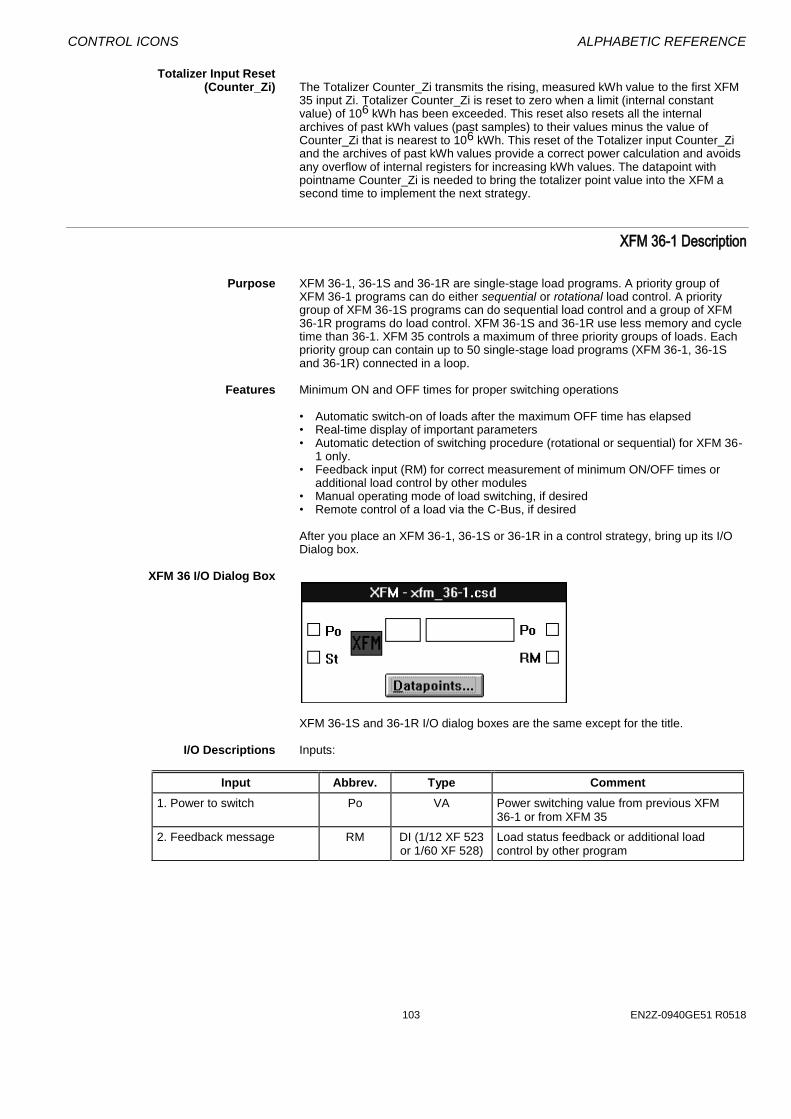
CONTROL ICONS ALPHABETIC REFERENCE
103 EN2Z-0940GE51 R0518
Totalizer Input Reset (Counter_Zi) The Totalizer Counter_Zi transmits the rising, measured kWh value to the first XFM
35 input Zi. Totalizer Counter_Zi is reset to zero when a limit (internal constant value) of 106 kWh has been exceeded. This reset also resets all the internal archives of past kWh values (past samples) to their values minus the value of Counter_Zi that is nearest to 106 kWh. This reset of the Totalizer input Counter_Zi and the archives of past kWh values provide a correct power calculation and avoids any overflow of internal registers for increasing kWh values. The datapoint with pointname Counter_Zi is needed to bring the totalizer point value into the XFM a second time to implement the next strategy.
XFM 36-1 Description
Purpose XFM 36-1, 36-1S and 36-1R are single-stage load programs. A priority group of
XFM 36-1 programs can do either sequential or rotational load control. A priority group of XFM 36-1S programs can do sequential load control and a group of XFM 36-1R programs do load control. XFM 36-1S and 36-1R use less memory and cycle time than 36-1. XFM 35 controls a maximum of three priority groups of loads. Each priority group can contain up to 50 single-stage load programs (XFM 36-1, 36-1S and 36-1R) connected in a loop.
Features Minimum ON and OFF times for proper switching operations
• Automatic switch-on of loads after the maximum OFF time has elapsed • Real-time display of important parameters • Automatic detection of switching procedure (rotational or sequential) for XFM 36-
1 only. • Feedback input (RM) for correct measurement of minimum ON/OFF times or
additional load control by other modules • Manual operating mode of load switching, if desired • Remote control of a load via the C-Bus, if desired After you place an XFM 36-1, 36-1S or 36-1R in a control strategy, bring up its I/O Dialog box.
XFM 36 I/O Dialog Box
XFM 36-1S and 36-1R I/O dialog boxes are the same except for the title.
I/O Descriptions Inputs:
Input Abbrev. Type Comment
1. Power to switch Po VA Power switching value from previous XFM 36-1 or from XFM 35
2. Feedback message RM DI (1/12 XF 523 or 1/60 XF 528)
Load status feedback or additional load control by other program
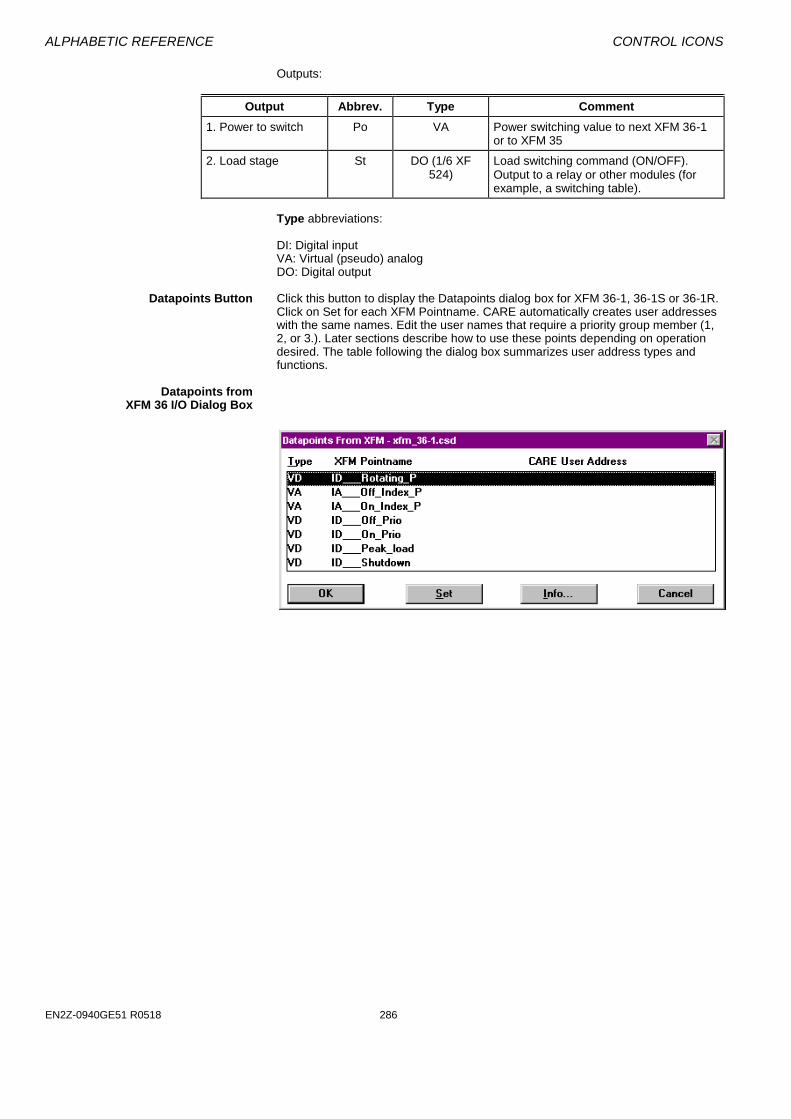
ALPHABETIC REFERENCE CONTROL ICONS
EN2Z-0940GE51 R0518 286
Outputs:
Output Abbrev. Type Comment
1. Power to switch Po VA Power switching value to next XFM 36-1 or to XFM 35
2. Load stage St DO (1/6 XF 524)
Load switching command (ON/OFF). Output to a relay or other modules (for example, a switching table).
Type abbreviations: DI: Digital input VA: Virtual (pseudo) analog DO: Digital output
Datapoints Button Click this button to display the Datapoints dialog box for XFM 36-1, 36-1S or 36-1R.
Click on Set for each XFM Pointname. CARE automatically creates user addresses with the same names. Edit the user names that require a priority group member (1, 2, or 3.). Later sections describe how to use these points depending on operation desired. The table following the dialog box summarizes user address types and functions.
Datapoints from XFM 36 I/O Dialog Box
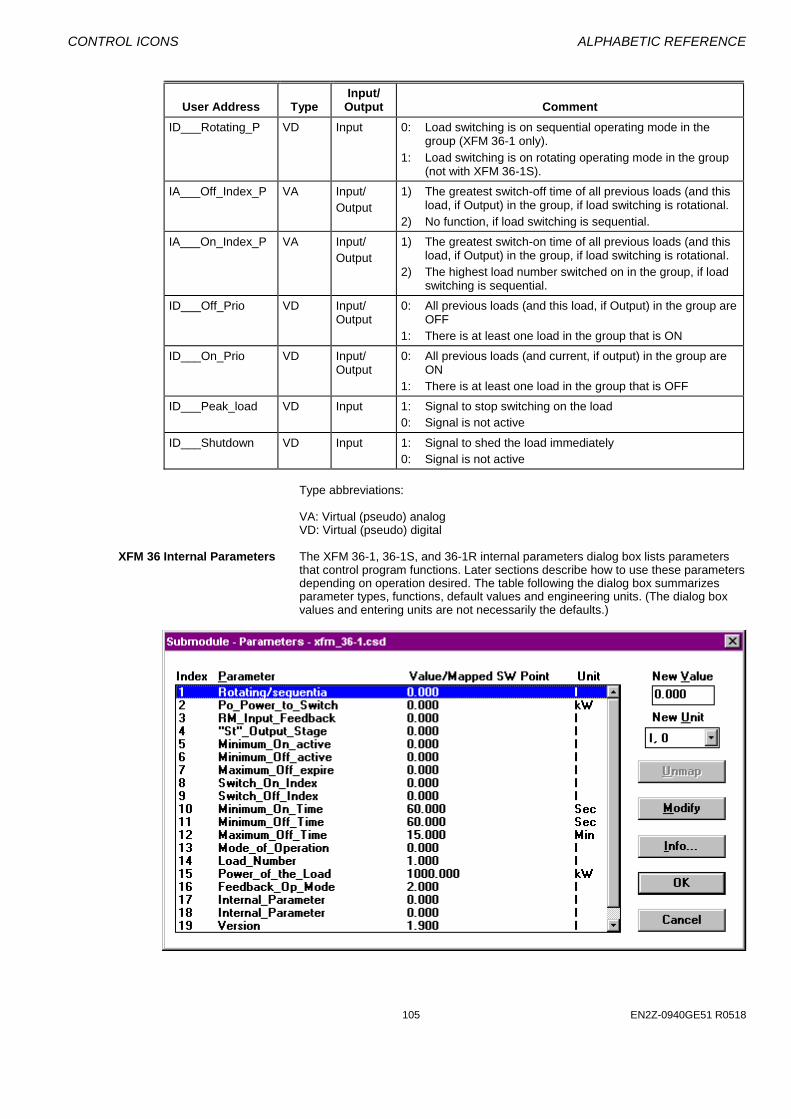
CONTROL ICONS ALPHABETIC REFERENCE
105 EN2Z-0940GE51 R0518
User Address
Type
Input/ Output
Comment
ID___Rotating_P VD Input 0: Load switching is on sequential operating mode in the group (XFM 36-1 only).
1: Load switching is on rotating operating mode in the group (not with XFM 36-1S).
IA___Off_Index_P VA Input/
Output
1) The greatest switch-off time of all previous loads (and this load, if Output) in the group, if load switching is rotational.
2) No function, if load switching is sequential.
IA___On_Index_P VA Input/
Output
1) The greatest switch-on time of all previous loads (and this load, if Output) in the group, if load switching is rotational.
2) The highest load number switched on in the group, if load switching is sequential.
ID___Off_Prio VD Input/ Output
0: All previous loads (and this load, if Output) in the group are OFF
1: There is at least one load in the group that is ON
ID___On_Prio VD Input/ Output
0: All previous loads (and current, if output) in the group are ON
1: There is at least one load in the group that is OFF
ID___Peak_load VD Input 1: Signal to stop switching on the load
0: Signal is not active
ID___Shutdown VD Input 1: Signal to shed the load immediately
0: Signal is not active
Type abbreviations: VA: Virtual (pseudo) analog VD: Virtual (pseudo) digital
XFM 36 Internal Parameters The XFM 36-1, 36-1S, and 36-1R internal parameters dialog box lists parameters
that control program functions. Later sections describe how to use these parameters depending on operation desired. The table following the dialog box summarizes parameter types, functions, default values and engineering units. (The dialog box values and entering units are not necessarily the defaults.)

ALPHABETIC REFERENCE CONTROL ICONS
EN2Z-0940GE51 R0518 286
Parameter Number
Type
Brief Description
Setting Range
Default Value
Unit
1 Display Rotational/Sequential (Operating Mode) 1=rotational; 0=sequential
36-1: none
36-1S
36-1R
none
0
1
lnteger
2 Display Po_Power_to_Switch (switching power input) none none kW
3 Display RM_Input_Feedback (see RM Functions section)
none none lnteger
4 Display “St”_Output_Stage (current load status) 1=on; 0=off
none none lnteger
5 Display Minimum_On_active (ON time active=1) none none lnteger
6 Display Minimum_Off_active (OFF time active=1) none none lnteger
7 Display Maximum_Off_expire (OFF time expired=1) none none lnteger
8 Display Switch_On_Index (equals IA___On_Index P1/2/3) in sequential mode; longest on time in rotational mode)
none none lnteger
9 Display Switch_Off_Index (no function in sequential mode; load off time in rotational mode) XFM 36-1 and 36-1R
none none lnteger
Int Internal Parameter (XFM 36-1S) 0 0 ---
10 Comm. Minimum_On_time 0-300 60 sec
11 Comm. Minimum_Off_time 0-400 60 sec
12 Comm. Maximum_Off_time
0=No max off-time function
0-1440 15 min
13 Comm. Mode_of_Operation
0=Auto; 1=ON; 2=OFF
0/1/2 0 lnteger
14 Progr. Load_Number (priority rank within a group)
0=RM for status feedback
1=RM and Po
2=No RM function
1-50 1 lnteger
15 Progr. Power_of_the_Load (highest number is shed first)
0-1000 1000 kW
16 Progr. Feedback_Op_Mode
0=RM for status feedback
1=RM and Po
2=No RM function
0/1/2 2 lnteger
17 Int. Internal_Parameter 0 0 lnteger
18 Int. Internal_Parameter 0 0 lnteger
19 Int Version fix fix lnteger
20 Int XFM_Number fix 36.1 (XFM 36-1)
36.11 (XFM 36-1S)
36.12 (XFM 36-1R)
lnteger
Type abbreviations: Display indicates the program´s internal calculated values. Comm. is used by a commissioning engineer to set or adjust specific plant values. Progr. can be preset by the programming engineer (using CARE) and revised by the commissioning engineer. Int is an internal parameter that you must not modify.

CONTROL ICONS ALPHABETIC REFERENCE
107 EN2Z-0940GE51 R0518
Automatic Load Switch-On after Maximum OFF Time Expiration
Some electrical loads such as refrigerators or cold-storage houses cannot be switched off for long periods of time or the plants or goods in them may sustain damage. For these loads, Parameter P12 (maximum OFF time) sets a limit time value. Each time an XFM 36-1/S/R switches off the load, a timer starts to measure the time the load is OFF. If the timer exceeds the maximum OFF time (Parameter P12), XFM 36-1/S/R switches on the load for the minimum ON time duration (Parameter P10). The peak load and shutdown functions have absolute priority and can prevent the XFM 36-1/S/R from switching on the unit after exceeding the maximum OFF time.
Display Parameter P7 indicates the expiration of maximum OFF time. Automatic load switch-on after the expiration of Maximum OFF Time sets P7 to 1. Otherwise, P7 is set to 0. When the Maximum OFF time is exceeded,, the load switches on and display Parameter P5 indicates that the minimum ON time (P5 = 1), function is now active. After the minimum ON time, the load will turn OFF (assuming that the power demand system still wants it shed.) The following table lists parameters used for the automatic switch-on of load after maximum OFF time has expired:
Parameter Number
Type
Description
Setting Range
Default Value
Unit
5 Display Minimum ON Time Active none none Integer
7 Display Maximum OFF Time Expired none none Integer
10 Comm. Minimum ON Time 0-300 60 sec
12 Comm. Maximum OFF Time 0=No maximum OFF time function
0-1440 15 min
RM Functions
Parameter P16 determines whether the RM input of XFM 36-1/S/R provides load status feedback, is an additional control to switch on the load, or has no effect at all. If Parameter P16 is 0, XFM 36-1/S/R uses the RM input to receive the status feedback (ON or OFF) from the load. The input RM initiates the minimum ON or OFF time functions when load status changes from OFF to ON or from ON to OFF, respectively . If Parameter P16 is 1, XFM 36-1/S/R uses the input RM as a software input for additional load control by another software module. The command (ON or OFF) to the load in the result of Boolean ANDing of the command of the regular XFM 36-1/S/R functions as influenced by the Po input value AND the state of the RM input. XFM 36-1/S/R transfers this switching result (ON/OFF) to the second output St after minimum ON or OFF time elapses. If Parameter P16 is 2 (default setting), input RM has no function. Connect the RM input to a dummy digital flag to ensure all XFM 36-1/S/R I/Os are connected. Display Parameter P3 indicates the current status of the second input, RM. A 1 value indicates that RM is ON; a 0 indicates that RM is OFF. The following table lists the parameters used for the second input RM functions:
Parameter Number
Type
Description
Setting Range
Default Value
Unit
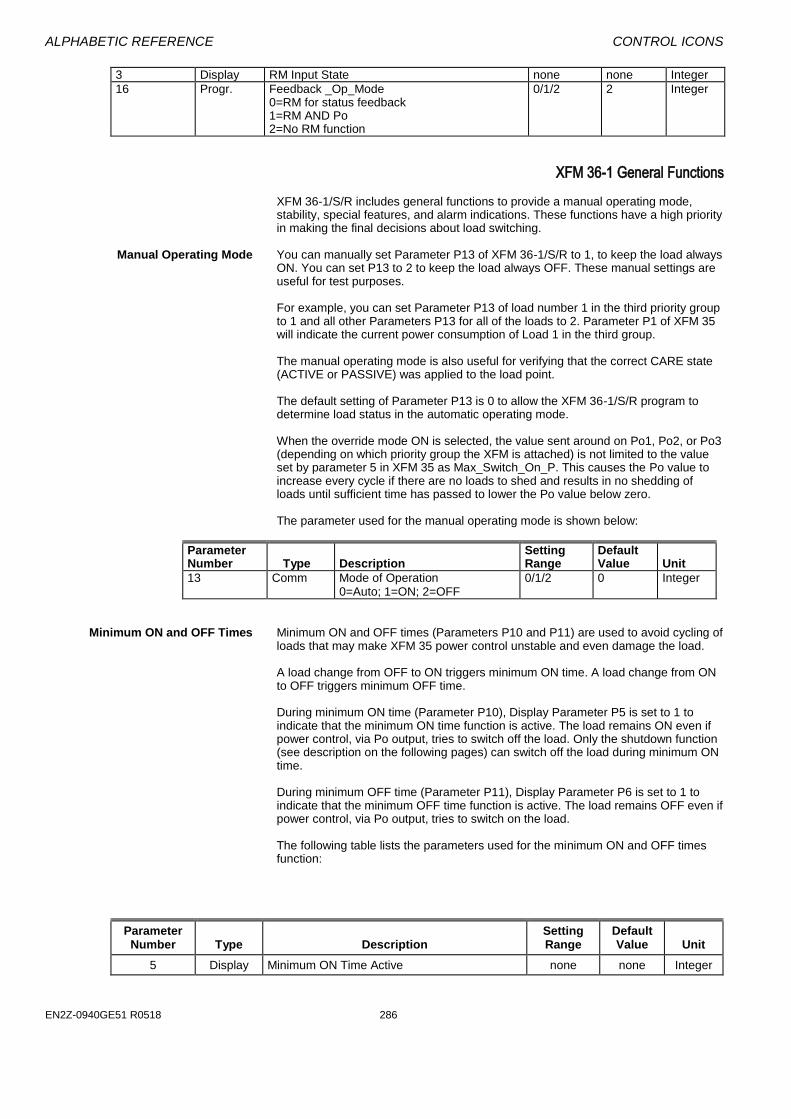
ALPHABETIC REFERENCE CONTROL ICONS
EN2Z-0940GE51 R0518 286
3 Display RM Input State none none Integer
16 Progr. Feedback _Op_Mode 0=RM for status feedback 1=RM AND Po 2=No RM function
0/1/2 2 Integer
XFM 36-1 General Functions
XFM 36-1/S/R includes general functions to provide a manual operating mode, stability, special features, and alarm indications. These functions have a high priority in making the final decisions about load switching.
Manual Operating Mode You can manually set Parameter P13 of XFM 36-1/S/R to 1, to keep the load always
ON. You can set P13 to 2 to keep the load always OFF. These manual settings are useful for test purposes.
For example, you can set Parameter P13 of load number 1 in the third priority group to 1 and all other Parameters P13 for all of the loads to 2. Parameter P1 of XFM 35 will indicate the current power consumption of Load 1 in the third group. The manual operating mode is also useful for verifying that the correct CARE state (ACTIVE or PASSIVE) was applied to the load point. The default setting of Parameter P13 is 0 to allow the XFM 36-1/S/R program to determine load status in the automatic operating mode. When the override mode ON is selected, the value sent around on Po1, Po2, or Po3 (depending on which priority group the XFM is attached) is not limited to the value set by parameter 5 in XFM 35 as Max_Switch_On_P. This causes the Po value to increase every cycle if there are no loads to shed and results in no shedding of loads until sufficient time has passed to lower the Po value below zero. The parameter used for the manual operating mode is shown below:
Parameter Number
Type
Description
Setting Range
Default Value
Unit
13 Comm Mode of Operation 0=Auto; 1=ON; 2=OFF
0/1/2 0 Integer
Minimum ON and OFF Times Minimum ON and OFF times (Parameters P10 and P11) are used to avoid cycling of loads that may make XFM 35 power control unstable and even damage the load.
A load change from OFF to ON triggers minimum ON time. A load change from ON to OFF triggers minimum OFF time. During minimum ON time (Parameter P10), Display Parameter P5 is set to 1 to indicate that the minimum ON time function is active. The load remains ON even if power control, via Po output, tries to switch off the load. Only the shutdown function (see description on the following pages) can switch off the load during minimum ON time. During minimum OFF time (Parameter P11), Display Parameter P6 is set to 1 to indicate that the minimum OFF time function is active. The load remains OFF even if power control, via Po output, tries to switch on the load. The following table lists the parameters used for the minimum ON and OFF times function:
Parameter Number
Type
Description
Setting Range
Default Value
Unit
5 Display Minimum ON Time Active none none Integer
CONTROL ICONS ALPHABETIC REFERENCE
109 EN2Z-0940GE51 R0518
6 Display Minimum OFF Time Active none none Integer
10 Comm. Minimum ON Time 0-300 60 sec
11 Comm. Minimum OFF Time 0-400 60 sec
Peak Load Function (Ideal Curve and Extrapolation Only) XFM 35 determines when peak load occurs (see General Functions in the XFM 35
section) and sets user address ID___Peak_load to 1 to notify all XFM 36-1/S/Rs to stop switching on.
When the peak load function is active (ID___Peak_load = 1), the load cannot switch from OFF to ON.
Immediate Load Shedding (Shutdown) XFM 35 determines when immediate shutdown is necessary (see General
Functions in the XFM 35 section) and sets user address ID___Shutdown to 1 to command all XFM 36-1/S/Rs to immediately shed their loads.
When an XFM 36-1/S/R reads a 1 value in ID___Shutdown, it switches off its load, regardless of minimum ON time.
After the shutdown command is over (ID___Shutdown = 0), each XFM 36-1/S/R must again receive a positive power value at its Po input before its load is turned ON.
Start-up after a Power Failure Start-up action after a power failure depends on the type of algorithm in use.
If the Sliding Window algorithm is being used (as described in the XFM 35 section), power calculation continues after the power returns as if there were no interruption. XFM 35 starts to switch ON the loads again as if the power demand program was starting for the first time. If using the Ideal Curve or Extrapolation algorithms (described in the XFM 35 section), the power calculations are reset and restarted as if the whole system has its first start-up. After the power returns, XFM 36-1/S/R receives a shutdown message from XFM 35 (ID___Shutdown = 1) and immediately switches off the load (see General Functions in the XFM 35 section). After the shutdown command is over (ID___Shutdown = 0), each XFM 36-1/S/R must again receive a positive power value at its Po input before its load is turned on.
XFM 36-1 Priority Group Assignment
A maximum of 50 XFM 36-1s, 36-1Ss and 36-1Rs can connect to one another in a group. XFM 36-1s, 36-1Ss and 36-1Rs connect to one another via the Po inputs and outputs. In other words, the Po output of one XFM 36-1/S/R is the input to another XFM 36-1/S/R. You assign a group of XFM 36-1/S/Rs to a priority group by selecting XFM 35 input Po1, Po2, or Po3 as the recipient of the Po output from the last (lowest load number) XFM 36-1 in the group and the corresponding XFM 35 Po output as the input to the Po of the first (highest load number) XFM 36-1 of the group. For example, if you select the Po2 input and output of the XFM 35, the group becomes Priority Group 2.
XFM 36-1/S/R Switching Behavior
The Po corrections carry the power values that each XFM 36-1/S/R uses to change the status of its load (ON or OFF). A positive power value switches on (restores) the load; a negative value switches it off (sheds it). Several conditions in addition to the Po value (the first input) determine the final command (ON/OFF) to the load output St. The command is sent to the first output St of XFM 36-1/S/R. These conditions are explained in the following sections, including the General Functions section.

ALPHABETIC REFERENCE CONTROL ICONS
EN2Z-0940GE51 R0518 286
XFM 36-1/S Sequential Load Switching
In the sequential mode, each load in a priority group has a fixed rank. Low-ranking loads are shed first while high-ranking loads are shed last. Load 1 is the highest ranking load and is shed last and restored first. The highest load number is the lowest rank. It is shed first and restored last. The following drawing shows how a group of seven loads responds to restore and shed commands.
You select the sequential mode of load switching in each priority group by setting Parameters P15 (for Group 1), P16 (for Group 2) and P17 (for Group 3) in XFM 35 to zero. XFM 35 passes these parameters to each XFM 36-1 via the corresponding user addresses ID___Rotating_P1, ID___Rotating_P2, and ID___Rotating_P3. The user address is not required if only XFM 36-1S is in the priority group. The sequential mode switches an XFM 36-1/S load depending on its rank in the group (Parameter P14 [Load Number]). User address IA___On_Index_P1/2/3 contains the rank of the load that was the last load ON. For example, if IA___On_Index_P3 is equal to 6, there are six loads that are ON in Group 3. Loads are turned ON starting with Load Number 1. The second XFM 36-1/S input, RM, and the general functions within this XFM make the final decision to switch on the load. The next load to switch on is the XFM 36-1/S with its Parameter P14 equal to 7. The next load to switch off in this example is the one with P14 equal to 5. User address IA___Off_Index_P1/2/3 has no function in sequential load switching and therefore is not used .
The criteria for sequential switching ON a load are as follows:
• The XFM 36-1/S is in automatic operating mode (Parameter P13 = 0). • Parameter P15/16/17 in XFM 35 is 0 and the corresponding user address
ID___Rotating_P1/2/3 is 0 (ID___Rotating_P1/P2/P3 is not required for groups with XFM 361S.)
• The power value at the first input Po is positive and equal to or greater than the load power Parameter P15 of the XFM 36-1/S.

CONTROL ICONS ALPHABETIC REFERENCE
111 EN2Z-0940GE51 R0518
• The value of the user address IA___On_Index_P1/2/3 is equal to the XFM 36-1/S load number set in P14 minus 1 (for example, XFM 36-1/S is in the first priority group; the value of IA___On_Index_P1 is 7; and the load number Parameter P14 is 8).
• The minimum OFF time (Parameter P11 of the XFM 36-1/S) has expired. • If Parameter P16 of the XFM 36-1 is 1/S, input RM must also equal 1 (see the
RM Functions description later in this section for details). • User addresses ID___Peak_load and ID___Shutdown are 0 (that is, the peak
load and shutdown functions are not active).
The criteria for sequential switching OFF a load are as follows:
• The XFM 36-1/S is in automatic operating mode (Parameter P13 = 0). • Parameter P15/16/17 in XFM 35 is 0 and the corresponding user address
ID___Rotating_P1/2/3 is 0.(ID___Rotating_P1/P2/P3 is not required for groups with XFM 361S.)
• The power value at the first input Po of the XFM 36-1/S is negative. • The value of the user address IA___On_Index_P1/2/3 is equal to the XFM 36-1/S
load number set in P14 (for example, XFM 36-1/S is in the second priority group; the value of IA___On_Index_P2 is 7; and the load number Parameter P14 is 7).
• The minimum ON time (Parameter P10 of the XFM 36-1/S) has expired. The following table lists the parameters used for sequential switching:
ParameterNumber
Type Description Setting Range
DefaultValue
Unit
10 Comm. Minimum ON Time 0-300 60 sec
11 Comm. Minimum OFF Time 0-400 60 sec
13 Comm. Mode of Operation 0=Auto 1=ON 2=OFF
0/1/2 0 Integer
14 Progr. Load Number (Priority Rank within a Group) (highest number is shed first)
1-50 1 Integer
15 Progr. Power of the Load 0-1000 1000 kW
16 Progr. Feedback_Op_Mode 0/1/2 2 Integer
FM 36-1/R Rotational Load Switching
In rotational mode, each load in a priority group is switched ON or OFF depending on the amount of time the load has been OFF or ON, respectively. The load that has been OFF the longest is turned ON first. The load that has been ON the longest is turned OFF first. Excluding the effects of the Maximum Off Time function, the RM input and manual override on the loads, shed and restore action resembles true rotational or circular action as pictured below.
You select the rotational mode of load switching in each priority group by setting Parameters P15 (for Group 1), P16 (for Group 2) and P17 (for Group 3) in XFM 35

ALPHABETIC REFERENCE CONTROL ICONS
EN2Z-0940GE51 R0518 286
to one. XFM 35 passes these parameters to each XFM 36-1 via the corresponding user addresses ID___Rotating_P1, ID___Rotating_P2, and ID___Rotating_P3. The user address is not required if only XFM 36-1R is used in the priority group.
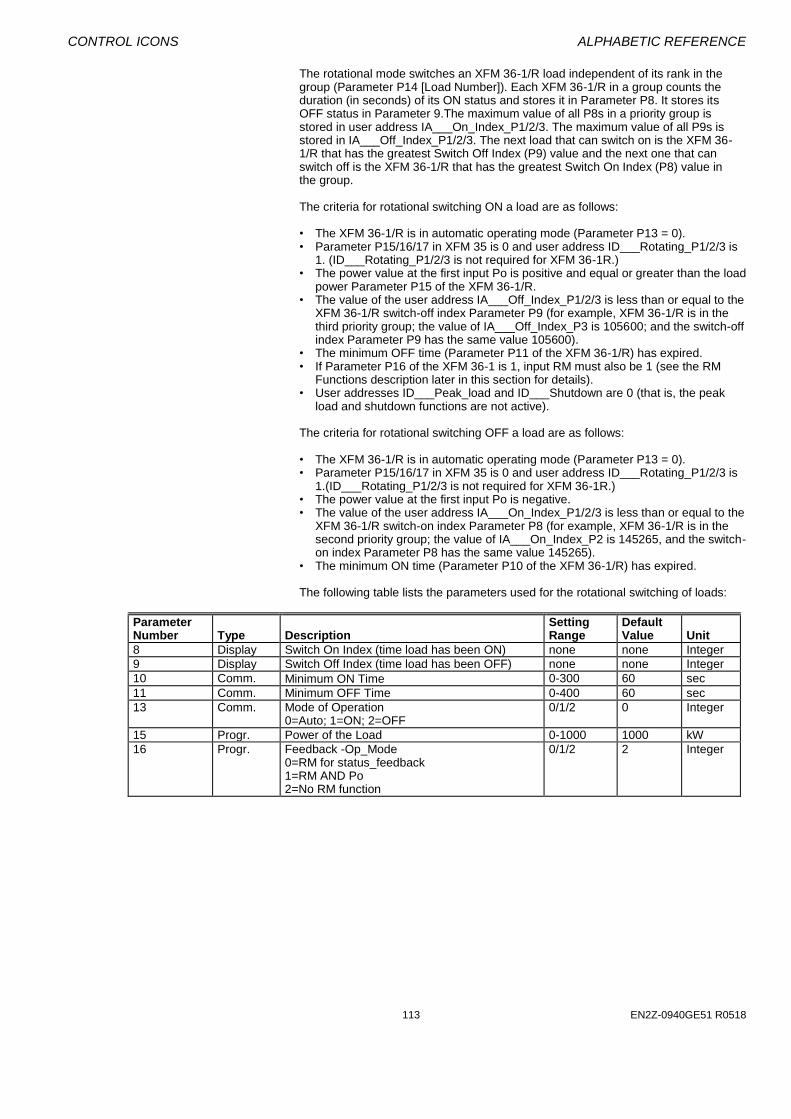
CONTROL ICONS ALPHABETIC REFERENCE
113 EN2Z-0940GE51 R0518
The rotational mode switches an XFM 36-1/R load independent of its rank in the group (Parameter P14 [Load Number]). Each XFM 36-1/R in a group counts the duration (in seconds) of its ON status and stores it in Parameter P8. It stores its OFF status in Parameter 9.The maximum value of all P8s in a priority group is stored in user address IA___On_Index_P1/2/3. The maximum value of all P9s is stored in IA___Off_Index_P1/2/3. The next load that can switch on is the XFM 36-1/R that has the greatest Switch Off Index (P9) value and the next one that can switch off is the XFM 36-1/R that has the greatest Switch On Index (P8) value in the group. The criteria for rotational switching ON a load are as follows:
• The XFM 36-1/R is in automatic operating mode (Parameter P13 = 0). • Parameter P15/16/17 in XFM 35 is 0 and user address ID___Rotating_P1/2/3 is
1. (ID___Rotating_P1/2/3 is not required for XFM 36-1R.) • The power value at the first input Po is positive and equal or greater than the load
power Parameter P15 of the XFM 36-1/R. • The value of the user address IA___Off_Index_P1/2/3 is less than or equal to the
XFM 36-1/R switch-off index Parameter P9 (for example, XFM 36-1/R is in the third priority group; the value of IA___Off_Index_P3 is 105600; and the switch-off index Parameter P9 has the same value 105600).
• The minimum OFF time (Parameter P11 of the XFM 36-1/R) has expired. • If Parameter P16 of the XFM 36-1 is 1, input RM must also be 1 (see the RM
Functions description later in this section for details). • User addresses ID___Peak_load and ID___Shutdown are 0 (that is, the peak
load and shutdown functions are not active).
The criteria for rotational switching OFF a load are as follows:
• The XFM 36-1/R is in automatic operating mode (Parameter P13 = 0). • Parameter P15/16/17 in XFM 35 is 0 and user address ID___Rotating_P1/2/3 is
1.(ID___Rotating_P1/2/3 is not required for XFM 36-1R.) • The power value at the first input Po is negative. • The value of the user address IA___On_Index_P1/2/3 is less than or equal to the
XFM 36-1/R switch-on index Parameter P8 (for example, XFM 36-1/R is in the second priority group; the value of IA___On_Index_P2 is 145265, and the switch-on index Parameter P8 has the same value 145265).
• The minimum ON time (Parameter P10 of the XFM 36-1/R) has expired.
The following table lists the parameters used for the rotational switching of loads:
Parameter Number
Type
Description
Setting Range
Default Value
Unit
8 Display Switch On Index (time load has been ON) none none Integer
9 Display Switch Off Index (time load has been OFF) none none Integer
10 Comm. Minimum ON Time 0-300 60 sec
11 Comm. Minimum OFF Time 0-400 60 sec
13 Comm. Mode of Operation 0=Auto; 1=ON; 2=OFF
0/1/2 0 Integer
15 Progr. Power of the Load 0-1000 1000 kW
16 Progr. Feedback -Op_Mode 0=RM for status_feedback 1=RM AND Po 2=No RM function
0/1/2 2 Integer

ALPHABETIC REFERENCE CONTROL ICONS
EN2Z-0940GE51 R0518 286
HC (Falcon / Eagle)
Functions Legacy RACL function: Calculates an output according to a user-defined heating
compensation curve. I/O Dialog Box
Inputs TSet = room temperature setpoint.
TOat = outside air temperature. Outputs TWtr = supply water temperature. Internal parameters
Parameter Description curvature = curvature with value 1,33 and a limit of 0 < = x < = 0 min="0.6"
max="0.8" curvature. slope = slope with value 1,6 and a limit of 1 < = x < = 4 min="1" max="4" slope.
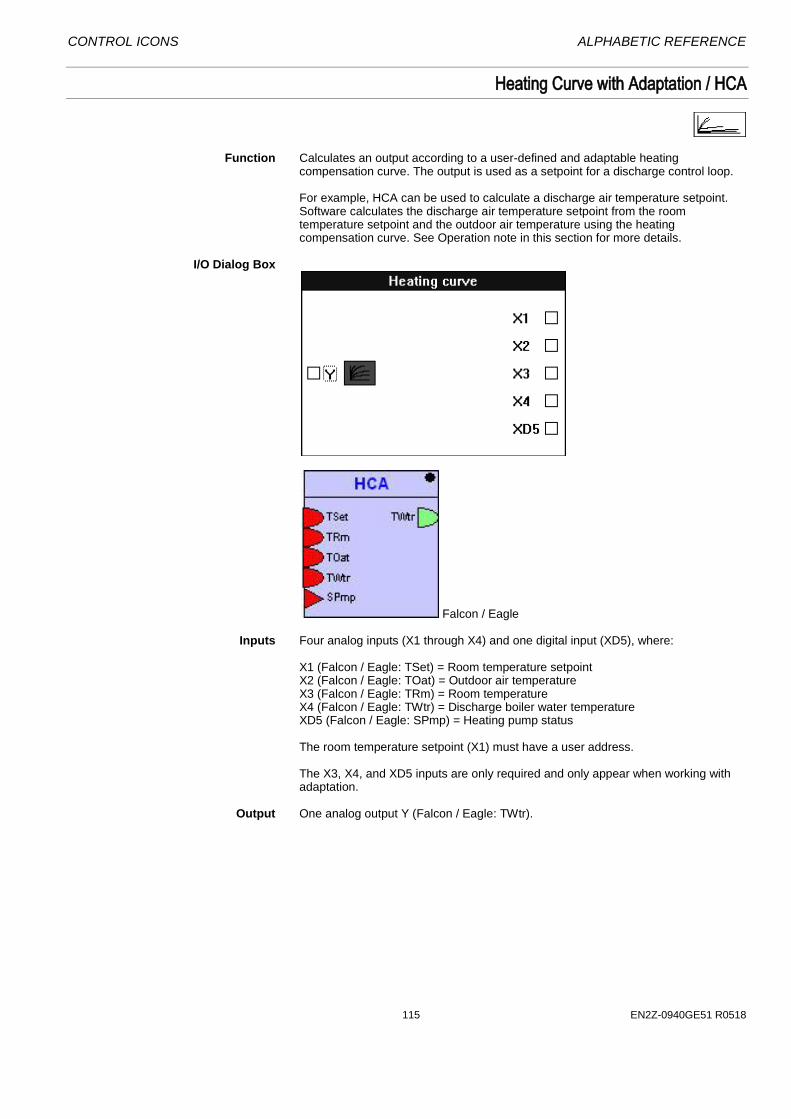
CONTROL ICONS ALPHABETIC REFERENCE
115 EN2Z-0940GE51 R0518
Heating Curve with Adaptation / HCA
Function Calculates an output according to a user-defined and adaptable heating
compensation curve. The output is used as a setpoint for a discharge control loop.
For example, HCA can be used to calculate a discharge air temperature setpoint. Software calculates the discharge air temperature setpoint from the room temperature setpoint and the outdoor air temperature using the heating compensation curve. See Operation note in this section for more details.
I/O Dialog Box
Falcon / Eagle Inputs Four analog inputs (X1 through X4) and one digital input (XD5), where:
X1 (Falcon / Eagle: TSet) = Room temperature setpoint X2 (Falcon / Eagle: TOat) = Outdoor air temperature X3 (Falcon / Eagle: TRm) = Room temperature X4 (Falcon / Eagle: TWtr) = Discharge boiler water temperature XD5 (Falcon / Eagle: SPmp) = Heating pump status The room temperature setpoint (X1) must have a user address. The X3, X4, and XD5 inputs are only required and only appear when working with adaptation.
Output One analog output Y (Falcon / Eagle: TWtr).
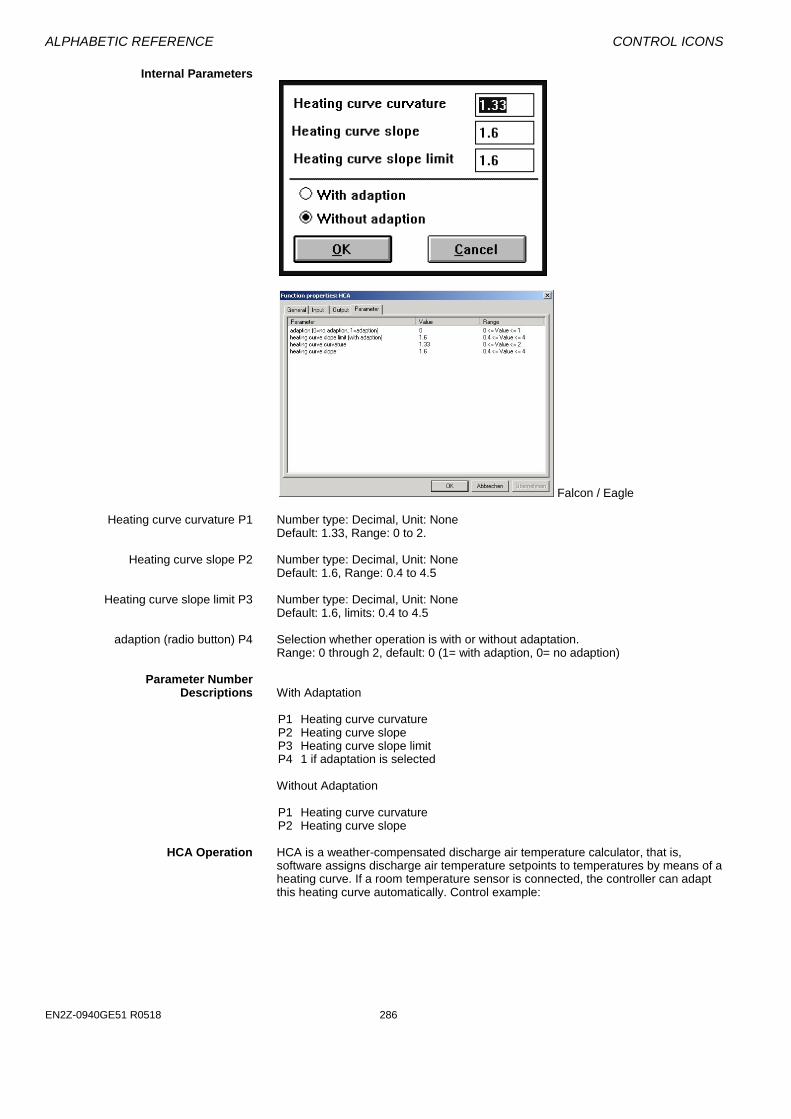
ALPHABETIC REFERENCE CONTROL ICONS
EN2Z-0940GE51 R0518 286
Internal Parameters
Falcon / Eagle Heating curve curvature P1 Number type: Decimal, Unit: None
Default: 1.33, Range: 0 to 2. Heating curve slope P2 Number type: Decimal, Unit: None
Default: 1.6, Range: 0.4 to 4.5 Heating curve slope limit P3 Number type: Decimal, Unit: None
Default: 1.6, limits: 0.4 to 4.5 adaption (radio button) P4 Selection whether operation is with or without adaptation.
Range: 0 through 2, default: 0 (1= with adaption, 0= no adaption) Parameter Number Descriptions With Adaptation P1 Heating curve curvature P2 Heating curve slope P3 Heating curve slope limit P4 1 if adaptation is selected
Without Adaptation P1 Heating curve curvature P2 Heating curve slope HCA Operation HCA is a weather-compensated discharge air temperature calculator, that is,
software assigns discharge air temperature setpoints to temperatures by means of a heating curve. If a room temperature sensor is connected, the controller can adapt this heating curve automatically. Control example:
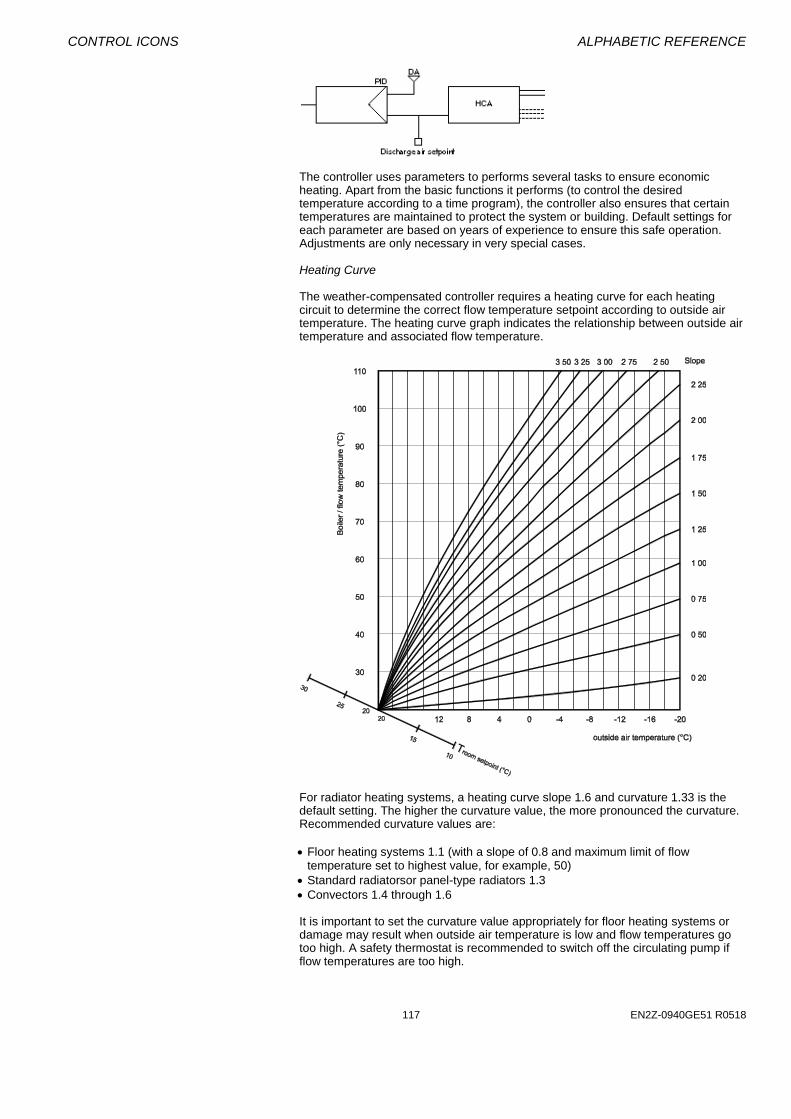
CONTROL ICONS ALPHABETIC REFERENCE
117 EN2Z-0940GE51 R0518
The controller uses parameters to performs several tasks to ensure economic heating. Apart from the basic functions it performs (to control the desired temperature according to a time program), the controller also ensures that certain temperatures are maintained to protect the system or building. Default settings for each parameter are based on years of experience to ensure this safe operation. Adjustments are only necessary in very special cases. Heating Curve The weather-compensated controller requires a heating curve for each heating circuit to determine the correct flow temperature setpoint according to outside air temperature. The heating curve graph indicates the relationship between outside air temperature and associated flow temperature.
For radiator heating systems, a heating curve slope 1.6 and curvature 1.33 is the default setting. The higher the curvature value, the more pronounced the curvature. Recommended curvature values are:
Floor heating systems 1.1 (with a slope of 0.8 and maximum limit of flow temperature set to highest value, for example, 50)
Standard radiatorsor panel-type radiators 1.3
Convectors 1.4 through 1.6 It is important to set the curvature value appropriately for floor heating systems or damage may result when outside air temperature is low and flow temperatures go too high. A safety thermostat is recommended to switch off the circulating pump if flow temperatures are too high.

ALPHABETIC REFERENCE CONTROL ICONS
EN2Z-0940GE51 R0518 286
For other types of heating systems, reset of the curvature value is not important where high flow temperatures cannot cause any damage. Heating Curve Adaptation The controller can use mean values of the room, outside air, and flow temperatures to automatically and gradually adjust the heating curve. The controller measures room temperature throughout the day. On the third day, the controller starts correcting the heating curve by adapting it to average room temperature. If the curvature value is too high (for example, 1.6), the flow temperature during the first few days may also be too high. Adaptation over a relatively long period of time results in a well-adjusted heating curve. If you use a sample room to test the adaptation function, make sure there is NO thermostatic radiator valve (where the room sensor is installed). The radiator in the sample room must always be open otherwise automatic adaptation does not function or the results are interpreted incorrectly. Too frequent airing and open windows in the sample room also have a negative effect on the adaptation procedure. If no room sensor is installed, the controller functions as a weather-compensated controller with the default heating curve setting.
Humidity and Enthalpy / H,X
Function Calculate enthalpy (h) and absolute humidity (x) as a function of air temperature,
relative air humidity, and air pressure. Use H,Xwith the ECO function. Calculate enthalpy (Ent) and absolute humidity (HAbs) as a function of air temperature, relative air humidity, and air pressure. Use Enthalpy with the Economy function.
Engineering Units Conversion Note that the function works with the engineering units according to the global
setting of the Measurement Units (International or Imperial) of the CARE project.
Formula Absolute humidity (Y2):
Y2 = 0.622 * (X2/100 * PDS) / (P3 – X2/100 * PDS) Enthalpy (Y1): Y1 = k1 * X1 + Y2 * (K2 + k3 * X1) Where: PDS is the saturation pressure of water vapor (in Pa units):
PDS = k4k6
(k5 + X1/180)*
k1 is the specific heat capacity of dry air (0.2398 Btu/lb F) k2 is the heat of evaporation (1061.37 Btu/lb) k3 is the specific heat capacity of water vapor (0.4443 Btu/lb F) k4 is 0.4204 psi k5 is 0.9202 k6 is 8.00
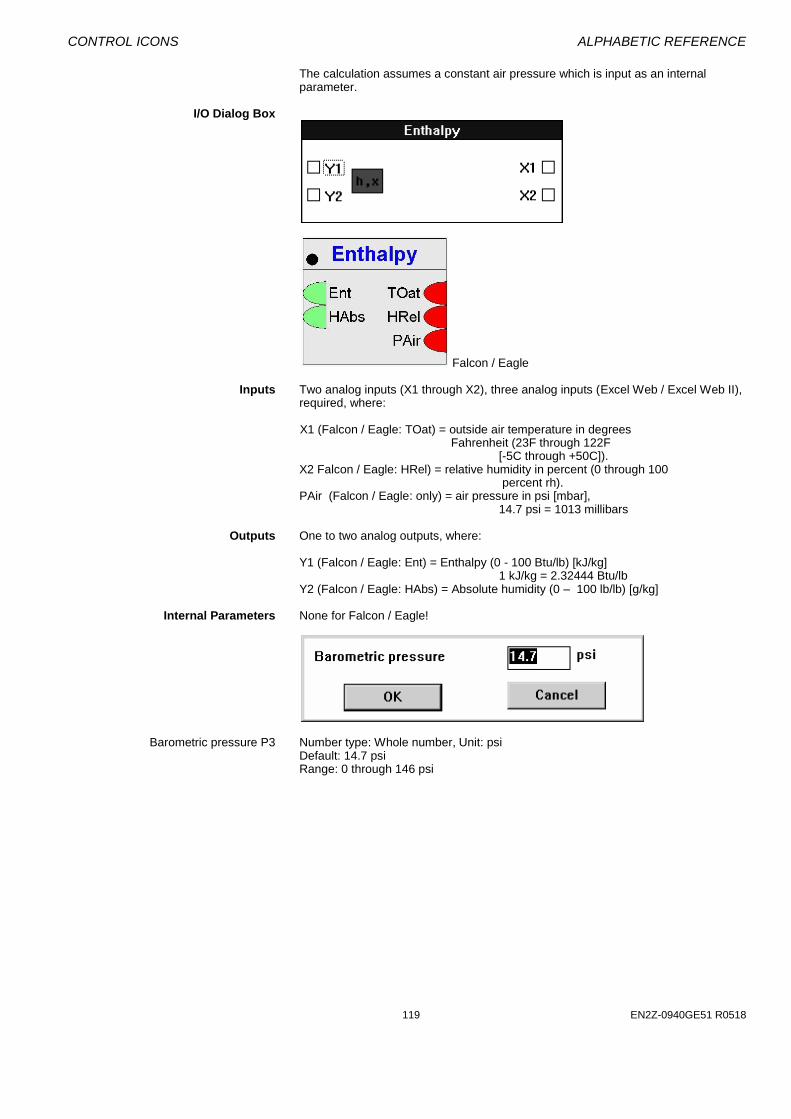
CONTROL ICONS ALPHABETIC REFERENCE
119 EN2Z-0940GE51 R0518
The calculation assumes a constant air pressure which is input as an internal parameter.
I/O Dialog Box
Falcon / Eagle Inputs Two analog inputs (X1 through X2), three analog inputs (Excel Web / Excel Web II),
required, where:
X1 (Falcon / Eagle: TOat) = outside air temperature in degrees Fahrenheit (23F through 122F [-5C through +50C]).
X2 Falcon / Eagle: HRel) = relative humidity in percent (0 through 100 percent rh). PAir (Falcon / Eagle: only) = air pressure in psi [mbar], 14.7 psi = 1013 millibars
Outputs One to two analog outputs, where:
Y1 (Falcon / Eagle: Ent) = Enthalpy (0 - 100 Btu/lb) [kJ/kg] 1 kJ/kg = 2.32444 Btu/lb Y2 (Falcon / Eagle: HAbs) = Absolute humidity (0 – 100 lb/lb) [g/kg]
Internal Parameters None for Falcon / Eagle!
Barometric pressure P3 Number type: Whole number, Unit: psi Default: 14.7 psi Range: 0 through 146 psi
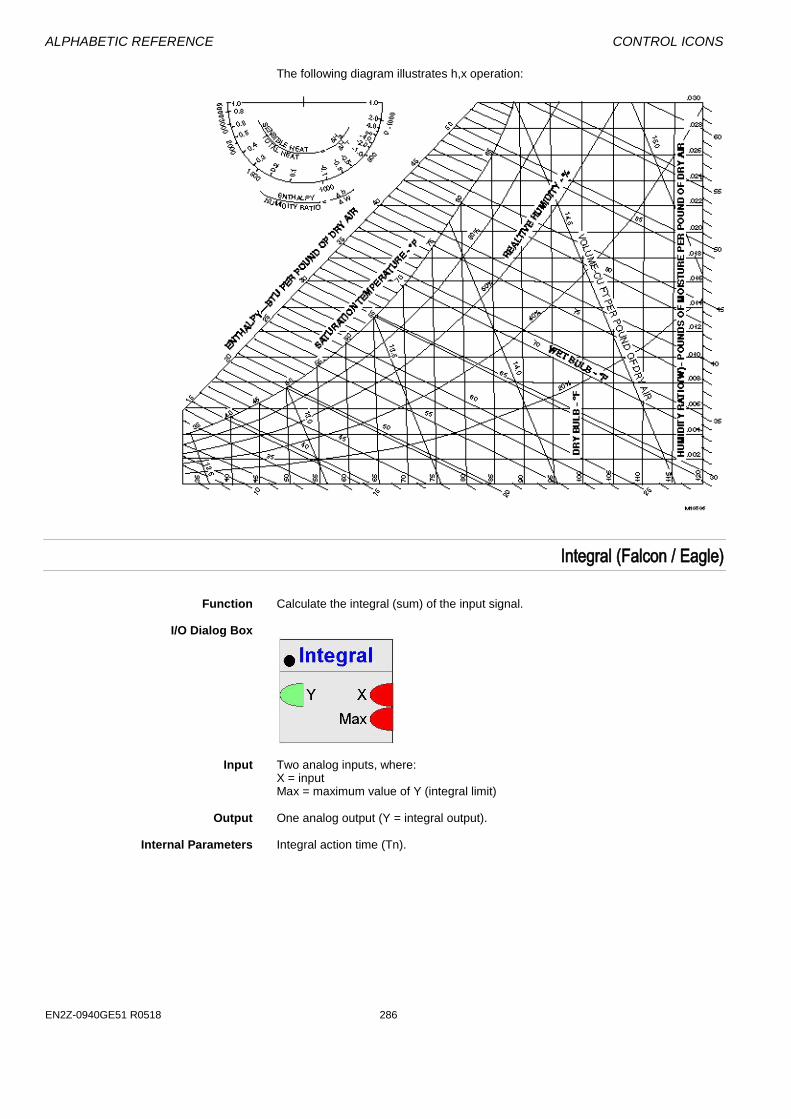
ALPHABETIC REFERENCE CONTROL ICONS
EN2Z-0940GE51 R0518 286
The following diagram illustrates h,x operation:
Integral (Falcon / Eagle)
Function Calculate the integral (sum) of the input signal. I/O Dialog Box
Input Two analog inputs, where:
X = input Max = maximum value of Y (integral limit)
Output One analog output (Y = integral output). Internal Parameters Integral action time (Tn).
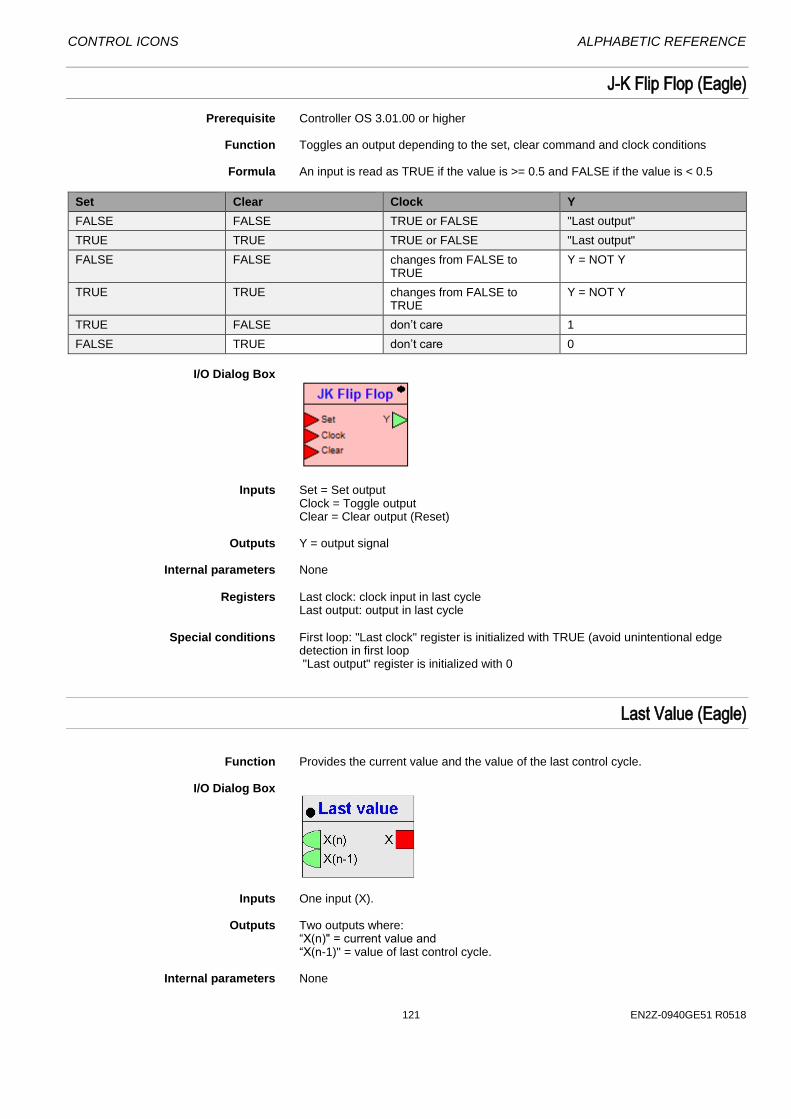
CONTROL ICONS ALPHABETIC REFERENCE
121 EN2Z-0940GE51 R0518
J-K Flip Flop (Eagle)
Prerequisite Controller OS 3.01.00 or higher Function Toggles an output depending to the set, clear command and clock conditions
Formula An input is read as TRUE if the value is >= 0.5 and FALSE if the value is < 0.5
Set Clear Clock Y
FALSE FALSE TRUE or FALSE "Last output"
TRUE TRUE TRUE or FALSE "Last output"
FALSE FALSE changes from FALSE to TRUE
Y = NOT Y
TRUE TRUE changes from FALSE to TRUE
Y = NOT Y
TRUE FALSE don’t care 1
FALSE TRUE don’t care 0
I/O Dialog Box
Inputs Set = Set output Clock = Toggle output
Clear = Clear output (Reset)
Outputs Y = output signal Internal parameters None Registers Last clock: clock input in last cycle Last output: output in last cycle Special conditions First loop: "Last clock" register is initialized with TRUE (avoid unintentional edge
detection in first loop "Last output" register is initialized with 0
Last Value (Eagle)
Function Provides the current value and the value of the last control cycle. I/O Dialog Box
Inputs One input (X). Outputs Two outputs where: “X(n)" = current value and
“X(n-1)" = value of last control cycle. Internal parameters None
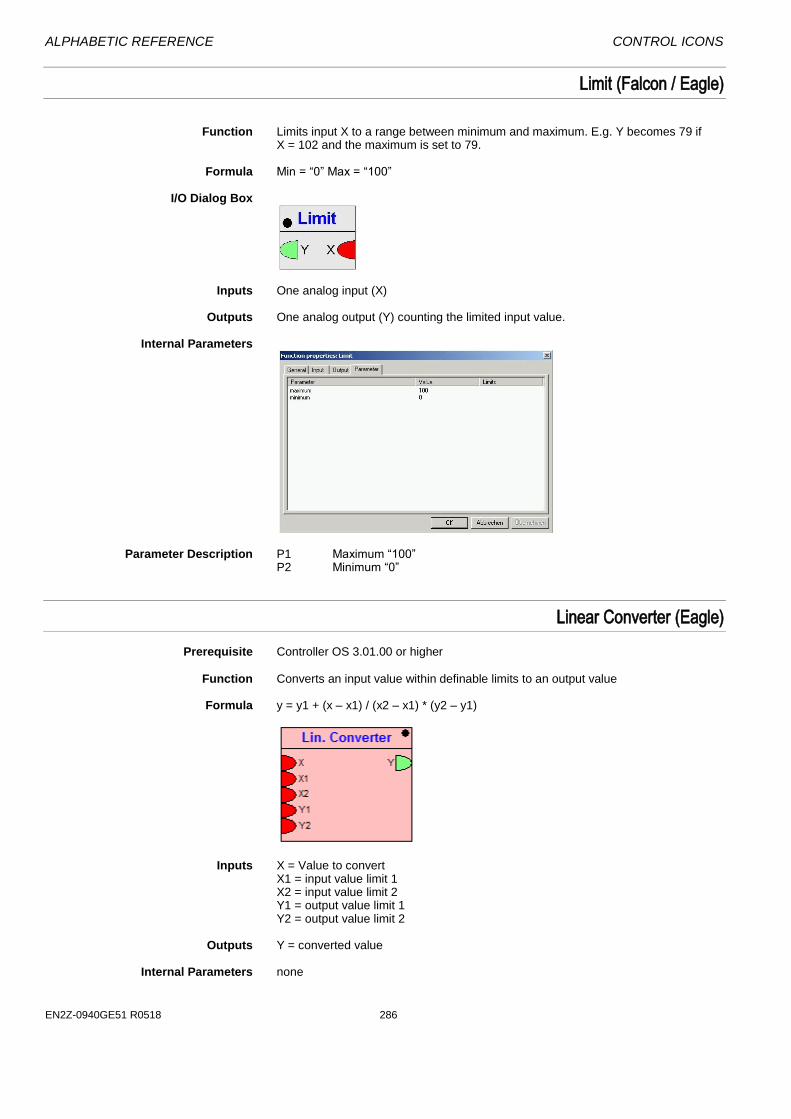
ALPHABETIC REFERENCE CONTROL ICONS
EN2Z-0940GE51 R0518 286
Limit (Falcon / Eagle)
Function Limits input X to a range between minimum and maximum. E.g. Y becomes 79 if
X = 102 and the maximum is set to 79. Formula Min = “0” Max = “100” I/O Dialog Box
Inputs One analog input (X) Outputs One analog output (Y) counting the limited input value. Internal Parameters
Parameter Description P1 Maximum “100”
P2 Minimum “0”
Linear Converter (Eagle)
Prerequisite Controller OS 3.01.00 or higher Function Converts an input value within definable limits to an output value
Formula y = y1 + (x – x1) / (x2 – x1) * (y2 – y1)
Inputs X = Value to convert X1 = input value limit 1 X2 = input value limit 2
Y1 = output value limit 1 Y2 = output value limit 2
Outputs Y = converted value Internal Parameters none

CONTROL ICONS ALPHABETIC REFERENCE
123 EN2Z-0940GE51 R0518
Special conditions a) (x1 <= x2) AND (x <= x1): y = y1 b) (x1 <= x2) AND (x >= x2): y = y2 c) (x1 > x2) AND (x >= x1): y = y1 d) (x1 > x2) AND (x <= x2): y = y2
Ln (Falcon/Eagle)
Function Calculates the logarithmus naturalis I/O Dialog Box
Input One analog input (X). Output One analog output (ln X). Internal Parameters None.
Logic Counter (Falcon / Eagle)
Function Compares binary values. Returns in output N(1) the number of TRUE(1) values and
in output N(0) the number of FALSE(0) values. I/O Dialog Box
Falcon / Eagle Inputs Two through thirty two digital inputs. Output Two digital outputs. Internal Parameters None.
Mathematical Editor / MAT
Not available for Falcon / Eagle! Function Create formulas to modify inputs to other control icons.
When one of the conditions required in the control strategy or the switching logic is not supplied directly from one user address, or a combination of more than one user address is required, you can use a mathematical formula to express this condition. For example, if inputs are in English units (for example, Fahrenheit), use the MAT editorto convert them to metric units (for example, Celsius).
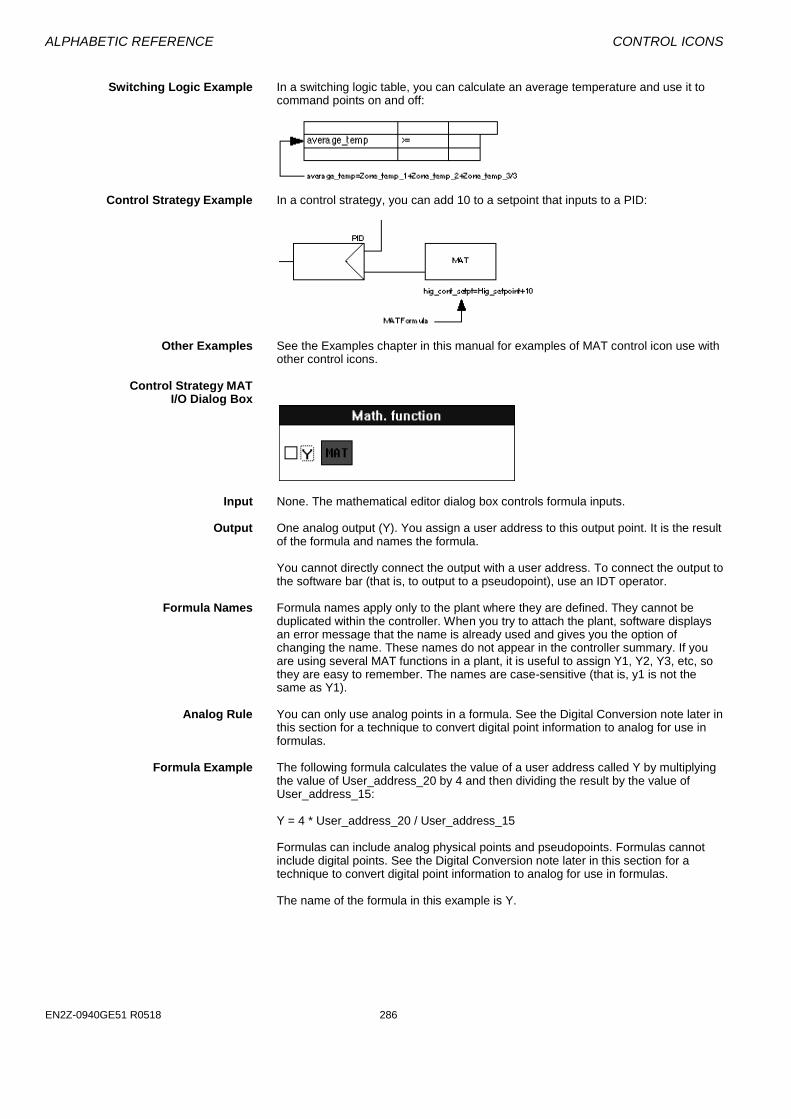
ALPHABETIC REFERENCE CONTROL ICONS
EN2Z-0940GE51 R0518 286
Switching Logic Example In a switching logic table, you can calculate an average temperature and use it to
command points on and off:
Control Strategy Example In a control strategy, you can add 10 to a setpoint that inputs to a PID:
Other Examples See the Examples chapter in this manual for examples of MAT control icon use with
other control icons. Control Strategy MAT I/O Dialog Box
Input None. The mathematical editor dialog box controls formula inputs. Output One analog output (Y). You assign a user address to this output point. It is the result
of the formula and names the formula.
You cannot directly connect the output with a user address. To connect the output to the software bar (that is, to output to a pseudopoint), use an IDT operator.
Formula Names Formula names apply only to the plant where they are defined. They cannot be
duplicated within the controller. When you try to attach the plant, software displays an error message that the name is already used and gives you the option of changing the name. These names do not appear in the controller summary. If you are using several MAT functions in a plant, it is useful to assign Y1, Y2, Y3, etc, so they are easy to remember. The names are case-sensitive (that is, y1 is not the same as Y1).
Analog Rule You can only use analog points in a formula. See the Digital Conversion note later in
this section for a technique to convert digital point information to analog for use in formulas.
Formula Example The following formula calculates the value of a user address called Y by multiplying
the value of User_address_20 by 4 and then dividing the result by the value of User_address_15:
Y = 4 * User_address_20 / User_address_15 Formulas can include analog physical points and pseudopoints. Formulas cannot include digital points. See the Digital Conversion note later in this section for a technique to convert digital point information to analog for use in formulas. The name of the formula in this example is Y.
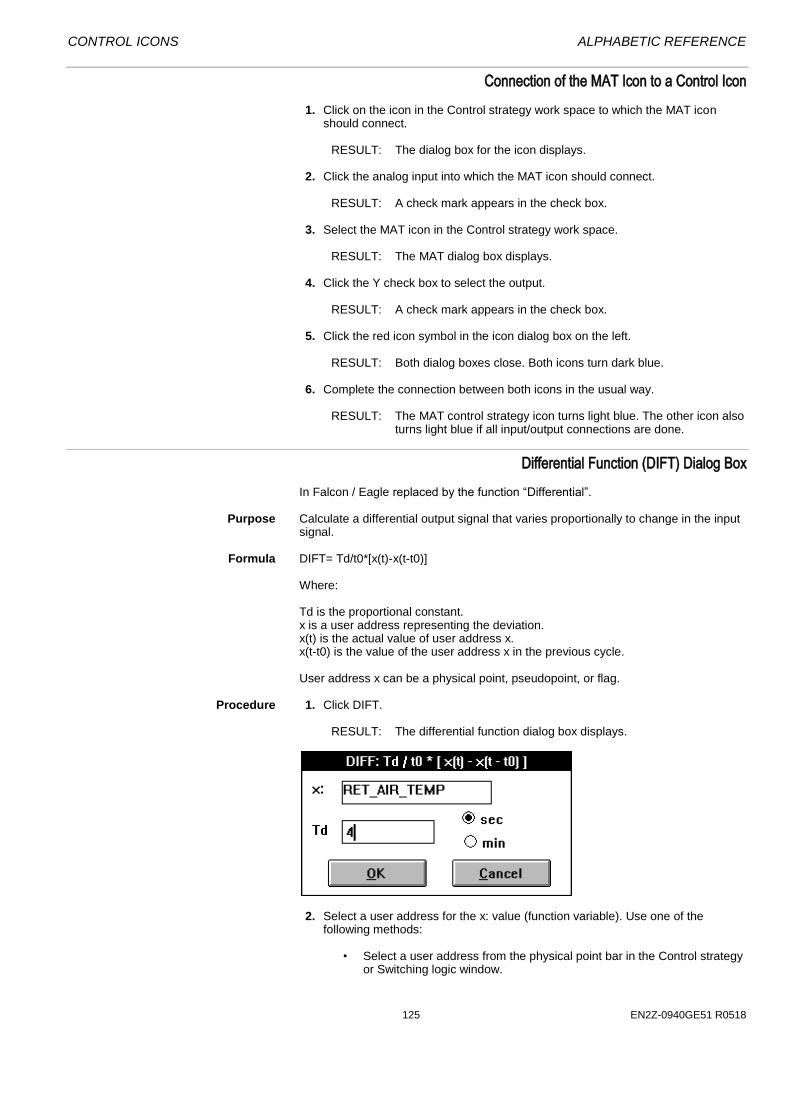
CONTROL ICONS ALPHABETIC REFERENCE
125 EN2Z-0940GE51 R0518
Connection of the MAT Icon to a Control Icon
1. Click on the icon in the Control strategy work space to which the MAT icon should connect.
RESULT: The dialog box for the icon displays.
2. Click the analog input into which the MAT icon should connect.
RESULT: A check mark appears in the check box. 3. Select the MAT icon in the Control strategy work space.
RESULT: The MAT dialog box displays. 4. Click the Y check box to select the output.
RESULT: A check mark appears in the check box. 5. Click the red icon symbol in the icon dialog box on the left.
RESULT: Both dialog boxes close. Both icons turn dark blue. 6. Complete the connection between both icons in the usual way.
RESULT: The MAT control strategy icon turns light blue. The other icon also turns light blue if all input/output connections are done.
Differential Function (DIFT) Dialog Box
In Falcon / Eagle replaced by the function “Differential”. Purpose Calculate a differential output signal that varies proportionally to change in the input
signal. Formula DIFT= Td/t0*[x(t)-x(t-t0)]
Where: Td is the proportional constant. x is a user address representing the deviation. x(t) is the actual value of user address x. x(t-t0) is the value of the user address x in the previous cycle. User address x can be a physical point, pseudopoint, or flag.
Procedure 1. Click DIFT.
RESULT: The differential function dialog box displays.
2. Select a user address for the x: value (function variable). Use one of the
following methods: • Select a user address from the physical point bar in the Control strategy
or Switching logic window.
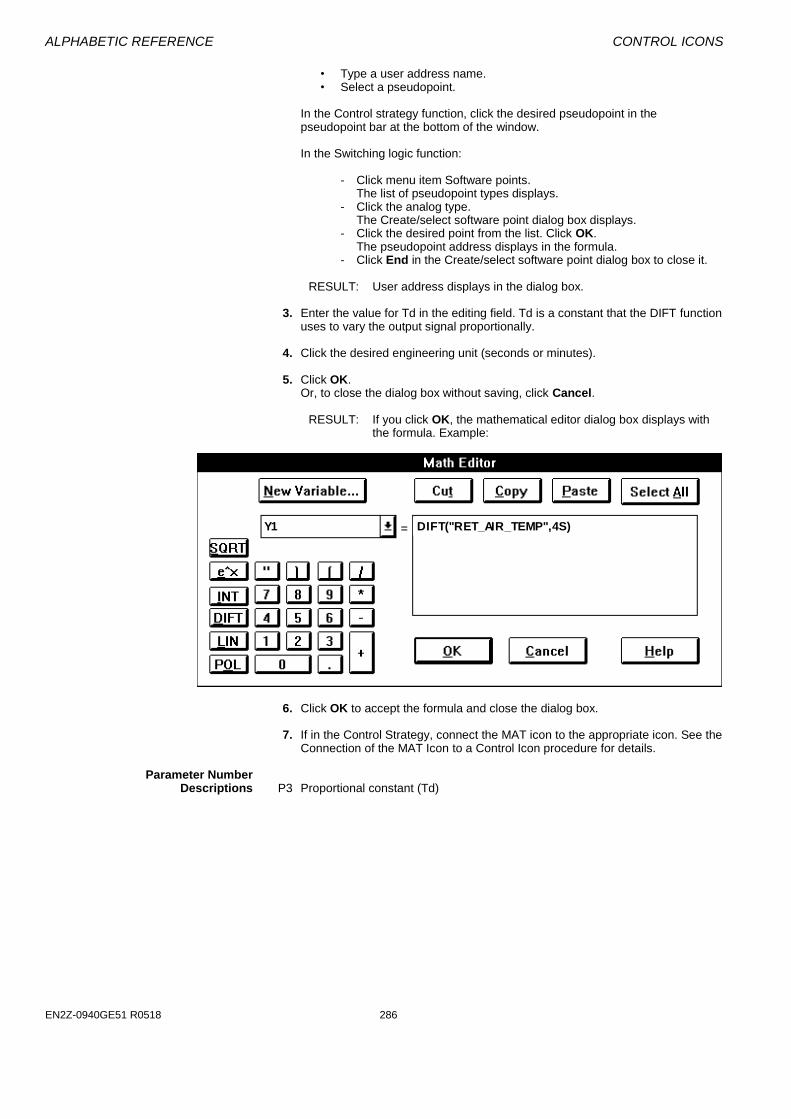
ALPHABETIC REFERENCE CONTROL ICONS
EN2Z-0940GE51 R0518 286
• Type a user address name. • Select a pseudopoint. In the Control strategy function, click the desired pseudopoint in the
pseudopoint bar at the bottom of the window. In the Switching logic function:
- Click menu item Software points. The list of pseudopoint types displays. - Click the analog type. The Create/select software point dialog box displays. - Click the desired point from the list. Click OK. The pseudopoint address displays in the formula. - Click End in the Create/select software point dialog box to close it.
RESULT: User address displays in the dialog box.
3. Enter the value for Td in the editing field. Td is a constant that the DIFT function
uses to vary the output signal proportionally. 4. Click the desired engineering unit (seconds or minutes). 5. Click OK. Or, to close the dialog box without saving, click Cancel.
RESULT: If you click OK, the mathematical editor dialog box displays with the formula. Example:
Y1 DIFT("RET_AIR_TEMP",4S)
6. Click OK to accept the formula and close the dialog box. 7. If in the Control Strategy, connect the MAT icon to the appropriate icon. See the
Connection of the MAT Icon to a Control Icon procedure for details. Parameter Number Descriptions P3 Proportional constant (Td)
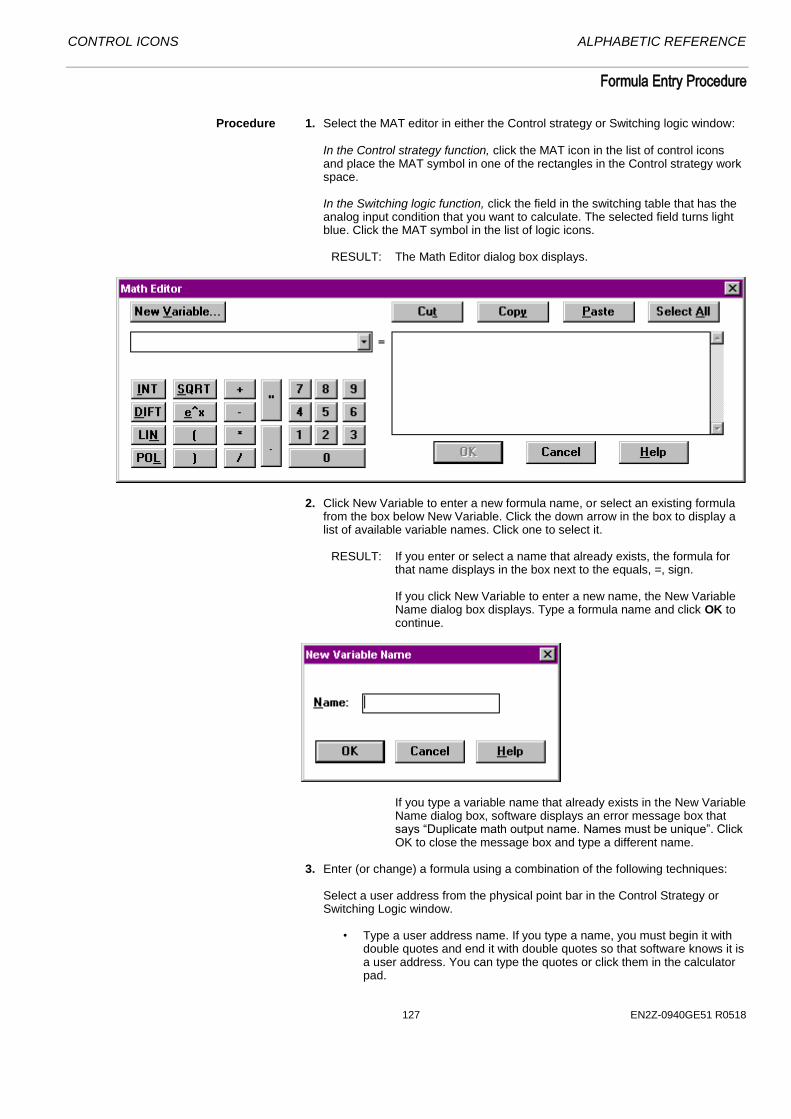
CONTROL ICONS ALPHABETIC REFERENCE
127 EN2Z-0940GE51 R0518
Formula Entry Procedure
Procedure 1. Select the MAT editor in either the Control strategy or Switching logic window: In the Control strategy function, click the MAT icon in the list of control icons
and place the MAT symbol in one of the rectangles in the Control strategy work space.
In the Switching logic function, click the field in the switching table that has the
analog input condition that you want to calculate. The selected field turns light blue. Click the MAT symbol in the list of logic icons.
RESULT: The Math Editor dialog box displays.
2. Click New Variable to enter a new formula name, or select an existing formula
from the box below New Variable. Click the down arrow in the box to display a list of available variable names. Click one to select it.
RESULT: If you enter or select a name that already exists, the formula for
that name displays in the box next to the equals, =, sign. If you click New Variable to enter a new name, the New Variable
Name dialog box displays. Type a formula name and click OK to continue.
If you type a variable name that already exists in the New Variable Name dialog box, software displays an error message box that says “Duplicate math output name. Names must be unique”. Click OK to close the message box and type a different name.
3. Enter (or change) a formula using a combination of the following techniques: Select a user address from the physical point bar in the Control Strategy or
Switching Logic window. • Type a user address name. If you type a name, you must begin it with
double quotes and end it with double quotes so that software knows it is a user address. You can type the quotes or click them in the calculator pad.

ALPHABETIC REFERENCE CONTROL ICONS
EN2Z-0940GE51 R0518 286
When you add a point by clicking it in the physical or software point bar, the
Math Editor automatically adds the quotes to the user address name. • Type a value, for example, 23 or 10. Or, click the desired numbers in the
calculator pad in the Math Editor dialog box. Rules:
- The value can have a maximum of seven digits to the left of the decimal and three digits to the right of the decimal (9,999,999.999).
- The value must be positive. - To enter a decimal, you must use leading zeros, for example, 0.5. - To enter a negative number, enclose it in parentheses and subtract it
from zero. For example, for a negative 2, multiply 2 by a negative 1:
Y=2*(0-1)
• Select a pseudopoint. In the Control strategy function, click the desired pseudopoint in the
pseudopoint bar at the bottom of the window. In the Switching logic function:
- Click menu item Software points. The list of pseudopoint types displays. - Click the analog type. The Create/select software point dialog box displays. - Click the desired point from the list. Click OK. The pseudopoint address displays in the formula. - Click End in the Create/select software point dialog box to close it.
• Delete or change portions of the formula using one of the following
techniques:
- Highlight a portion of the formula and delete it, type over it, or select a replacement for it (for example, a different user address). To “highlight”, press and hold down the left-hand mouse button while dragging the mouse cursor across the desired characters. Release the mouse button. You can now type new values, press the DEL key to erase, or select a different point address or function.
- Press the DEL key to erase the character to the right of the cursor
position.
- Press the Backspace key to erase the character to the left of the cursor position.
- Use the Cut, Copy, Paste, and Select All buttons in the dialog box to
help create and modify formulas. For example, you can highlight and “Cut” (delete) elements from one formula and then “Paste” those elements into a new formula. Or, you can just highlight and “Copy” the elements to keep them in one formula while you “Paste” them into another formula.
If you do not highlight part of a formula before clicking Cut or Copy,
software displays an error message box saying that “No text (is) selected”. If you do not perform a Cut or Copy before selecting Paste, software displays an error message box saying that the “Paste buffer is empty”.
• Click desired function from the calculator pad in the dialog box:
SQRT Square root e^x Exponential function to the base e INT Integral DIFT Differential
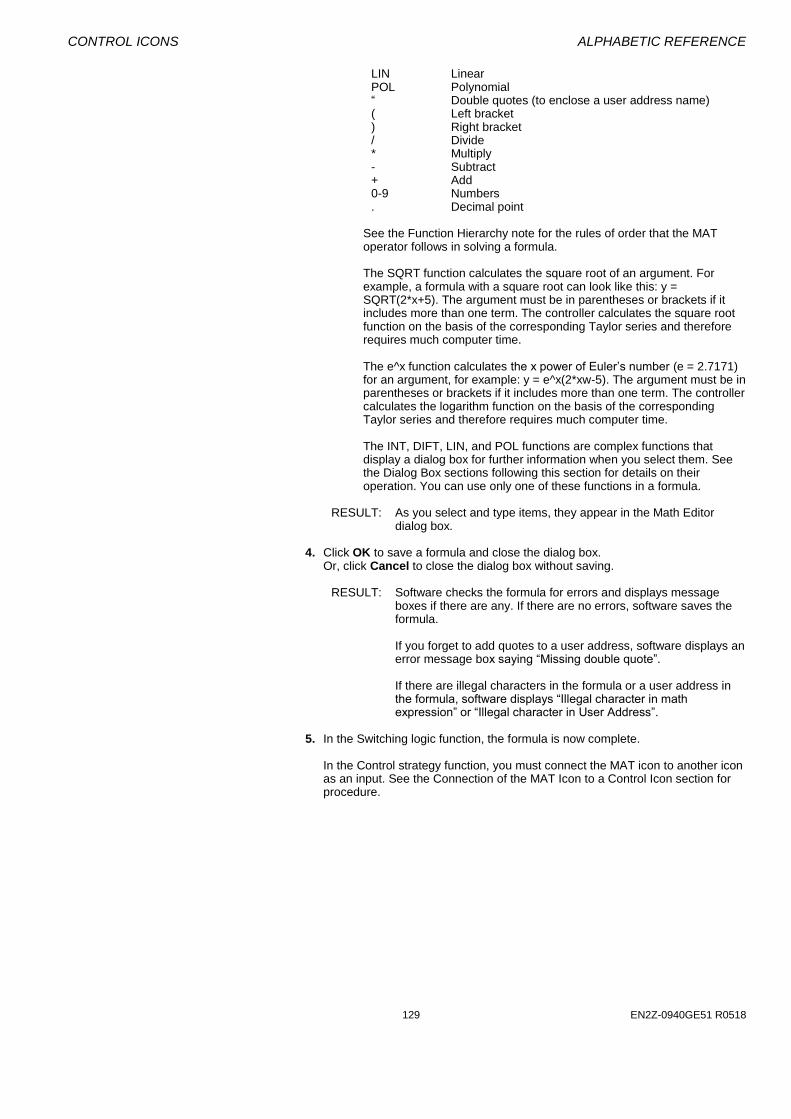
CONTROL ICONS ALPHABETIC REFERENCE
129 EN2Z-0940GE51 R0518
LIN Linear POL Polynomial “ Double quotes (to enclose a user address name) ( Left bracket ) Right bracket / Divide * Multiply - Subtract + Add 0-9 Numbers . Decimal point
See the Function Hierarchy note for the rules of order that the MAT
operator follows in solving a formula. The SQRT function calculates the square root of an argument. For
example, a formula with a square root can look like this: y = SQRT(2*x+5). The argument must be in parentheses or brackets if it includes more than one term. The controller calculates the square root function on the basis of the corresponding Taylor series and therefore requires much computer time.
The e^x function calculates the x power of Euler’s number (e = 2.7171)
for an argument, for example: y = e^x(2*xw-5). The argument must be in parentheses or brackets if it includes more than one term. The controller calculates the logarithm function on the basis of the corresponding Taylor series and therefore requires much computer time.
The INT, DIFT, LIN, and POL functions are complex functions that
display a dialog box for further information when you select them. See the Dialog Box sections following this section for details on their operation. You can use only one of these functions in a formula.
RESULT: As you select and type items, they appear in the Math Editor
dialog box. 4. Click OK to save a formula and close the dialog box. Or, click Cancel to close the dialog box without saving.
RESULT: Software checks the formula for errors and displays message boxes if there are any. If there are no errors, software saves the formula.
If you forget to add quotes to a user address, software displays an
error message box saying “Missing double quote”. If there are illegal characters in the formula or a user address in
the formula, software displays “Illegal character in math expression” or “Illegal character in User Address”.
5. In the Switching logic function, the formula is now complete. In the Control strategy function, you must connect the MAT icon to another icon
as an input. See the Connection of the MAT Icon to a Control Icon section for procedure.
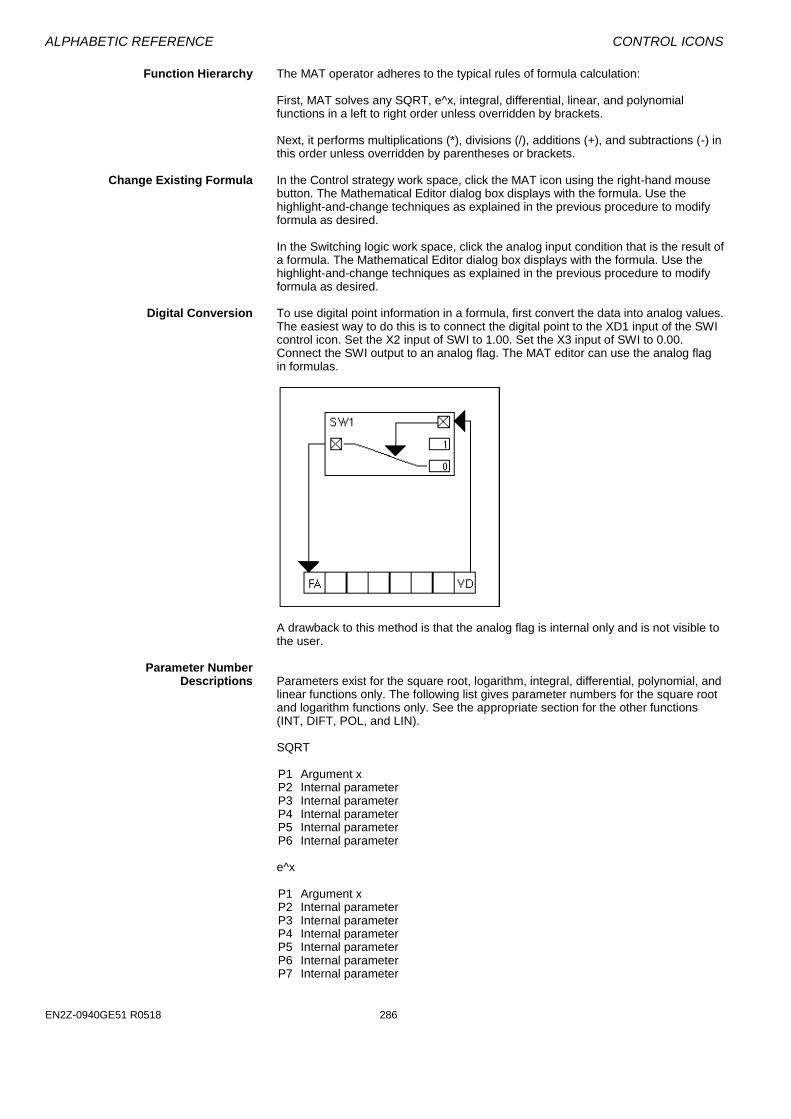
ALPHABETIC REFERENCE CONTROL ICONS
EN2Z-0940GE51 R0518 286
Function Hierarchy The MAT operator adheres to the typical rules of formula calculation:
First, MAT solves any SQRT, e^x, integral, differential, linear, and polynomial functions in a left to right order unless overridden by brackets.
Next, it performs multiplications (*), divisions (/), additions (+), and subtractions (-) in this order unless overridden by parentheses or brackets.
Change Existing Formula In the Control strategy work space, click the MAT icon using the right-hand mouse
button. The Mathematical Editor dialog box displays with the formula. Use the highlight-and-change techniques as explained in the previous procedure to modify formula as desired.
In the Switching logic work space, click the analog input condition that is the result of a formula. The Mathematical Editor dialog box displays with the formula. Use the highlight-and-change techniques as explained in the previous procedure to modify formula as desired.
Digital Conversion To use digital point information in a formula, first convert the data into analog values.
The easiest way to do this is to connect the digital point to the XD1 input of the SWI control icon. Set the X2 input of SWI to 1.00. Set the X3 input of SWI to 0.00. Connect the SWI output to an analog flag. The MAT editor can use the analog flag in formulas.
A drawback to this method is that the analog flag is internal only and is not visible to the user.
Parameter Number Descriptions Parameters exist for the square root, logarithm, integral, differential, polynomial, and
linear functions only. The following list gives parameter numbers for the square root and logarithm functions only. See the appropriate section for the other functions (INT, DIFT, POL, and LIN).
SQRT
P1 Argument x P2 Internal parameter P3 Internal parameter P4 Internal parameter P5 Internal parameter P6 Internal parameter
e^x
P1 Argument x P2 Internal parameter P3 Internal parameter P4 Internal parameter P5 Internal parameter P6 Internal parameter P7 Internal parameter

CONTROL ICONS ALPHABETIC REFERENCE
131 EN2Z-0940GE51 R0518
P8 Internal parameter P9 Internal parameter P10 Internal parameter P11 Internal parameter
All internal parameters are for software use only.
Integral Function (INTEG) Dialog Box
In Falcon / Eagle replaced by the function “Integral”. Purpose Calculate an integral. Formula INT= Lim(to/Ti*SUM(x))
The summation of user address x multiplied by the quotient from cycle time (to) and reset (integral action) time (Ti). The sum of the integrals is limited dependent on the value of Lim (-Lim < x < +Lim).
User address x can be a physical point, pseudopoint, or flag.
Procedure 1. Click INT.
RESULT: The integral function dialog box displays. Example with values:
2. Select a user address for the x: value (function variable). Use one of the
following methods: • Select a user address from the physical point bar in the Control strategy
or Switching logic window. • Type a user address name. • Select a pseudopoint. In the Control strategy function, click the desired pseudopoint in the
pseudopoint bar at the bottom of the window. In the Switching logic function:
- Click menu item Software points. The list of pseudopoint types displays. - Click the analog type. The Create/select software point dialog box displays. - Click the desired point from the list. Click OK. The pseudopoint address displays in the formula. - Click End in the Create/select software point dialog box to close it.
RESULT: User address displays in the dialog box.
3. Enter the limit (Lim) and reset time (Ti) values in the editing fields. 4. Click desired engineering unit (seconds or minutes). 5. Click OK to close the dialog box and save the formula. Or, to close the dialog box without saving, click Cancel.
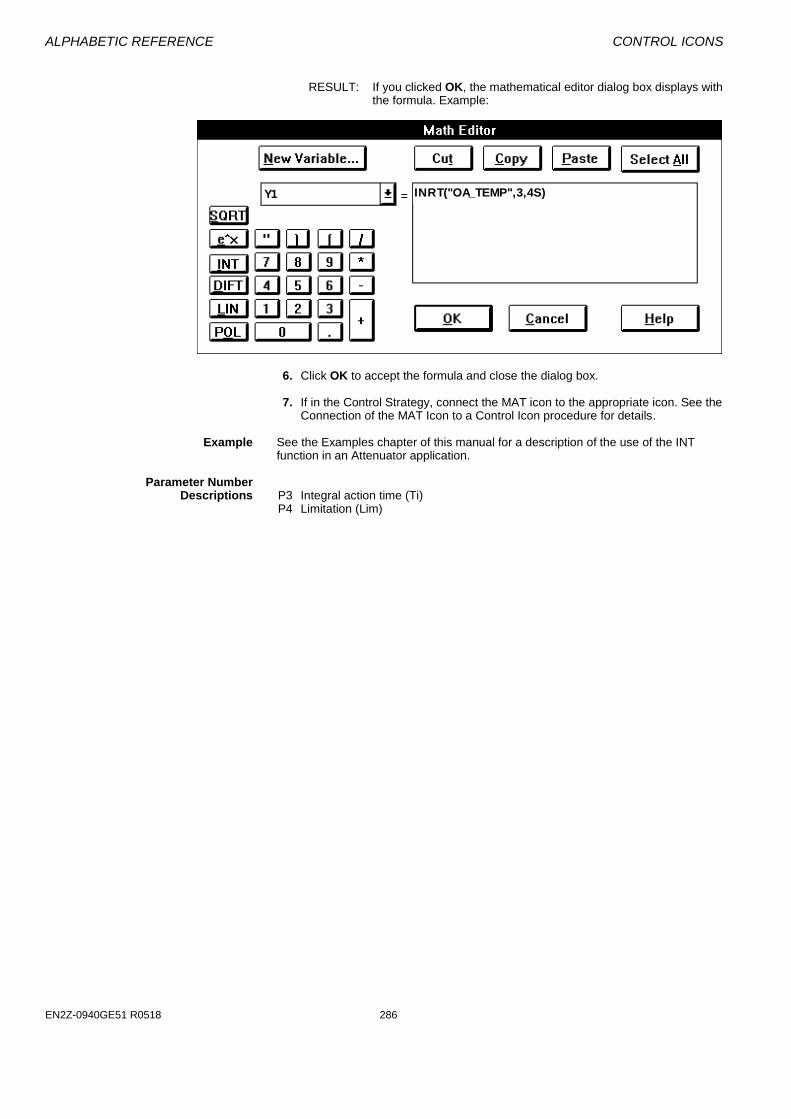
ALPHABETIC REFERENCE CONTROL ICONS
EN2Z-0940GE51 R0518 286
RESULT: If you clicked OK, the mathematical editor dialog box displays with
the formula. Example:
Y1 INRT("OA_TEMP",3,4S)
6. Click OK to accept the formula and close the dialog box. 7. If in the Control Strategy, connect the MAT icon to the appropriate icon. See the
Connection of the MAT Icon to a Control Icon procedure for details. Example See the Examples chapter of this manual for a description of the use of the INT
function in an Attenuator application. Parameter Number Descriptions P3 Integral action time (Ti) P4 Limitation (Lim)
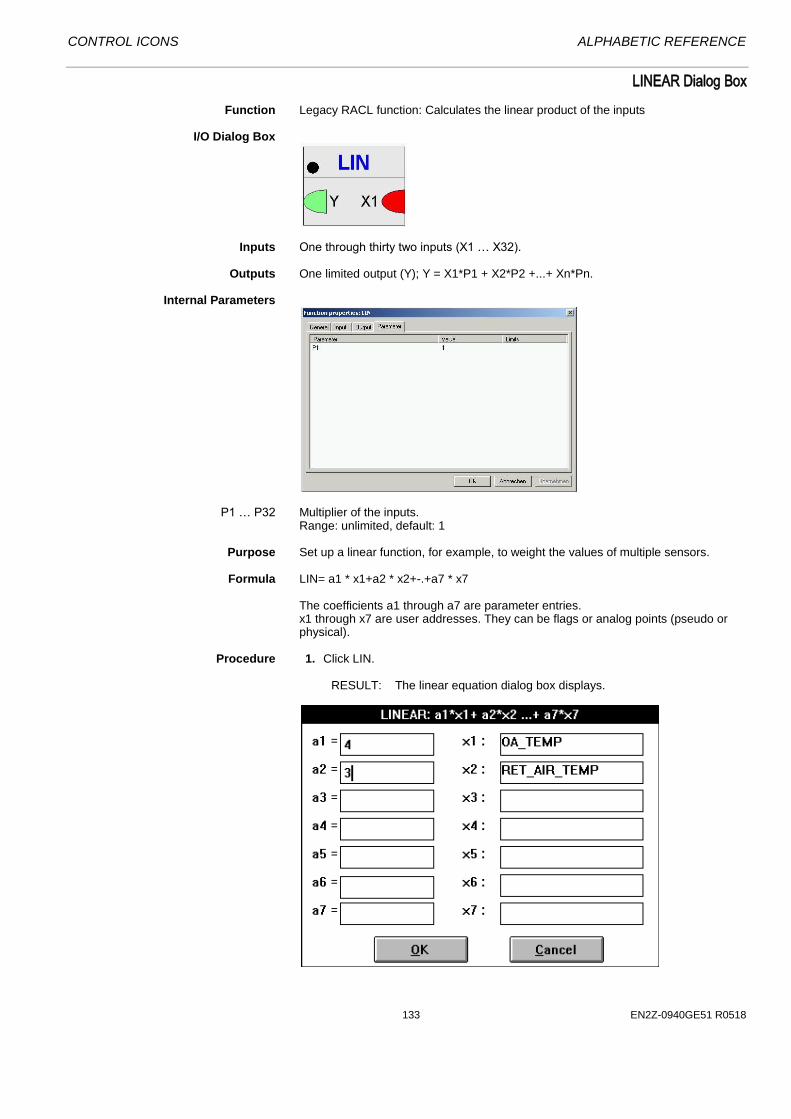
CONTROL ICONS ALPHABETIC REFERENCE
133 EN2Z-0940GE51 R0518
LINEAR Dialog Box
Function Legacy RACL function: Calculates the linear product of the inputs I/O Dialog Box
Inputs One through thirty two inputs (X1 … X32). Outputs One limited output (Y); Y = X1*P1 + X2*P2 +...+ Xn*Pn. Internal Parameters
P1 … P32 Multiplier of the inputs.
Range: unlimited, default: 1 Purpose Set up a linear function, for example, to weight the values of multiple sensors. Formula LIN= a1 * x1+a2 * x2+-.+a7 * x7
The coefficients a1 through a7 are parameter entries. x1 through x7 are user addresses. They can be flags or analog points (pseudo or physical).
Procedure 1. Click LIN.
RESULT: The linear equation dialog box displays.

ALPHABETIC REFERENCE CONTROL ICONS
EN2Z-0940GE51 R0518 286
2. Select a point for the x1 through x7 values (function variables). Use one of the following methods:
• Select a user address from the physical point bar in the Control strategy
or Switching logic window. • Type a user address name. • Select a pseudopoint. In the Control strategy function, click the desired pseudopoint in the
pseudopoint bar at the bottom of the window. In the Switching logic function:
- Click menu item Software points. The list of pseudopoint types displays. - Click the analog type. The Create/select software point dialog box displays. - Click the desired point from the list. Click OK. The pseudopoint address displays in the formula. - Click End in the Create/select software point dialog box to close it.
RESULT: User address displays in the dialog box.
3. Enter values for the a1 through a7 coefficients in the editing fields. Enter as
many as there are user addresses for the x1 through x7 fields. 4. Click OK. Or, to close the dialog box without saving, click Cancel.
RESULT: If you click OK, the mathematical editor dialog box displays with the formula. Example:
Y1 LIN("OA_TEMP",4,"RET_AIR_TEMP",3)
5. Click OK to accept the formula and close the dialog box. 6. If in the Control Strategy, connect the MAT icon to the appropriate icon. See the
Connection of the MAT Icon to a Control Icon procedure for details. Parameter Number Descriptions P3 Coefficient a1 P4 Coefficient a2 P5 Coefficient a3 P6 Coefficient a4 P7 Coefficient a5 P8 Coefficient a6 P9 Coefficient a7 LIN Example If more than one sensor is in a room, not all the measured temperatures are equally
relevant to room comfort. You can use the LIN function to weight the values of the sensors. In this example, there are three sensors with the following weights:

CONTROL ICONS ALPHABETIC REFERENCE
135 EN2Z-0940GE51 R0518
User Address Weight
Sensor_1 70 percent Sensor_2 20 percent Sensor_3 10 percent Set up the LIN function with the following values: a1=0.7 x1: Sensor_1 a2=0.2 x2: Sensor_2 a3=0.1 x3: Sensor_3 When sensor values are: Sensor_1 = 76 Sensor_2 = 70 Sensor_3 = 68 The LIN calculation is: 0.7 * 76 + 0.2 * 70 + 0.1 * 68 = 53.2 + 14 + 6.8 = 128.0
Polynomial Equation (POL) Dialog Box
Function Legacy RACL function: Calculates the polynomial of the inputs Formula POL= (x + a1)*(x + a2)*(x + a3)*(x + a4)*(x + a5) Y= (X + N1)*(X + N2)*(X + N3)*(X + N4)*…*(X + N31) (Falcon / Eagle)
Where a1 (N1) through a5 (N31) are parameter entries and x is the user address of an analog point (pseudo or physical) or flag. (For Falcon / Eagle select the POL function from the functions tree):
Procedure 1. Click POL in the top row of the mathematical editor dialog box.
RESULT: The polynomial equation dialog box displays.
Falcon / Eagle 2. Select a pseudopoint for the x: value (function variable). Use one of the
following methods:
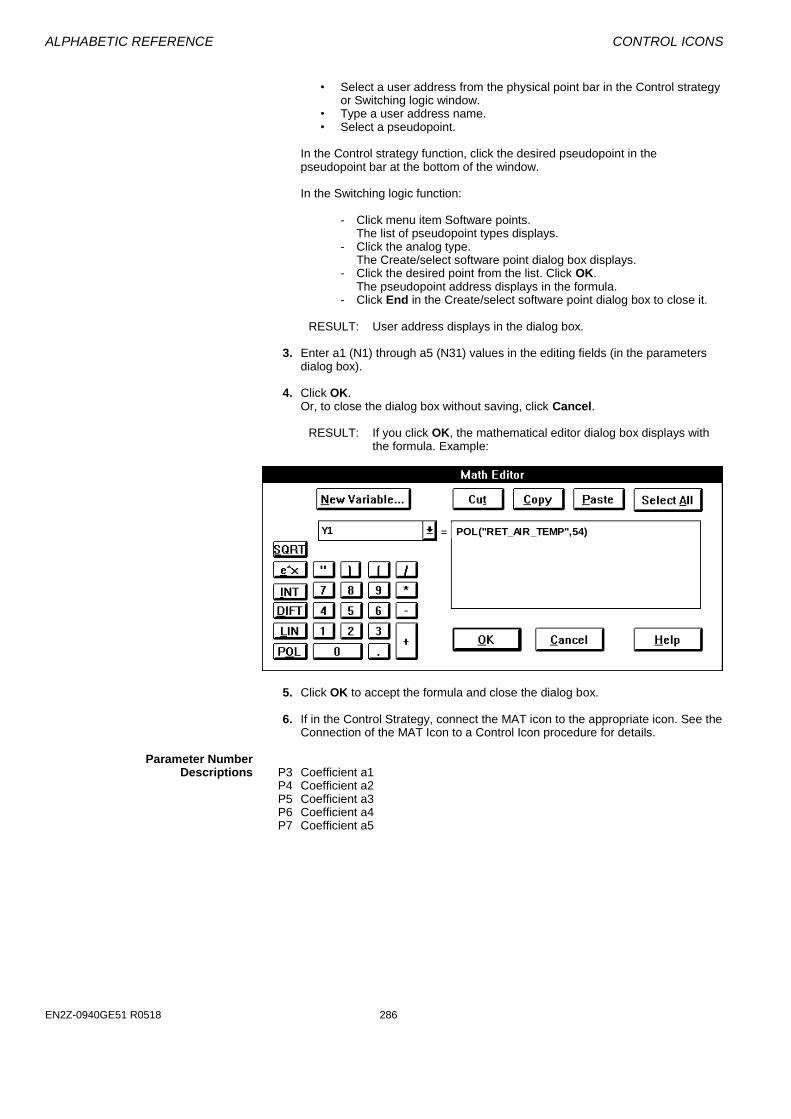
ALPHABETIC REFERENCE CONTROL ICONS
EN2Z-0940GE51 R0518 286
• Select a user address from the physical point bar in the Control strategy
or Switching logic window. • Type a user address name. • Select a pseudopoint. In the Control strategy function, click the desired pseudopoint in the
pseudopoint bar at the bottom of the window. In the Switching logic function:
- Click menu item Software points. The list of pseudopoint types displays. - Click the analog type. The Create/select software point dialog box displays. - Click the desired point from the list. Click OK. The pseudopoint address displays in the formula. - Click End in the Create/select software point dialog box to close it.
RESULT: User address displays in the dialog box.
3. Enter a1 (N1) through a5 (N31) values in the editing fields (in the parameters
dialog box). 4. Click OK. Or, to close the dialog box without saving, click Cancel.
RESULT: If you click OK, the mathematical editor dialog box displays with the formula. Example:
Y1 POL("RET_AIR_TEMP",54)
5. Click OK to accept the formula and close the dialog box. 6. If in the Control Strategy, connect the MAT icon to the appropriate icon. See the
Connection of the MAT Icon to a Control Icon procedure for details. Parameter Number Descriptions P3 Coefficient a1 P4 Coefficient a2 P5 Coefficient a3 P6 Coefficient a4 P7 Coefficient a5

CONTROL ICONS ALPHABETIC REFERENCE
137 EN2Z-0940GE51 R0518
Maximum / MAX
Function Returns the highest value of all inputs.
For example, in control technology, continuous positioning signals are often calculated using mathematical functions. These functions are defined for the entire set of real numbers, while positioning signals are typically valid only for a subset of numbers, for example, 0 to 100 percent.
You can use the MAX icon to define the minimum output value to a signal. If, for example, a function outputs a value below 0, you can use MAX to select either the function output or 0, whichever is higher.
I/O Dialog Box
Falcon / Eagle Inputs Two through six (Falcon / Eagle: thirty two) analog inputs. Minimum two inputs.
You can enter the first input as a parameter (engineering unit index number and value, not for XL Web).
Output One analog output (Y). Internal Parameters None. Parameter Number Descriptions None. Example See Positioning Signal Limitation in the Examples chapter for an application that
uses the MIN and MAX icons to limit an output signal.
Also see the Duty Cycle (DUC) section. You can use MAX to calculate an input value for highest zone temperature.
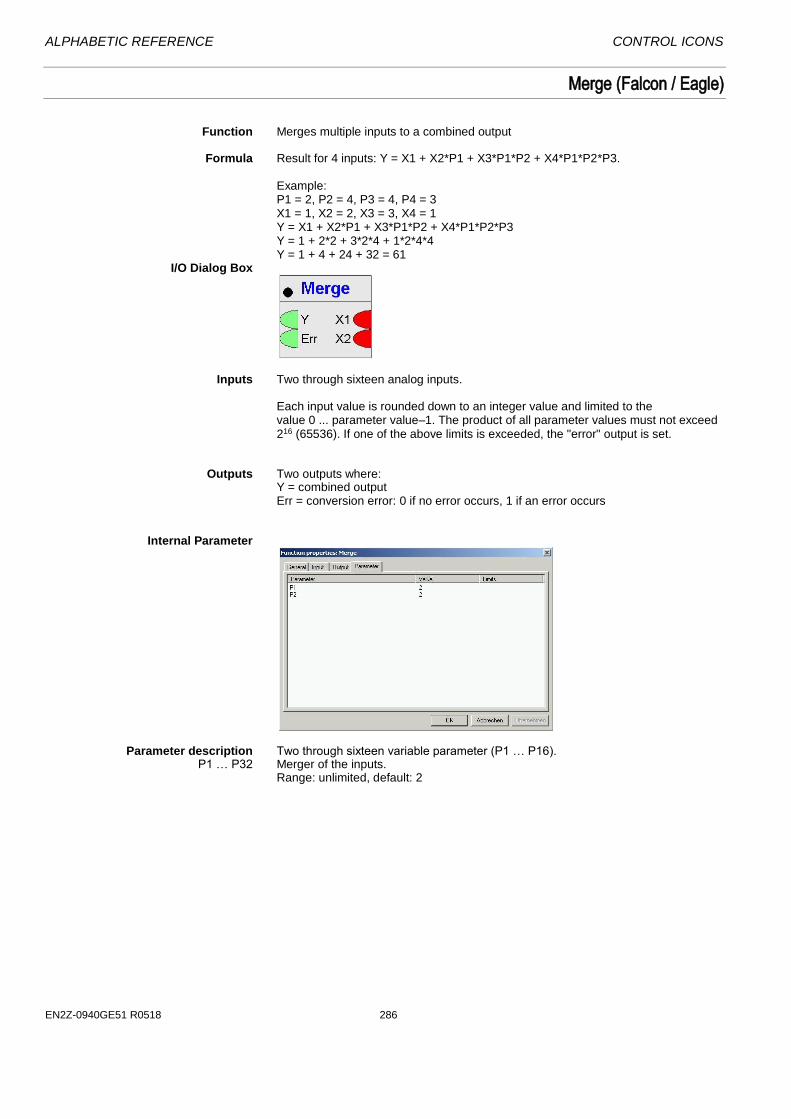
ALPHABETIC REFERENCE CONTROL ICONS
EN2Z-0940GE51 R0518 286
Merge (Falcon / Eagle)
Function Merges multiple inputs to a combined output Formula Result for 4 inputs: Y = X1 + X2*P1 + X3*P1*P2 + X4*P1*P2*P3.
Example: P1 = 2, P2 = 4, P3 = 4, P4 = 3 X1 = 1, X2 = 2, X3 = 3, X4 = 1 Y = X1 + X2*P1 + X3*P1*P2 + X4*P1*P2*P3 Y = 1 + 2*2 + 3*2*4 + 1*2*4*4 Y = 1 + 4 + 24 + 32 = 61
I/O Dialog Box
Inputs Two through sixteen analog inputs.
Each input value is rounded down to an integer value and limited to the value 0 ... parameter value–1. The product of all parameter values must not exceed 216 (65536). If one of the above limits is exceeded, the "error" output is set.
Outputs Two outputs where:
Y = combined output Err = conversion error: 0 if no error occurs, 1 if an error occurs
Internal Parameter
Parameter description Two through sixteen variable parameter (P1 … P16). P1 … P32 Merger of the inputs.
Range: unlimited, default: 2
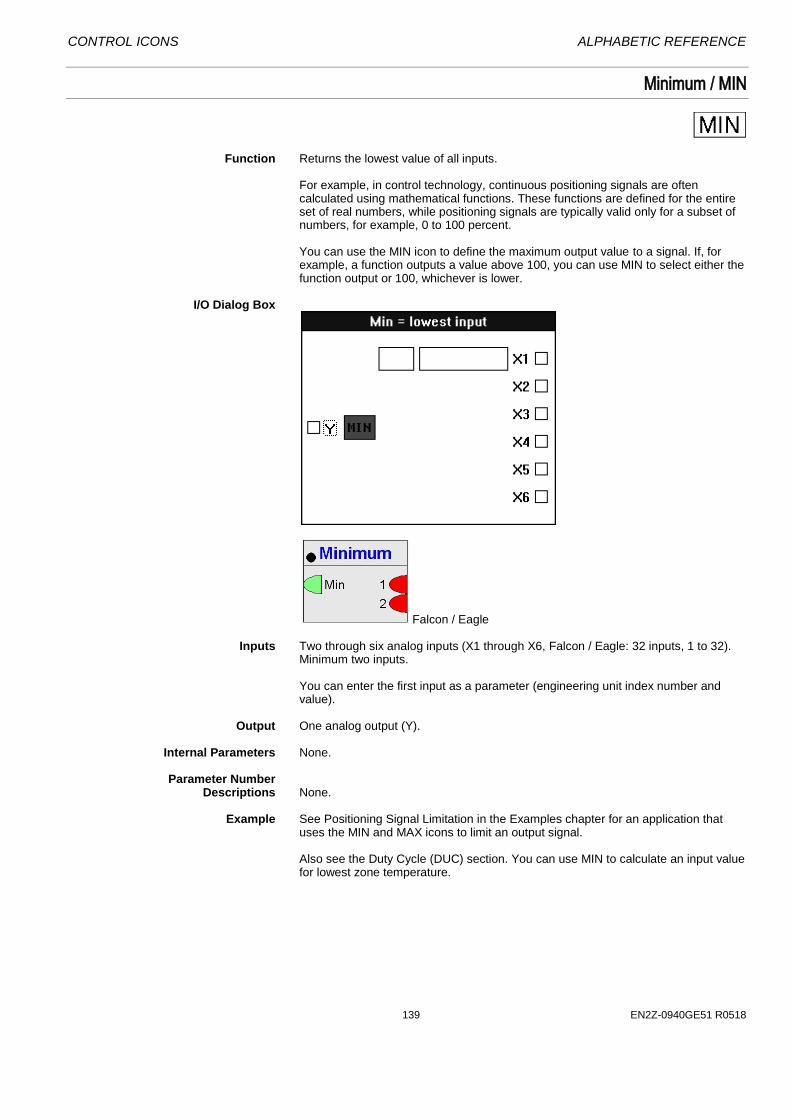
CONTROL ICONS ALPHABETIC REFERENCE
139 EN2Z-0940GE51 R0518
Minimum / MIN
Function Returns the lowest value of all inputs.
For example, in control technology, continuous positioning signals are often calculated using mathematical functions. These functions are defined for the entire set of real numbers, while positioning signals are typically valid only for a subset of numbers, for example, 0 to 100 percent. You can use the MIN icon to define the maximum output value to a signal. If, for example, a function outputs a value above 100, you can use MIN to select either the function output or 100, whichever is lower.
I/O Dialog Box
Falcon / Eagle Inputs Two through six analog inputs (X1 through X6, Falcon / Eagle: 32 inputs, 1 to 32).
Minimum two inputs.
You can enter the first input as a parameter (engineering unit index number and value).
Output One analog output (Y). Internal Parameters None. Parameter Number Descriptions None. Example See Positioning Signal Limitation in the Examples chapter for an application that
uses the MIN and MAX icons to limit an output signal.
Also see the Duty Cycle (DUC) section. You can use MIN to calculate an input value for lowest zone temperature.
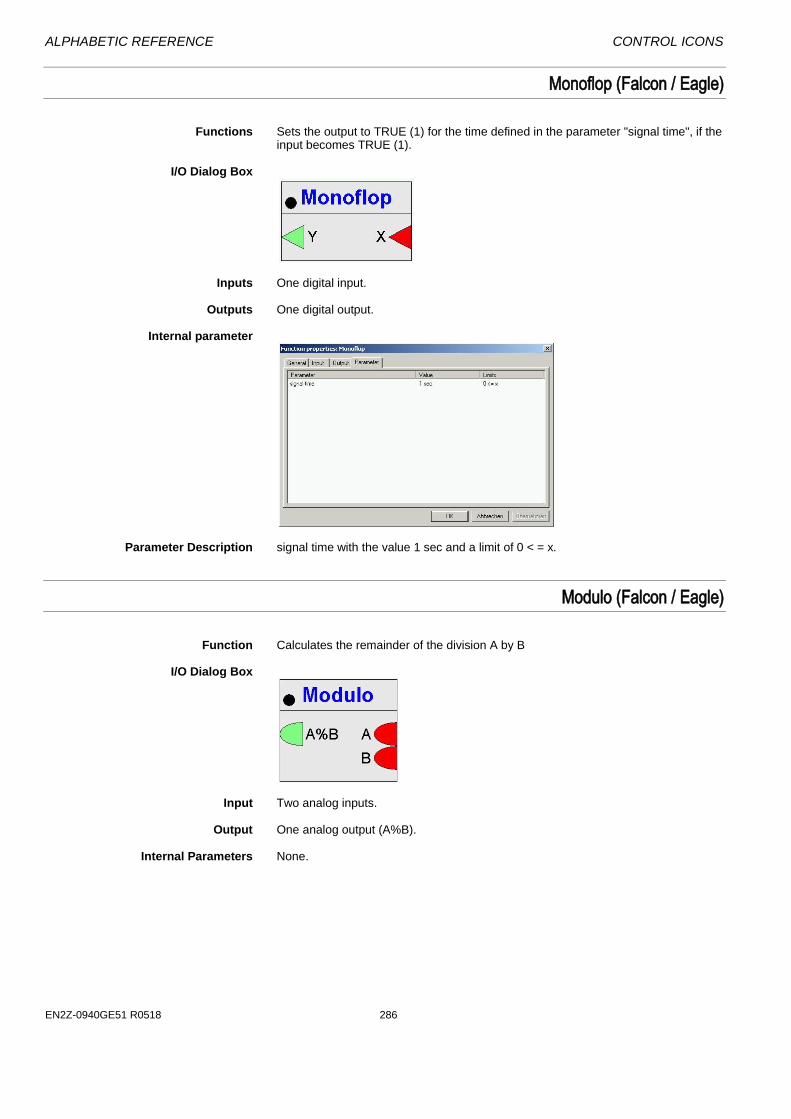
ALPHABETIC REFERENCE CONTROL ICONS
EN2Z-0940GE51 R0518 286
Monoflop (Falcon / Eagle)
Functions Sets the output to TRUE (1) for the time defined in the parameter "signal time", if the
input becomes TRUE (1). I/O Dialog Box
Inputs One digital input. Outputs One digital output. Internal parameter
Parameter Description signal time with the value 1 sec and a limit of 0 < = x.
Modulo (Falcon / Eagle)
Function Calculates the remainder of the division A by B I/O Dialog Box
Input Two analog inputs. Output One analog output (A%B). Internal Parameters None.

CONTROL ICONS ALPHABETIC REFERENCE
141 EN2Z-0940GE51 R0518
Multi-Switch In (Falcon / Eagle)
Function Conditional switch. Switches the value of a specified input to the output, depending
on the "Sel X" input. I/O Dialog Box
Input Two through thirty two analog inputs.
One analog input (Sel X) to select the active input. Output One analog output (Y). Internal Parameters None.
Multi-Switch Out (Falcon / Eagle)
Function X input is copied to the output selected by the "Sel Y" input. The parameter defines
if the other outputs are left unchanged or set to 0 I/O Dialog Box
Input One analog input.
One analog input (Sel Y) to select the active output. Output Two through thirty two analog outputs. Internal Parameter Defines if the unselected outputs are left unchanged or set to 0.
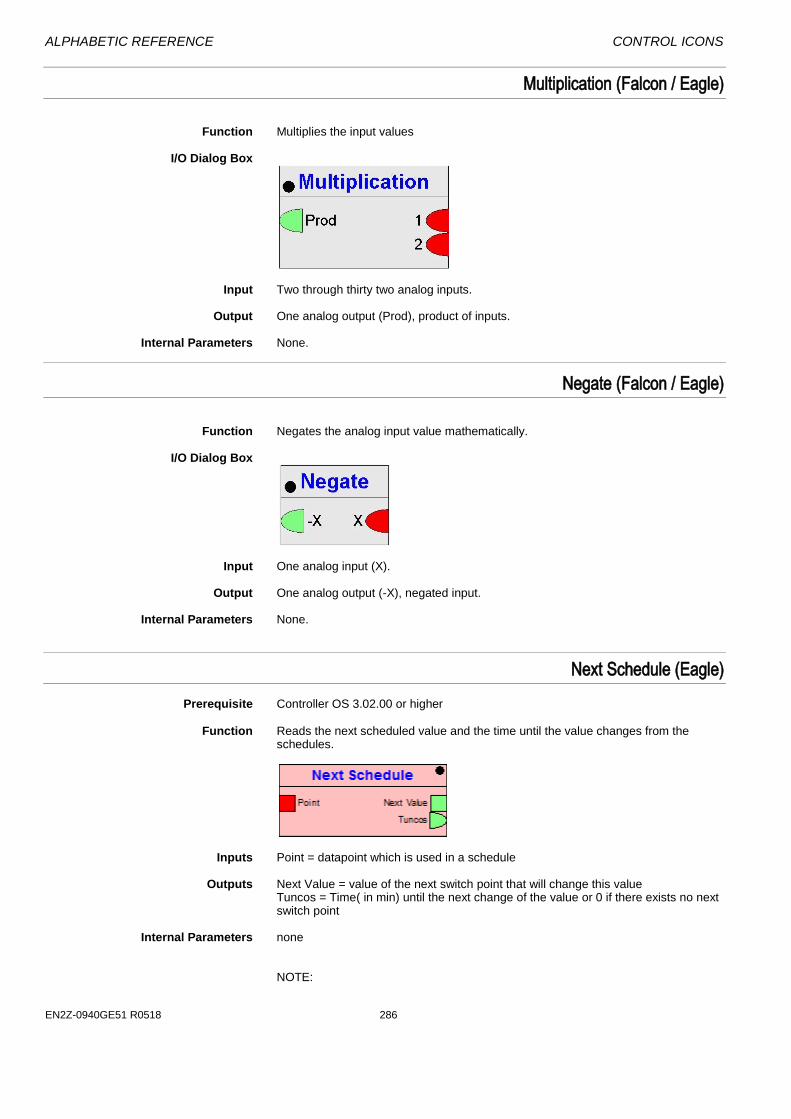
ALPHABETIC REFERENCE CONTROL ICONS
EN2Z-0940GE51 R0518 286
Multiplication (Falcon / Eagle)
Function Multiplies the input values I/O Dialog Box
Input Two through thirty two analog inputs. Output One analog output (Prod), product of inputs. Internal Parameters None.
Negate (Falcon / Eagle)
Function Negates the analog input value mathematically. I/O Dialog Box
Input One analog input (X). Output One analog output (-X), negated input. Internal Parameters None.
Next Schedule (Eagle)
Prerequisite Controller OS 3.02.00 or higher Function Reads the next scheduled value and the time until the value changes from the
schedules.
Inputs Point = datapoint which is used in a schedule
Outputs Next Value = value of the next switch point that will change this value
Tuncos = Time( in min) until the next change of the value or 0 if there exists no next switch point
Internal Parameters none
NOTE:

CONTROL ICONS ALPHABETIC REFERENCE
143 EN2Z-0940GE51 R0518
It may take up to one minute after application start until the outputs show the correct values. If the input is not a datapoint or not used in a schedule then the current value is written to ´Next Value` and ´Tuncos` is 0.
Ln (Falcon/Eagle)
Function Calculates the logarithmus naturalis I/O Dialog Box
Input One analog input (X). Output One analog output (ln X). Internal Parameters None.
Night Purge / NIPU
Function Starts and stops ventilation systems to precondition rooms when cold outside air is
available during non-working hours (usually, nighttime).
To switch on the air conditioning as late as possible, this function permits room temperature to drop below room temperature setpoint during night cooling. NIPU achieves this action by resetting the room temperature setpoint downward. Minimum outdoor air temperature is limited to prevent damage from excessively cold outdoor air.
Engineering Units Conversion Note that the function works with the engineering units according to the global
setting of the Measurement Units (International or Imperial) of the CARE project.

ALPHABETIC REFERENCE CONTROL ICONS
EN2Z-0940GE51 R0518 286
I/O Dialog Box
Falcon / Eagle Example With an outdoor air temperature at night of 59F (15C), the plant purges the room air
with 100 percent outdoor air to enable the cooling function to start as late as possible the following day.
Inputs Four analog inputs, one digital input (Falcon / Eagle: two digital inputs), where:
X1 (Falcon / Eagle: TRm) = Room temperature X2 (Falcon / Eagle: TOat) = Outdoor air temperature XD3 (Falcon / Eagle: OnOff) = Night cooling (digital input) 0 = No, 1 = Yes. This
value turns night cooling on and off. X4 (Falcon / Eagle: TSft) = Room temperature setpoint shift X5 (Falcon / Eagle: TSet) = Room temperature setpoint
Output One digital output YD (Falcon / Eagle: Y). This output switches to 1 when all the
following conditions are met: 1. Room temperature minus outdoor air temperature is greater than the
Room/OAT min. differential (value set in the internal parameters dialog box). 2. Room temperature is greater than room temperature setpoint plus room
temperature setpoint shift. The value of the shift must be negative. 3. Outdoor air temperature must be greater than the Minimum OAT (value set in
the internal parameters dialog box). 4. Input XD3 must equal 1 (night cooling is on). Falcon / Eagle: One analog output Con containing the condition:
One, if TRm minus TOat > parameter “room/OAT min. differential”. Two, if TRm > TSet plus TSft. Three, if TOat > parameter “minimum OAT”.
The following diagram illustrates switching conditions:
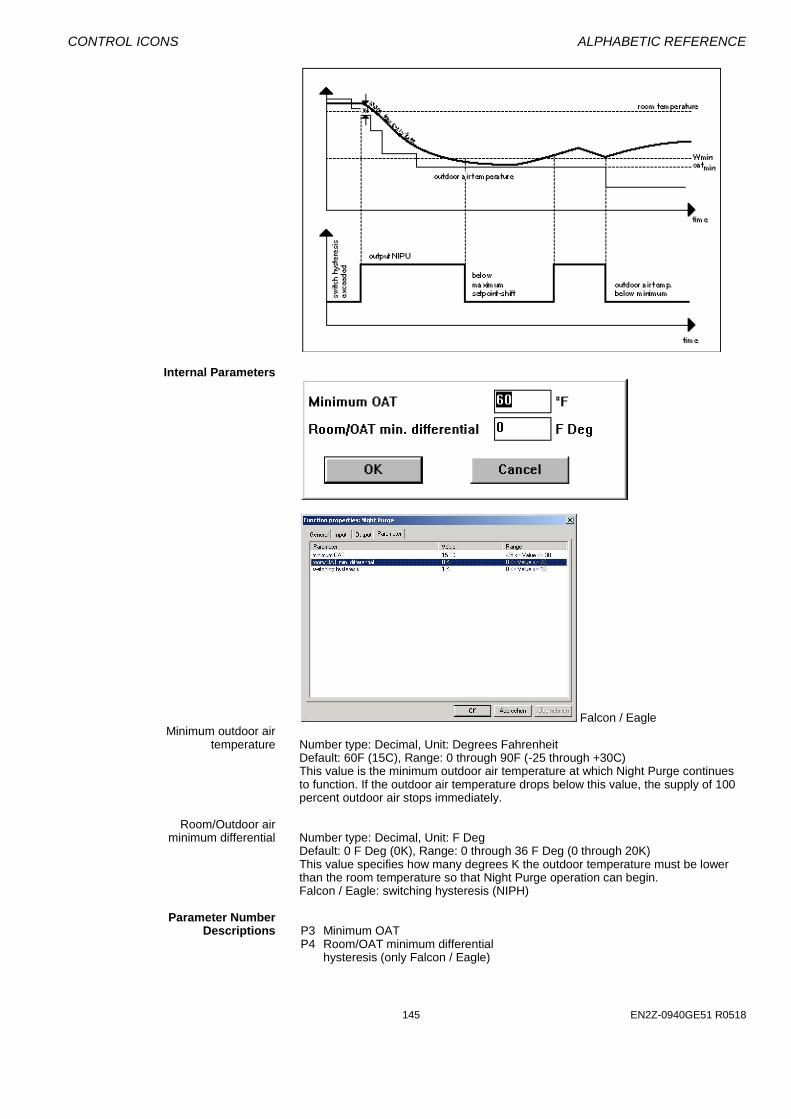
CONTROL ICONS ALPHABETIC REFERENCE
145 EN2Z-0940GE51 R0518
Internal Parameters
Falcon / Eagle Minimum outdoor air temperature Number type: Decimal, Unit: Degrees Fahrenheit
Default: 60F (15C), Range: 0 through 90F (-25 through +30C) This value is the minimum outdoor air temperature at which Night Purge continues to function. If the outdoor air temperature drops below this value, the supply of 100 percent outdoor air stops immediately.
Room/Outdoor air minimum differential Number type: Decimal, Unit: F Deg
Default: 0 F Deg (0K), Range: 0 through 36 F Deg (0 through 20K) This value specifies how many degrees K the outdoor temperature must be lower than the room temperature so that Night Purge operation can begin. Falcon / Eagle: switching hysteresis (NIPH)
Parameter Number Descriptions P3 Minimum OAT P4 Room/OAT minimum differential
hysteresis (only Falcon / Eagle)
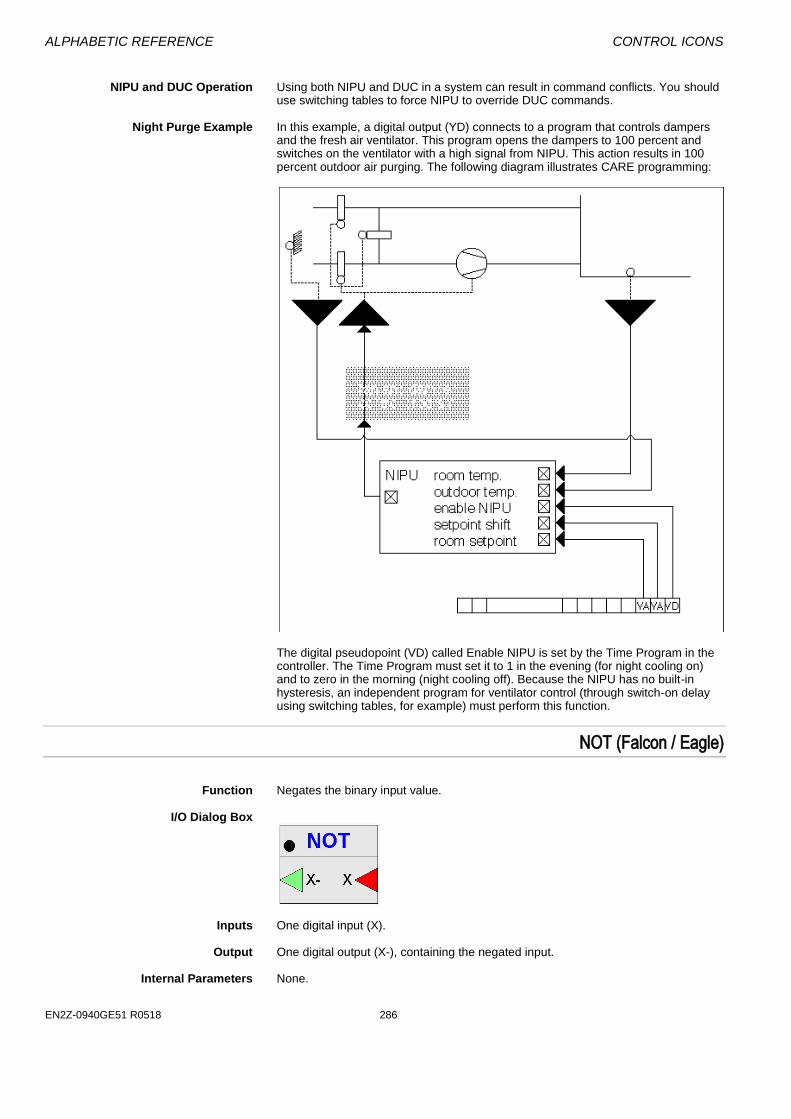
ALPHABETIC REFERENCE CONTROL ICONS
EN2Z-0940GE51 R0518 286
NIPU and DUC Operation Using both NIPU and DUC in a system can result in command conflicts. You should
use switching tables to force NIPU to override DUC commands. Night Purge Example In this example, a digital output (YD) connects to a program that controls dampers
and the fresh air ventilator. This program opens the dampers to 100 percent and switches on the ventilator with a high signal from NIPU. This action results in 100 percent outdoor air purging. The following diagram illustrates CARE programming:
The digital pseudopoint (VD) called Enable NIPU is set by the Time Program in the controller. The Time Program must set it to 1 in the evening (for night cooling on) and to zero in the morning (night cooling off). Because the NIPU has no built-in hysteresis, an independent program for ventilator control (through switch-on delay using switching tables, for example) must perform this function.
NOT (Falcon / Eagle)
Function Negates the binary input value. I/O Dialog Box
Inputs One digital input (X). Output One digital output (X-), containing the negated input. Internal Parameters None.

CONTROL ICONS ALPHABETIC REFERENCE
147 EN2Z-0940GE51 R0518
Odd Parity (Falcon / Eagle)
Function Compares binary values and returns TRUE(1), if the number of TRUE(1) elements
are odd. I/O Box Dialog
Inputs Two through thirty two digital inputs. Output One digital output (Odd). Internal Parameters None.
On-Board DI (Falcon / Eagle)
Function Read on-board digital input. I/O Dialog Box
Input None. Output One digital output (Y), containing status of on-board digital input. Internal Parameters None.
On-Board DO (Falcon / Eagle)
Function Write on-board digital output. I/O Dialog Box
Input One digital input (X). Output None. Internal Parameters None.

ALPHABETIC REFERENCE CONTROL ICONS
EN2Z-0940GE51 R0518 286
On/Off Delay (Falcon / Eagle)
Function Switch On- and Off delay of input A to output Y. The Off-Delay extends the time
period of the signal. You can create either an On- or Off delay logic or apply both delays.
I/O Dialog Box
Input One digital input (A). Output One digital output (Y) Internal Parameters None. On_Delay Example
Off-Delay Example
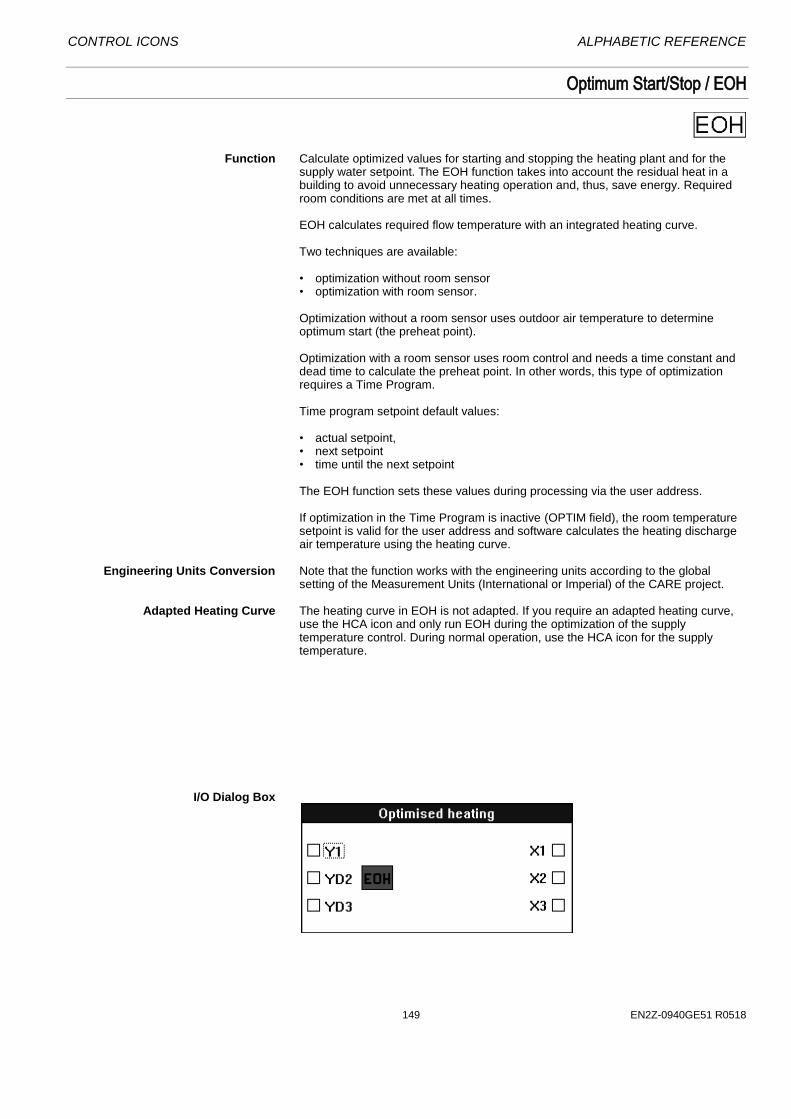
CONTROL ICONS ALPHABETIC REFERENCE
149 EN2Z-0940GE51 R0518
Optimum Start/Stop / EOH
Function Calculate optimized values for starting and stopping the heating plant and for the
supply water setpoint. The EOH function takes into account the residual heat in a building to avoid unnecessary heating operation and, thus, save energy. Required room conditions are met at all times.
EOH calculates required flow temperature with an integrated heating curve. Two techniques are available:
• optimization without room sensor • optimization with room sensor.
Optimization without a room sensor uses outdoor air temperature to determine optimum start (the preheat point). Optimization with a room sensor uses room control and needs a time constant and dead time to calculate the preheat point. In other words, this type of optimization requires a Time Program.
Time program setpoint default values:
• actual setpoint, • next setpoint • time until the next setpoint
The EOH function sets these values during processing via the user address.
If optimization in the Time Program is inactive (OPTIM field), the room temperature setpoint is valid for the user address and software calculates the heating discharge air temperature using the heating curve.
Engineering Units Conversion Note that the function works with the engineering units according to the global
setting of the Measurement Units (International or Imperial) of the CARE project. Adapted Heating Curve The heating curve in EOH is not adapted. If you require an adapted heating curve,
use the HCA icon and only run EOH during the optimization of the supply temperature control. During normal operation, use the HCA icon for the supply temperature.
I/O Dialog Box

ALPHABETIC REFERENCE CONTROL ICONS
EN2Z-0940GE51 R0518 286
Falcon / Eagle Inputs Three analog inputs where:
X1 (Falcon / Eagle: TRm) = Room temperature X2 (Falcon / Eagle: TOat) = Outdoor air temperature X3 (Falcon / Eagle: TSet) = Room temperature setpoint via a user address.
Must Do The X3/TSet data point must also be assigned to a time program
(schedule) so that EOH can access occupancy start/stop times. After downloading the program into the controller, you must enable this user address for the Optimum program; it defaults to no. To enable it, enter Yes in the OPTIM column of the time program.
NOTE: If the datapoint is not directly connected to the control icon via drag and drop (possible since Care 8.01.00), the Tuncos icon must be added between the datapoint and the EOH.
Outputs Two digital outputs, one analog output (minimum requirement), where:
Y1 (Falcon / Eagle: TCal) = Discharge air temperature setpoint for the preheat or optimized off phases. YD2 (Falcon / Eagle: Start) = Optimum start flag goes to logic 1 and remains at this value until occupation start time. YD3 (Falcon / Eagle: Stop) = Optimum stop flag goes to logic 1 and remains at this value until optimum start time occurs the following day. YD4 (Falcon / Eagle only: Mode) = Operating mode The following operating modes are possible:
INIT0 Initialization phase
POST_PREHEAT_ROOM_CONTROL 1 Room control after preheat phase
NORMAL_CONTROL 2 Normal control depending on setpoint
PREHEAT 3 Pre-heat phase, optimized preheating
PREHEAT_ROOM_CONTROL 4 Pre-heat phase, optimized preheating with room control
EARLY_SETBACK 5 Optimized Early Switch Off
SETBACK 6 Switch Off
SETBACK_ROOM_CONTROL 7 Switch Off (concurrent room control avoids decreasing of temperature below setpoint)
Internal Parameters

CONTROL ICONS ALPHABETIC REFERENCE
151 EN2Z-0940GE51 R0518
Falcon / Eagle Minimum pre-heat time (with room sensor) P4 Number type: Whole number, Unit: Minutes
Default: 120 min, Range: 0 through 1440 min Maximum pre-heat time (only Falcon / Eagle) Number type: Whole number, Unit: Minutes
Default: 2880 min, Range: > 0 Maximum pre-heat setpoint (with room sensor) P8 Number type: Decimal, Unit: Degrees Fahrenheit
Default: 175F (80C), Range: 32 through 302F (0 through 150C) No room sensor constant P6 Number type: Decimal, Unit: F Deg
Default: 20 F Deg (10K), Range: 0 through 36 F Deg (0 through 20K) Optimum stop outdoor air temperature low limit P7 Number type: Decimal, Unit: Degrees Fahrenheit
Default: 32F (0C), Range: 14 through 59F (-10 through +15C) Pre-heat time at 0C outdoor air temperature (with room sensor) Number type: Whole number, Unit: Minutes
Default: 120 min, Range: 0 through 1440 min Optimum stop (with room sensor) P9 Number type: Whole number, Unit: Minutes/F Deg
Default: 20min/F Deg, Range: 0 through 110 min/F Deg
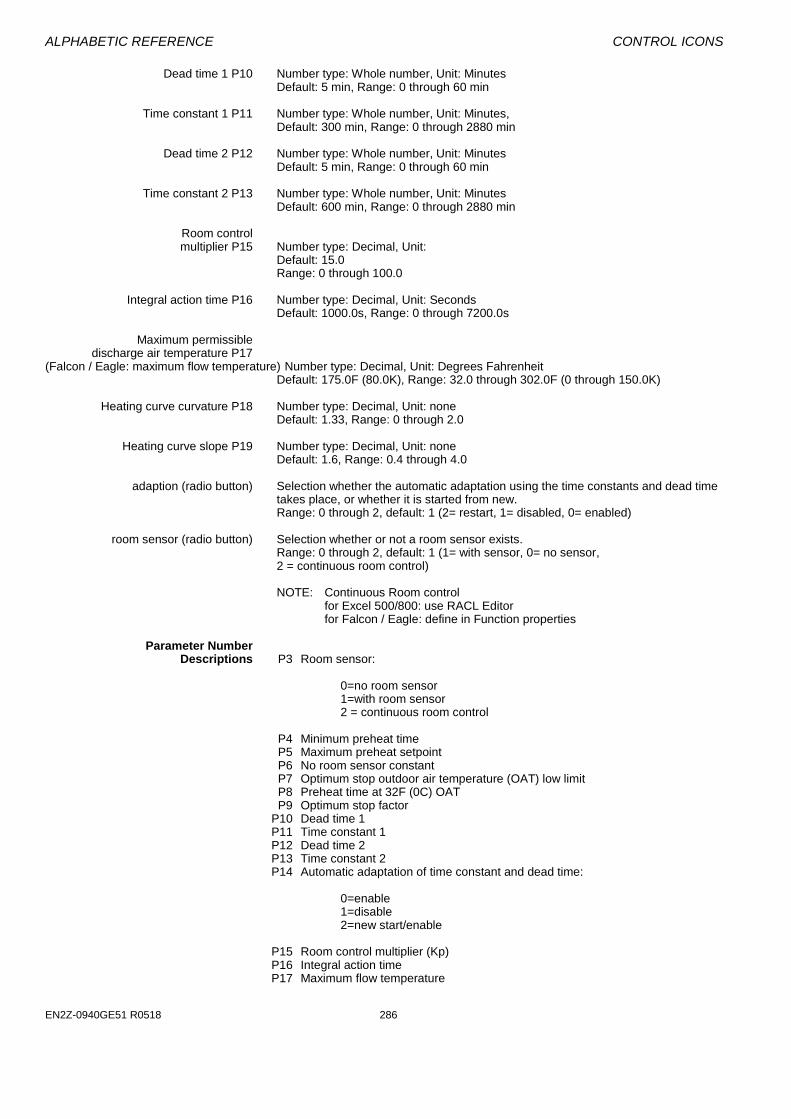
ALPHABETIC REFERENCE CONTROL ICONS
EN2Z-0940GE51 R0518 286
Dead time 1 P10 Number type: Whole number, Unit: Minutes Default: 5 min, Range: 0 through 60 min
Time constant 1 P11 Number type: Whole number, Unit: Minutes,
Default: 300 min, Range: 0 through 2880 min Dead time 2 P12 Number type: Whole number, Unit: Minutes
Default: 5 min, Range: 0 through 60 min Time constant 2 P13 Number type: Whole number, Unit: Minutes
Default: 600 min, Range: 0 through 2880 min Room control multiplier P15 Number type: Decimal, Unit:
Default: 15.0 Range: 0 through 100.0
Integral action time P16 Number type: Decimal, Unit: Seconds
Default: 1000.0s, Range: 0 through 7200.0s Maximum permissible discharge air temperature P17 (Falcon / Eagle: maximum flow temperature) Number type: Decimal, Unit: Degrees Fahrenheit
Default: 175.0F (80.0K), Range: 32.0 through 302.0F (0 through 150.0K) Heating curve curvature P18 Number type: Decimal, Unit: none
Default: 1.33, Range: 0 through 2.0 Heating curve slope P19 Number type: Decimal, Unit: none
Default: 1.6, Range: 0.4 through 4.0 adaption (radio button) Selection whether the automatic adaptation using the time constants and dead time
takes place, or whether it is started from new. Range: 0 through 2, default: 1 (2= restart, 1= disabled, 0= enabled)
room sensor (radio button) Selection whether or not a room sensor exists. Range: 0 through 2, default: 1 (1= with sensor, 0= no sensor, 2 = continuous room control) NOTE: Continuous Room control for Excel 500/800: use RACL Editor for Falcon / Eagle: define in Function properties
Parameter Number Descriptions P3 Room sensor: 0=no room sensor 1=with room sensor 2 = continuous room control P4 Minimum preheat time P5 Maximum preheat setpoint P6 No room sensor constant P7 Optimum stop outdoor air temperature (OAT) low limit P8 Preheat time at 32F (0C) OAT P9 Optimum stop factor P10 Dead time 1 P11 Time constant 1 P12 Dead time 2 P13 Time constant 2 P14 Automatic adaptation of time constant and dead time:
0=enable 1=disable 2=new start/enable P15 Room control multiplier (Kp) P16 Integral action time P17 Maximum flow temperature

CONTROL ICONS ALPHABETIC REFERENCE
153 EN2Z-0940GE51 R0518
P18 Heating curve curvature P19 Heating curve slope EOH Operating Procedures EOH completes a total setback operation when the next switching point of the
optimal heating circuit occurs. In this case, the supply temperature setpoint is set to 32F (0C). At cool-down, EOH output overwrites the switching point in the Time Program. If a further declination of the setback point occurs and is not optimally reached, EOH continues to work under normal conditions. The cool-down phase begins exactly as defined in the Time Program. During the cool-down phase, EOH defines the supply temperature setpoint of the heating curve.
In the figure, the triangle notes refer to the following text: 1 Supply temperature from heating curve 2 Supply temperature 32F (0C) 3 Maximum of supply temperature during rapid preheating.
Heating Optimization WITHOUT Room Sensor During preheat time, EOH works with a fixed prescribed increase (P6) of the room temperature setpoint and varies the preheat point as a function of outdoor air temperature. With a minimum outdoor air temperature of 32F, the preheat phase begins 2 hours before reaching the corresponding switch point in the Time Program.
If the outdoor air temperature (X2) is equal to the room temperature setpoint (X3) including the increase (P6), the preheat point is not advanced. If the outdoor air temperature is between these two points, the advance (tVV) of the preheat point is calculated on the basis of the following linear equation: tVV = (-P8/X3) * X2 + P8 In other words, preheat time advance is equal to the negative of preheat time divided by room temperature setpoint and multiplied by outdoor air temperature plus preheat time. The value of tVV is limited to a maximum of 48 hours.

ALPHABETIC REFERENCE CONTROL ICONS
EN2Z-0940GE51 R0518 286
As an example, at 32F (0C): Preheat time (P8) = 120 min Temperature increase (P6) = 20 F Deg Setpoint (X3) = 68F (20C) Outdoor air temperature (X2)= tVV = (-120 min/20) * 10 + 120 min tVV = 60 min The following diagram illustrates this action:
During this preheat phase, EOH transmits a 1 to the output (YD2). You can use this output to determine whether to overwrite the supply temperature setpoint from the normal application program by the flow temperature setpoint (Y1) from EOH. If the target time point of the switching program occurs in this time, EOH sets output YD2 to logical zero, meaning that the requirements of the normal applications
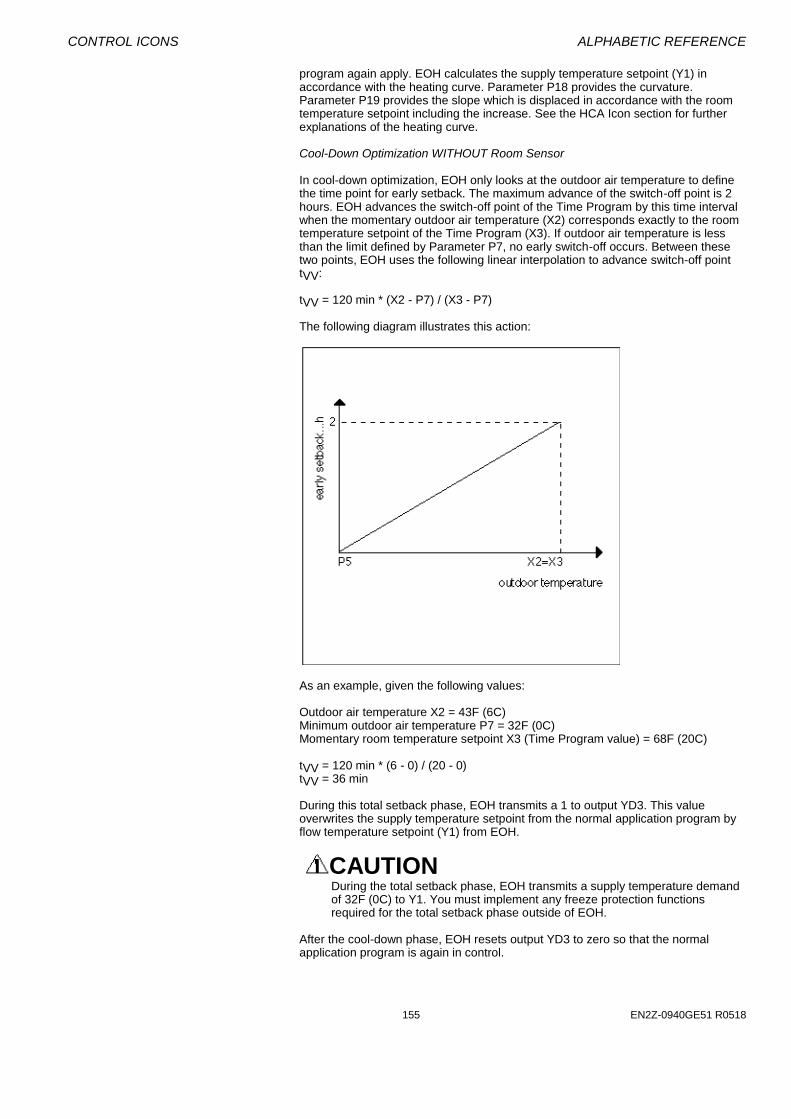
CONTROL ICONS ALPHABETIC REFERENCE
155 EN2Z-0940GE51 R0518
program again apply. EOH calculates the supply temperature setpoint (Y1) in accordance with the heating curve. Parameter P18 provides the curvature. Parameter P19 provides the slope which is displaced in accordance with the room temperature setpoint including the increase. See the HCA Icon section for further explanations of the heating curve. Cool-Down Optimization WITHOUT Room Sensor In cool-down optimization, EOH only looks at the outdoor air temperature to define the time point for early setback. The maximum advance of the switch-off point is 2 hours. EOH advances the switch-off point of the Time Program by this time interval when the momentary outdoor air temperature (X2) corresponds exactly to the room temperature setpoint of the Time Program (X3). If outdoor air temperature is less than the limit defined by Parameter P7, no early switch-off occurs. Between these two points, EOH uses the following linear interpolation to advance switch-off point tVV: tVV = 120 min * (X2 - P7) / (X3 - P7) The following diagram illustrates this action:
As an example, given the following values: Outdoor air temperature X2 = 43F (6C) Minimum outdoor air temperature P7 = 32F (0C) Momentary room temperature setpoint X3 (Time Program value) = 68F (20C) tVV = 120 min * (6 - 0) / (20 - 0) tVV = 36 min During this total setback phase, EOH transmits a 1 to output YD3. This value overwrites the supply temperature setpoint from the normal application program by flow temperature setpoint (Y1) from EOH.
CAUTION During the total setback phase, EOH transmits a supply temperature demand of 32F (0C) to Y1. You must implement any freeze protection functions required for the total setback phase outside of EOH.
After the cool-down phase, EOH resets output YD3 to zero so that the normal application program is again in control.

ALPHABETIC REFERENCE CONTROL ICONS
EN2Z-0940GE51 R0518 286
CAUTION It is absolutely essential that the switch point for cool-down is the latest possible time point in the Time Program. This precaution prevents premature cool-down and problems with rooms being outside required conditions.
Heating Optimization with Room Sensor EOH can calculate the residual heat in a building and the exact preheat points only if there is a room sensor (X1). With preheat optimization with a room sensor, EOH chooses two alternatives, variable temperatures preheat or variable time preheats. Variable temperature preheat fixes preheat time as a constant (Parameter P4, minimum preheat time). The following figure illustrates this alternative:
EOH calculates demand flow temperature (output Y1) at the beginning of the preheat phase as a function of outdoor air temperature using a heating curve. If outdoor air temperature changes during the optimization phase, EOH adapts flow setpoint accordingly. Parameters P18 (curvature) and P19 (Slope) establish the heating curve. Parameter P17 limits the supply temperature demand (Y1) to the maximum permissible supply temperature. Variable time preheat is a transition from variable temperature optimization to variable time optimization as a function of the maximum allowable supply temperature (P17) and minimum preheat time (P4). If room temperature setpoint is not reached within the prescribed minimum preheat time (P4) even with a maximum supply temperature for the preheat, EOH can displace the preheat time point independently to an earlier time. With this type of optimization, preheat begins at the calculated point in time with the maximum preheat temperature (P5). The next two diagrams illustrate this operation for day and day/night operation.
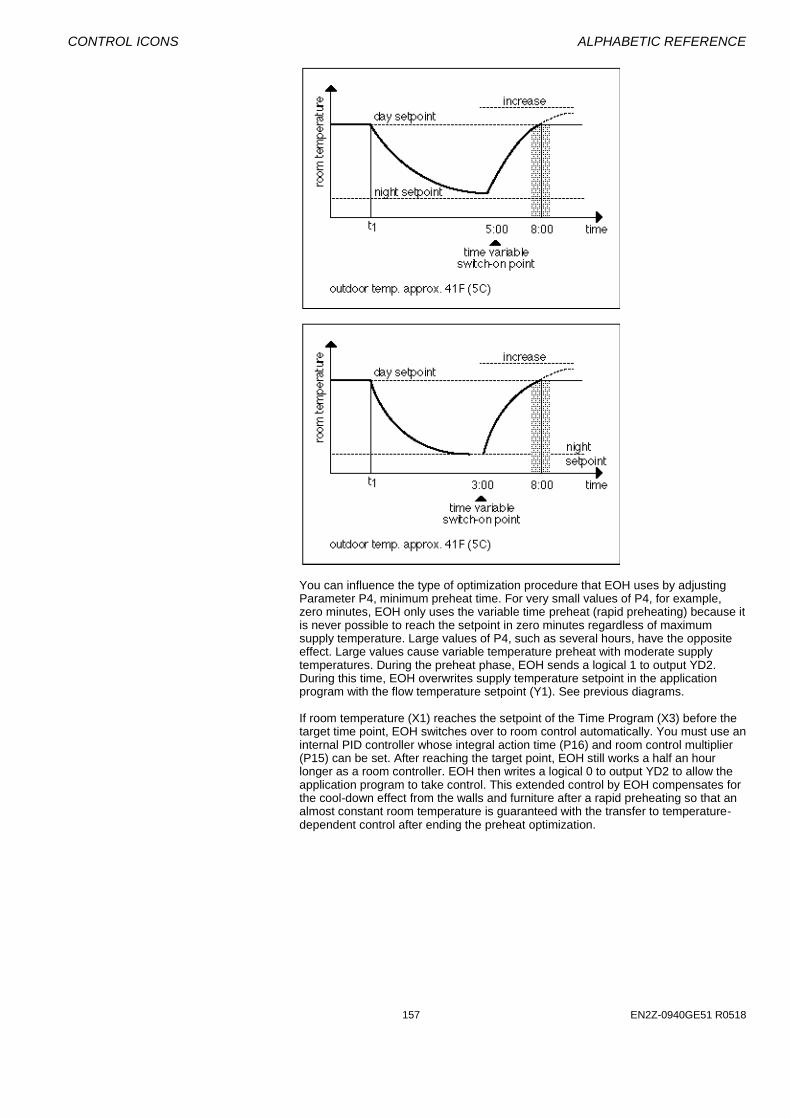
CONTROL ICONS ALPHABETIC REFERENCE
157 EN2Z-0940GE51 R0518
You can influence the type of optimization procedure that EOH uses by adjusting Parameter P4, minimum preheat time. For very small values of P4, for example, zero minutes, EOH only uses the variable time preheat (rapid preheating) because it is never possible to reach the setpoint in zero minutes regardless of maximum supply temperature. Large values of P4, such as several hours, have the opposite effect. Large values cause variable temperature preheat with moderate supply temperatures. During the preheat phase, EOH sends a logical 1 to output YD2. During this time, EOH overwrites supply temperature setpoint in the application program with the flow temperature setpoint (Y1). See previous diagrams. If room temperature (X1) reaches the setpoint of the Time Program (X3) before the target time point, EOH switches over to room control automatically. You must use an internal PID controller whose integral action time (P16) and room control multiplier (P15) can be set. After reaching the target point, EOH still works a half an hour longer as a room controller. EOH then writes a logical 0 to output YD2 to allow the application program to take control. This extended control by EOH compensates for the cool-down effect from the walls and furniture after a rapid preheating so that an almost constant room temperature is guaranteed with the transfer to temperature-dependent control after ending the preheat optimization.
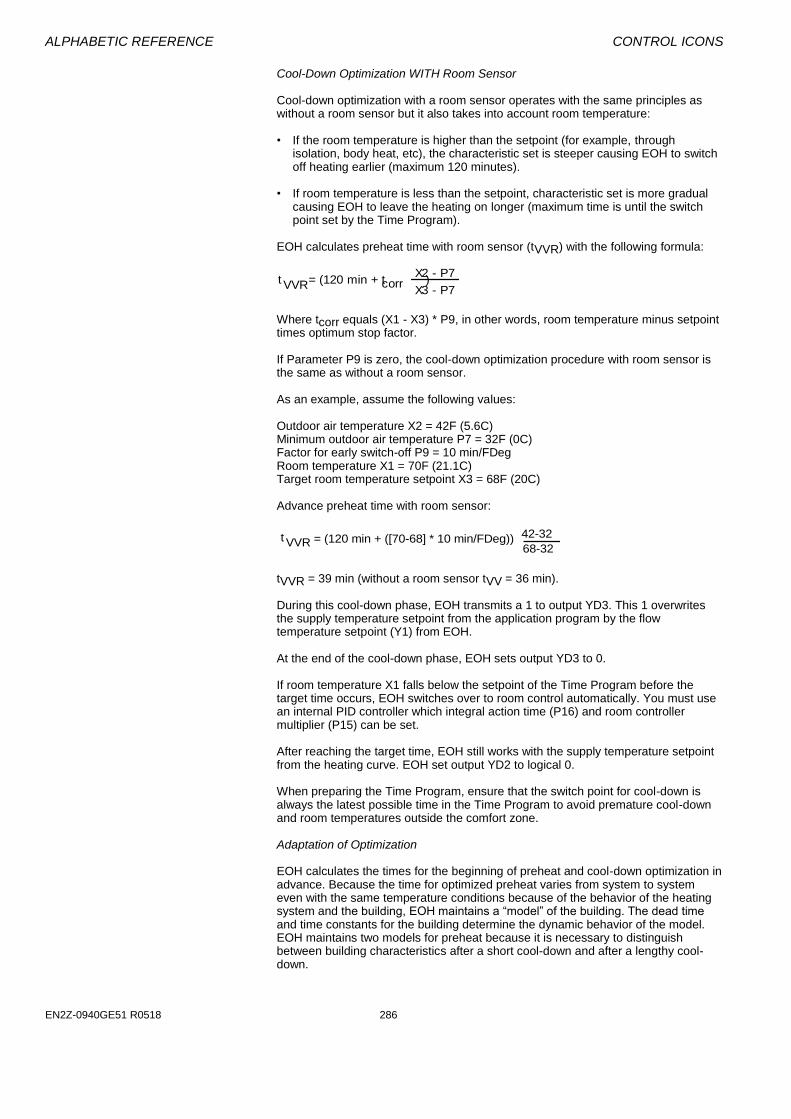
ALPHABETIC REFERENCE CONTROL ICONS
EN2Z-0940GE51 R0518 286
Cool-Down Optimization WITH Room Sensor Cool-down optimization with a room sensor operates with the same principles as without a room sensor but it also takes into account room temperature:
• If the room temperature is higher than the setpoint (for example, through
isolation, body heat, etc), the characteristic set is steeper causing EOH to switch off heating earlier (maximum 120 minutes).
• If room temperature is less than the setpoint, characteristic set is more gradual
causing EOH to leave the heating on longer (maximum time is until the switch point set by the Time Program).
EOH calculates preheat time with room sensor (tVVR) with the following formula:
t VVRX2 - P7
X3 - P7corr= (120 min + t )
Where tcorr equals (X1 - X3) * P9, in other words, room temperature minus setpoint times optimum stop factor. If Parameter P9 is zero, the cool-down optimization procedure with room sensor is the same as without a room sensor. As an example, assume the following values: Outdoor air temperature X2 = 42F (5.6C) Minimum outdoor air temperature P7 = 32F (0C) Factor for early switch-off P9 = 10 min/FDeg Room temperature X1 = 70F (21.1C) Target room temperature setpoint X3 = 68F (20C) Advance preheat time with room sensor:
t VVR42-32
68-32= (120 min + ([70-68] * 10 min/FDeg))
tVVR = 39 min (without a room sensor tVV = 36 min). During this cool-down phase, EOH transmits a 1 to output YD3. This 1 overwrites the supply temperature setpoint from the application program by the flow temperature setpoint (Y1) from EOH.
At the end of the cool-down phase, EOH sets output YD3 to 0. If room temperature X1 falls below the setpoint of the Time Program before the target time occurs, EOH switches over to room control automatically. You must use an internal PID controller which integral action time (P16) and room controller multiplier (P15) can be set. After reaching the target time, EOH still works with the supply temperature setpoint from the heating curve. EOH set output YD2 to logical 0. When preparing the Time Program, ensure that the switch point for cool-down is always the latest possible time in the Time Program to avoid premature cool-down and room temperatures outside the comfort zone. Adaptation of Optimization EOH calculates the times for the beginning of preheat and cool-down optimization in advance. Because the time for optimized preheat varies from system to system even with the same temperature conditions because of the behavior of the heating system and the building, EOH maintains a “model” of the building. The dead time and time constants for the building determine the dynamic behavior of the model. EOH maintains two models for preheat because it is necessary to distinguish between building characteristics after a short cool-down and after a lengthy cool-down.
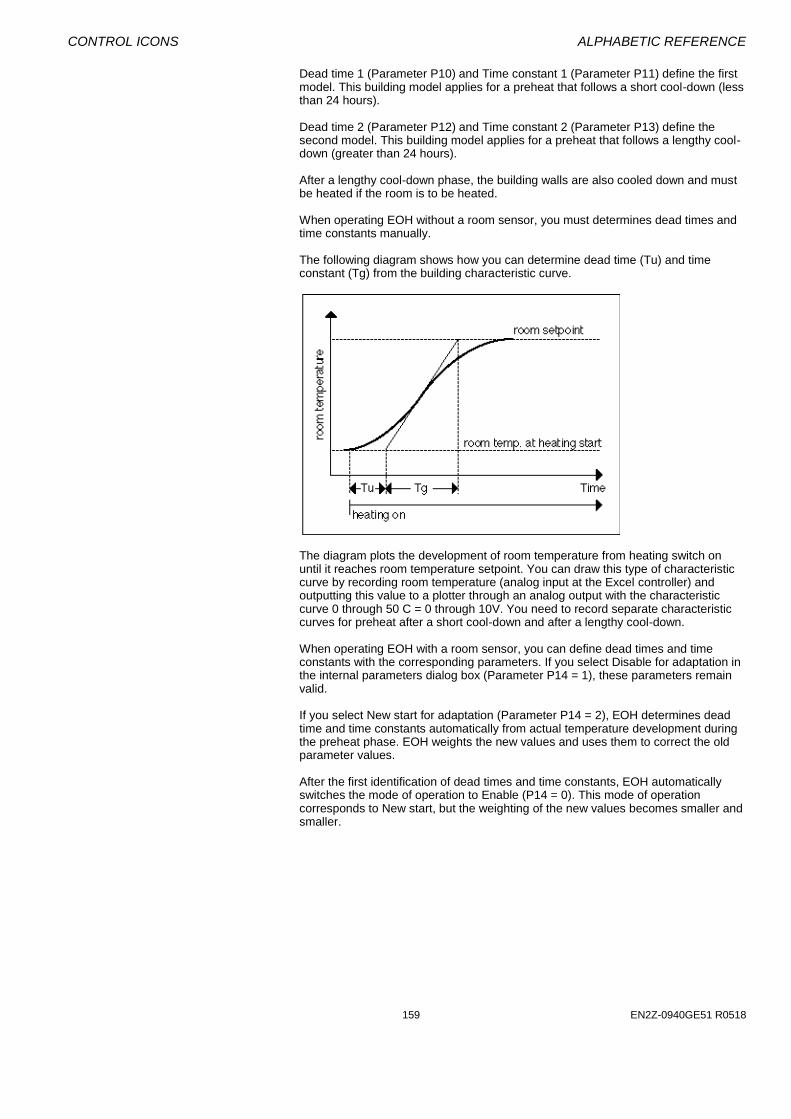
CONTROL ICONS ALPHABETIC REFERENCE
159 EN2Z-0940GE51 R0518
Dead time 1 (Parameter P10) and Time constant 1 (Parameter P11) define the first model. This building model applies for a preheat that follows a short cool-down (less than 24 hours). Dead time 2 (Parameter P12) and Time constant 2 (Parameter P13) define the second model. This building model applies for a preheat that follows a lengthy cool-down (greater than 24 hours). After a lengthy cool-down phase, the building walls are also cooled down and must be heated if the room is to be heated.
When operating EOH without a room sensor, you must determines dead times and time constants manually. The following diagram shows how you can determine dead time (Tu) and time constant (Tg) from the building characteristic curve.
The diagram plots the development of room temperature from heating switch on until it reaches room temperature setpoint. You can draw this type of characteristic curve by recording room temperature (analog input at the Excel controller) and outputting this value to a plotter through an analog output with the characteristic curve 0 through 50 C = 0 through 10V. You need to record separate characteristic curves for preheat after a short cool-down and after a lengthy cool-down. When operating EOH with a room sensor, you can define dead times and time constants with the corresponding parameters. If you select Disable for adaptation in the internal parameters dialog box (Parameter P14 = 1), these parameters remain valid. If you select New start for adaptation (Parameter P14 = 2), EOH determines dead time and time constants automatically from actual temperature development during the preheat phase. EOH weights the new values and uses them to correct the old parameter values. After the first identification of dead times and time constants, EOH automatically switches the mode of operation to Enable (P14 = 0). This mode of operation corresponds to New start, but the weighting of the new values becomes smaller and smaller.

ALPHABETIC REFERENCE CONTROL ICONS
EN2Z-0940GE51 R0518 286
EOH Operation Example 1 The following schematic diagram illustrates EOH use.
A switching table implements an outdoor air temperature-dependent frost protection function outside of EOH. When outdoor air temperature is less than or equal to 2C (36F), the table sets a constant room temperature setpoint (for example 10C [50F]). The value of the constant is the X2 input parameter of the SWI icon. Frost protection applies only during the cool-down phase because EOH demands a 0C (32F) flow temperature during this time and the flow temperature setpoint of the application program that is equipped with frost protection is overwritten.

CONTROL ICONS ALPHABETIC REFERENCE
161 EN2Z-0940GE51 R0518
The following flowchart illustrates the logic decisions of this example.
EOH Operation Example 2 The following diagram shows another example of EOH use :
At optimum start, YD2 goes to logic 1 and returns to logic 0 at occupancy start time. At optimum stop, YD3 goes to logic 1 and remains at this value until optimum start occurs (next day or later).

ALPHABETIC REFERENCE CONTROL ICONS
EN2Z-0940GE51 R0518 286
Optimum Start without a Room Sensor The following diagram illustrates the calculation of an ON time based on an outdoor
air temperature/preheat time at 32F (0C) characteristic:
EOH calculates a discharge air setpoint based on the selected outdoor air temperature/discharge air (OAT/DA) schedule (default is 1.6) plus the effect of P8 (parallel shift) and the time program room setpoint it must achieve. During this optimized ON period , the discharge air setpoint varies with the OAT. P5 determines maximum discharge air setpoint. If the load on the system was so great that even an occupancy start time minus P8 and a maximum discharge air setpoint P5 would be insufficient, then software would calculate an even earlier start time. P4 minimum preheat time has little or no effect. At occupancy, EOH reverts to a standard outdoor air compensator.
Optimum Start with a Room Sensor Switch ON time depends on the load on the system:
Light load—switch ON time is occupancy start (P4 minimum preheat time) with a corresponding low discharge air setpoint. Medium load—switch ON time is occupancy start minus a value between P4 and P8:
Both the OAT and room temperature have an effect on this switch ON time. Software calculates discharge air setpoint from the OAT/DA characteristic (default 1.6) and further modifies it with room temperature and time program room setpoint. Heavy load—If the load on the system was so great that even an occupancy start time minus P8 and a maximum discharge air setpoint P5 would be insufficient, then software would calculate an even earlier start time. During the preheat period, the OAT causes the discharge air setpoint to vary. If room temperature rises above the time program setpoint, software resets discharge air setpoint accordingly. At occupancy start. EOH reverts to a standard OAT/DA compensator. If room temperature is not up to setpoint by occupancy start time, software resets discharge air setpoint up a corresponding amount. This effect on the discharge air setpoint continues for a period of 30 minutes after occupancy start. After this time, EOH reverts to a standard OAT/DA compensator.
Optimum Start with Adaptation EOH software includes HCA functions. For automatic adaptation of the heating
curve (discharge air vs. outdoor air):

CONTROL ICONS ALPHABETIC REFERENCE
163 EN2Z-0940GE51 R0518
• Connect a space sensor. • Set space temperature setpoint greater than 64.4F (18C). • Enable adaptation (P14). • Ensure the following conditions: - Average OAT must be less than 59F (15C). - Adaptation must occur at least three times before you can alter the defaults for
the basic setting of the heating curve. Optimum Stop EOH calculates the optimum stop period based on outdoor air temperature:
Depending on whether or not a room temperature sensor is connected, software may further modify this optimized stop period, for example:
• Increase if room temperature is greater than room setpoint (maximum 2 hours). • Decrease if room temperature is less than room setpoint.
At the calculated stop time, software resets discharge air setpoint to zero and changes digital output YD3 to logic 1. YD3 remains at logic 1 until optimum start (next day or later).
Optimum Start/Stop / EOH3
Function Calculate optimized values for starting and stopping the heating plant and for the
supply water setpoint. The EOH3 function considers the residual heat in a building to avoid unnecessary heating operation and, thus, save energy. Required room conditions are met at all times.
EOH3 calculates the required flow temperature according to an integrated heating curve. There are two optimization options:
• optimization without room sensor • optimization with room sensor
Optimization without a room sensor uses the outdoor air temperature to determine the optimum start (preheat point). Optimization with a room sensor uses the room control and needs a time constant and dead time to calculate the preheat point. Any kind of start or stop optimization requires a time program for the room temperature setpoint. Time program setpoint values are:
EOH3

ALPHABETIC REFERENCE CONTROL ICONS
EN2Z-0940GE51 R0518 286
• actual setpoint • next setpoint • time until next setpoint
The EOH3 function gets these values via the datapoint connected to the input TSet during processing. If the "EOH / EOV Optimization" option is inactive (Analog Value properties), the heating curve calculates the heating supply air temperature setpoint using the room temperature setpoint.
Engineering Units Conversion Note that the function works with the engineering units according to the global setting of the Measurement Units (International or Imperial) of the CARE project.
Adapted Heating Curve The heating curve in EOH3 is automatically adapted if the internal and external adaptation (input AdaEn) conditions are fulfilled, see section "Heating Curve Adaptation".
(Eagle only) Inputs Six analog inputs where:
TSet (X1) = Room temperature setpoint via a user address.
Must Do The input TSet/ X1 datapoint must be assigned to a time
schedule so that EOH3 can access occupancy start/ stop times. You must enable the "EOH / EOV Optimization" option (Analog Value properties); it defaults to ´disabled`.
TRm (X2) = Room temperature, active if TRmOvr = 999 TRmOvr(X3) = Room temperature setpoint from overrides like wall module, extended operation button, summer or holiday switch.
The input TRm will be used only if TRmOverr = 999, otherwise the input TRmOverr will be the room temperature setpoint (<> 999 if override, = 999 if no override). There will be no optimum start/ stop optimization during room temperature setpoint override.
TOat (X4) = Outdoor air temperature OptEn (X5) = Optimization mode • 0;1 = no optimization • 2 = optimum start • 3 = optimum stop • 4 = optimum start and stop AdaEn (X6) = Heating curve adaptation; 0 = disable; 1 = enable Toff (Eagle: X7) = control point adjustment – from the setpoint wheel of a wall module [-7, 7].
Outputs Four digital outputs, one analog output (minimum requirement), where: TSup (Y1) = Supply water temperature setpoint Start (YD2) = Optimum start goes to logic 1 during the preheating time Stop (YD3) = Optimum stop goes to logic 1during the early setback time
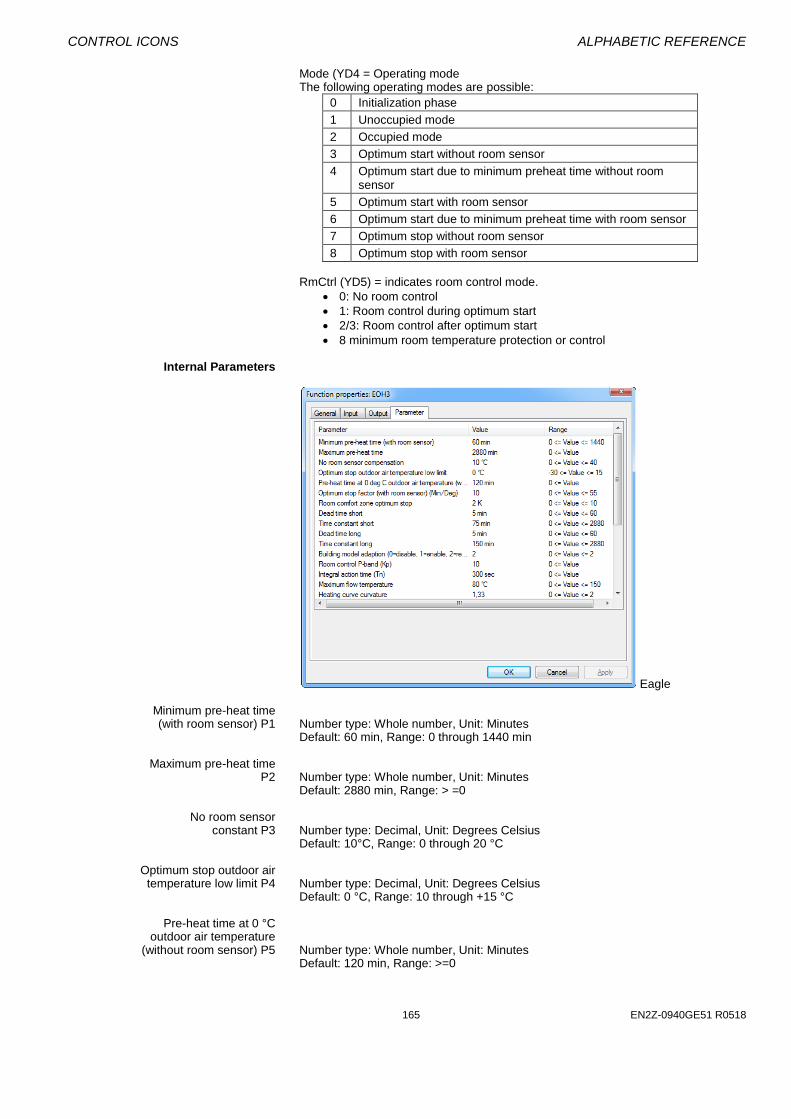
CONTROL ICONS ALPHABETIC REFERENCE
165 EN2Z-0940GE51 R0518
Mode (YD4 = Operating mode The following operating modes are possible:
0 Initialization phase
1 Unoccupied mode
2 Occupied mode
3 Optimum start without room sensor
4 Optimum start due to minimum preheat time without room sensor
5 Optimum start with room sensor
6 Optimum start due to minimum preheat time with room sensor
7 Optimum stop without room sensor
8 Optimum stop with room sensor
RmCtrl (YD5) = indicates room control mode.
0: No room control
1: Room control during optimum start
2/3: Room control after optimum start
8 minimum room temperature protection or control
Internal Parameters
Eagle Minimum pre-heat time (with room sensor) P1 Number type: Whole number, Unit: Minutes
Default: 60 min, Range: 0 through 1440 min Maximum pre-heat time P2 Number type: Whole number, Unit: Minutes
Default: 2880 min, Range: > =0
No room sensor constant P3 Number type: Decimal, Unit: Degrees Celsius
Default: 10°C, Range: 0 through 20 °C
Optimum stop outdoor air temperature low limit P4 Number type: Decimal, Unit: Degrees Celsius
Default: 0 °C, Range: 10 through +15 °C Pre-heat time at 0 °C outdoor air temperature (without room sensor) P5 Number type: Whole number, Unit: Minutes
Default: 120 min, Range: >=0
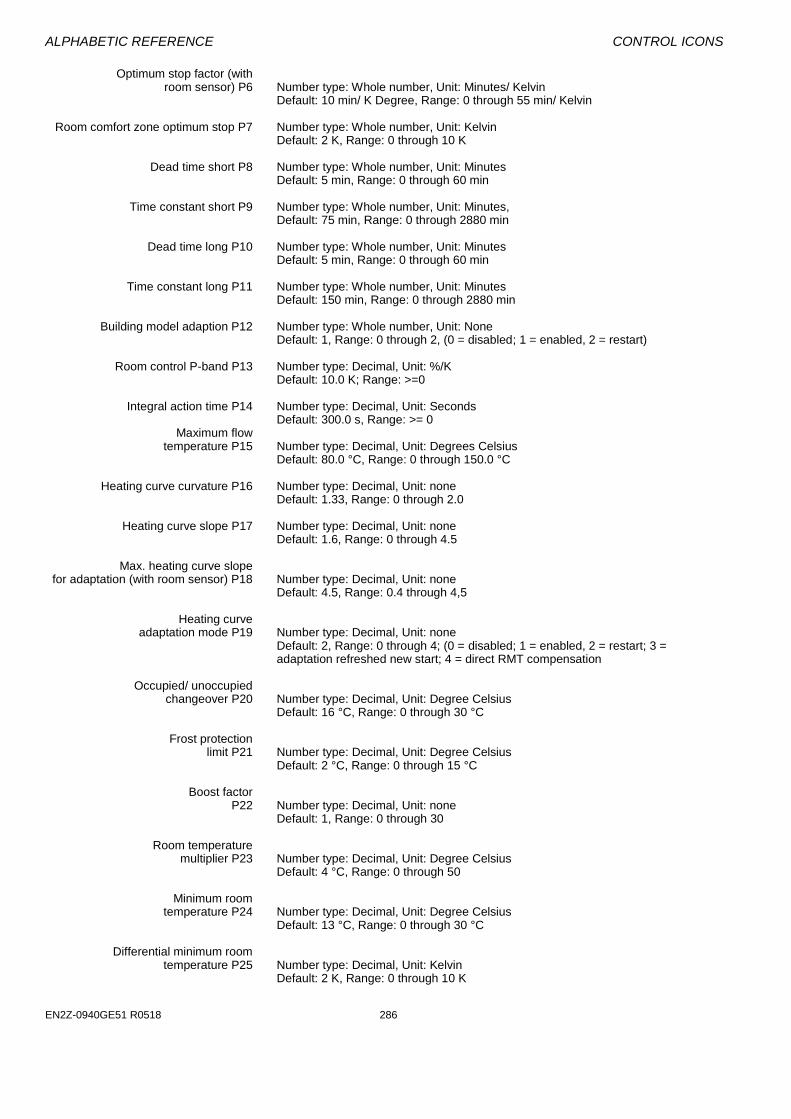
ALPHABETIC REFERENCE CONTROL ICONS
EN2Z-0940GE51 R0518 286
Optimum stop factor (with room sensor) P6 Number type: Whole number, Unit: Minutes/ Kelvin
Default: 10 min/ K Degree, Range: 0 through 55 min/ Kelvin Room comfort zone optimum stop P7 Number type: Whole number, Unit: Kelvin
Default: 2 K, Range: 0 through 10 K
Dead time short P8 Number type: Whole number, Unit: Minutes Default: 5 min, Range: 0 through 60 min
Time constant short P9 Number type: Whole number, Unit: Minutes, Default: 75 min, Range: 0 through 2880 min
Dead time long P10 Number type: Whole number, Unit: Minutes Default: 5 min, Range: 0 through 60 min
Time constant long P11 Number type: Whole number, Unit: Minutes Default: 150 min, Range: 0 through 2880 min
Building model adaption P12 Number type: Whole number, Unit: None Default: 1, Range: 0 through 2, (0 = disabled; 1 = enabled, 2 = restart)
Room control P-band P13 Number type: Decimal, Unit: %/K Default: 10.0 K; Range: >=0
Integral action time P14 Number type: Decimal, Unit: Seconds
Default: 300.0 s, Range: >= 0 Maximum flow temperature P15 Number type: Decimal, Unit: Degrees Celsius
Default: 80.0 °C, Range: 0 through 150.0 °C Heating curve curvature P16 Number type: Decimal, Unit: none
Default: 1.33, Range: 0 through 2.0 Heating curve slope P17 Number type: Decimal, Unit: none
Default: 1.6, Range: 0 through 4.5
Max. heating curve slope for adaptation (with room sensor) P18 Number type: Decimal, Unit: none
Default: 4.5, Range: 0.4 through 4,5
Heating curve adaptation mode P19 Number type: Decimal, Unit: none
Default: 2, Range: 0 through 4; (0 = disabled; 1 = enabled, 2 = restart; 3 = adaptation refreshed new start; 4 = direct RMT compensation
Occupied/ unoccupied changeover P20 Number type: Decimal, Unit: Degree Celsius
Default: 16 °C, Range: 0 through 30 °C
Frost protection limit P21 Number type: Decimal, Unit: Degree Celsius
Default: 2 °C, Range: 0 through 15 °C
Boost factor P22 Number type: Decimal, Unit: none
Default: 1, Range: 0 through 30
Room temperature multiplier P23 Number type: Decimal, Unit: Degree Celsius
Default: 4 °C, Range: 0 through 50
Minimum room temperature P24 Number type: Decimal, Unit: Degree Celsius
Default: 13 °C, Range: 0 through 30 °C
Differential minimum room temperature P25 Number type: Decimal, Unit: Kelvin
Default: 2 K, Range: 0 through 10 K

CONTROL ICONS ALPHABETIC REFERENCE
167 EN2Z-0940GE51 R0518
Parameter Number Descriptions P1 Minimum preheat time P2 Maximum preheat time P3 No room sensor compensation P4 Minimum outdoor temperature for early setback P5 Preheat time for 0°C P6 Optimum stop factor P7 Room comfort zone optimum stop P8 Dead time short P9 Time constant short P10 Dead time long P11 Time constant long P12 Building model adaption enable 0 = disable 1 = enable 2 = restart P13 Room control P-band P14 Room control integral action time P15 Maximum supply water temperature P16 Heating curve curvature P17 Heating curve slope P18 Heating curve maximum slope P19 Heating curve adaption mode 0 = disable 1 = enable 2 = new start 3 = refresh new start (outdoor temperature dependent) 4 = direct room temperature compensation P20 Occupied/ unoccupied changeover P21 Frost protection limit P22 Boost factor P23 Room temperature compensation P24 Minimum room temperature P25 Minimum room temperature hysteresis Occupied/ Un-occupied Period With the parameter P20 occupied / un-occupied changeover, you can decide
whether you want to run the heating circuit with night setback or with total cool-down. If the room temperature setpoint is higher or equal than P20, the flow temperature is controlled by the room temperature setpoint using the heating curve; otherwise it is set to 0. TSup = Heating Curve Setpoint + P23*FADAPT*(TSet +/- Toff(CPA) - TRm) Heating Curve Setpoint = HC (TSet +/- Toff (CPA), TOat, P15, P16) TSup = 0, for total cool down FADAPT = 1; if P19 = [4] FADAPT = 0; if P19 = [0;1;2;3] Total cool-down is possible only if one of the following conditions is true: 1. No room temperature connected.
There is total cool-down if the filtered outside air temperature is above the limit frost protection P20. Below the outside air temperature limit frost protection, normal outside air temperature compensated control with night set-back will be performed. For total cool-down the room temperature setpoint has to be lower than the setting P20.
2. A room temperature sensor is configured.
With a room temperature sensor, the heating circuit will always be switched off during un-occupied periods. If the room temperature falls below the room temperature setpoint defined by the time schedule, minimum room temperature protection will be performed (see section "Minimum Room Temperature Protection").
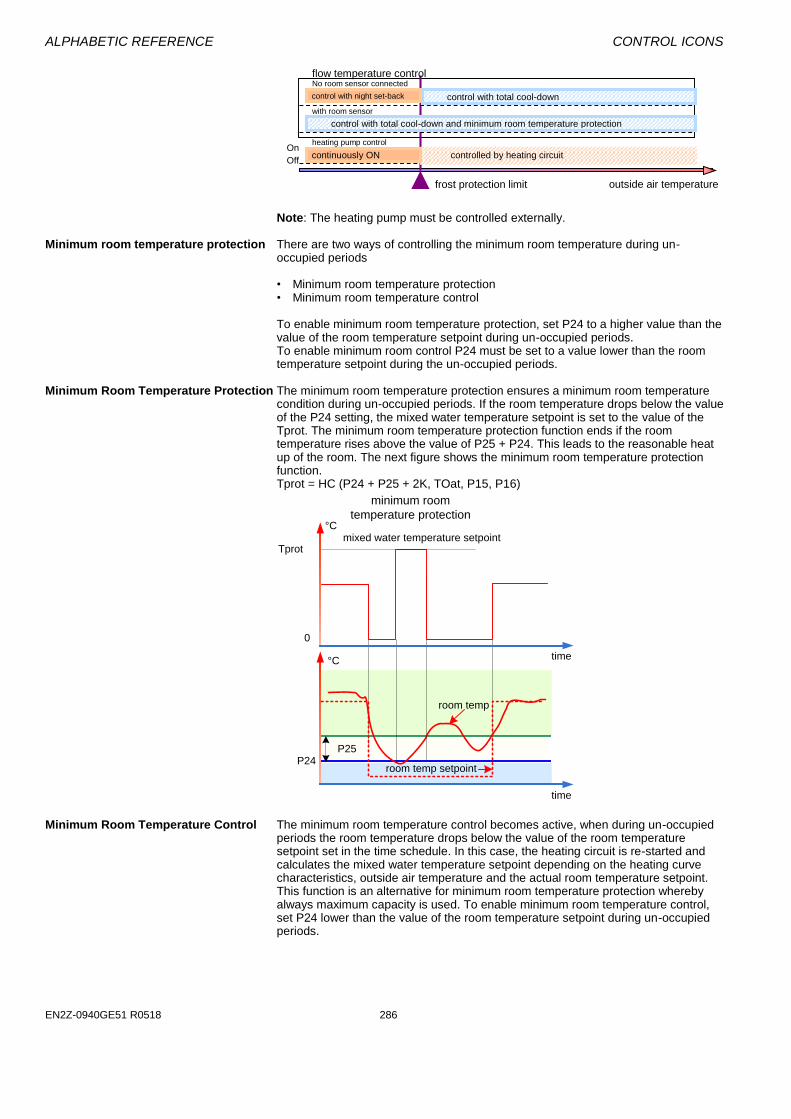
ALPHABETIC REFERENCE CONTROL ICONS
EN2Z-0940GE51 R0518 286
Note: The heating pump must be controlled externally.
Minimum room temperature protection There are two ways of controlling the minimum room temperature during un-occupied periods • Minimum room temperature protection • Minimum room temperature control To enable minimum room temperature protection, set P24 to a higher value than the value of the room temperature setpoint during un-occupied periods. To enable minimum room control P24 must be set to a value lower than the room temperature setpoint during the un-occupied periods.
Minimum Room Temperature Protection The minimum room temperature protection ensures a minimum room temperature condition during un-occupied periods. If the room temperature drops below the value of the P24 setting, the mixed water temperature setpoint is set to the value of the Tprot. The minimum room temperature protection function ends if the room temperature rises above the value of P25 + P24. This leads to the reasonable heat up of the room. The next figure shows the minimum room temperature protection function. Tprot = HC (P24 + P25 + 2K, TOat, P15, P16)
Minimum Room Temperature Control The minimum room temperature control becomes active, when during un-occupied periods the room temperature drops below the value of the room temperature setpoint set in the time schedule. In this case, the heating circuit is re-started and calculates the mixed water temperature setpoint depending on the heating curve characteristics, outside air temperature and the actual room temperature setpoint. This function is an alternative for minimum room temperature protection whereby always maximum capacity is used. To enable minimum room temperature control, set P24 lower than the value of the room temperature setpoint during un-occupied periods.
P24P25
Tprot
0
°C
°C
minimum room
temperature protection
mixed water temperature setpoint
room temp setpoint
time
time
room temp
On
outside air temperature
Off controlled by heating circuit continuously ON
control with total cool-down and minimum room temperature protection
control with total cool-down
control with night set-back
heating pump control
frost protection limit
No room sensor connected
with room sensor
flow temperature control

CONTROL ICONS ALPHABETIC REFERENCE
169 EN2Z-0940GE51 R0518
EOH Operating Procedures EOH3 calculates the flow temperature setpoint with or without optimization as a
function of the room temperature setpoint TSet, the outside air temperature TOat, the heating curve parameters curvature and slope. Heating Curve Setpoint = HC(TSet, TOat, P16, P17) During total cool-down (see previous section), the flow temperature setpoint can be set to “0”. Optimum Start can happen only if all the following conditions are true: • The "EOH / EOV Optimisation" check box of the datapoint connected to the input
TSet is checked (usually an Analog Value) • The input OptEn has one of the values, 2 or 4 • The next room temperature setpoint changes from a lower to a higher value (Tset
> Tset next) with a difference of at least 1K • If you want to disable optimum start only for a few switching points, you can do it
by setting the input OptimEn Optimum Stop can happen only if all the following conditions are true: • The "EOH / EOV Optimisation" check box of the datapoint connected to the input
TSet is checked (usually an Analog Value) • The input OptEn has one of the values, 3 or 4 • The next room temperature setpoint changes from a higher to a lower value (Tset
< Tset next) with a difference of at least 1K • If you want to disable optimum stop only for a few switching points, you can do it
by setting the input OptimEN
Heating Optimization WITHOUT Room Sensor The supply water temperature set TSup is calculated using te heating curve equation. The room temperature setpoint is equal to the required TSet (next occupied switch point) + P3 (no room temperature compensation).
°C
°C
P25
minimum room
temperature control
P24
mixed water temperature setpoint
night setback
room temp setpoint
time
time
room temp
pre
he
atin
g
occupied/
un-occupied
changeover
P20
time
room temperature setpoint[°C]
optimum
stop
optimum
stop
optimum start
optimum
start
normal
operation
room
control
total cool-down
above frost limit
setback
operation
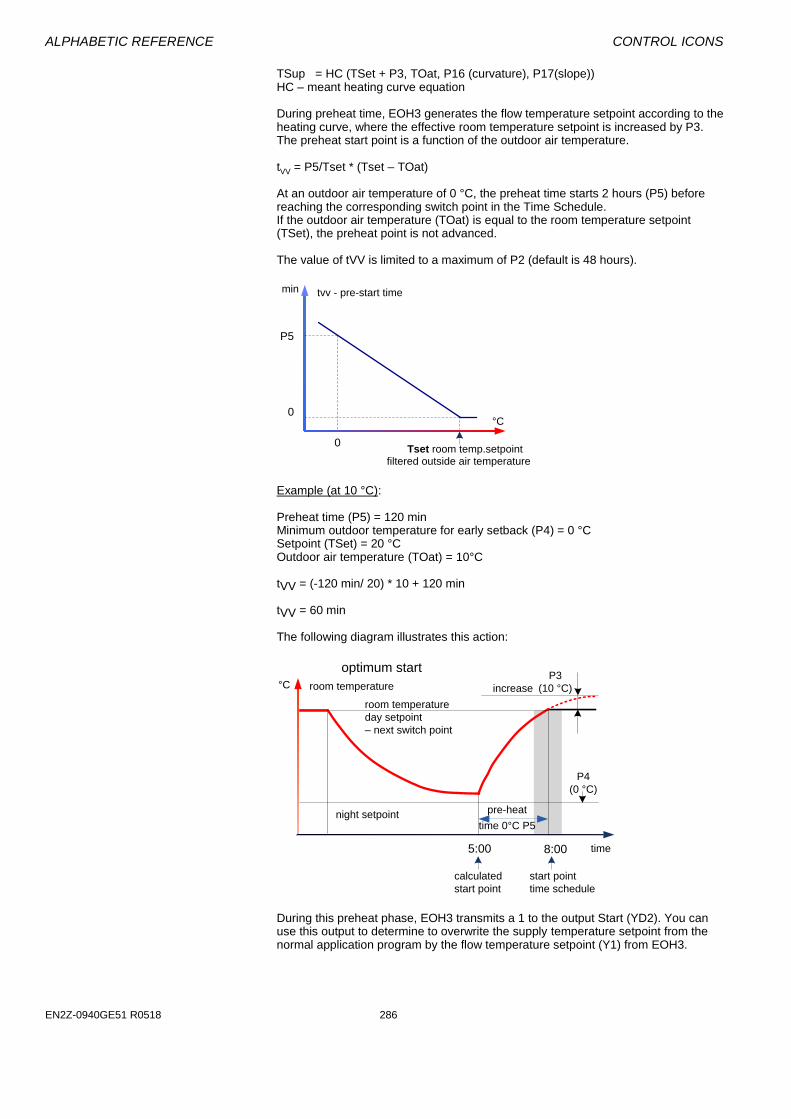
ALPHABETIC REFERENCE CONTROL ICONS
EN2Z-0940GE51 R0518 286
TSup = HC (TSet + P3, TOat, P16 (curvature), P17(slope)) HC – meant heating curve equation During preheat time, EOH3 generates the flow temperature setpoint according to the heating curve, where the effective room temperature setpoint is increased by P3. The preheat start point is a function of the outdoor air temperature. tVV = P5/Tset * (Tset – TOat) At an outdoor air temperature of 0 °C, the preheat time starts 2 hours (P5) before reaching the corresponding switch point in the Time Schedule. If the outdoor air temperature (TOat) is equal to the room temperature setpoint (TSet), the preheat point is not advanced. The value of tVV is limited to a maximum of P2 (default is 48 hours).
Example (at 10 °C): Preheat time (P5) = 120 min Minimum outdoor temperature for early setback (P4) = 0 °C Setpoint (TSet) = 20 °C Outdoor air temperature (TOat) = 10°C tVV = (-120 min/ 20) * 10 + 120 min tVV = 60 min The following diagram illustrates this action:
During this preheat phase, EOH3 transmits a 1 to the output Start (YD2). You can use this output to determine to overwrite the supply temperature setpoint from the normal application program by the flow temperature setpoint (Y1) from EOH3.
P5
0
0
°C
Tset room temp.setpoint
tvv - pre-start time
filtered outside air temperature
min
8:00
5:00
room temperature
day setpoint
– next switch point
night setpoint
increase
calculated
start point
start point
time schedule
optimum start
time
pre-heat
time 0°C P5
room temperature°C
P4
(0 °C)
P3
(10 °C)
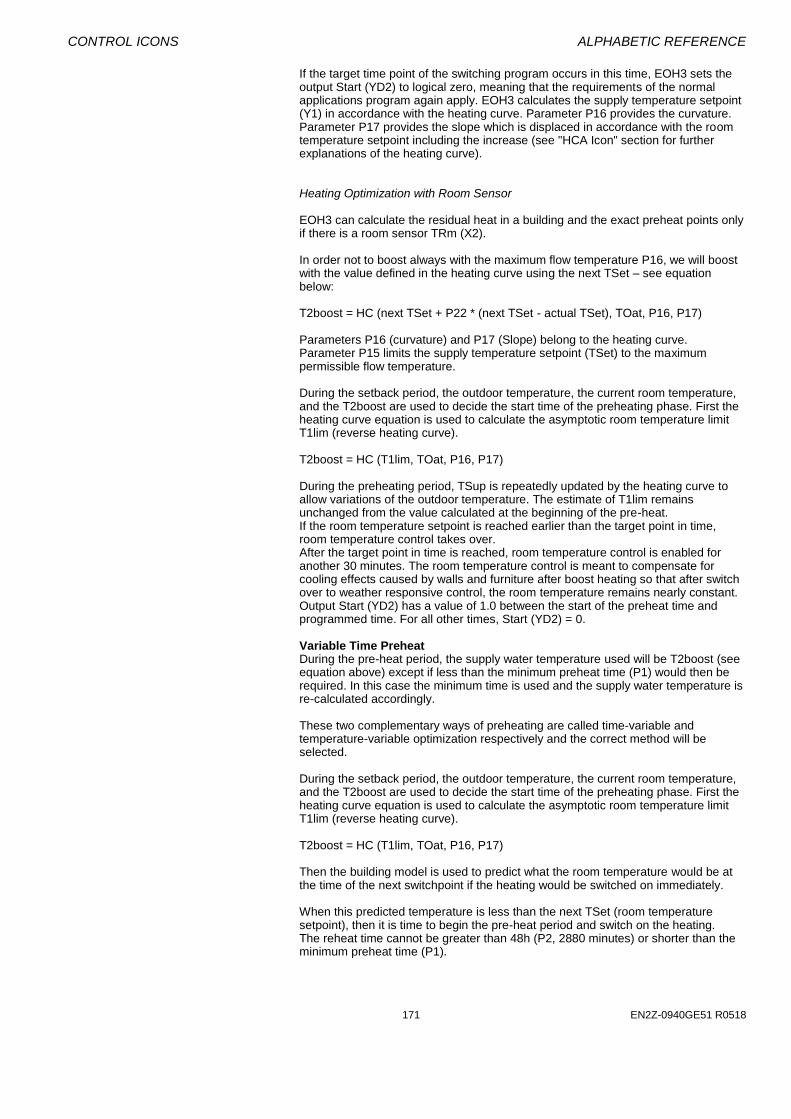
CONTROL ICONS ALPHABETIC REFERENCE
171 EN2Z-0940GE51 R0518
If the target time point of the switching program occurs in this time, EOH3 sets the output Start (YD2) to logical zero, meaning that the requirements of the normal applications program again apply. EOH3 calculates the supply temperature setpoint (Y1) in accordance with the heating curve. Parameter P16 provides the curvature. Parameter P17 provides the slope which is displaced in accordance with the room temperature setpoint including the increase (see "HCA Icon" section for further explanations of the heating curve). Heating Optimization with Room Sensor EOH3 can calculate the residual heat in a building and the exact preheat points only if there is a room sensor TRm (X2). In order not to boost always with the maximum flow temperature P16, we will boost with the value defined in the heating curve using the next TSet – see equation below: T2boost = HC (next TSet + P22 * (next TSet - actual TSet), TOat, P16, P17) Parameters P16 (curvature) and P17 (Slope) belong to the heating curve. Parameter P15 limits the supply temperature setpoint (TSet) to the maximum permissible flow temperature. During the setback period, the outdoor temperature, the current room temperature, and the T2boost are used to decide the start time of the preheating phase. First the heating curve equation is used to calculate the asymptotic room temperature limit T1lim (reverse heating curve). T2boost = HC (T1lim, TOat, P16, P17) During the preheating period, TSup is repeatedly updated by the heating curve to allow variations of the outdoor temperature. The estimate of T1lim remains unchanged from the value calculated at the beginning of the pre-heat. If the room temperature setpoint is reached earlier than the target point in time, room temperature control takes over. After the target point in time is reached, room temperature control is enabled for another 30 minutes. The room temperature control is meant to compensate for cooling effects caused by walls and furniture after boost heating so that after switch over to weather responsive control, the room temperature remains nearly constant. Output Start (YD2) has a value of 1.0 between the start of the preheat time and programmed time. For all other times, Start (YD2) = 0. Variable Time Preheat During the pre-heat period, the supply water temperature used will be T2boost (see equation above) except if less than the minimum preheat time (P1) would then be required. In this case the minimum time is used and the supply water temperature is re-calculated accordingly. These two complementary ways of preheating are called time-variable and temperature-variable optimization respectively and the correct method will be selected. During the setback period, the outdoor temperature, the current room temperature, and the T2boost are used to decide the start time of the preheating phase. First the heating curve equation is used to calculate the asymptotic room temperature limit T1lim (reverse heating curve). T2boost = HC (T1lim, TOat, P16, P17) Then the building model is used to predict what the room temperature would be at the time of the next switchpoint if the heating would be switched on immediately. When this predicted temperature is less than the next TSet (room temperature setpoint), then it is time to begin the pre-heat period and switch on the heating. The reheat time cannot be greater than 48h (P2, 2880 minutes) or shorter than the minimum preheat time (P1).
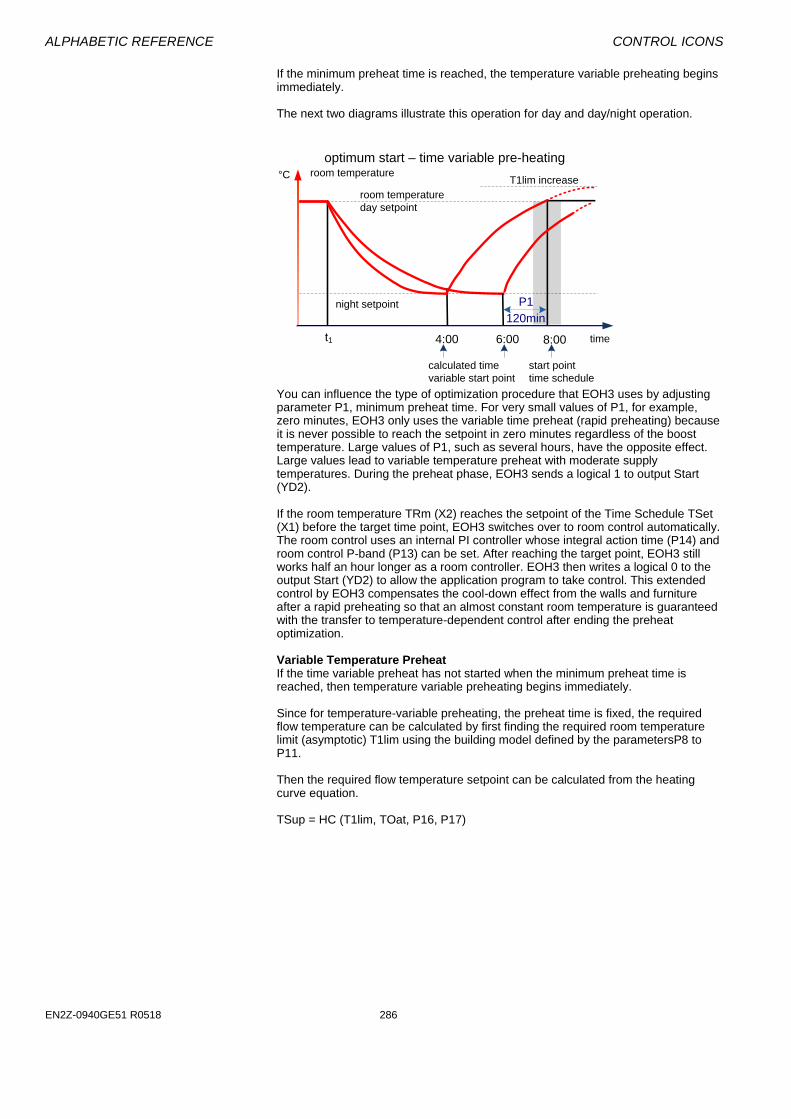
ALPHABETIC REFERENCE CONTROL ICONS
EN2Z-0940GE51 R0518 286
If the minimum preheat time is reached, the temperature variable preheating begins immediately. The next two diagrams illustrate this operation for day and day/night operation.
You can influence the type of optimization procedure that EOH3 uses by adjusting parameter P1, minimum preheat time. For very small values of P1, for example, zero minutes, EOH3 only uses the variable time preheat (rapid preheating) because it is never possible to reach the setpoint in zero minutes regardless of the boost temperature. Large values of P1, such as several hours, have the opposite effect. Large values lead to variable temperature preheat with moderate supply temperatures. During the preheat phase, EOH3 sends a logical 1 to output Start (YD2). If the room temperature TRm (X2) reaches the setpoint of the Time Schedule TSet (X1) before the target time point, EOH3 switches over to room control automatically. The room control uses an internal PI controller whose integral action time (P14) and room control P-band (P13) can be set. After reaching the target point, EOH3 still works half an hour longer as a room controller. EOH3 then writes a logical 0 to the output Start (YD2) to allow the application program to take control. This extended control by EOH3 compensates the cool-down effect from the walls and furniture after a rapid preheating so that an almost constant room temperature is guaranteed with the transfer to temperature-dependent control after ending the preheat optimization. Variable Temperature Preheat If the time variable preheat has not started when the minimum preheat time is reached, then temperature variable preheating begins immediately. Since for temperature-variable preheating, the preheat time is fixed, the required flow temperature can be calculated by first finding the required room temperature limit (asymptotic) T1lim using the building model defined by the parametersP8 to P11. Then the required flow temperature setpoint can be calculated from the heating curve equation. TSup = HC (T1lim, TOat, P16, P17)
8:00
4:00
6:00
P1
120min
room temperature
day setpoint
night setpoint
calculated time
variable start point
start point
time schedule
optimum start – time variable pre-heating
time
room temperature°C
t1
T1lim increase
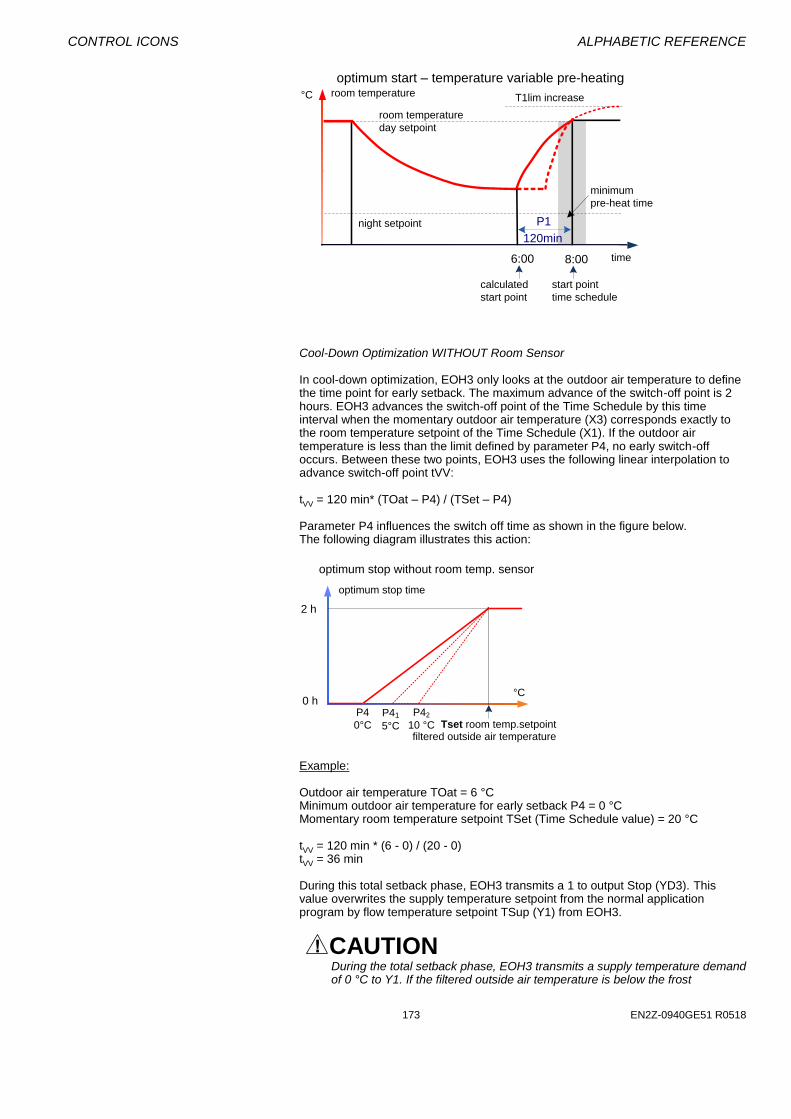
CONTROL ICONS ALPHABETIC REFERENCE
173 EN2Z-0940GE51 R0518
Cool-Down Optimization WITHOUT Room Sensor In cool-down optimization, EOH3 only looks at the outdoor air temperature to define the time point for early setback. The maximum advance of the switch-off point is 2 hours. EOH3 advances the switch-off point of the Time Schedule by this time interval when the momentary outdoor air temperature (X3) corresponds exactly to the room temperature setpoint of the Time Schedule (X1). If the outdoor air temperature is less than the limit defined by parameter P4, no early switch-off occurs. Between these two points, EOH3 uses the following linear interpolation to advance switch-off point tVV: tVV = 120 min* (TOat – P4) / (TSet – P4) Parameter P4 influences the switch off time as shown in the figure below. The following diagram illustrates this action:
Example: Outdoor air temperature TOat = 6 °C Minimum outdoor air temperature for early setback P4 = 0 °C Momentary room temperature setpoint TSet (Time Schedule value) = 20 °C tVV = 120 min * (6 - 0) / (20 - 0) tVV = 36 min During this total setback phase, EOH3 transmits a 1 to output Stop (YD3). This value overwrites the supply temperature setpoint from the normal application program by flow temperature setpoint TSup (Y1) from EOH3.
CAUTION During the total setback phase, EOH3 transmits a supply temperature demand of 0 °C to Y1. If the filtered outside air temperature is below the frost
8:00
6:00
P1
120min
room temperature
day setpoint
night setpoint
T1lim increase
calculated
start point
start point
time schedule
minimum
pre-heat time
time
optimum start – temperature variable pre-heatingroom temperature°C
2 h
0 h
P4
0°C
°C
Tset room temp.setpointfiltered outside air temperature
optimum stop without room temp. sensor
optimum stop time
P41
5°C
P42
10 °C
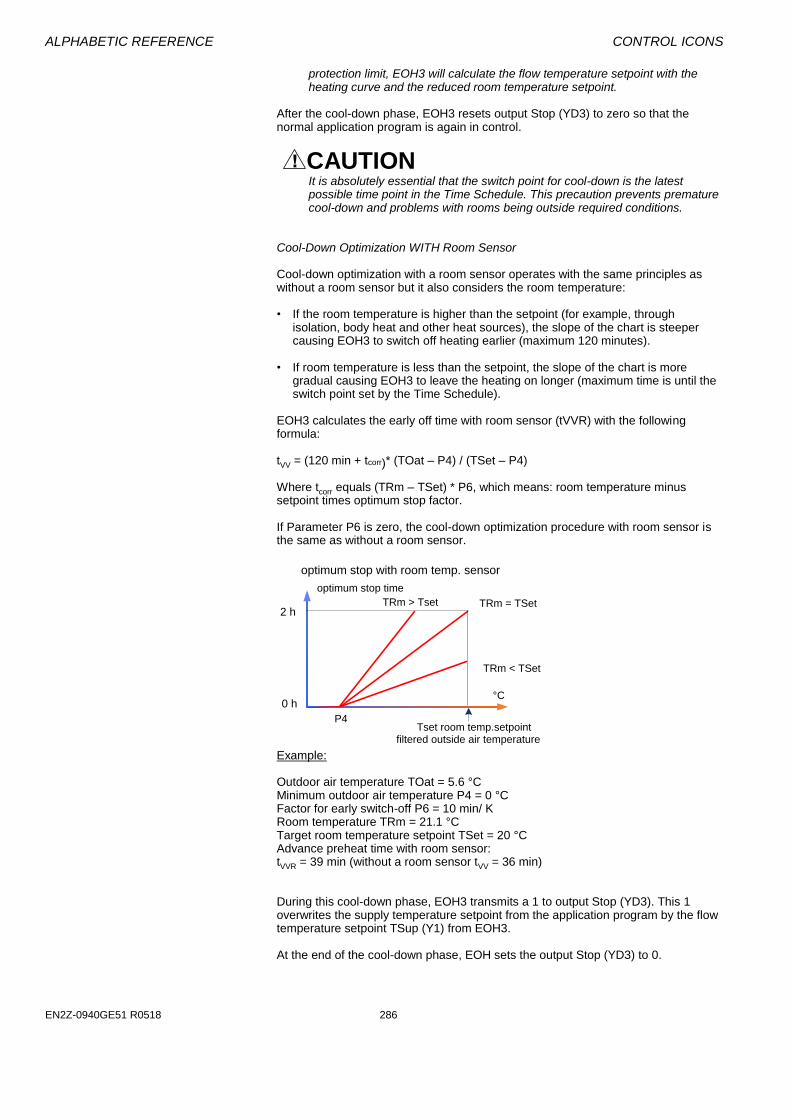
ALPHABETIC REFERENCE CONTROL ICONS
EN2Z-0940GE51 R0518 286
protection limit, EOH3 will calculate the flow temperature setpoint with the heating curve and the reduced room temperature setpoint.
After the cool-down phase, EOH3 resets output Stop (YD3) to zero so that the normal application program is again in control.
CAUTION It is absolutely essential that the switch point for cool-down is the latest possible time point in the Time Schedule. This precaution prevents premature cool-down and problems with rooms being outside required conditions.
Cool-Down Optimization WITH Room Sensor Cool-down optimization with a room sensor operates with the same principles as without a room sensor but it also considers the room temperature: • If the room temperature is higher than the setpoint (for example, through
isolation, body heat and other heat sources), the slope of the chart is steeper causing EOH3 to switch off heating earlier (maximum 120 minutes).
• If room temperature is less than the setpoint, the slope of the chart is more
gradual causing EOH3 to leave the heating on longer (maximum time is until the switch point set by the Time Schedule).
EOH3 calculates the early off time with room sensor (tVVR) with the following formula:
tVV = (120 min + tcorr)* (TOat – P4) / (TSet – P4)
Where tcorr equals (TRm – TSet) * P6, which means: room temperature minus setpoint times optimum stop factor. If Parameter P6 is zero, the cool-down optimization procedure with room sensor is the same as without a room sensor.
Example: Outdoor air temperature TOat = 5.6 °C Minimum outdoor air temperature P4 = 0 °C Factor for early switch-off P6 = 10 min/ K Room temperature TRm = 21.1 °C Target room temperature setpoint TSet = 20 °C Advance preheat time with room sensor: tVVR = 39 min (without a room sensor tVV = 36 min) During this cool-down phase, EOH3 transmits a 1 to output Stop (YD3). This 1 overwrites the supply temperature setpoint from the application program by the flow temperature setpoint TSup (Y1) from EOH3. At the end of the cool-down phase, EOH sets the output Stop (YD3) to 0.
2 h
0 h
°C
TRm > Tset
TRm < TSet
TRm = TSet
Tset room temp.setpointfiltered outside air temperature
optimum stop time
optimum stop with room temp. sensor
P4
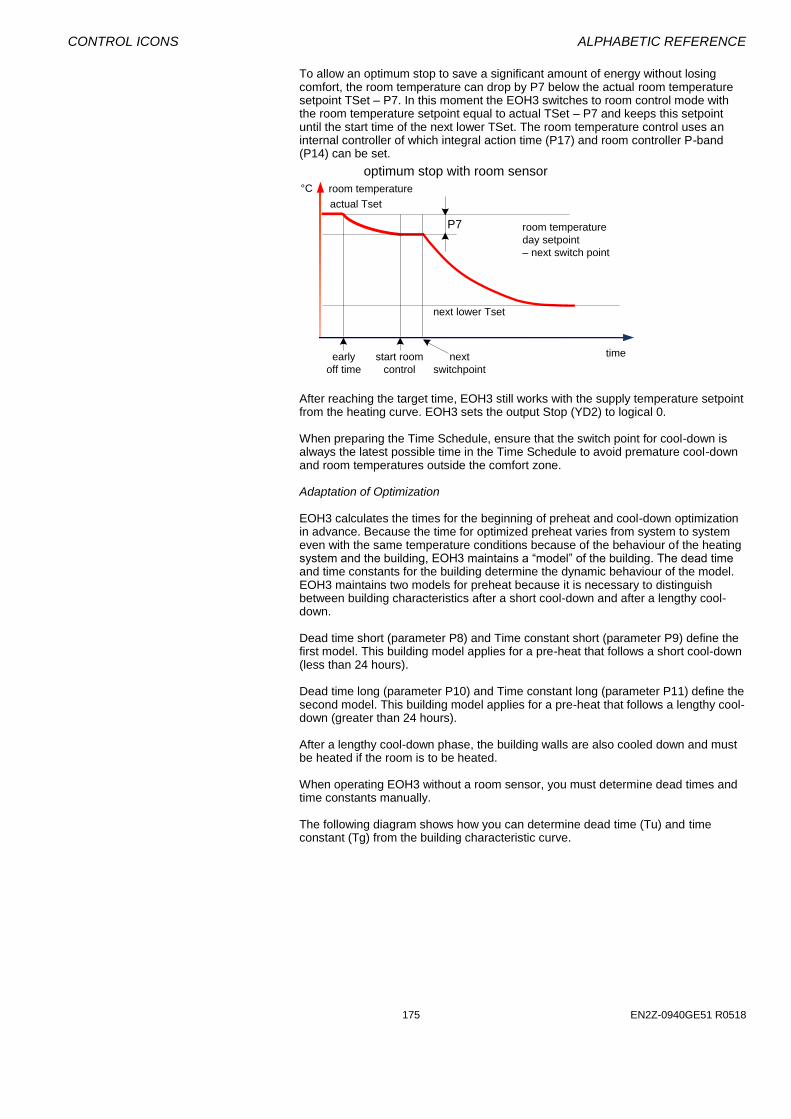
CONTROL ICONS ALPHABETIC REFERENCE
175 EN2Z-0940GE51 R0518
To allow an optimum stop to save a significant amount of energy without losing comfort, the room temperature can drop by P7 below the actual room temperature setpoint TSet – P7. In this moment the EOH3 switches to room control mode with the room temperature setpoint equal to actual TSet – P7 and keeps this setpoint until the start time of the next lower TSet. The room temperature control uses an internal controller of which integral action time (P17) and room controller P-band (P14) can be set.
After reaching the target time, EOH3 still works with the supply temperature setpoint from the heating curve. EOH3 sets the output Stop (YD2) to logical 0. When preparing the Time Schedule, ensure that the switch point for cool-down is always the latest possible time in the Time Schedule to avoid premature cool-down and room temperatures outside the comfort zone. Adaptation of Optimization EOH3 calculates the times for the beginning of preheat and cool-down optimization in advance. Because the time for optimized preheat varies from system to system even with the same temperature conditions because of the behaviour of the heating system and the building, EOH3 maintains a “model” of the building. The dead time and time constants for the building determine the dynamic behaviour of the model. EOH3 maintains two models for preheat because it is necessary to distinguish between building characteristics after a short cool-down and after a lengthy cool-down. Dead time short (parameter P8) and Time constant short (parameter P9) define the first model. This building model applies for a pre-heat that follows a short cool-down (less than 24 hours). Dead time long (parameter P10) and Time constant long (parameter P11) define the second model. This building model applies for a pre-heat that follows a lengthy cool-down (greater than 24 hours). After a lengthy cool-down phase, the building walls are also cooled down and must be heated if the room is to be heated. When operating EOH3 without a room sensor, you must determine dead times and time constants manually. The following diagram shows how you can determine dead time (Tu) and time constant (Tg) from the building characteristic curve.
room temperature
day setpoint
– next switch point
next lower Tset
optimum stop with room sensor
time
room temperature°C
early
off time
P7
actual Tset
start room
control
next
switchpoint
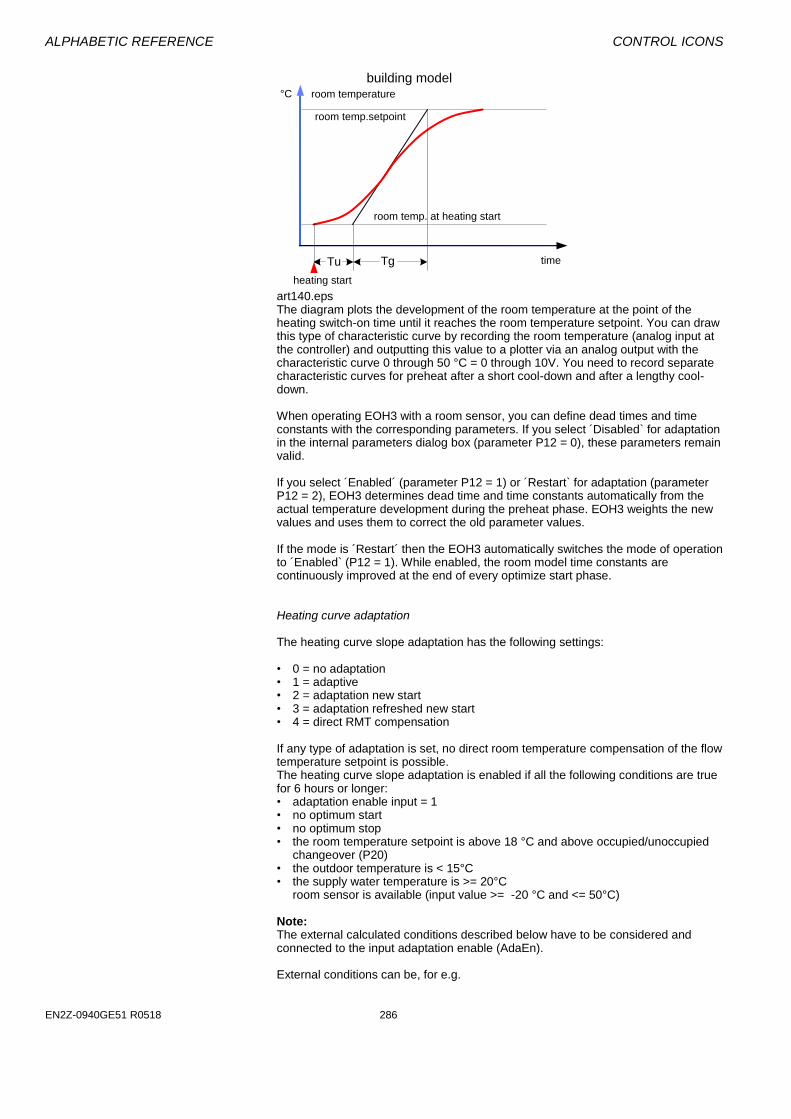
ALPHABETIC REFERENCE CONTROL ICONS
EN2Z-0940GE51 R0518 286
art140.eps The diagram plots the development of the room temperature at the point of the heating switch-on time until it reaches the room temperature setpoint. You can draw this type of characteristic curve by recording the room temperature (analog input at the controller) and outputting this value to a plotter via an analog output with the characteristic curve 0 through 50 °C = 0 through 10V. You need to record separate characteristic curves for preheat after a short cool-down and after a lengthy cool-down. When operating EOH3 with a room sensor, you can define dead times and time constants with the corresponding parameters. If you select ´Disabled` for adaptation in the internal parameters dialog box (parameter P12 = 0), these parameters remain valid. If you select ´Enabled´ (parameter P12 = 1) or ´Restart` for adaptation (parameter P12 = 2), EOH3 determines dead time and time constants automatically from the actual temperature development during the preheat phase. EOH3 weights the new values and uses them to correct the old parameter values. If the mode is ´Restart´ then the EOH3 automatically switches the mode of operation to ´Enabled` (P12 = 1). While enabled, the room model time constants are continuously improved at the end of every optimize start phase. Heating curve adaptation The heating curve slope adaptation has the following settings: • 0 = no adaptation • 1 = adaptive • 2 = adaptation new start • 3 = adaptation refreshed new start • 4 = direct RMT compensation If any type of adaptation is set, no direct room temperature compensation of the flow temperature setpoint is possible. The heating curve slope adaptation is enabled if all the following conditions are true for 6 hours or longer: • adaptation enable input = 1 • no optimum start • no optimum stop • the room temperature setpoint is above 18 °C and above occupied/unoccupied
changeover (P20) • the outdoor temperature is < 15°C • the supply water temperature is >= 20°C room sensor is available (input value >= -20 °C and <= 50°C) Note: The external calculated conditions described below have to be considered and connected to the input adaptation enable (AdaEn). External conditions can be, for e.g.
Tu Tg
time
building model
room temp.setpoint
room temp. at heating start
heating start
°C room temperature
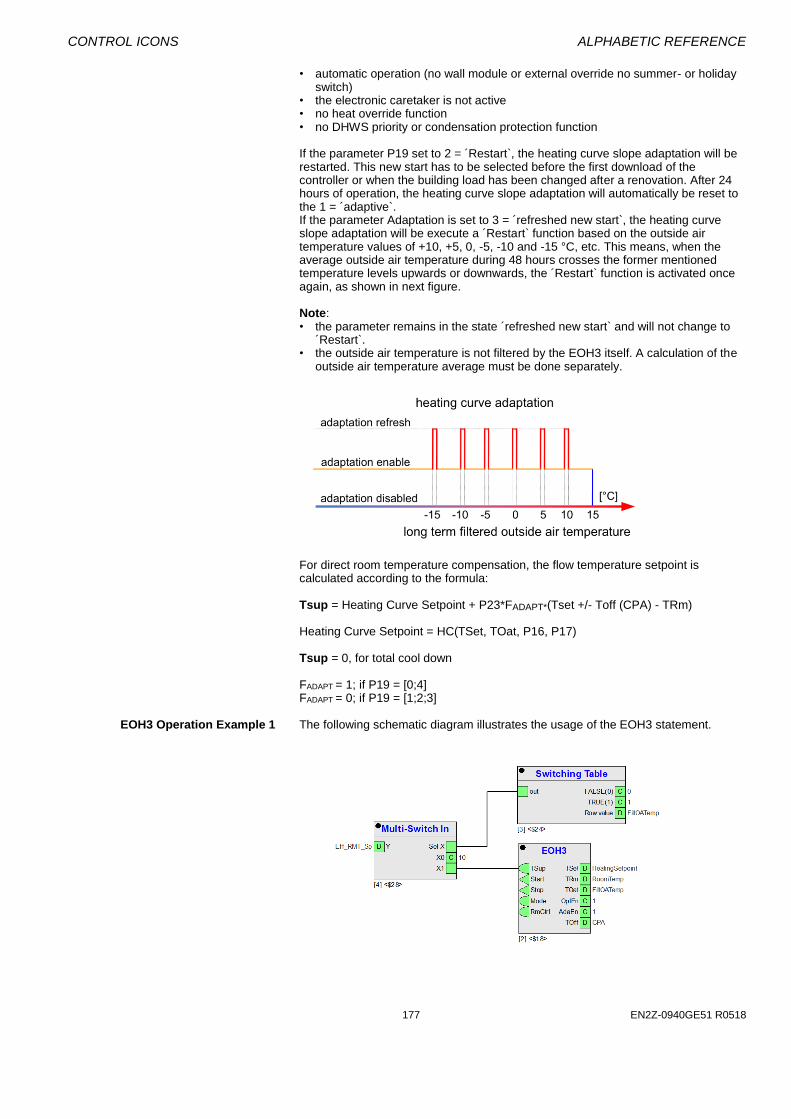
CONTROL ICONS ALPHABETIC REFERENCE
177 EN2Z-0940GE51 R0518
• automatic operation (no wall module or external override no summer- or holiday switch)
• the electronic caretaker is not active • no heat override function • no DHWS priority or condensation protection function If the parameter P19 set to 2 = ´Restart`, the heating curve slope adaptation will be restarted. This new start has to be selected before the first download of the controller or when the building load has been changed after a renovation. After 24 hours of operation, the heating curve slope adaptation will automatically be reset to the 1 = ´adaptive`. If the parameter Adaptation is set to 3 = ´refreshed new start`, the heating curve slope adaptation will be execute a ´Restart` function based on the outside air temperature values of +10, +5, 0, -5, -10 and -15 °C, etc. This means, when the average outside air temperature during 48 hours crosses the former mentioned temperature levels upwards or downwards, the ´Restart` function is activated once again, as shown in next figure. Note: • the parameter remains in the state ´refreshed new start` and will not change to
´Restart`. • the outside air temperature is not filtered by the EOH3 itself. A calculation of the
outside air temperature average must be done separately.
For direct room temperature compensation, the flow temperature setpoint is calculated according to the formula: Tsup = Heating Curve Setpoint + P23*FADAPT*(Tset +/- Toff (CPA) - TRm) Heating Curve Setpoint = HC(TSet, TOat, P16, P17) Tsup = 0, for total cool down FADAPT = 1; if P19 = [0;4] FADAPT = 0; if P19 = [1;2;3]
EOH3 Operation Example 1 The following schematic diagram illustrates the usage of the EOH3 statement.
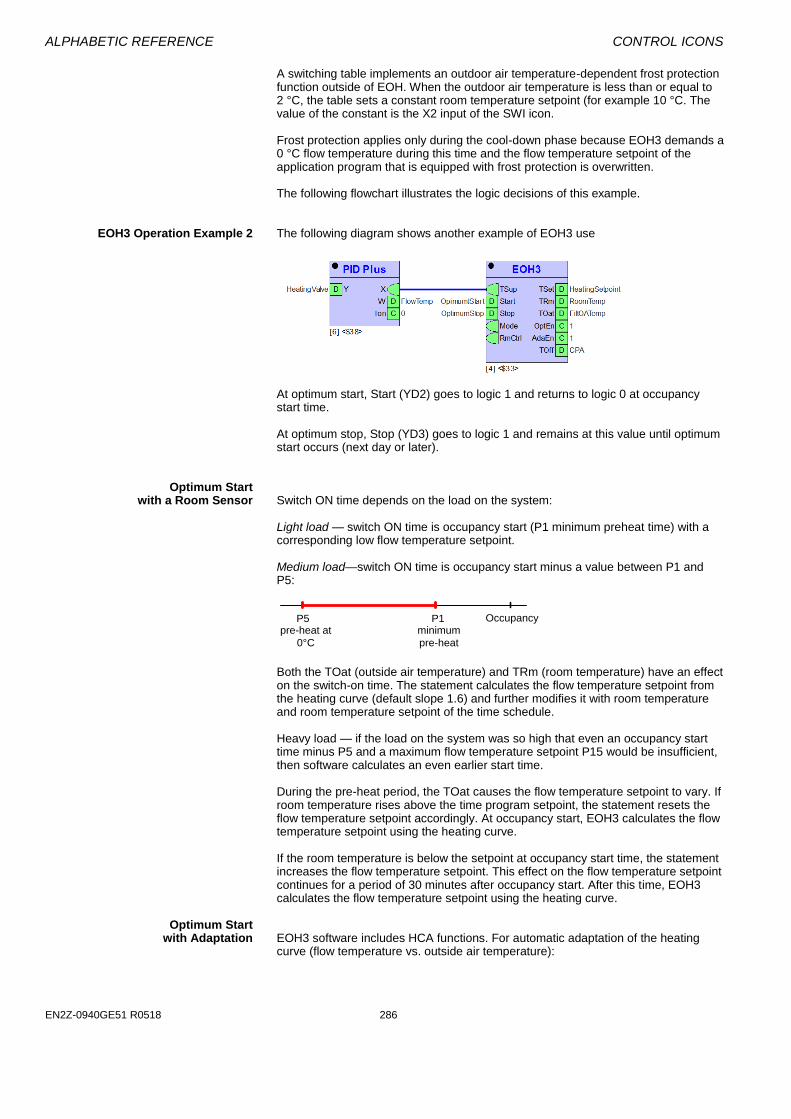
ALPHABETIC REFERENCE CONTROL ICONS
EN2Z-0940GE51 R0518 286
A switching table implements an outdoor air temperature-dependent frost protection function outside of EOH. When the outdoor air temperature is less than or equal to 2 °C, the table sets a constant room temperature setpoint (for example 10 °C. The value of the constant is the X2 input of the SWI icon. Frost protection applies only during the cool-down phase because EOH3 demands a 0 °C flow temperature during this time and the flow temperature setpoint of the application program that is equipped with frost protection is overwritten. The following flowchart illustrates the logic decisions of this example.
EOH3 Operation Example 2 The following diagram shows another example of EOH3 use
At optimum start, Start (YD2) goes to logic 1 and returns to logic 0 at occupancy start time. At optimum stop, Stop (YD3) goes to logic 1 and remains at this value until optimum start occurs (next day or later).
Optimum Start with a Room Sensor Switch ON time depends on the load on the system:
Light load — switch ON time is occupancy start (P1 minimum preheat time) with a corresponding low flow temperature setpoint. Medium load—switch ON time is occupancy start minus a value between P1 and P5:
Both the TOat (outside air temperature) and TRm (room temperature) have an effect on the switch-on time. The statement calculates the flow temperature setpoint from the heating curve (default slope 1.6) and further modifies it with room temperature and room temperature setpoint of the time schedule. Heavy load — if the load on the system was so high that even an occupancy start time minus P5 and a maximum flow temperature setpoint P15 would be insufficient, then software calculates an even earlier start time. During the pre-heat period, the TOat causes the flow temperature setpoint to vary. If room temperature rises above the time program setpoint, the statement resets the flow temperature setpoint accordingly. At occupancy start, EOH3 calculates the flow temperature setpoint using the heating curve. If the room temperature is below the setpoint at occupancy start time, the statement increases the flow temperature setpoint. This effect on the flow temperature setpoint continues for a period of 30 minutes after occupancy start. After this time, EOH3 calculates the flow temperature setpoint using the heating curve.
Optimum Start with Adaptation EOH3 software includes HCA functions. For automatic adaptation of the heating
curve (flow temperature vs. outside air temperature):
P1P5 Occupancyminimum
pre-heat
pre-heat at
0°C

CONTROL ICONS ALPHABETIC REFERENCE
179 EN2Z-0940GE51 R0518
• Connect a room temperature sensor • Set the room temperature setpoint greater than 18 °C • Enable adaptation (P12 = 1) • Ensure the following conditions: - Average TOat must be less than 15°C - Adaptation must occur at least three times before you can alter the defaults for
the basic setting of the heating curve At the calculated stop time, the statement resets the flow temperature setpoint to zero and changes the digital output Start (YD2) to logic 1. Start (YD2) remains at logic 1 until optimum start (next day or later).
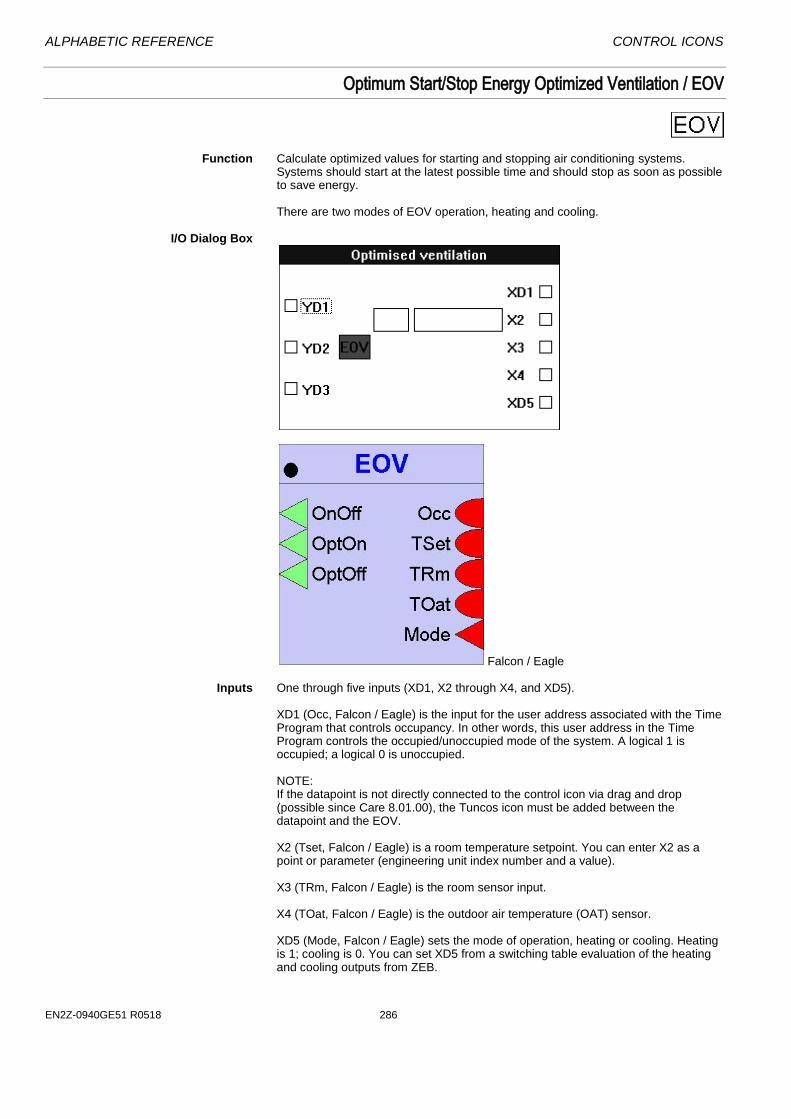
ALPHABETIC REFERENCE CONTROL ICONS
EN2Z-0940GE51 R0518 286
Optimum Start/Stop Energy Optimized Ventilation / EOV
Function Calculate optimized values for starting and stopping air conditioning systems.
Systems should start at the latest possible time and should stop as soon as possible to save energy.
There are two modes of EOV operation, heating and cooling.
I/O Dialog Box
Falcon / Eagle Inputs One through five inputs (XD1, X2 through X4, and XD5).
XD1 (Occ, Falcon / Eagle) is the input for the user address associated with the Time Program that controls occupancy. In other words, this user address in the Time Program controls the occupied/unoccupied mode of the system. A logical 1 is occupied; a logical 0 is unoccupied. NOTE: If the datapoint is not directly connected to the control icon via drag and drop (possible since Care 8.01.00), the Tuncos icon must be added between the datapoint and the EOV. X2 (Tset, Falcon / Eagle) is a room temperature setpoint. You can enter X2 as a point or parameter (engineering unit index number and a value). X3 (TRm, Falcon / Eagle) is the room sensor input. X4 (TOat, Falcon / Eagle) is the outdoor air temperature (OAT) sensor. XD5 (Mode, Falcon / Eagle) sets the mode of operation, heating or cooling. Heating is 1; cooling is 0. You can set XD5 from a switching table evaluation of the heating and cooling outputs from ZEB.
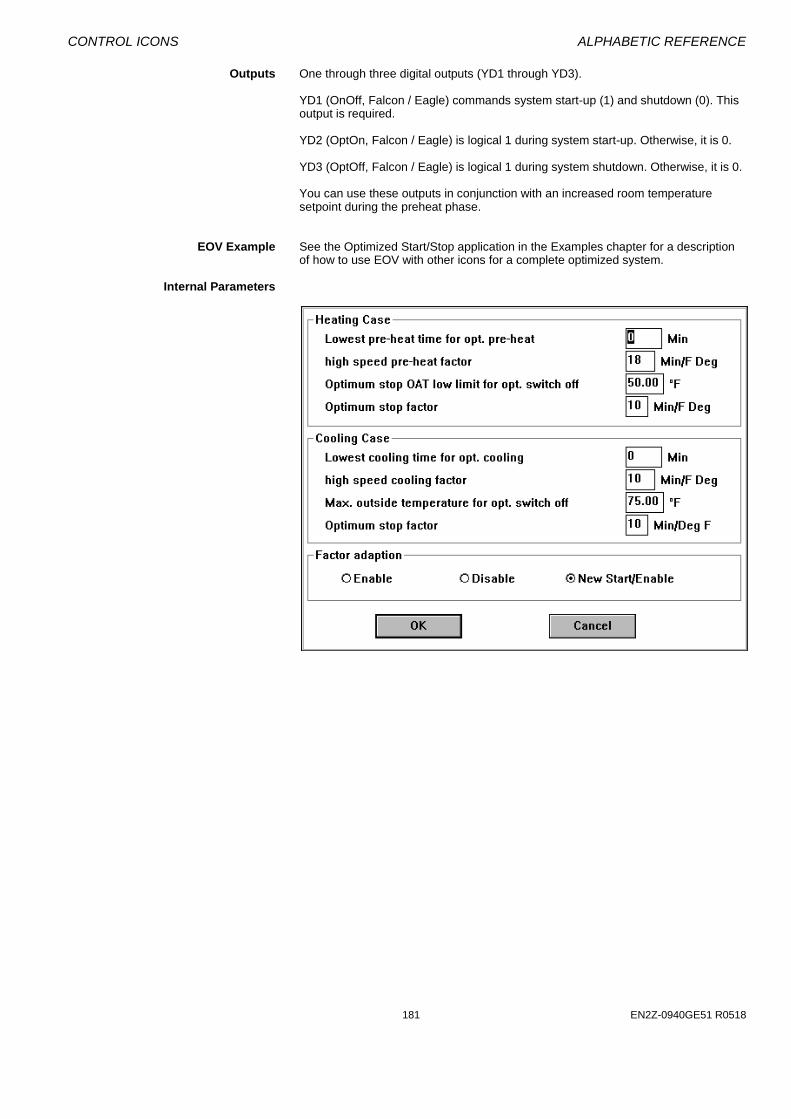
CONTROL ICONS ALPHABETIC REFERENCE
181 EN2Z-0940GE51 R0518
Outputs One through three digital outputs (YD1 through YD3).
YD1 (OnOff, Falcon / Eagle) commands system start-up (1) and shutdown (0). This output is required. YD2 (OptOn, Falcon / Eagle) is logical 1 during system start-up. Otherwise, it is 0. YD3 (OptOff, Falcon / Eagle) is logical 1 during system shutdown. Otherwise, it is 0. You can use these outputs in conjunction with an increased room temperature setpoint during the preheat phase.
EOV Example See the Optimized Start/Stop application in the Examples chapter for a description
of how to use EOV with other icons for a complete optimized system. Internal Parameters
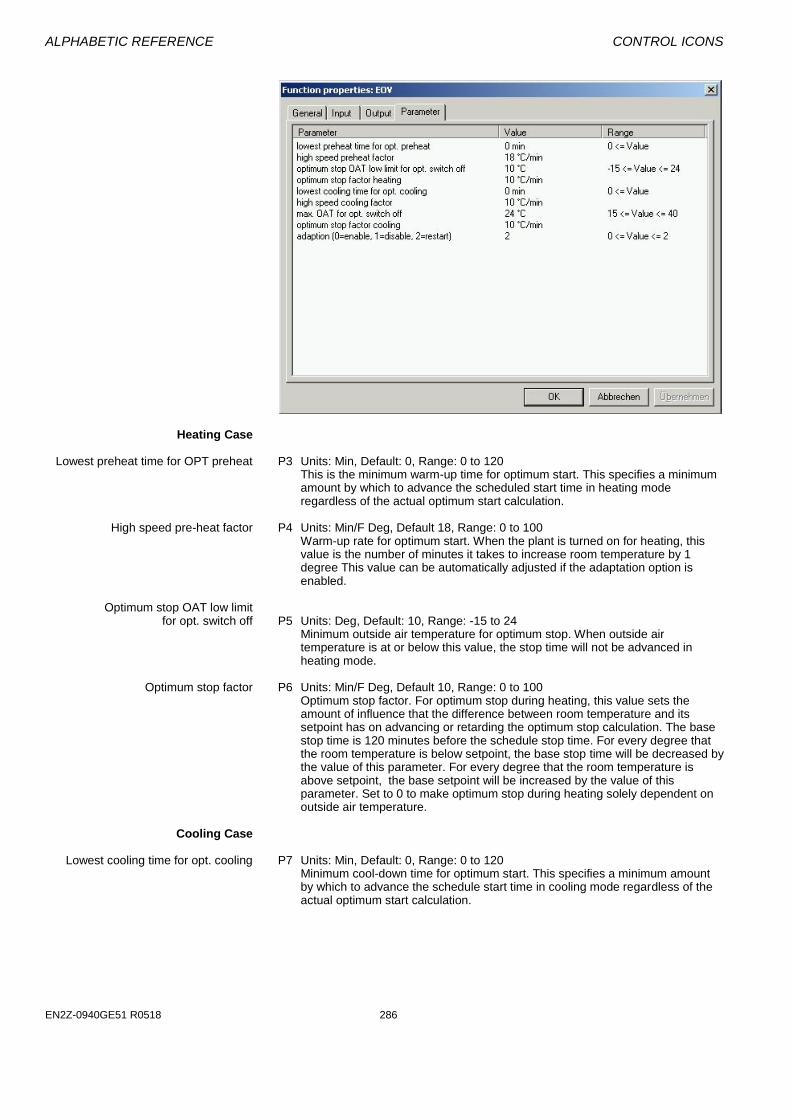
ALPHABETIC REFERENCE CONTROL ICONS
EN2Z-0940GE51 R0518 286
Heating Case Lowest preheat time for OPT preheat P3 Units: Min, Default: 0, Range: 0 to 120
This is the minimum warm-up time for optimum start. This specifies a minimum amount by which to advance the scheduled start time in heating mode regardless of the actual optimum start calculation.
High speed pre-heat factor P4 Units: Min/F Deg, Default 18, Range: 0 to 100
Warm-up rate for optimum start. When the plant is turned on for heating, this value is the number of minutes it takes to increase room temperature by 1 degree This value can be automatically adjusted if the adaptation option is enabled.
Optimum stop OAT low limit for opt. switch off P5 Units: Deg, Default: 10, Range: -15 to 24
Minimum outside air temperature for optimum stop. When outside air temperature is at or below this value, the stop time will not be advanced in heating mode.
Optimum stop factor P6 Units: Min/F Deg, Default 10, Range: 0 to 100
Optimum stop factor. For optimum stop during heating, this value sets the amount of influence that the difference between room temperature and its setpoint has on advancing or retarding the optimum stop calculation. The base stop time is 120 minutes before the schedule stop time. For every degree that the room temperature is below setpoint, the base stop time will be decreased by the value of this parameter. For every degree that the room temperature is above setpoint, the base setpoint will be increased by the value of this parameter. Set to 0 to make optimum stop during heating solely dependent on outside air temperature.
Cooling Case Lowest cooling time for opt. cooling P7 Units: Min, Default: 0, Range: 0 to 120
Minimum cool-down time for optimum start. This specifies a minimum amount by which to advance the schedule start time in cooling mode regardless of the actual optimum start calculation.
CONTROL ICONS ALPHABETIC REFERENCE
183 EN2Z-0940GE51 R0518
High speed cooling factor P8 Units: Min/F Deg, Default: 10, Range: 0 to 100 Cool-down rate for optimum start. When the plant is turned on for cooling, this value is the number of minutes it takes to decrease room temperature by 1 degree This value can be automatically adjusted if the adaptation option is enabled.
Max. outside air temperature for opt.switch off P9 Units: Deg, Default: 24, Range: 15 to 40
Maximum outside air temperature for optimum stop. When outside air temperature is at or above this value,the stop time will not be advanced in cooling mode.
Optimum stop factor P10 Units: Min/F Deg, Default: 10, Range: 0 to 100
Optimum stop factor. For optimum stop during cooling, this value sets the amount of influence that the difference between room temperature and its setpoint has on advancing or retarding the optimum stop calculation. The base stop time is 120 minutes before the schedule stop time. For every degree that the room temperature is above setpoint, the base stop time will be decreased by the value of this parameter. For every degree that the room temperature is below setpoint, the base setpoint will be increased by the value of this parameter. Set to 0 to make optimum stop during cooling solely dependent on outside air temperature.
Factor adaption Factor adaption P11 Adaption (0=enable, 1=disable, 2=restart)
Parameter Number Descriptions P3 Lowest preheat time for optimized preheat P4 High-speed preheat factor (time required for X3 to rise 1K) P5 Optimum stop OAT low limit for optimized shutdown (heating) P6 Optimum stop factor (heating) P7 Lowest cooling time for optimized cooling P8 High-speed cooling factor (time required for X3 to decrease 1K) P9 Maximum OAT for optimized shutdown (cooling) P10 Optimum stop factor (cooling) P11 Factor adaptation (for adapting P4 and P8):
0=enable 1=disable 2=new start/enable (restarts adaptive calculations, which overwrites
previously gathered data and starts adapting P4 and P8 from scratch)
P12 Room temperature setpoint (if X2 is not connected to a user address) EOV Operation EOV works exclusively on the basis of the “test room” method, that is, a room
sensor is required. X3 is the input for the room sensor. In addition, EOV requires a room temperature setpoint (X2 or a parameter input), OAT sensor (X4), and the user address for the Time Program switch point (XD1).
Optimized Start-up in the Heating Mode When the system is in heating mode (XD5=1), EOV displaces point switch-on (start-up) by time (tVHE) to guarantee room temperature setpoint is reached by start-up. The displacement of the switch-on point depends on the difference between the room temperature setpoint and actual room temperature. EOV assumes a linear room model.
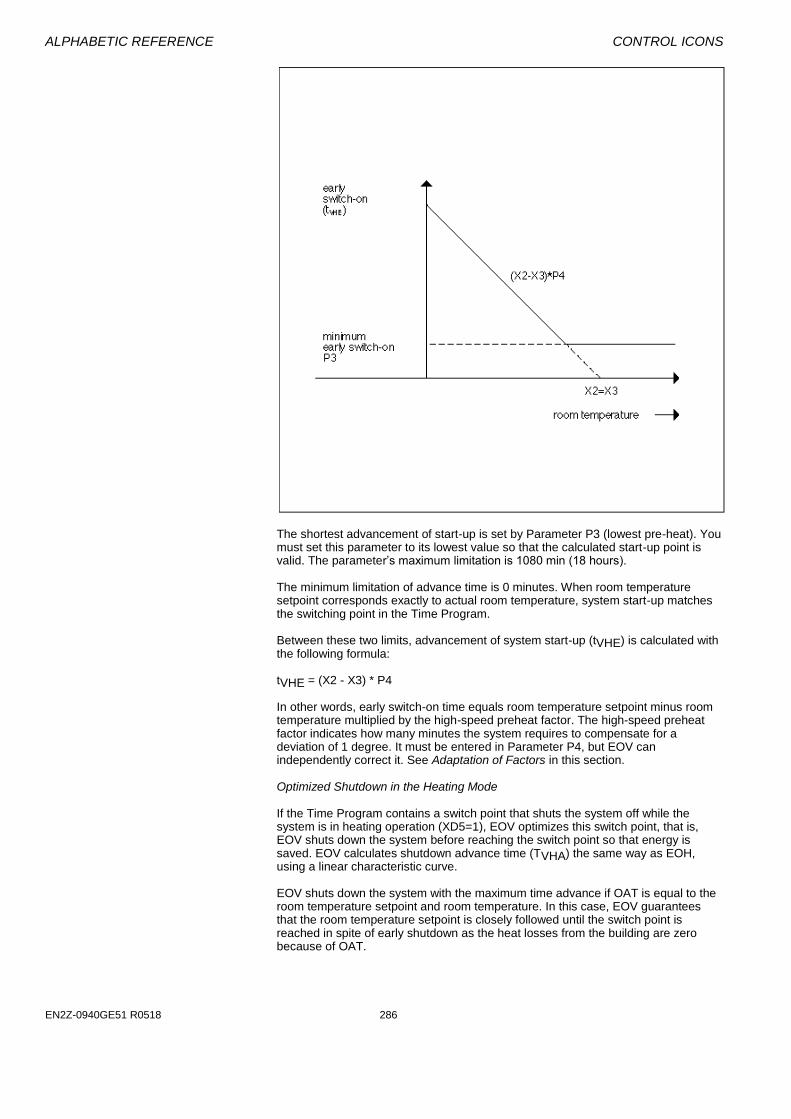
ALPHABETIC REFERENCE CONTROL ICONS
EN2Z-0940GE51 R0518 286
The shortest advancement of start-up is set by Parameter P3 (lowest pre-heat). You must set this parameter to its lowest value so that the calculated start-up point is valid. The parameter’s maximum limitation is 1080 min (18 hours). The minimum limitation of advance time is 0 minutes. When room temperature setpoint corresponds exactly to actual room temperature, system start-up matches the switching point in the Time Program. Between these two limits, advancement of system start-up (tVHE) is calculated with the following formula: tVHE = (X2 - X3) * P4 In other words, early switch-on time equals room temperature setpoint minus room temperature multiplied by the high-speed preheat factor. The high-speed preheat factor indicates how many minutes the system requires to compensate for a deviation of 1 degree. It must be entered in Parameter P4, but EOV can independently correct it. See Adaptation of Factors in this section. Optimized Shutdown in the Heating Mode If the Time Program contains a switch point that shuts the system off while the system is in heating operation (XD5=1), EOV optimizes this switch point, that is, EOV shuts down the system before reaching the switch point so that energy is saved. EOV calculates shutdown advance time (TVHA) the same way as EOH, using a linear characteristic curve. EOV shuts down the system with the maximum time advance if OAT is equal to the room temperature setpoint and room temperature. In this case, EOV guarantees that the room temperature setpoint is closely followed until the switch point is reached in spite of early shutdown as the heat losses from the building are zero because of OAT.

CONTROL ICONS ALPHABETIC REFERENCE
185 EN2Z-0940GE51 R0518
EOV shuts down the system without advance when the actual OAT is less than or equal to the minimum OAT (Parameter P5). Between these limits, EOV calculates advance time (TVHA) as follows:
t VHAX4 - P5
X2 - P5corr= (120 min + t )
Where tcorr = (X3 - X2) * P6 In other words, the correction factor equals room temperature minus setpoint multiplied by the optimum stop factor. The correction factor changes the slope of the previously defined characteristic curve as a function of the control difference: If room temperature equals room temperature setpoint, the characteristic curve remains unchanged. If room temperature is greater than room temperature setpoint, the characteristic curve is steeper and the system is shut down earlier. If room temperature is less than room temperature setpoint, the characteristic curve is less steep and the system is shut down later. The following figure illustrates this relationship.
Parameter P6 (optimum stop factor) weights the influence of the control difference on the characteristic curve. If Parameter P6 is zero, EOV calculates early shutdown based on OAT only. Optimized Start-up in the Cooling Mode When the system is in cooling mode (XD5=0), EOV displaces switch-on point (start-up) by time (tVKE) to guarantee room temperature setpoint is reached by
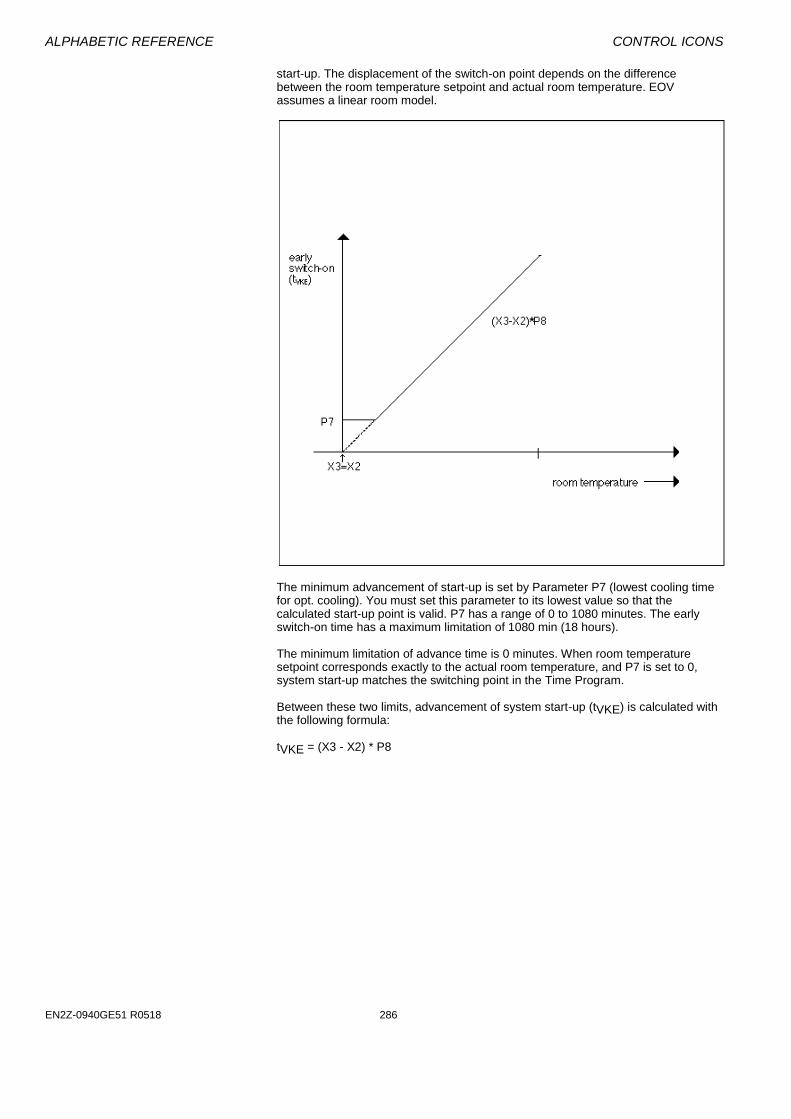
ALPHABETIC REFERENCE CONTROL ICONS
EN2Z-0940GE51 R0518 286
start-up. The displacement of the switch-on point depends on the difference between the room temperature setpoint and actual room temperature. EOV assumes a linear room model.
The minimum advancement of start-up is set by Parameter P7 (lowest cooling time for opt. cooling). You must set this parameter to its lowest value so that the calculated start-up point is valid. P7 has a range of 0 to 1080 minutes. The early switch-on time has a maximum limitation of 1080 min (18 hours). The minimum limitation of advance time is 0 minutes. When room temperature setpoint corresponds exactly to the actual room temperature, and P7 is set to 0, system start-up matches the switching point in the Time Program. Between these two limits, advancement of system start-up (tVKE) is calculated with the following formula: tVKE = (X3 - X2) * P8
CONTROL ICONS ALPHABETIC REFERENCE
187 EN2Z-0940GE51 R0518
In other words, early switch-on time equals room temperature minus room temperature setpoint multiplied by the high-speed cooling factor. The high-speed cooling factor indicates how many minutes the system requires to compensate for a deviation of 1 K. It must be entered in Parameter P8, but EOV can independently correct it. See Adaptation of Factors in this section. Optimized Shutdown in the Cooling Mode If the Time Program contains a switch point that shuts the system off while the system is in cooling operation (XD5=0), EOV optimizes this switch point, that is, EOV shuts down the system before reaching the switch point so that energy is saved. EOV calculates shutdown advance time (TVKA) the same way as EOH, using a linear characteristic curve. EOV shuts down the system with the maximum time advance if OAT is equal to the room temperature setpoint and room temperature. In this case, EOV guarantees that the room temperature setpoint is closely followed until the switch point is reached in spite of early shutdown as the heat losses from the building are zero because of OAT.
EOV shuts down the system without advance when the actual OAT is greater than or equal to the maximum OAT (Parameter P9). Between these limits, EOV calculates advance time (TVKA) as follows:
t VKAX4 - P9
X2 - P9corr= (120 min + t )
Where tcorr = (X2 - X3) * P10 In other words, the correction factor equals setpoint minus room temperature multiplied by the optimum stop factor. The correction factor changes the slope of the previously defined characteristic curve as a function of the control difference: If room temperature equals room temperature setpoint, the characteristic curve remains unchanged. If room temperature is less than room temperature setpoint, the characteristic curve is steeper and the system is shut down earlier. If room temperature is greater than room temperature setpoint, the characteristic curve is less steep and the system is shut down later.
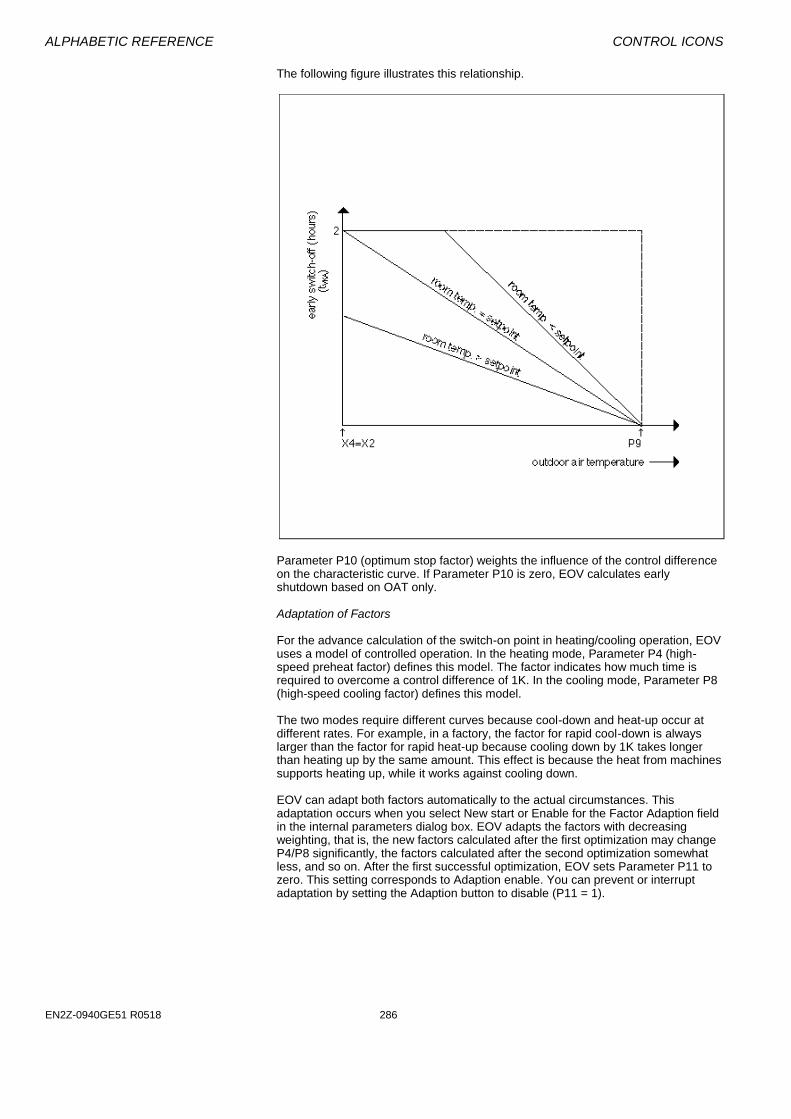
ALPHABETIC REFERENCE CONTROL ICONS
EN2Z-0940GE51 R0518 286
The following figure illustrates this relationship.
Parameter P10 (optimum stop factor) weights the influence of the control difference on the characteristic curve. If Parameter P10 is zero, EOV calculates early shutdown based on OAT only. Adaptation of Factors For the advance calculation of the switch-on point in heating/cooling operation, EOV uses a model of controlled operation. In the heating mode, Parameter P4 (high-speed preheat factor) defines this model. The factor indicates how much time is required to overcome a control difference of 1K. In the cooling mode, Parameter P8 (high-speed cooling factor) defines this model. The two modes require different curves because cool-down and heat-up occur at different rates. For example, in a factory, the factor for rapid cool-down is always larger than the factor for rapid heat-up because cooling down by 1K takes longer than heating up by the same amount. This effect is because the heat from machines supports heating up, while it works against cooling down. EOV can adapt both factors automatically to the actual circumstances. This adaptation occurs when you select New start or Enable for the Factor Adaption field in the internal parameters dialog box. EOV adapts the factors with decreasing weighting, that is, the new factors calculated after the first optimization may change P4/P8 significantly, the factors calculated after the second optimization somewhat less, and so on. After the first successful optimization, EOV sets Parameter P11 to zero. This setting corresponds to Adaption enable. You can prevent or interrupt adaptation by setting the Adaption button to disable (P11 = 1).
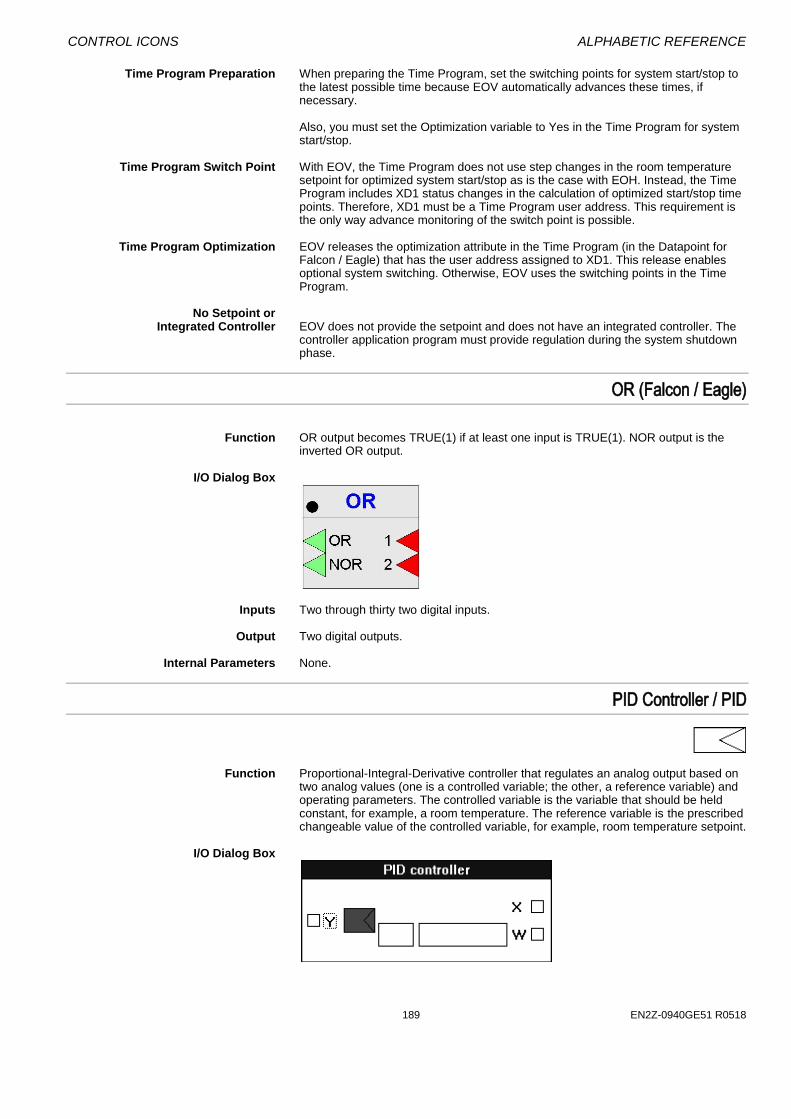
CONTROL ICONS ALPHABETIC REFERENCE
189 EN2Z-0940GE51 R0518
Time Program Preparation When preparing the Time Program, set the switching points for system start/stop to the latest possible time because EOV automatically advances these times, if necessary.
Also, you must set the Optimization variable to Yes in the Time Program for system start/stop.
Time Program Switch Point With EOV, the Time Program does not use step changes in the room temperature
setpoint for optimized system start/stop as is the case with EOH. Instead, the Time Program includes XD1 status changes in the calculation of optimized start/stop time points. Therefore, XD1 must be a Time Program user address. This requirement is the only way advance monitoring of the switch point is possible.
Time Program Optimization EOV releases the optimization attribute in the Time Program (in the Datapoint for
Falcon / Eagle) that has the user address assigned to XD1. This release enables optional system switching. Otherwise, EOV uses the switching points in the Time Program.
No Setpoint or Integrated Controller EOV does not provide the setpoint and does not have an integrated controller. The
controller application program must provide regulation during the system shutdown phase.
OR (Falcon / Eagle)
Function OR output becomes TRUE(1) if at least one input is TRUE(1). NOR output is the
inverted OR output. I/O Dialog Box
Inputs Two through thirty two digital inputs. Output Two digital outputs. Internal Parameters None.
PID Controller / PID
Function Proportional-Integral-Derivative controller that regulates an analog output based on
two analog values (one is a controlled variable; the other, a reference variable) and operating parameters. The controlled variable is the variable that should be held constant, for example, a room temperature. The reference variable is the prescribed changeable value of the controlled variable, for example, room temperature setpoint.
I/O Dialog Box

ALPHABETIC REFERENCE CONTROL ICONS
EN2Z-0940GE51 R0518 286
The PID controller can also operate as a P, PI, or PD controller if you zero the Integral and/or Derivative values in the internal parameters dialog box.
PID Operation For more information on PID operation, see the PID Operation section following this
description of the inputs, outputs, and internal parameters. Inputs Two analog inputs, where:
X = Controlled variable, for example, room temperature sensor. W = Reference variable, for example, room temperature setpoint. You can enter the reference variable (W) as a parameter (engineering unit index number and value).
Output One analog output (Y). The output is the correcting variable that maintains the
setpoint (reference variable). The output is usually a controller output signal that repositions an actuator.
PID Schematic The following schematic illustrates the formulas used in the PID controller:
The internal parameters dialog box defines the proportional, integral, and derivative terms as well as minimum and maximum output values that limit the positioning signal (Y). For additional information, see the PID Plus section.
Internal Parameters

CONTROL ICONS ALPHABETIC REFERENCE
191 EN2Z-0940GE51 R0518
Falcon / Eagle
Proportional band Xp Number type: decimal, Unit: same as the controlled variable (X) Default: 3.0, Range: -9999.0 through 9999.0 Proportional band value is equivalent to the throttling range. NOTE: Negative values will accomplish an opposite action on the output. DO NOT
use zero. This does not apply to Derivative or Integral. Derivative time Tv Number type: whole number, Unit: seconds
Default: 10 sec, Range: 0 through 7200 sec Integral action time Tn Number type: whole number, Unit: seconds
Default: 1000 sec, Range: 0 through 7200 sec If Integral action time is less than 15 seconds, integral control is disabled. If you set Integral action time to zero, software sets the P2 parameter to 1,000,000. A number this large effectively disables the integral term.
Minimum output Number type: decimal, Unit: percent
Default: 0.0 percent, Range: 0 through 100.0 percent Minimum output must be less than Maximum output.
Maximum output Number type: decimal, Unit: percent
Default: 100.0 percent, Range: 0 through 100.0 percent Parameter Number Descriptions P or PI Controller P3 Proportional band Xp

ALPHABETIC REFERENCE CONTROL ICONS
EN2Z-0940GE51 R0518 286
P4 Integral action time Tn (in seconds). If you set Integral action time to zero in the internal parameters dialog box, software sets the P4 parameter to 1,000,000. A number this large effectively disables the integral term.
P5 Minimum output (in percent) P6 Maximum output (in percent) P7 Reference variable (W) if entered as a parameter (not connected to a point)
PD Controller
P3 Proportional band Xp P4 Derivative time Tv (in seconds). P5 Minimum output (in percent) P6 Maximum output (in percent) P7 Reference variable (W) if entered as a parameter (not connected to a point)
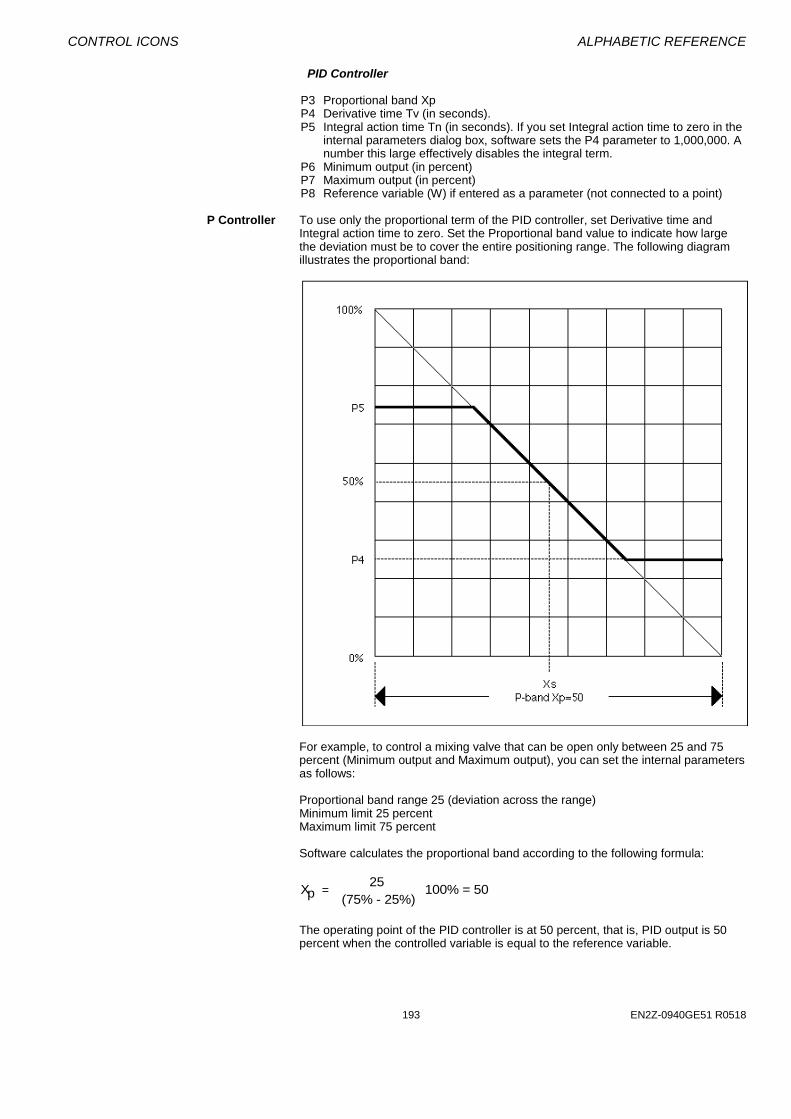
CONTROL ICONS ALPHABETIC REFERENCE
193 EN2Z-0940GE51 R0518
PID Controller
P3 Proportional band Xp P4 Derivative time Tv (in seconds). P5 Integral action time Tn (in seconds). If you set Integral action time to zero in the
internal parameters dialog box, software sets the P4 parameter to 1,000,000. A number this large effectively disables the integral term.
P6 Minimum output (in percent) P7 Maximum output (in percent) P8 Reference variable (W) if entered as a parameter (not connected to a point) P Controller To use only the proportional term of the PID controller, set Derivative time and
Integral action time to zero. Set the Proportional band value to indicate how large the deviation must be to cover the entire positioning range. The following diagram illustrates the proportional band:
For example, to control a mixing valve that can be open only between 25 and 75 percent (Minimum output and Maximum output), you can set the internal parameters as follows: Proportional band range 25 (deviation across the range) Minimum limit 25 percent Maximum limit 75 percent Software calculates the proportional band according to the following formula:
Xp25
(75% - 25%)100% = 50=
The operating point of the PID controller is at 50 percent, that is, PID output is 50 percent when the controlled variable is equal to the reference variable.
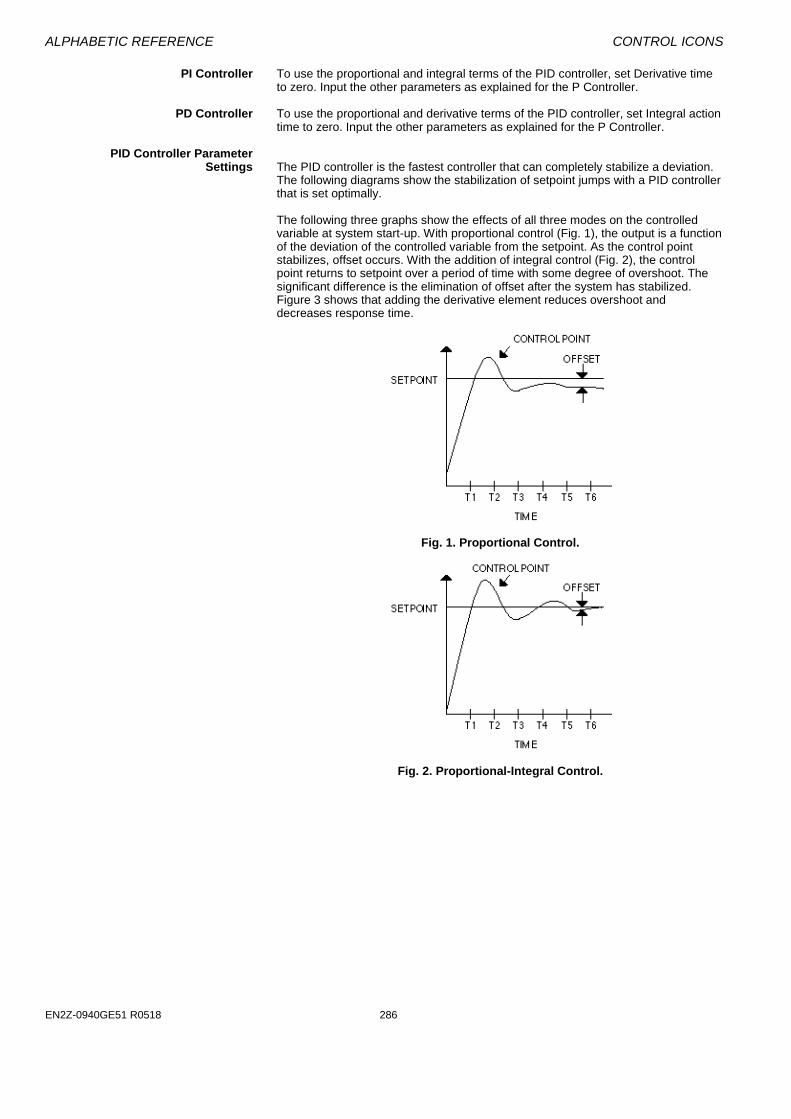
ALPHABETIC REFERENCE CONTROL ICONS
EN2Z-0940GE51 R0518 286
PI Controller To use the proportional and integral terms of the PID controller, set Derivative time to zero. Input the other parameters as explained for the P Controller.
PD Controller To use the proportional and derivative terms of the PID controller, set Integral action
time to zero. Input the other parameters as explained for the P Controller.
PID Controller Parameter Settings The PID controller is the fastest controller that can completely stabilize a deviation.
The following diagrams show the stabilization of setpoint jumps with a PID controller that is set optimally.
The following three graphs show the effects of all three modes on the controlled variable at system start-up. With proportional control (Fig. 1), the output is a function of the deviation of the controlled variable from the setpoint. As the control point stabilizes, offset occurs. With the addition of integral control (Fig. 2), the control point returns to setpoint over a period of time with some degree of overshoot. The significant difference is the elimination of offset after the system has stabilized. Figure 3 shows that adding the derivative element reduces overshoot and decreases response time.
Fig. 1. Proportional Control.
Fig. 2. Proportional-Integral Control.
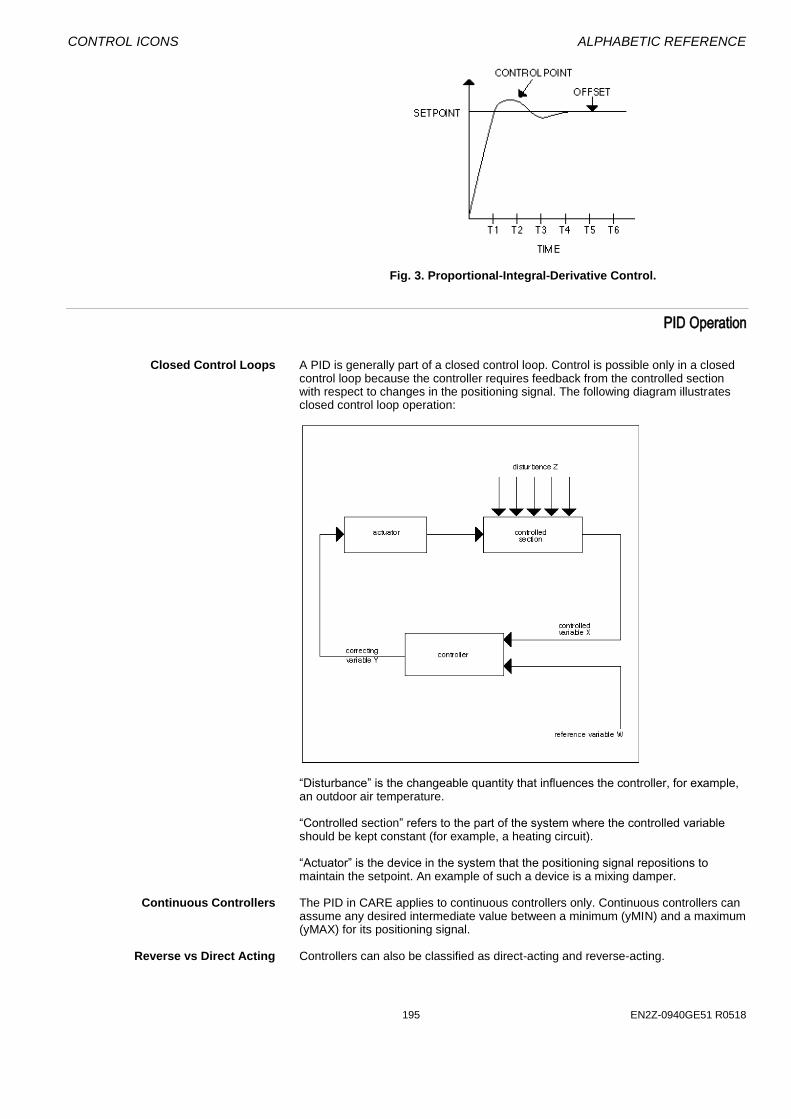
CONTROL ICONS ALPHABETIC REFERENCE
195 EN2Z-0940GE51 R0518
Fig. 3. Proportional-Integral-Derivative Control.
PID Operation
Closed Control Loops A PID is generally part of a closed control loop. Control is possible only in a closed
control loop because the controller requires feedback from the controlled section with respect to changes in the positioning signal. The following diagram illustrates closed control loop operation:
“Disturbance” is the changeable quantity that influences the controller, for example, an outdoor air temperature. “Controlled section” refers to the part of the system where the controlled variable should be kept constant (for example, a heating circuit). “Actuator” is the device in the system that the positioning signal repositions to maintain the setpoint. An example of such a device is a mixing damper.
Continuous Controllers The PID in CARE applies to continuous controllers only. Continuous controllers can
assume any desired intermediate value between a minimum (yMIN) and a maximum (yMAX) for its positioning signal.
Reverse vs Direct Acting Controllers can also be classified as direct-acting and reverse-acting.
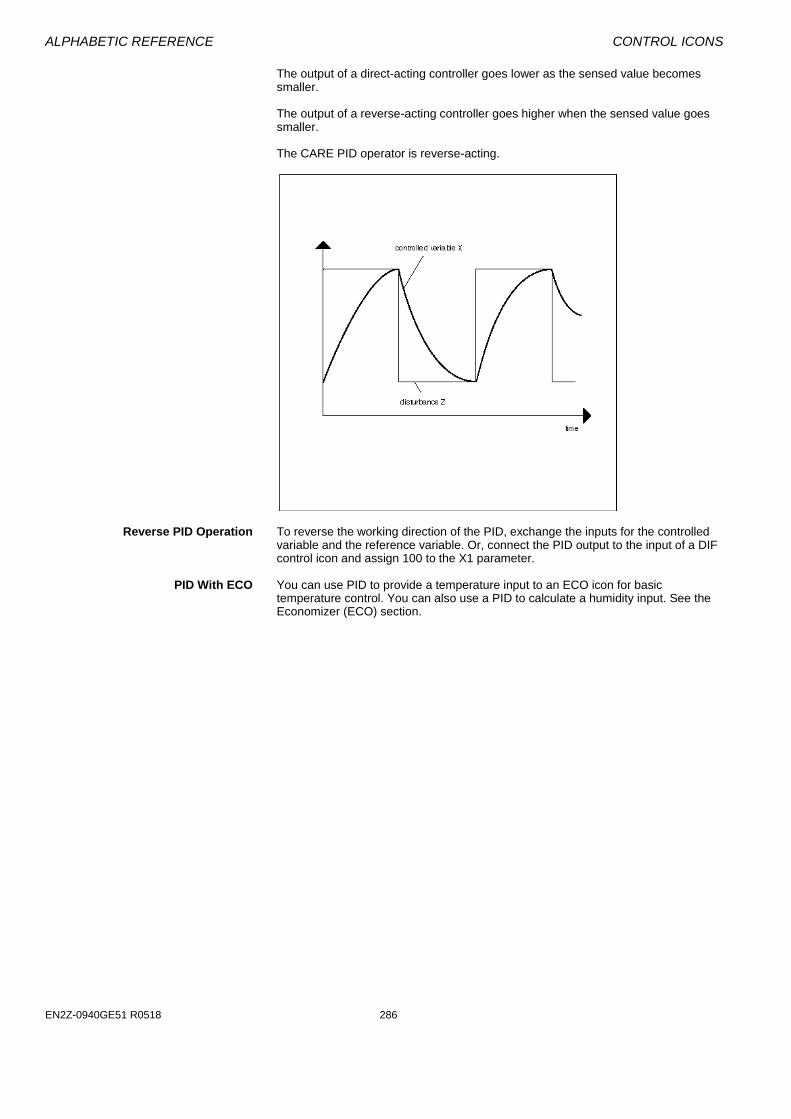
ALPHABETIC REFERENCE CONTROL ICONS
EN2Z-0940GE51 R0518 286
The output of a direct-acting controller goes lower as the sensed value becomes smaller. The output of a reverse-acting controller goes higher when the sensed value goes smaller. The CARE PID operator is reverse-acting.
Reverse PID Operation To reverse the working direction of the PID, exchange the inputs for the controlled
variable and the reference variable. Or, connect the PID output to the input of a DIF control icon and assign 100 to the X1 parameter.
PID With ECO You can use PID to provide a temperature input to an ECO icon for basic
temperature control. You can also use a PID to calculate a humidity input. See the Economizer (ECO) section.

CONTROL ICONS ALPHABETIC REFERENCE
197 EN2Z-0940GE51 R0518
PID Plus Controller / PID
Function Proportional-Integral-Derivative controller that regulates an analog output based on
two analog values (one is a controlled variable; the other, a reference variable) and operating parameters.
Falcon / Eagle:
PID-Controller that generates a signal depending on the deviation of the controlled variable from the reference variable.
This PID has the same behavior as the previously defined PID with an additional digital input. The digital input (XD, Falcon / Eagle: Ion) enables and disables integral control action. When this input is zero, integral control is disabled and the integral sum is reset. This input must always be connected.
I/O Dialog Box
Falcon / Eagle Inputs Two analog inputs, where:
X = Controlled variable, for example, room temperature sensor. W = Reference variable, also known as setpoint. You can enter the reference variable (W) as a parameter (engineering unit index number and value). Not for Falcon / Eagle! One digital input, where: XD (Ion, Falcon / Eagle) = Enable/disable integral control action. When XD is zero, integral control is disabled and the integral sum is reset.
Output One analog output (Y).
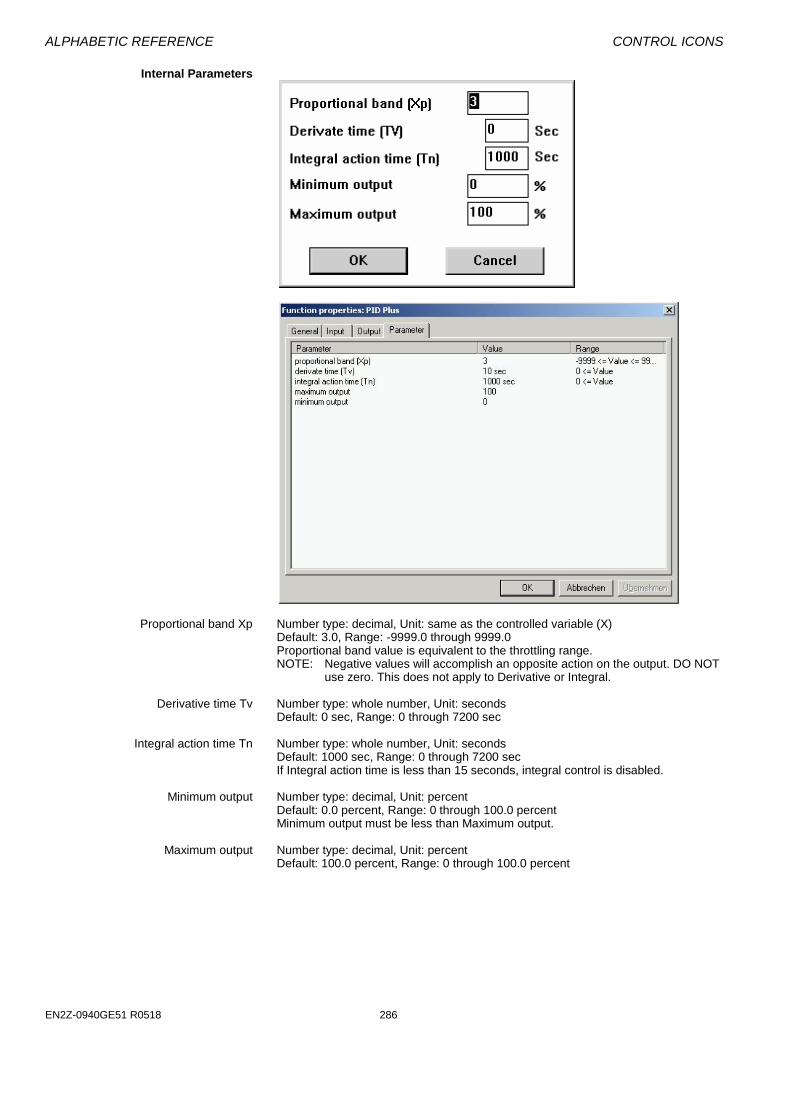
ALPHABETIC REFERENCE CONTROL ICONS
EN2Z-0940GE51 R0518 286
Internal Parameters
Proportional band Xp Number type: decimal, Unit: same as the controlled variable (X)
Default: 3.0, Range: -9999.0 through 9999.0 Proportional band value is equivalent to the throttling range. NOTE: Negative values will accomplish an opposite action on the output. DO NOT
use zero. This does not apply to Derivative or Integral. Derivative time Tv Number type: whole number, Unit: seconds
Default: 0 sec, Range: 0 through 7200 sec Integral action time Tn Number type: whole number, Unit: seconds
Default: 1000 sec, Range: 0 through 7200 sec If Integral action time is less than 15 seconds, integral control is disabled.
Minimum output Number type: decimal, Unit: percent
Default: 0.0 percent, Range: 0 through 100.0 percent Minimum output must be less than Maximum output.
Maximum output Number type: decimal, Unit: percent
Default: 100.0 percent, Range: 0 through 100.0 percent

CONTROL ICONS ALPHABETIC REFERENCE
199 EN2Z-0940GE51 R0518
Parameter Number Descriptions P Controller (if W is NOT entered as a parameter) P3 Proportional band Xp P4 Integral action time Tn (in seconds). Always zero. P5 Minimum output (in percent) P6 Maximum output (in percent) P7 Dummy parameter. This parameter usually stores integral action time. It has no
effect in a P controller. P Controller (if W is entered as a parameter)
P3 Proportional band Xp P4 Integral action time Tn (in seconds). Always zero. P5 Minimum output (in percent) P6 Maximum output (in percent) P7 Reference variable (W) P8 Dummy parameter. This parameter usually stores integral action time. It has no
effect in a P controller.
PI Controller (if W is NOT entered as a parameter)
P3 Proportional band Xp P4 Integral action time Tn (in seconds). If you set Integral action time to zero in the
internal parameters dialog box, software sets the P4 parameter to 1,000,000. A number this large effectively disables the integral term.
P5 Minimum output (in percent) P6 Maximum output (in percent) P7 Actual integral action time Tn (in seconds). If XD1 is zero, P7 is also zero. If
XD1 is one, P7 contains the user-defined value of Tn stored in P4. PI Controller (if W is entered as a parameter)
P3 Proportional band Xp P4 Integral action time Tn (in seconds). If you set Integral action time to zero in the
internal parameters dialog box, software sets the P4 parameter to 1,000,000. A number this large effectively disables the integral term.
P5 Minimum output (in percent) P6 Maximum output (in percent) P7 Reference variable (W) P8 Actual integral action time Tn (in seconds). If XD1 is zero, P7 is also zero. If
XD1 is one, P7 contains the user-defined value of Tn stored in P4. PD Controller (if W is NOT entered as a parameter)
P3 Proportional band Xp P4 Derivative time Tv (in seconds). P5 Minimum output (in percent) P6 Maximum output (in percent) P7 Dummy parameter. This parameter usually stores integral action time. It has no
effect in a PD controller.
PD Controller (if W is entered as a parameter)
P3 Proportional band Xp P4 Derivative time Tv (in seconds). P5 Minimum output (in percent) P6 Maximum output (in percent) P7 Reference variable (W) P8 Dummy parameter. This parameter usually stores integral action time. It has no
effect in a PD controller.
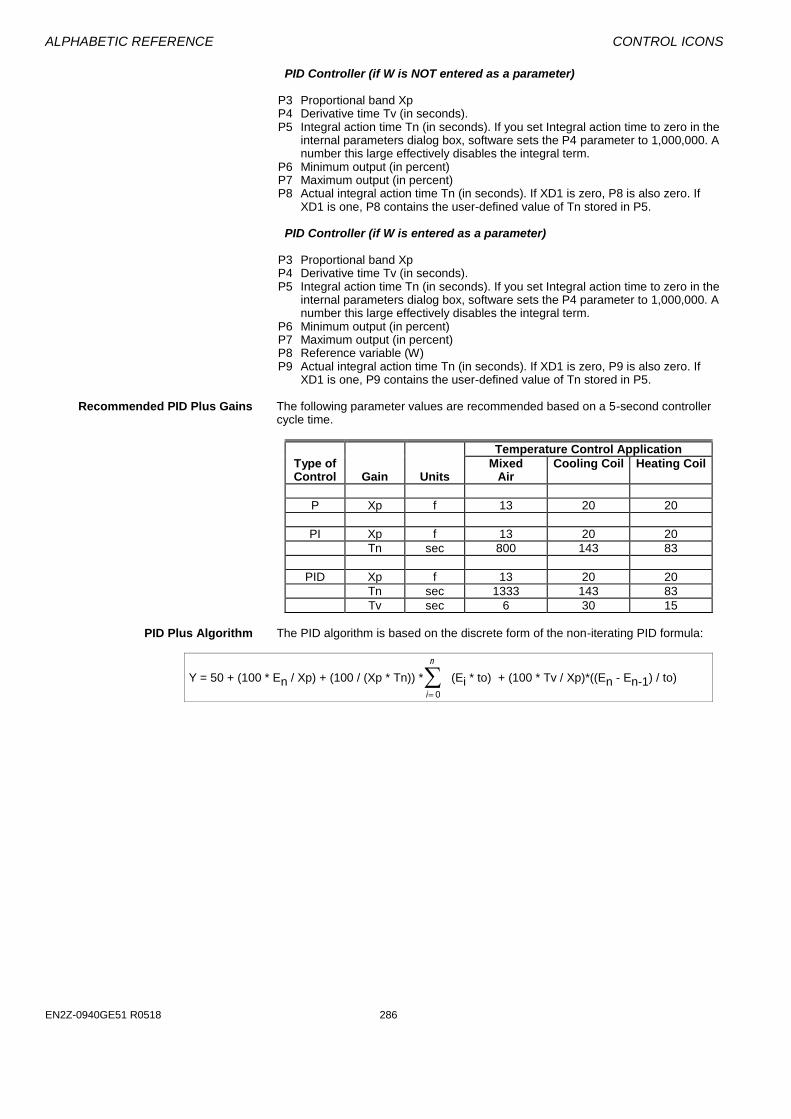
ALPHABETIC REFERENCE CONTROL ICONS
EN2Z-0940GE51 R0518 286
PID Controller (if W is NOT entered as a parameter)
P3 Proportional band Xp P4 Derivative time Tv (in seconds). P5 Integral action time Tn (in seconds). If you set Integral action time to zero in the
internal parameters dialog box, software sets the P4 parameter to 1,000,000. A number this large effectively disables the integral term.
P6 Minimum output (in percent) P7 Maximum output (in percent) P8 Actual integral action time Tn (in seconds). If XD1 is zero, P8 is also zero. If
XD1 is one, P8 contains the user-defined value of Tn stored in P5. PID Controller (if W is entered as a parameter)
P3 Proportional band Xp P4 Derivative time Tv (in seconds). P5 Integral action time Tn (in seconds). If you set Integral action time to zero in the
internal parameters dialog box, software sets the P4 parameter to 1,000,000. A number this large effectively disables the integral term.
P6 Minimum output (in percent) P7 Maximum output (in percent) P8 Reference variable (W) P9 Actual integral action time Tn (in seconds). If XD1 is zero, P9 is also zero. If
XD1 is one, P9 contains the user-defined value of Tn stored in P5. Recommended PID Plus Gains The following parameter values are recommended based on a 5-second controller
cycle time.
Temperature Control Application
Type of Control
Gain
Units
Mixed Air
Cooling Coil Heating Coil
P Xp f 13 20 20
PI Xp f 13 20 20
Tn sec 800 143 83
PID Xp f 13 20 20
Tn sec 1333 143 83
Tv sec 6 30 15
PID Plus Algorithm The PID algorithm is based on the discrete form of the non-iterating PID formula:
Y = 50 + (100 * En / Xp) + (100 / (Xp * Tn)) *
i
n
0
(Ei * to) + (100 * Tv / Xp)*((En - En-1) / to)
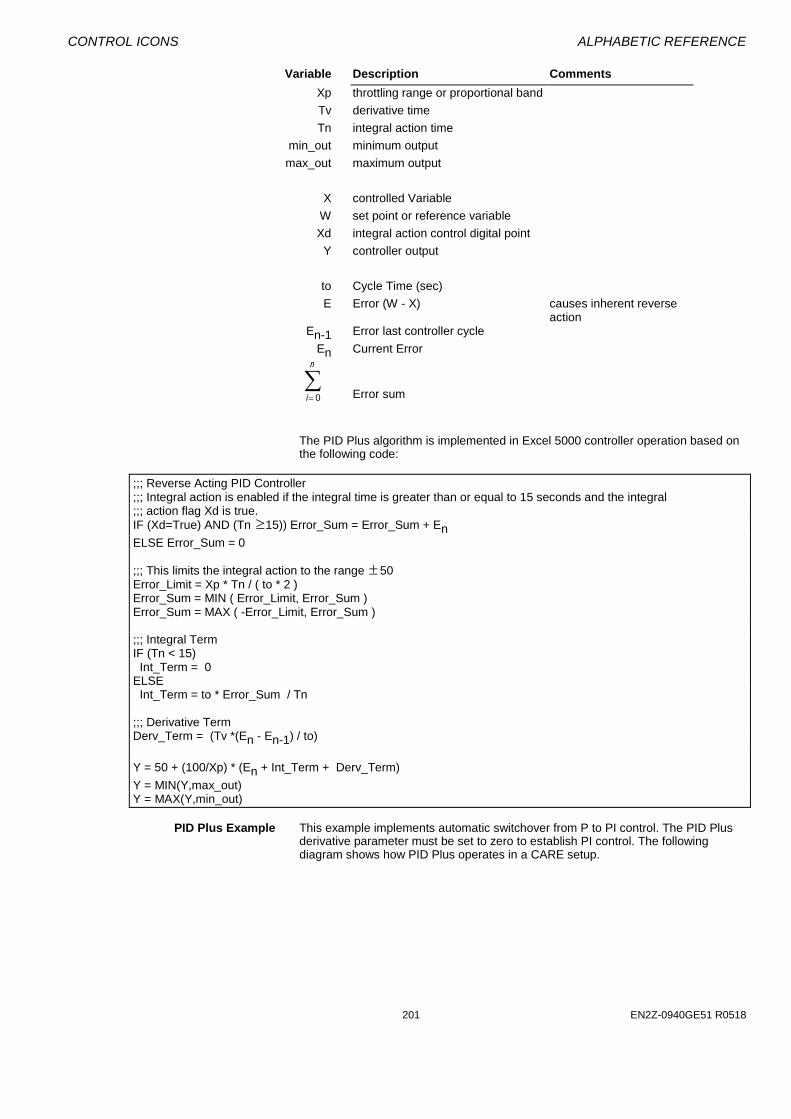
CONTROL ICONS ALPHABETIC REFERENCE
201 EN2Z-0940GE51 R0518
Variable Description Comments
Xp throttling range or proportional band
Tv derivative time
Tn integral action time
min_out minimum output
max_out maximum output
X controlled Variable
W set point or reference variable
Xd integral action control digital point
Y controller output
to Cycle Time (sec)
E Error (W - X) causes inherent reverse action
En-1 Error last controller cycle
En Current Error
i
n
0
Error sum
The PID Plus algorithm is implemented in Excel 5000 controller operation based on the following code:
;;; Reverse Acting PID Controller ;;; Integral action is enabled if the integral time is greater than or equal to 15 seconds and the integral ;;; action flag Xd is true.
IF (Xd=True) AND (Tn 15)) Error_Sum = Error_Sum + En ELSE Error_Sum = 0
;;; This limits the integral action to the range 50 Error_Limit = Xp * Tn / ( to * 2 ) Error_Sum = MIN ( Error_Limit, Error_Sum ) Error_Sum = MAX ( -Error_Limit, Error_Sum ) ;;; Integral Term IF (Tn < 15) Int_Term = 0 ELSE Int_Term = to * Error_Sum / Tn ;;; Derivative Term Derv_Term = (Tv *(En - En-1) / to)
Y = 50 + (100/Xp) * (En + Int_Term + Derv_Term)
Y = MIN(Y,max_out) Y = MAX(Y,min_out)
PID Plus Example This example implements automatic switchover from P to PI control. The PID Plus
derivative parameter must be set to zero to establish PI control. The following diagram shows how PID Plus operates in a CARE setup.
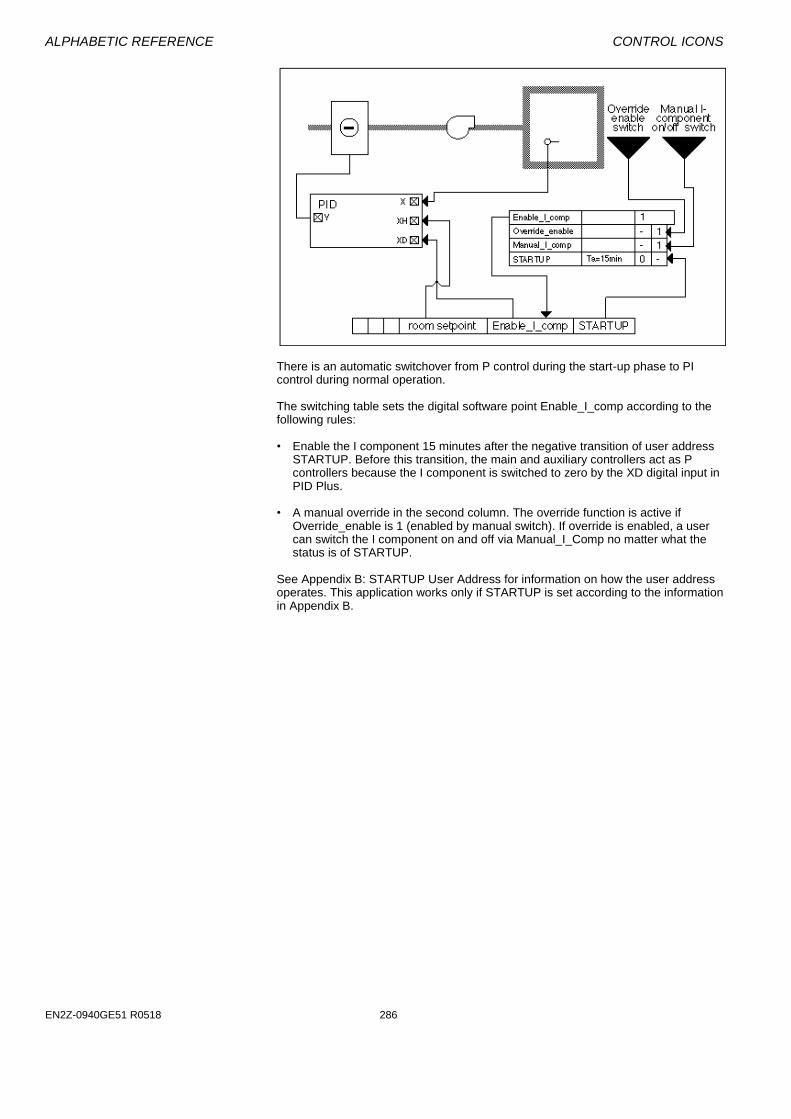
ALPHABETIC REFERENCE CONTROL ICONS
EN2Z-0940GE51 R0518 286
There is an automatic switchover from P control during the start-up phase to PI control during normal operation. The switching table sets the digital software point Enable_I_comp according to the following rules:
• Enable the I component 15 minutes after the negative transition of user address
STARTUP. Before this transition, the main and auxiliary controllers act as P controllers because the I component is switched to zero by the XD digital input in PID Plus.
• A manual override in the second column. The override function is active if
Override_enable is 1 (enabled by manual switch). If override is enabled, a user can switch the I component on and off via Manual_I_Comp no matter what the status is of STARTUP.
See Appendix B: STARTUP User Address for information on how the user address operates. This application works only if STARTUP is set according to the information in Appendix B.
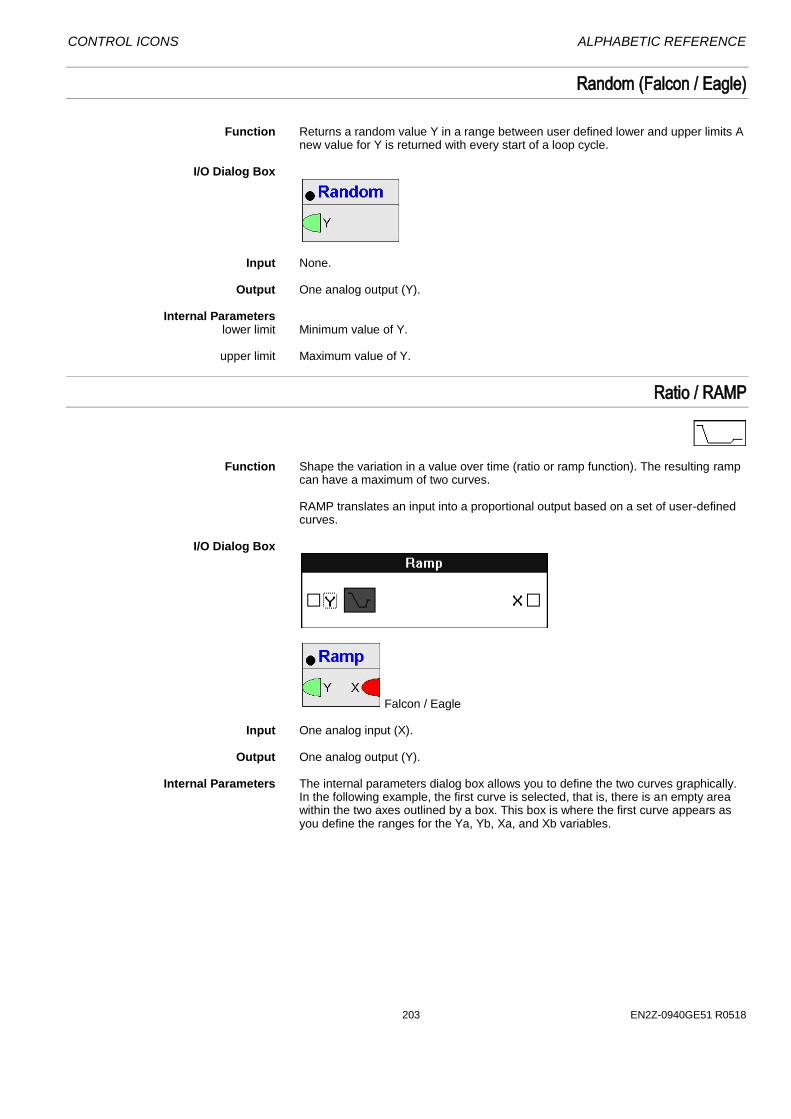
CONTROL ICONS ALPHABETIC REFERENCE
203 EN2Z-0940GE51 R0518
Random (Falcon / Eagle)
Function Returns a random value Y in a range between user defined lower and upper limits A
new value for Y is returned with every start of a loop cycle. I/O Dialog Box
Input None. Output One analog output (Y). Internal Parameters lower limit Minimum value of Y. upper limit Maximum value of Y.
Ratio / RAMP
Function Shape the variation in a value over time (ratio or ramp function). The resulting ramp
can have a maximum of two curves.
RAMP translates an input into a proportional output based on a set of user-defined curves.
I/O Dialog Box
Falcon / Eagle Input One analog input (X). Output One analog output (Y). Internal Parameters The internal parameters dialog box allows you to define the two curves graphically.
In the following example, the first curve is selected, that is, there is an empty area within the two axes outlined by a box. This box is where the first curve appears as you define the ranges for the Ya, Yb, Xa, and Xb variables.
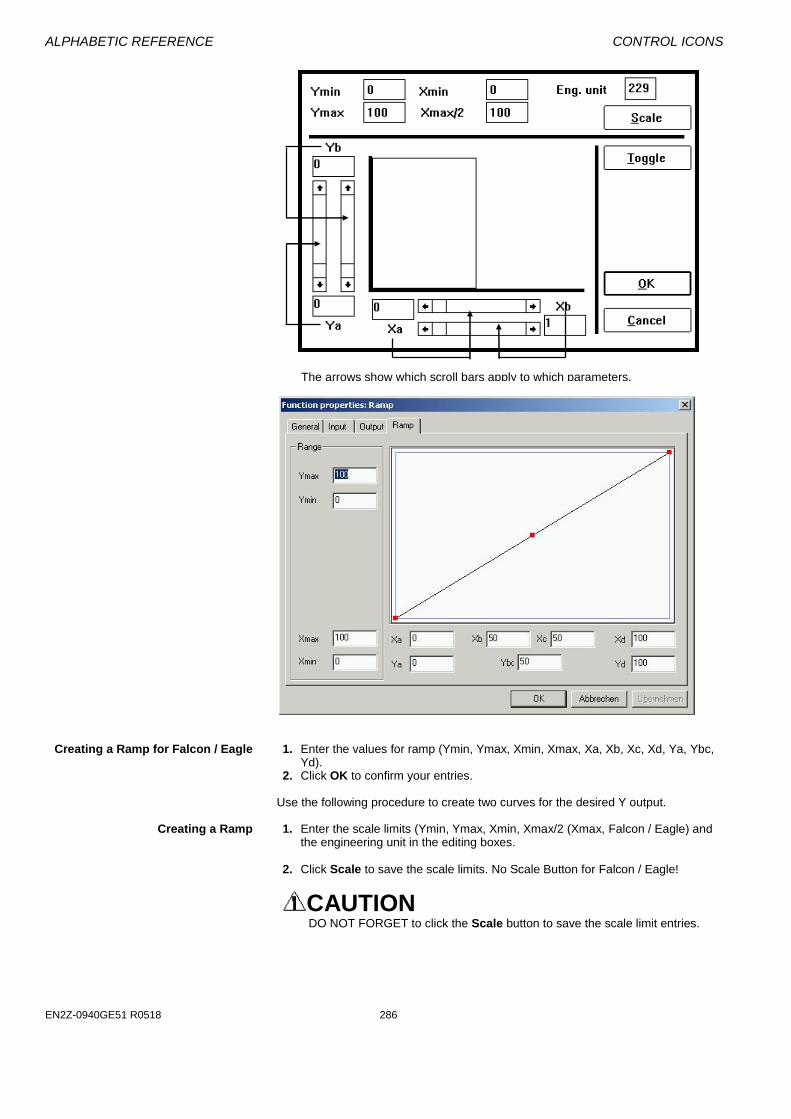
ALPHABETIC REFERENCE CONTROL ICONS
EN2Z-0940GE51 R0518 286
The arrows show which scroll bars apply to which parameters.
Creating a Ramp for Falcon / Eagle 1. Enter the values for ramp (Ymin, Ymax, Xmin, Xmax, Xa, Xb, Xc, Xd, Ya, Ybc, Yd).
2. Click OK to confirm your entries.
Use the following procedure to create two curves for the desired Y output. Creating a Ramp 1. Enter the scale limits (Ymin, Ymax, Xmin, Xmax/2 (Xmax, Falcon / Eagle) and
the engineering unit in the editing boxes. 2. Click Scale to save the scale limits. No Scale Button for Falcon / Eagle!
CAUTION DO NOT FORGET to click the Scale button to save the scale limit entries.

CONTROL ICONS ALPHABETIC REFERENCE
205 EN2Z-0940GE51 R0518
3. Define Xa by clicking the left and right arrows in the scroll bar just below the X axis. As you click, the value of Xa changes. You can also click the gray area in the scroll bar or click the white box (thumb) in the scroll bar and move it to the desired position.
Determine Xb by clicking the lower scroll bar. You can use the same techniques
as for the other scroll bar. The a and b values establish the curves left and right pivot points. Xb must be
less than Xa.
RESULT: The values in the boxes to the left and right of the horizontal scroll bars change. A line appears in the graph to represent the curve you created.
Tip If desired, you can change the Xmin and Xmax/2 values that
appear at the top of the dialog box. These values establish which area Xa and Xb can span. Click the value in the box and type a new value to change it. Click Scale to save the entries.
4. Define Ya by clicking the vertical scroll bar on the left-hand side of the dialog
box. You can use the same techniques to change Ya values as for the other scroll bars.
Define Yb by clicking the vertical scroll bar to the right of the Ya scroll bar. Yb must be less than Ya.
Tip If desired, you can change the Ymin and Ymax values that appear at the top of the dialog box. These values establish which area Ya and Yb can span. Click the value in the box and type a new value to change it.
5. Click Toggle to start work on the other curve. Each time you click Toggle, you
move the focus from one curve to the other. 6. Define the X and Y values for the right-hand curve in the same manner as for
the left-hand curve. 7. Click OK to save the curves. The following diagram shows how the software interprets the graph.

ALPHABETIC REFERENCE CONTROL ICONS
EN2Z-0940GE51 R0518 286
Parameter Number Descriptions P3 Ya(1), minimum value of the first ramp (curve) P4 Yb(1). maximum value of the first ramp (equivalent to the minimum value of the
second ramp). P5 Slope of the first ramp. Formula:
Yb(1) - Ya(1)
Xb(1) - Xa(1)P5 =
P6 Intersection of the Y axis with the first ramp.
P6 = 0 if Xa(1) = Xb(1)
Yb(1) - Ya(1)
Xb(1) - Xa(1) for Xa(1) Xb(1) P6 = Ya(1) - * Xa(1) ( )
P7 Ya(2), minimum value of the second ramp (equivalent to the maximum value of
the first ramp, Yb(1) = P4). P8 Yb(2), the maximum of the second ramp. P9 Slope of the second ramp. Formula:
Yb(2) - Ya(2)
Xb(2) - Xa(2)for Xa(2) Xb(2)P9 =
P10 Intersection of the second ramp with the Y axis:
Yb(2) - Ya(2)
Xb(2) - Xa(2)for Xa(2) Xb(2)P10 = Ya(2) -
P11 Xb(1), maximum X value of the first ramp.
The following diagram shows the parameters for the RAMP control icon:
Scale Changes When you change the minimum and maximum X and Y scale values, RAMP adjusts
minimum and maximum values for the curves so that they are not outside the overall X and Y ranges.
For example, assume an application has the following values: Y scale ranges from 0 through 100 (Ymin through Ymax)
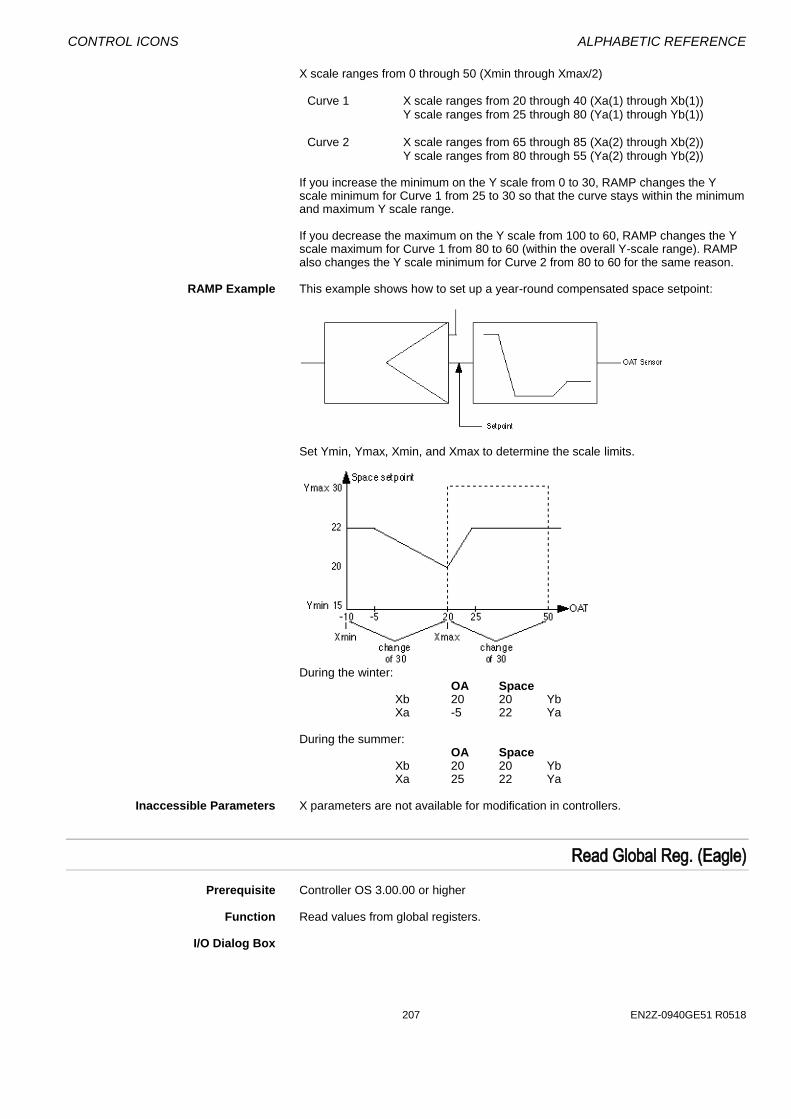
CONTROL ICONS ALPHABETIC REFERENCE
207 EN2Z-0940GE51 R0518
X scale ranges from 0 through 50 (Xmin through Xmax/2)
Curve 1 X scale ranges from 20 through 40 (Xa(1) through Xb(1)) Y scale ranges from 25 through 80 (Ya(1) through Yb(1)) Curve 2 X scale ranges from 65 through 85 (Xa(2) through Xb(2)) Y scale ranges from 80 through 55 (Ya(2) through Yb(2))
If you increase the minimum on the Y scale from 0 to 30, RAMP changes the Y scale minimum for Curve 1 from 25 to 30 so that the curve stays within the minimum and maximum Y scale range. If you decrease the maximum on the Y scale from 100 to 60, RAMP changes the Y scale maximum for Curve 1 from 80 to 60 (within the overall Y-scale range). RAMP also changes the Y scale minimum for Curve 2 from 80 to 60 for the same reason.
RAMP Example This example shows how to set up a year-round compensated space setpoint:
Set Ymin, Ymax, Xmin, and Xmax to determine the scale limits.
During the winter:
OA Space Xb 20 20 Yb Xa -5 22 Ya
During the summer:
OA Space Xb 20 20 Yb Xa 25 22 Ya
Inaccessible Parameters X parameters are not available for modification in controllers.
Read Global Reg. (Eagle)
Prerequisite Controller OS 3.00.00 or higher Function Read values from global registers. I/O Dialog Box
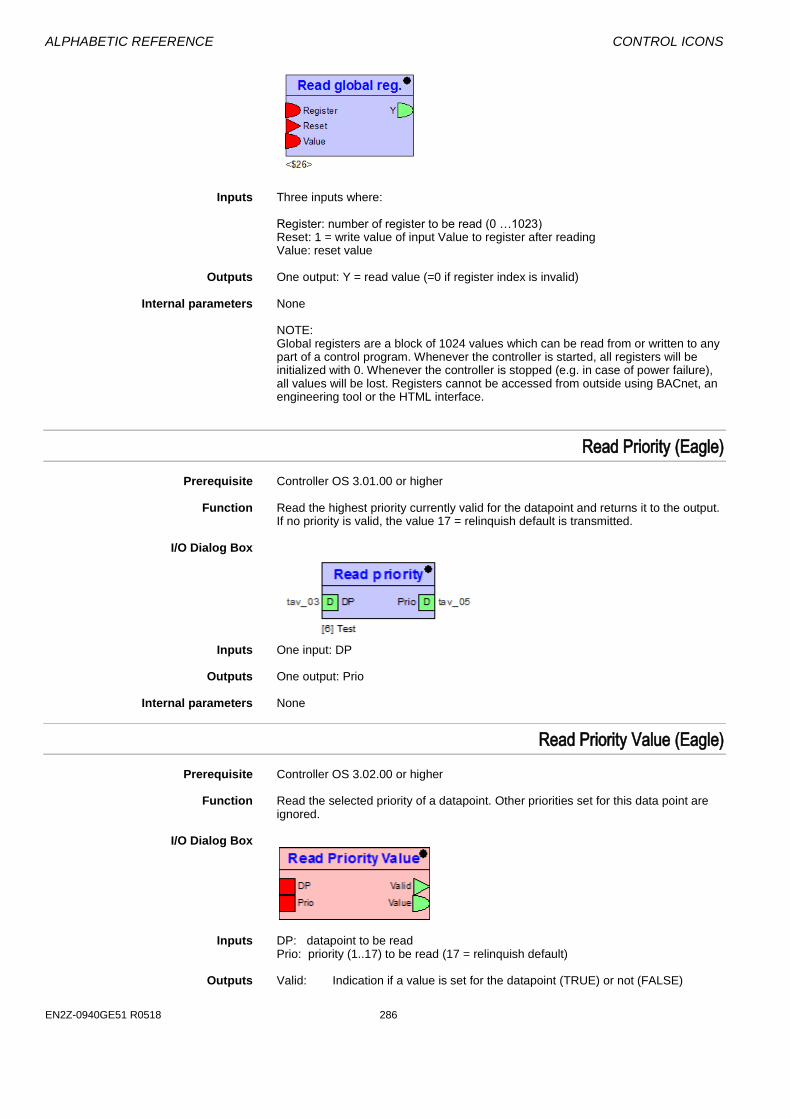
ALPHABETIC REFERENCE CONTROL ICONS
EN2Z-0940GE51 R0518 286
Inputs Three inputs where: Register: number of register to be read (0 …1023)
Reset: 1 = write value of input Value to register after reading Value: reset value Outputs One output: Y = read value (=0 if register index is invalid) Internal parameters None
NOTE: Global registers are a block of 1024 values which can be read from or written to any part of a control program. Whenever the controller is started, all registers will be initialized with 0. Whenever the controller is stopped (e.g. in case of power failure), all values will be lost. Registers cannot be accessed from outside using BACnet, an engineering tool or the HTML interface.
Read Priority (Eagle)
Prerequisite Controller OS 3.01.00 or higher Function Read the highest priority currently valid for the datapoint and returns it to the output.
If no priority is valid, the value 17 = relinquish default is transmitted. I/O Dialog Box
Inputs One input: DP Outputs One output: Prio Internal parameters None
Read Priority Value (Eagle)
Prerequisite Controller OS 3.02.00 or higher Function Read the selected priority of a datapoint. Other priorities set for this data point are
ignored. I/O Dialog Box
Inputs DP: datapoint to be read Prio: priority (1..17) to be read (17 = relinquish default)
Outputs Valid: Indication if a value is set for the datapoint (TRUE) or not (FALSE)
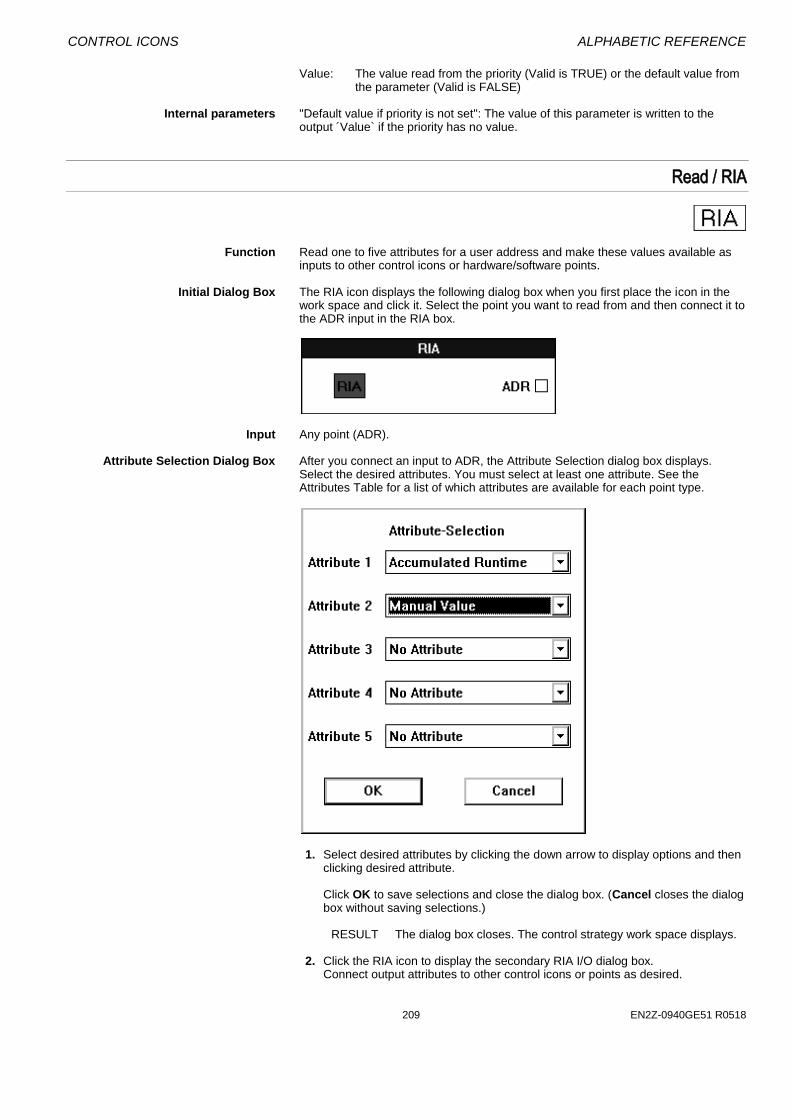
CONTROL ICONS ALPHABETIC REFERENCE
209 EN2Z-0940GE51 R0518
Value: The value read from the priority (Valid is TRUE) or the default value from the parameter (Valid is FALSE)
Internal parameters "Default value if priority is not set": The value of this parameter is written to the
output ´Value` if the priority has no value.
Read / RIA
Function Read one to five attributes for a user address and make these values available as
inputs to other control icons or hardware/software points. Initial Dialog Box The RIA icon displays the following dialog box when you first place the icon in the
work space and click it. Select the point you want to read from and then connect it to the ADR input in the RIA box.
Input Any point (ADR). Attribute Selection Dialog Box After you connect an input to ADR, the Attribute Selection dialog box displays.
Select the desired attributes. You must select at least one attribute. See the Attributes Table for a list of which attributes are available for each point type.
1. Select desired attributes by clicking the down arrow to display options and then
clicking desired attribute. Click OK to save selections and close the dialog box. (Cancel closes the dialog
box without saving selections.)
RESULT The dialog box closes. The control strategy work space displays. 2. Click the RIA icon to display the secondary RIA I/O dialog box. Connect output attributes to other control icons or points as desired.
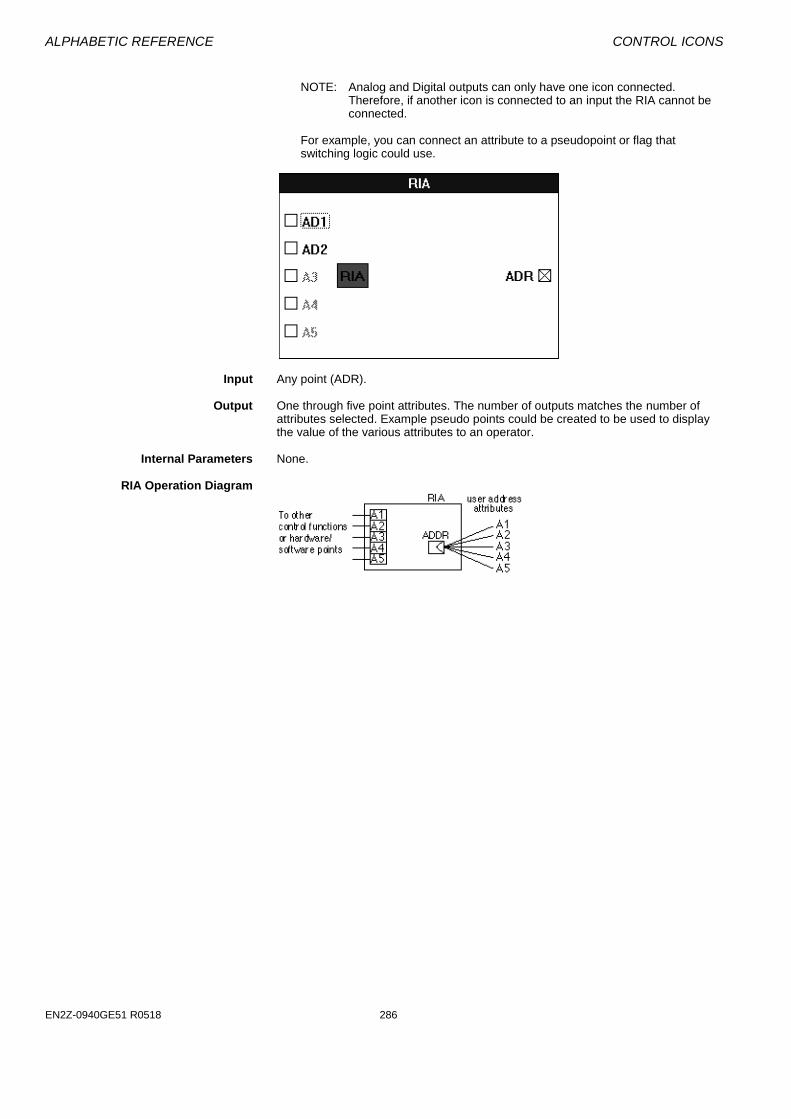
ALPHABETIC REFERENCE CONTROL ICONS
EN2Z-0940GE51 R0518 286
NOTE: Analog and Digital outputs can only have one icon connected.
Therefore, if another icon is connected to an input the RIA cannot be connected.
For example, you can connect an attribute to a pseudopoint or flag that
switching logic could use.
Input Any point (ADR). Output One through five point attributes. The number of outputs matches the number of
attributes selected. Example pseudo points could be created to be used to display the value of the various attributes to an operator.
Internal Parameters None. RIA Operation Diagram

CONTROL ICONS ALPHABETIC REFERENCE
211 EN2Z-0940GE51 R0518
RIA Attributes Table The following table lists attributes that you can select for the various point types. NOTE: The list of attributes presented in the icon change depending on the type of
connection. For example, if the output is connected to a digital type connection (if it is a point or another icon), then the list of available attributes consists of only the ones marked dig in this this table. The same type of list is available when an analog type connection is made; only the ana are available. A special condition exists when the attribute “Manual Value” is selected. The available list only consists of Manual Value and No Attribute.
dig/ana AI/PAI DI/PDI AO/PO DO 3POS GA GD TOT FLEX
Accumulated Runtime ana X X X X
Alarm Hysteresis ana X X
Auto Value ana X X
Cycle Count ana X X X
Global Broadcast Threshold ana X
High Alarm Limit ana X X
High Warning Limit ana X
Low Alarm Limit ana X
Low Warning Limit ana X
Manual Value ana X X X X X X X X X
No Attribute ana X X X X X X X X X
Operational Mode dig X X X X X X X X X
Operator Access Level ana X X X X X X X X X
Point in Alarm dig X X
Suppress Alarm dig X X X X X X X
Trend Cycle ana X X X X
Trend Threshold ana X X X X
Write Protection Priority* ana X X X X X X X X X
Hide Point dig X X X X X X X X X
No Response dig X X X X X X X X X
DIO Remote dig AO only X X
*Referred to as Access Control for Flex Points **Operational status can be 1 for manual or 0 for automatic.
X = Read access AI = Analog input PAI = Analog input pseudopoint (VA) AO = Analog output PTOT = Totalizer pseudopoint (VT) DI = Digital input PDI = Digital input pseudopoint (VD) DO = Digital output 3POS = Three-position analog output GA = Global analog GD = Global digital TOT = Totalizer (fast or slow) Flex = Flex (digital output with feedback, multi-staged, and pulse_2)
RIA Example See the Operating Pump Switchover application in the Examples chapter for a
description of how to use RIA to switch pump operation between two pumps dependent on hours of operation.
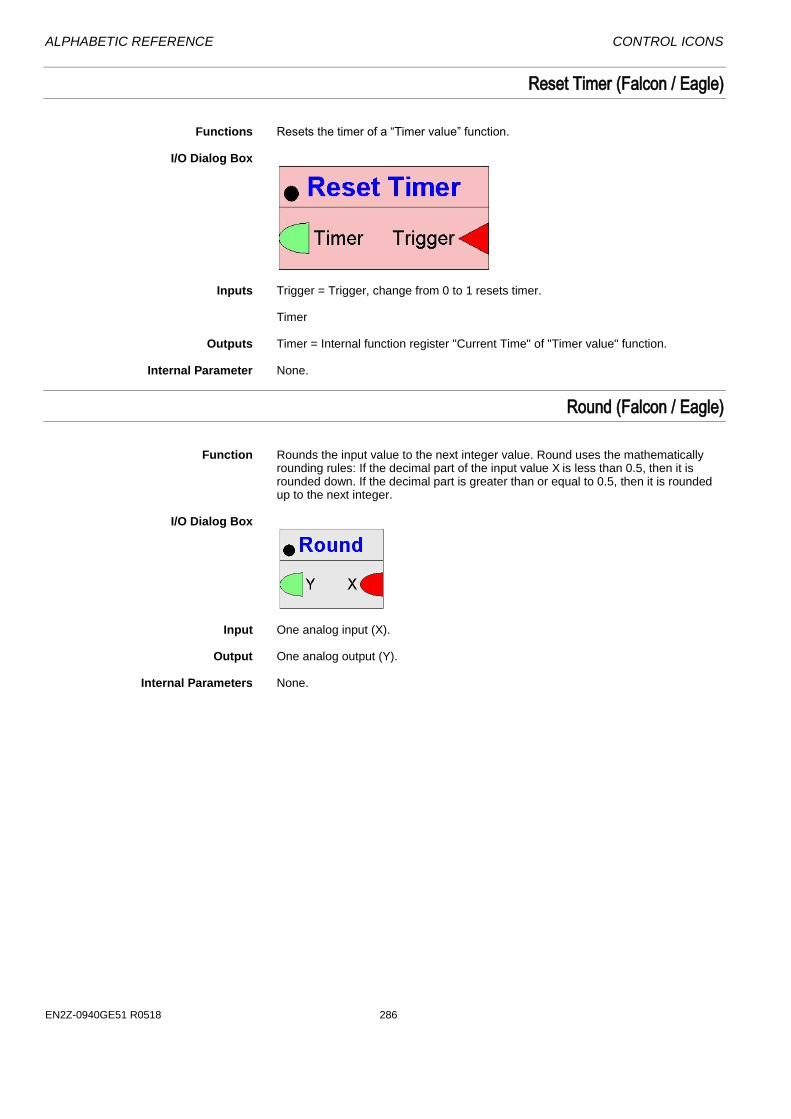
ALPHABETIC REFERENCE CONTROL ICONS
EN2Z-0940GE51 R0518 286
Reset Timer (Falcon / Eagle)
Functions Resets the timer of a “Timer value” function. I/O Dialog Box
Inputs Trigger = Trigger, change from 0 to 1 resets timer.
Timer
Outputs Timer = Internal function register "Current Time" of "Timer value" function. Internal Parameter None.
Round (Falcon / Eagle)
Function Rounds the input value to the next integer value. Round uses the mathematically
rounding rules: If the decimal part of the input value X is less than 0.5, then it is rounded down. If the decimal part is greater than or equal to 0.5, then it is rounded up to the next integer.
I/O Dialog Box
Input One analog input (X). Output One analog output (Y). Internal Parameters None.
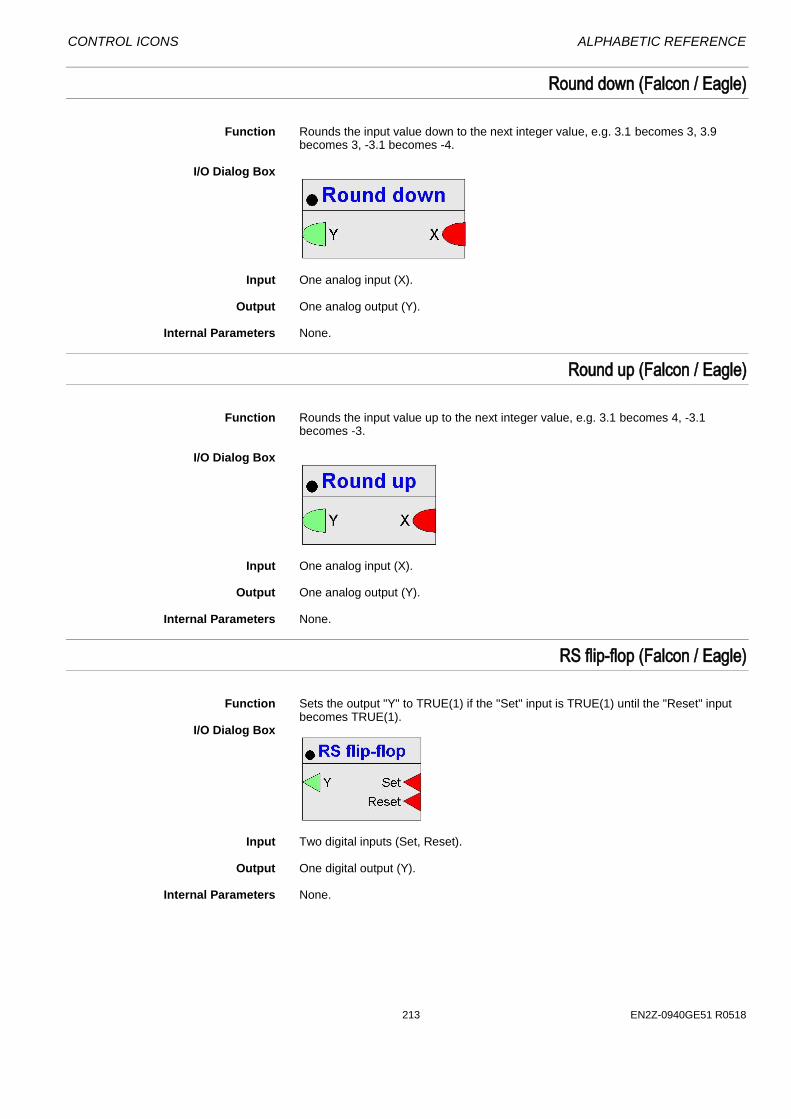
CONTROL ICONS ALPHABETIC REFERENCE
213 EN2Z-0940GE51 R0518
Round down (Falcon / Eagle)
Function Rounds the input value down to the next integer value, e.g. 3.1 becomes 3, 3.9
becomes 3, -3.1 becomes -4. I/O Dialog Box
Input One analog input (X). Output One analog output (Y). Internal Parameters None.
Round up (Falcon / Eagle)
Function Rounds the input value up to the next integer value, e.g. 3.1 becomes 4, -3.1
becomes -3. I/O Dialog Box
Input One analog input (X). Output One analog output (Y). Internal Parameters None.
RS flip-flop (Falcon / Eagle)
Function Sets the output "Y" to TRUE(1) if the "Set" input is TRUE(1) until the "Reset" input
becomes TRUE(1). I/O Dialog Box
Input Two digital inputs (Set, Reset). Output One digital output (Y). Internal Parameters None.

ALPHABETIC REFERENCE CONTROL ICONS
EN2Z-0940GE51 R0518 286
Sequence / SEQ
Function Sequence from one to three analog outputs dependent on an analog input. The
SEQ operator divides a controller signal into up to three output signals. I/O Dialog Box
Falcon / Eagle
Input One analog input (X). Outputs One to three analog outputs (Y1 through Y3).
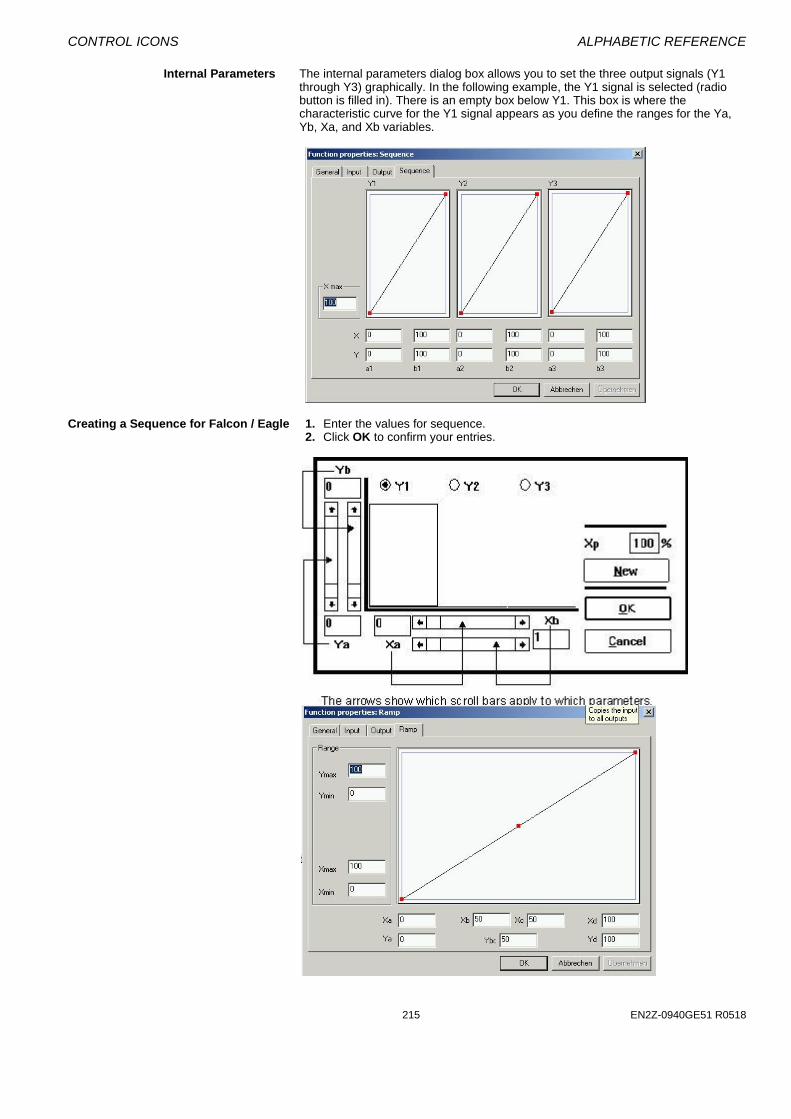
CONTROL ICONS ALPHABETIC REFERENCE
215 EN2Z-0940GE51 R0518
Internal Parameters The internal parameters dialog box allows you to set the three output signals (Y1 through Y3) graphically. In the following example, the Y1 signal is selected (radio button is filled in). There is an empty box below Y1. This box is where the characteristic curve for the Y1 signal appears as you define the ranges for the Ya, Yb, Xa, and Xb variables.
Creating a Sequence for Falcon / Eagle 1. Enter the values for sequence. 2. Click OK to confirm your entries.
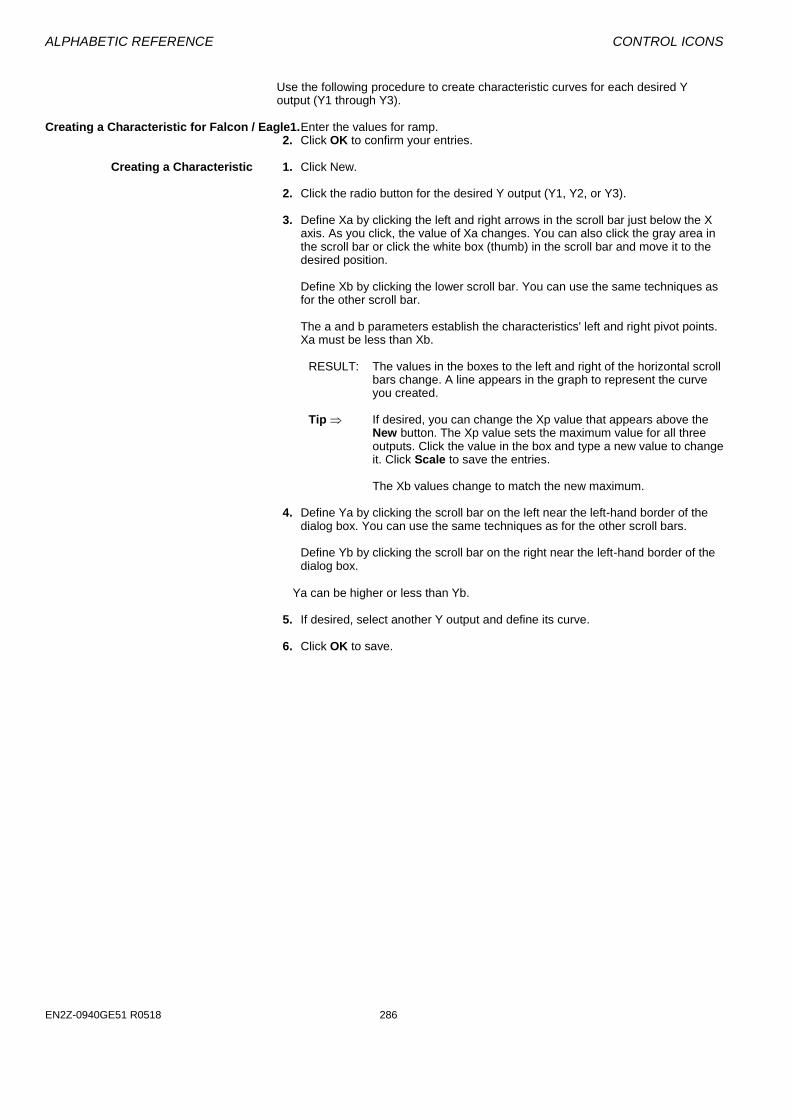
ALPHABETIC REFERENCE CONTROL ICONS
EN2Z-0940GE51 R0518 286
Use the following procedure to create characteristic curves for each desired Y output (Y1 through Y3).
Creating a Characteristic for Falcon / Eagle1. Enter the values for ramp. 2. Click OK to confirm your entries. Creating a Characteristic 1. Click New. 2. Click the radio button for the desired Y output (Y1, Y2, or Y3). 3. Define Xa by clicking the left and right arrows in the scroll bar just below the X
axis. As you click, the value of Xa changes. You can also click the gray area in the scroll bar or click the white box (thumb) in the scroll bar and move it to the desired position.
Define Xb by clicking the lower scroll bar. You can use the same techniques as
for the other scroll bar. The a and b parameters establish the characteristics' left and right pivot points.
Xa must be less than Xb.
RESULT: The values in the boxes to the left and right of the horizontal scroll bars change. A line appears in the graph to represent the curve you created.
Tip If desired, you can change the Xp value that appears above the
New button. The Xp value sets the maximum value for all three outputs. Click the value in the box and type a new value to change it. Click Scale to save the entries.
The Xb values change to match the new maximum.
4. Define Ya by clicking the scroll bar on the left near the left-hand border of the
dialog box. You can use the same techniques as for the other scroll bars. Define Yb by clicking the scroll bar on the right near the left-hand border of the
dialog box.
Ya can be higher or less than Yb. 5. If desired, select another Y output and define its curve. 6. Click OK to save.
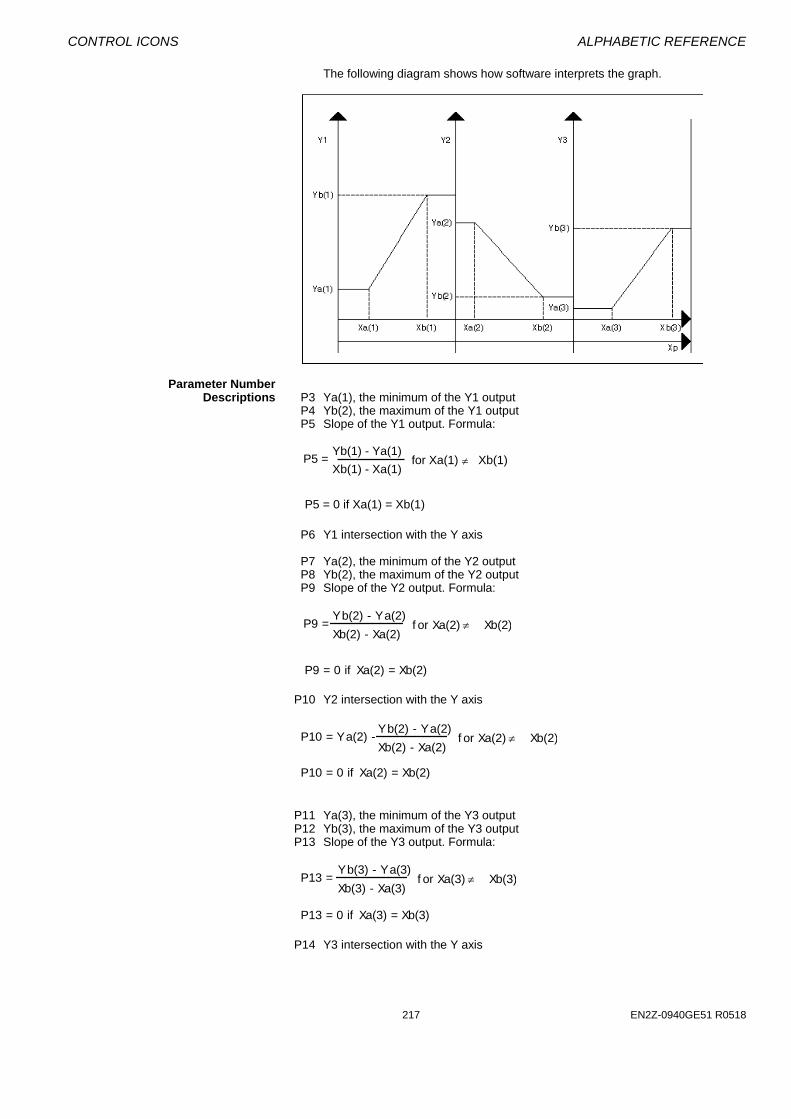
CONTROL ICONS ALPHABETIC REFERENCE
217 EN2Z-0940GE51 R0518
The following diagram shows how software interprets the graph.
Parameter Number Descriptions P3 Ya(1), the minimum of the Y1 output P4 Yb(2), the maximum of the Y1 output P5 Slope of the Y1 output. Formula:
P5 = 0 if Xa(1) = Xb(1)
Yb(1) - Ya(1)
Xb(1) - Xa(1)for Xa(1) Xb(1)P5 =
P6 Y1 intersection with the Y axis
P7 Ya(2), the minimum of the Y2 output P8 Yb(2), the maximum of the Y2 output P9 Slope of the Y2 output. Formula:
P9 = 0 if Xa(2) = Xb(2)
Yb(2) - Ya(2)
Xb(2) - Xa(2)f or Xa(2) Xb(2)P9 =
P10 Y2 intersection with the Y axis
P10 = 0 if Xa(2) = Xb(2)
Yb(2) - Ya(2)
Xb(2) - Xa(2)f or Xa(2) Xb(2)P10 = Ya(2) -
P11 Ya(3), the minimum of the Y3 output P12 Yb(3), the maximum of the Y3 output P13 Slope of the Y3 output. Formula:
P13 = 0 if Xa(3) = Xb(3)
Yb(3) - Ya(3)
Xb(3) - Xa(3)f or Xa(3) Xb(3)P13 =
P14 Y3 intersection with the Y axis
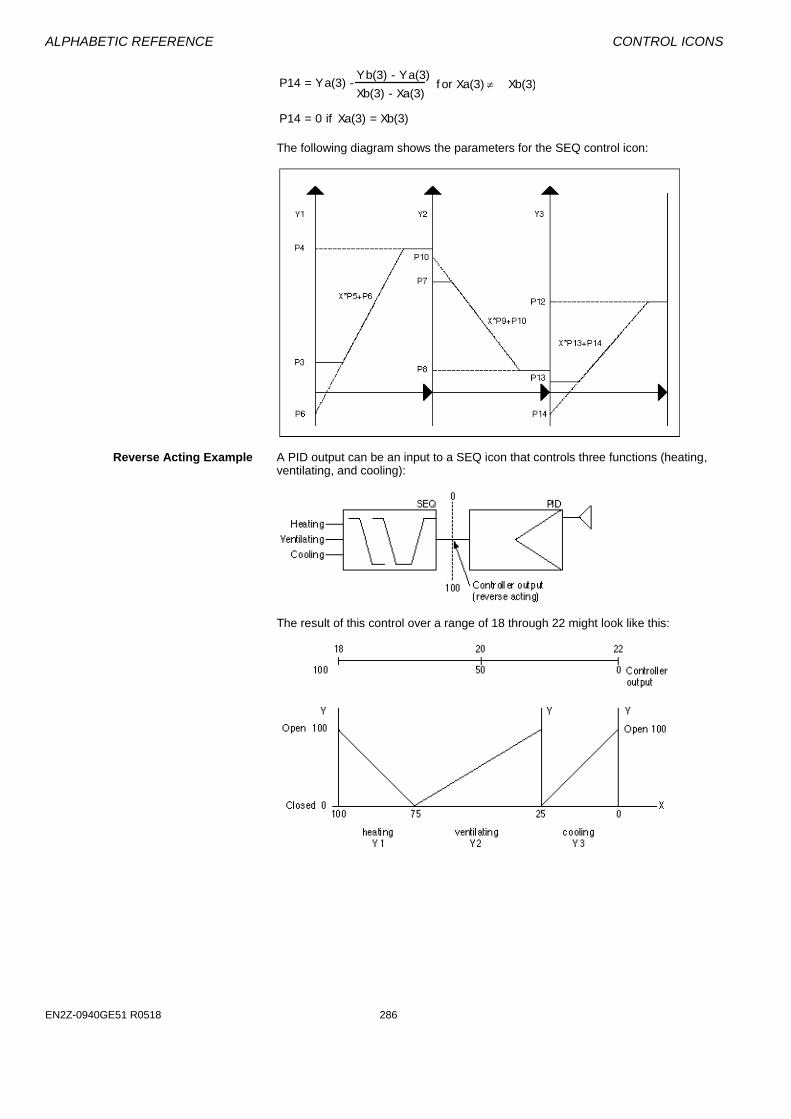
ALPHABETIC REFERENCE CONTROL ICONS
EN2Z-0940GE51 R0518 286
P14 = 0 if Xa(3) = Xb(3)
Yb(3) - Ya(3)
Xb(3) - Xa(3)f or Xa(3) Xb(3)P14 = Ya(3) -
The following diagram shows the parameters for the SEQ control icon:
Reverse Acting Example A PID output can be an input to a SEQ icon that controls three functions (heating,
ventilating, and cooling):
The result of this control over a range of 18 through 22 might look like this:
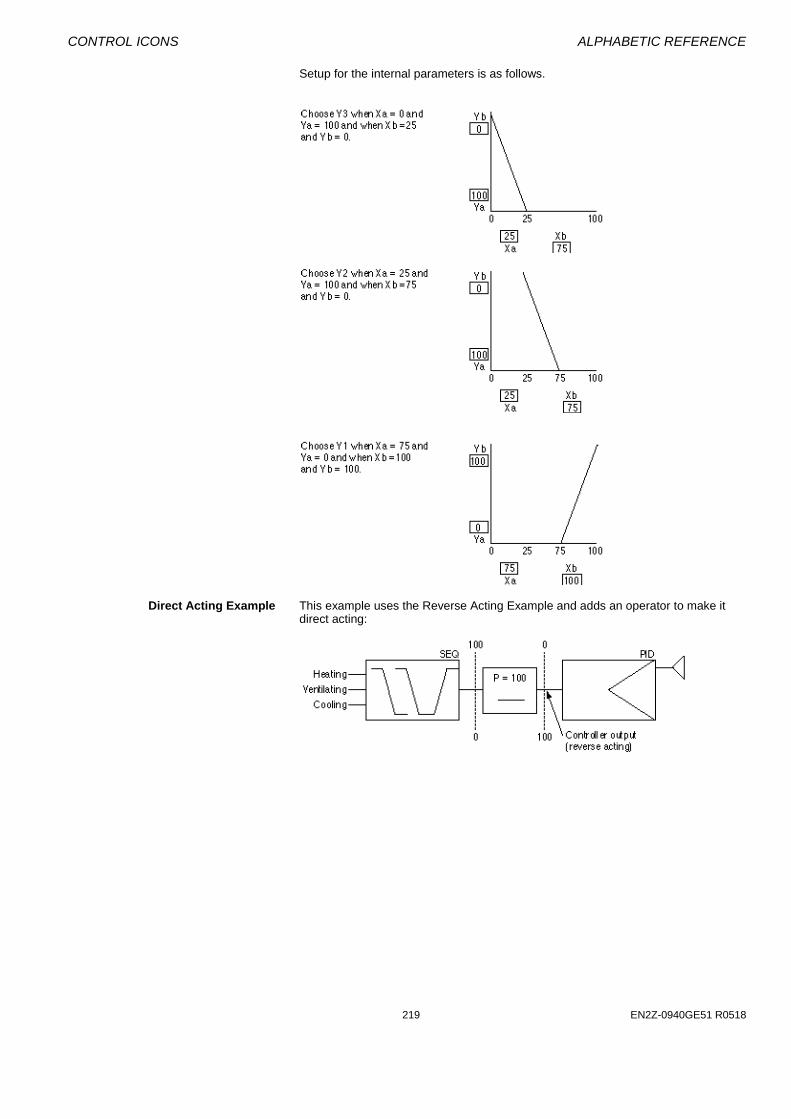
CONTROL ICONS ALPHABETIC REFERENCE
219 EN2Z-0940GE51 R0518
Setup for the internal parameters is as follows.
Direct Acting Example This example uses the Reverse Acting Example and adds an operator to make it
direct acting:
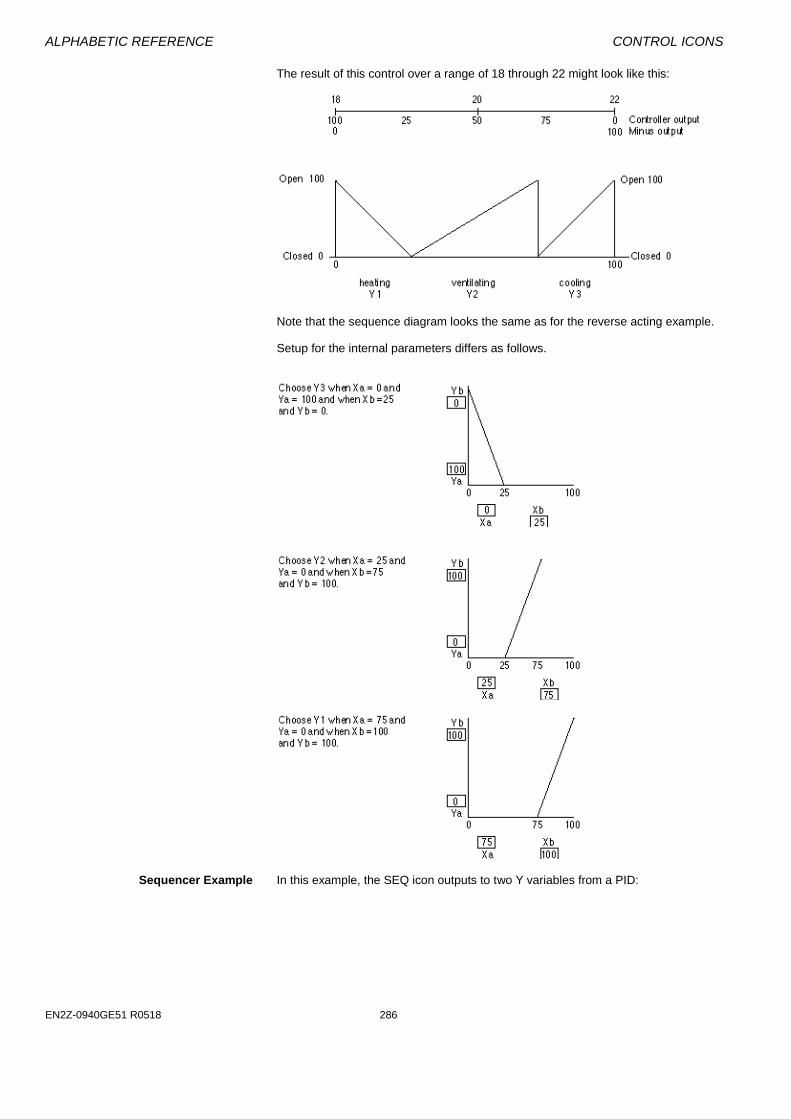
ALPHABETIC REFERENCE CONTROL ICONS
EN2Z-0940GE51 R0518 286
The result of this control over a range of 18 through 22 might look like this:
Note that the sequence diagram looks the same as for the reverse acting example. Setup for the internal parameters differs as follows.
Sequencer Example In this example, the SEQ icon outputs to two Y variables from a PID:
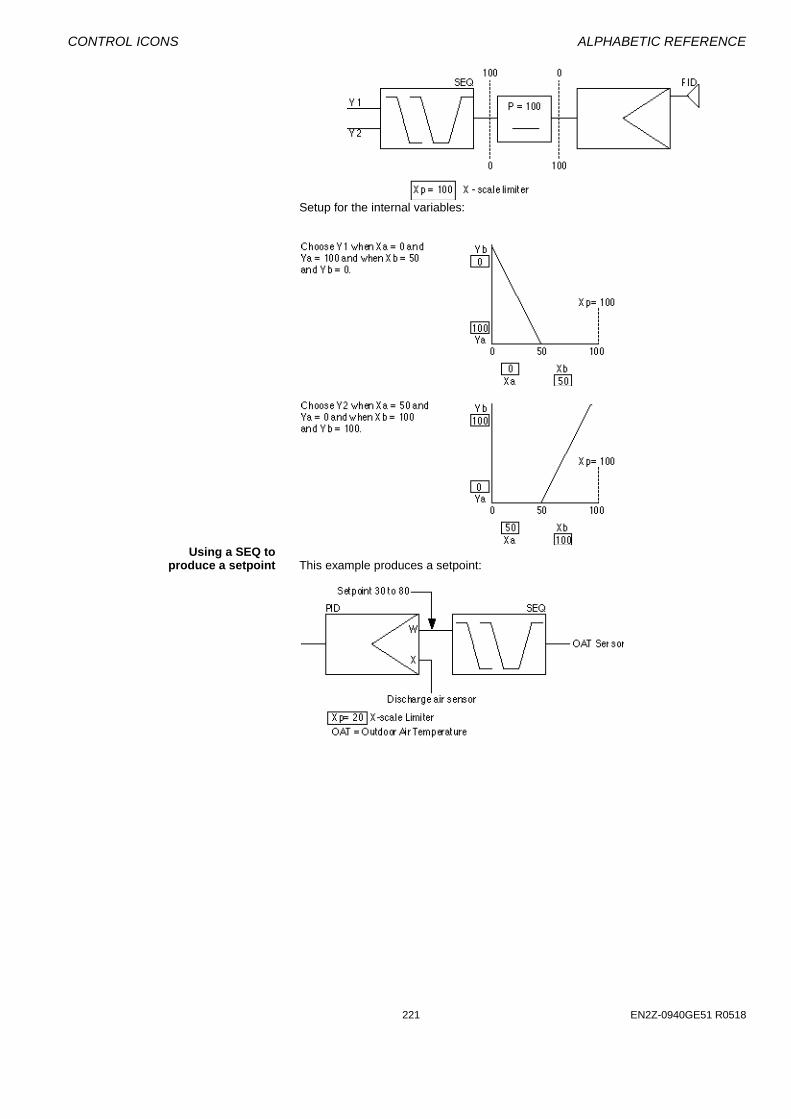
CONTROL ICONS ALPHABETIC REFERENCE
221 EN2Z-0940GE51 R0518
Setup for the internal variables:
Using a SEQ to produce a setpoint This example produces a setpoint:
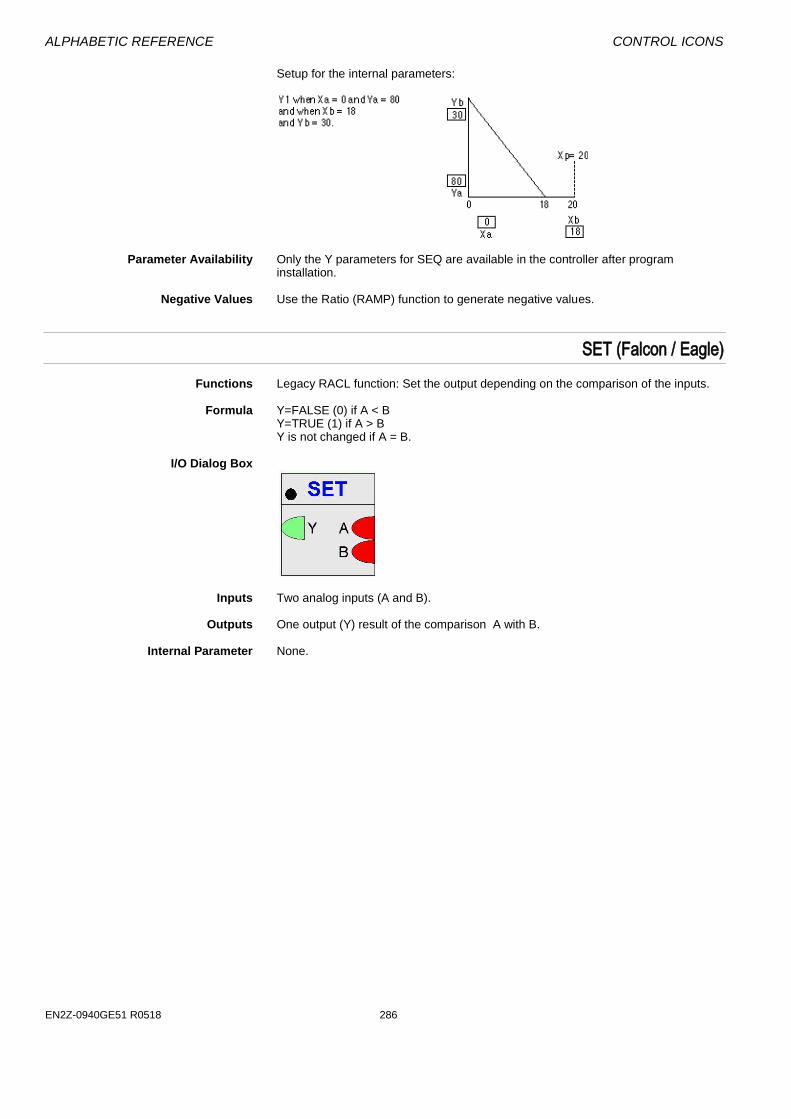
ALPHABETIC REFERENCE CONTROL ICONS
EN2Z-0940GE51 R0518 286
Setup for the internal parameters:
Parameter Availability Only the Y parameters for SEQ are available in the controller after program
installation. Negative Values Use the Ratio (RAMP) function to generate negative values.
SET (Falcon / Eagle)
Functions Legacy RACL function: Set the output depending on the comparison of the inputs. Formula Y=FALSE (0) if A < B
Y=TRUE (1) if A > B Y is not changed if A = B.
I/O Dialog Box
Inputs Two analog inputs (A and B). Outputs One output (Y) result of the comparison A with B. Internal Parameter None.
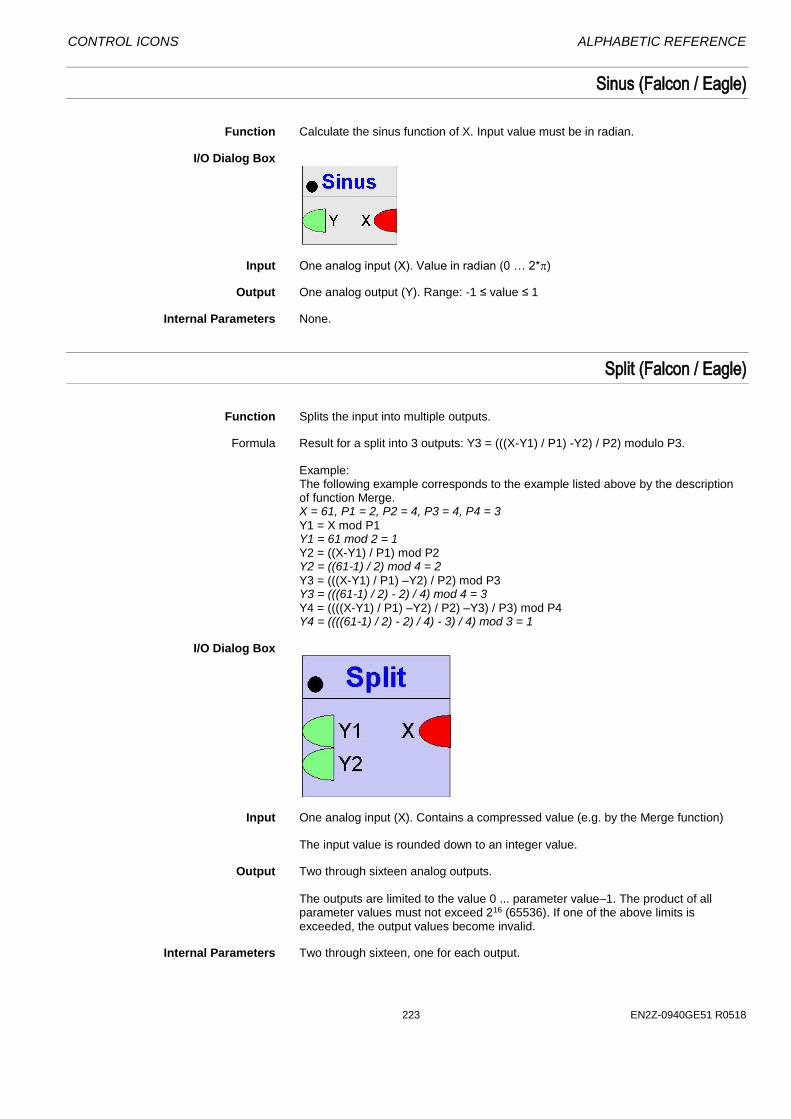
CONTROL ICONS ALPHABETIC REFERENCE
223 EN2Z-0940GE51 R0518
Sinus (Falcon / Eagle)
Function Calculate the sinus function of X. Input value must be in radian.
I/O Dialog Box
Input One analog input (X). Value in radian (0 … 2*) Output One analog output (Y). Range: -1 ≤ value ≤ 1 Internal Parameters None.
Split (Falcon / Eagle)
Function Splits the input into multiple outputs.
Formula Result for a split into 3 outputs: Y3 = (((X-Y1) / P1) -Y2) / P2) modulo P3.
Example: The following example corresponds to the example listed above by the description of function Merge. X = 61, P1 = 2, P2 = 4, P3 = 4, P4 = 3
Y1 = X mod P1 Y1 = 61 mod 2 = 1 Y2 = ((X-Y1) / P1) mod P2 Y2 = ((61-1) / 2) mod 4 = 2
Y3 = (((X-Y1) / P1) –Y2) / P2) mod P3 Y3 = (((61-1) / 2) - 2) / 4) mod 4 = 3 Y4 = ((((X-Y1) / P1) –Y2) / P2) –Y3) / P3) mod P4 Y4 = ((((61-1) / 2) - 2) / 4) - 3) / 4) mod 3 = 1
I/O Dialog Box
Input One analog input (X). Contains a compressed value (e.g. by the Merge function)
The input value is rounded down to an integer value.
Output Two through sixteen analog outputs.
The outputs are limited to the value 0 ... parameter value–1. The product of all parameter values must not exceed 216 (65536). If one of the above limits is exceeded, the output values become invalid.
Internal Parameters Two through sixteen, one for each output.

ALPHABETIC REFERENCE CONTROL ICONS
EN2Z-0940GE51 R0518 286
Square Root (Falcon / Eagle)
Function Calculates the square root of X. I/O Dialog Box
Input One analog input (X). Output One analog Output (Y). Internal Parameters None.

CONTROL ICONS ALPHABETIC REFERENCE
225 EN2Z-0940GE51 R0518
Subtract / DIF
Function Subtracts the sum of S (X2 … X6) (S1 … S32) inputs from the input value (X1) M.
You can also use this function to reverse a signal. See DIF Example. Formula Y = X1 - (X2 + X3 + through X6)
Y = M – (S1 + S2 + through S32) Falcon / Eagle I/O Dialog Box
Falcon / Eagle Inputs Two through six analog inputs (X1 through X6).
One minuend and up to thirty two (S1 through S32) subtrahends (Falcon / Eagle).
You can enter the first two inputs (minuend and first subtrahend) as parameters (engineering unit index number and value for each parameter). Not for Falcon / Eagle
Output One analog output (Y) (Result). Internal Parameters None. DIF Example This example shows how to reverse a controller signal:
Other Examples See the Examples chapter for other applications that use the DIF icon.
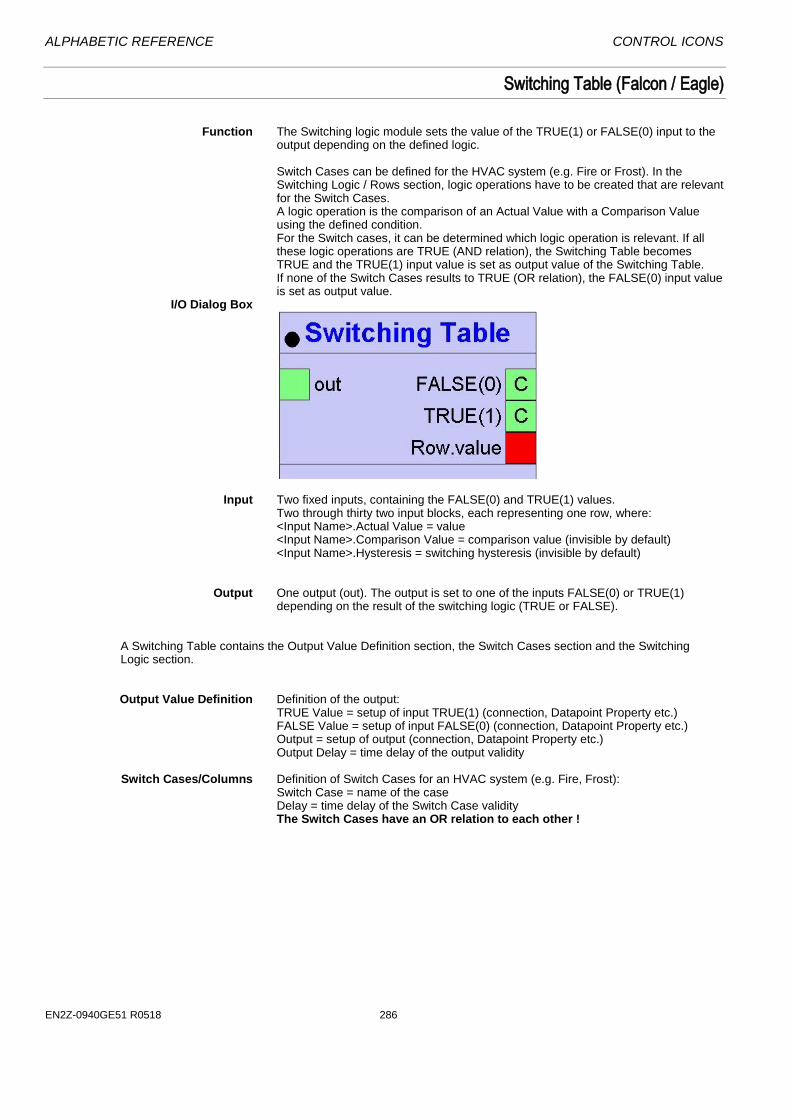
ALPHABETIC REFERENCE CONTROL ICONS
EN2Z-0940GE51 R0518 286
Switching Table (Falcon / Eagle)
Function The Switching logic module sets the value of the TRUE(1) or FALSE(0) input to the
output depending on the defined logic. Switch Cases can be defined for the HVAC system (e.g. Fire or Frost). In the Switching Logic / Rows section, logic operations have to be created that are relevant for the Switch Cases. A logic operation is the comparison of an Actual Value with a Comparison Value using the defined condition. For the Switch cases, it can be determined which logic operation is relevant. If all these logic operations are TRUE (AND relation), the Switching Table becomes TRUE and the TRUE(1) input value is set as output value of the Switching Table. If none of the Switch Cases results to TRUE (OR relation), the FALSE(0) input value is set as output value.
I/O Dialog Box
Input Two fixed inputs, containing the FALSE(0) and TRUE(1) values.
Two through thirty two input blocks, each representing one row, where: <Input Name>.Actual Value = value <Input Name>.Comparison Value = comparison value (invisible by default) <Input Name>.Hysteresis = switching hysteresis (invisible by default)
Output One output (out). The output is set to one of the inputs FALSE(0) or TRUE(1)
depending on the result of the switching logic (TRUE or FALSE).
A Switching Table contains the Output Value Definition section, the Switch Cases section and the Switching Logic section.
Output Value Definition Definition of the output:
TRUE Value = setup of input TRUE(1) (connection, Datapoint Property etc.) FALSE Value = setup of input FALSE(0) (connection, Datapoint Property etc.) Output = setup of output (connection, Datapoint Property etc.) Output Delay = time delay of the output validity
Switch Cases/Columns Definition of Switch Cases for an HVAC system (e.g. Fire, Frost):
Switch Case = name of the case Delay = time delay of the Switch Case validity The Switch Cases have an OR relation to each other !
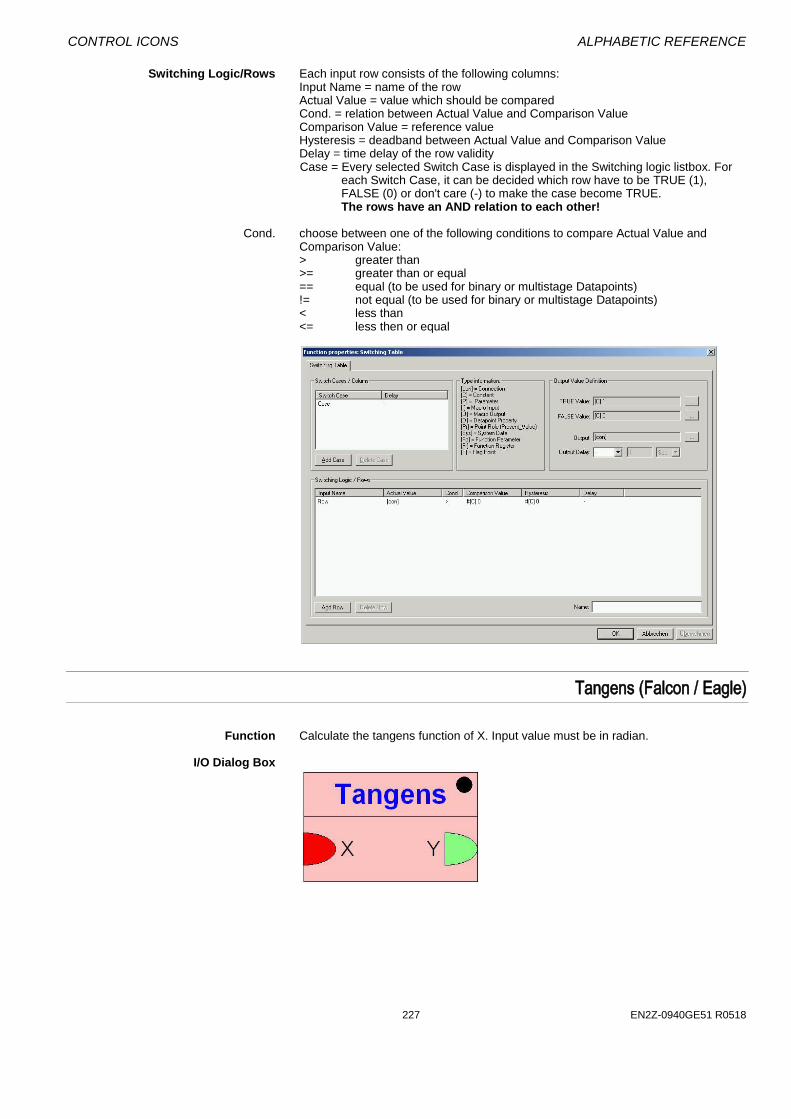
CONTROL ICONS ALPHABETIC REFERENCE
227 EN2Z-0940GE51 R0518
Switching Logic/Rows Each input row consists of the following columns: Input Name = name of the row Actual Value = value which should be compared Cond. = relation between Actual Value and Comparison Value Comparison Value = reference value Hysteresis = deadband between Actual Value and Comparison Value Delay = time delay of the row validity Case = Every selected Switch Case is displayed in the Switching logic listbox. For
each Switch Case, it can be decided which row have to be TRUE (1), FALSE (0) or don't care (-) to make the case become TRUE.
The rows have an AND relation to each other! Cond. choose between one of the following conditions to compare Actual Value and
Comparison Value: > greater than >= greater than or equal == equal (to be used for binary or multistage Datapoints) != not equal (to be used for binary or multistage Datapoints) < less than <= less then or equal
Tangens (Falcon / Eagle)
Function Calculate the tangens function of X. Input value must be in radian.
I/O Dialog Box
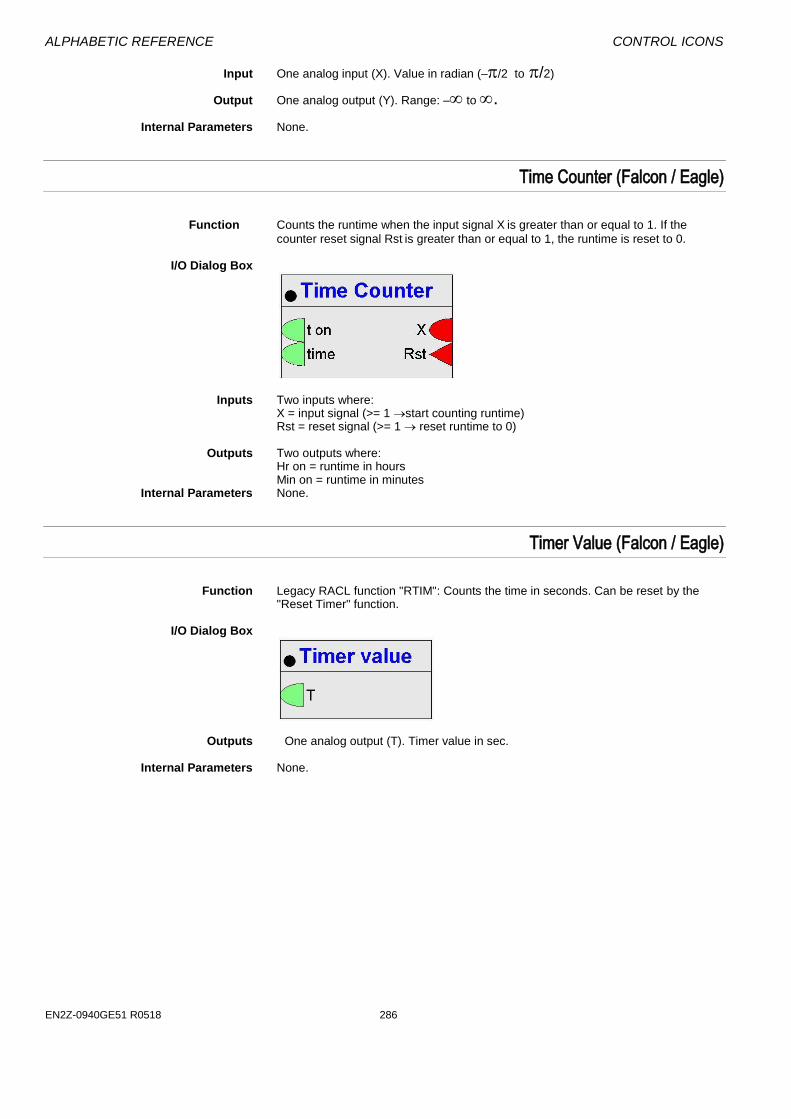
ALPHABETIC REFERENCE CONTROL ICONS
EN2Z-0940GE51 R0518 286
Input One analog input (X). Value in radian (–/2 to /2) Output One analog output (Y). Range: – to .
Internal Parameters None.
Time Counter (Falcon / Eagle)
Function Counts the runtime when the input signal X is greater than or equal to 1. If the
counter reset signal Rst is greater than or equal to 1, the runtime is reset to 0. I/O Dialog Box
Inputs Two inputs where:
X = input signal (>= 1 start counting runtime) Rst = reset signal (>= 1 reset runtime to 0)
Outputs Two outputs where:
Hr on = runtime in hours Min on = runtime in minutes
Internal Parameters None.
Timer Value (Falcon / Eagle)
Function Legacy RACL function "RTIM": Counts the time in seconds. Can be reset by the
"Reset Timer" function. I/O Dialog Box
Outputs One analog output (T). Timer value in sec. Internal Parameters None.
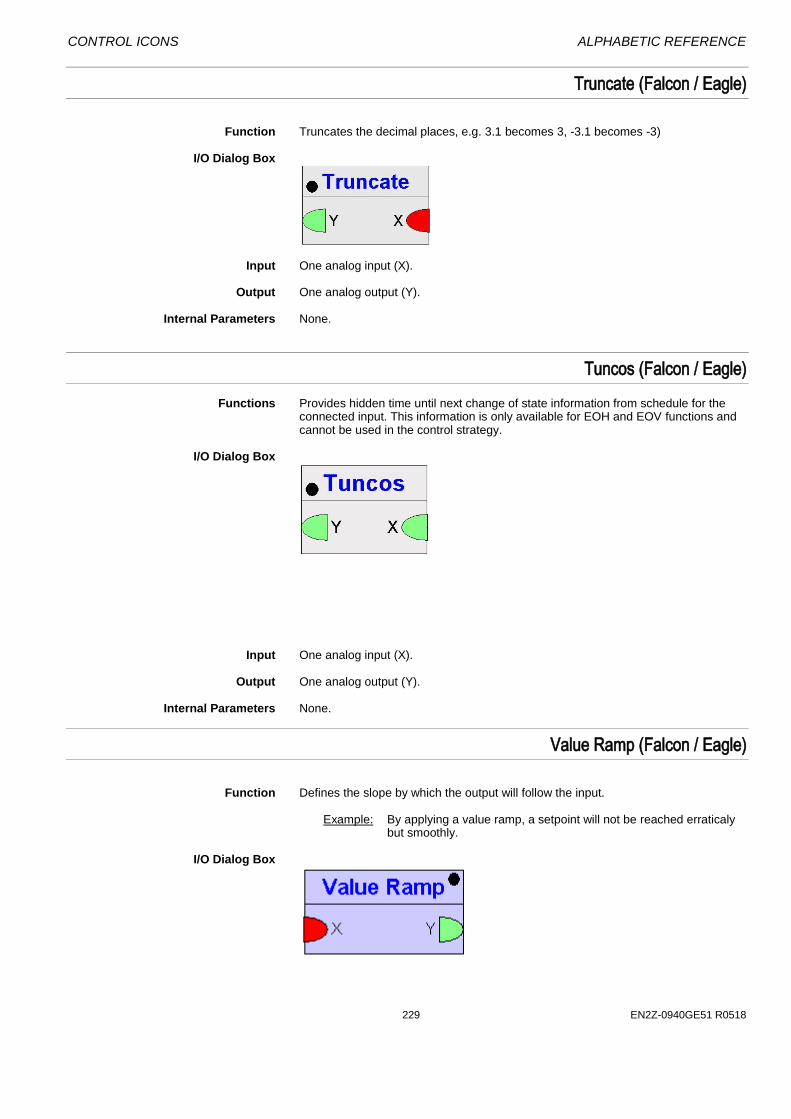
CONTROL ICONS ALPHABETIC REFERENCE
229 EN2Z-0940GE51 R0518
Truncate (Falcon / Eagle)
Function Truncates the decimal places, e.g. 3.1 becomes 3, -3.1 becomes -3) I/O Dialog Box
Input One analog input (X). Output One analog output (Y). Internal Parameters None.
Tuncos (Falcon / Eagle)
Functions Provides hidden time until next change of state information from schedule for the connected input. This information is only available for EOH and EOV functions and cannot be used in the control strategy.
I/O Dialog Box
Input One analog input (X). Output One analog output (Y). Internal Parameters None.
Value Ramp (Falcon / Eagle)
Function Defines the slope by which the output will follow the input.
Example: By applying a value ramp, a setpoint will not be reached erraticaly but smoothly.
I/O Dialog Box
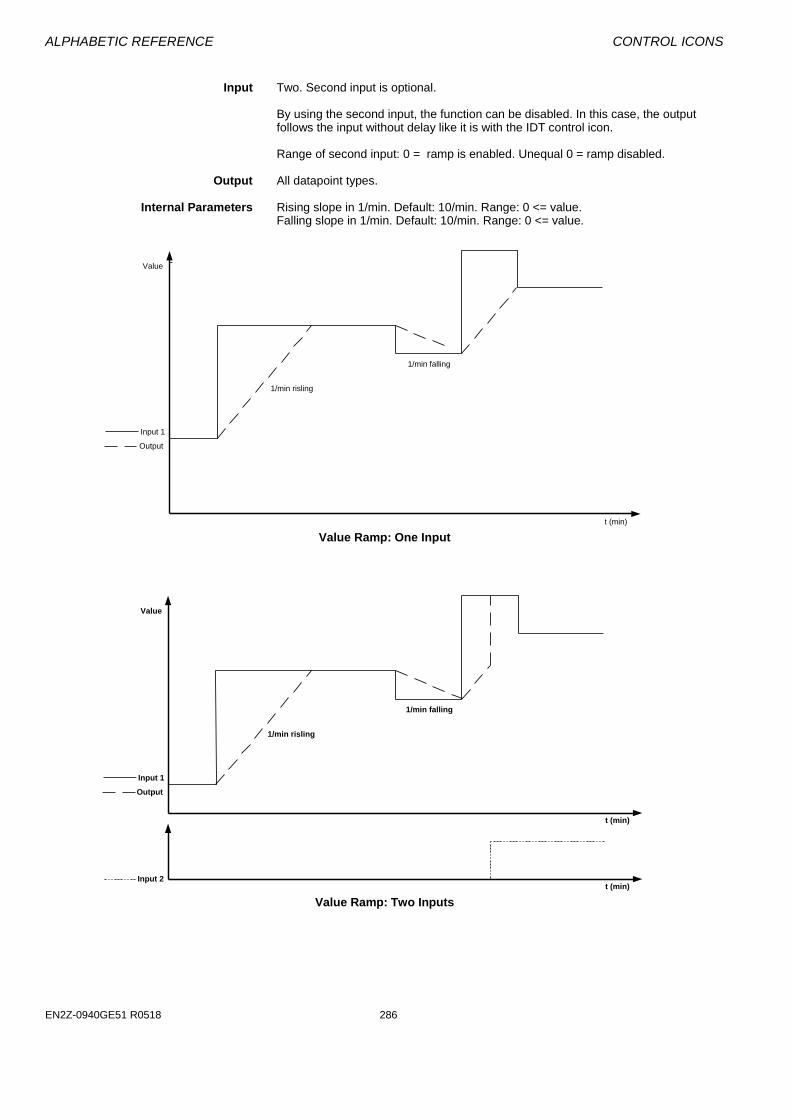
ALPHABETIC REFERENCE CONTROL ICONS
EN2Z-0940GE51 R0518 286
Input Two. Second input is optional.
By using the second input, the function can be disabled. In this case, the output
follows the input without delay like it is with the IDT control icon. Range of second input: 0 = ramp is enabled. Unequal 0 = ramp disabled. Output All datapoint types.
Internal Parameters Rising slope in 1/min. Default: 10/min. Range: 0 <= value.
Falling slope in 1/min. Default: 10/min. Range: 0 <= value.
Value Ramp: One Input
Value Ramp: Two Inputs
t (min)
Value
Output
Input 1
1/min falling
1/min risling
t (min)
Value
Output
Input 1
1/min falling
1/min risling
Input 2t (min)
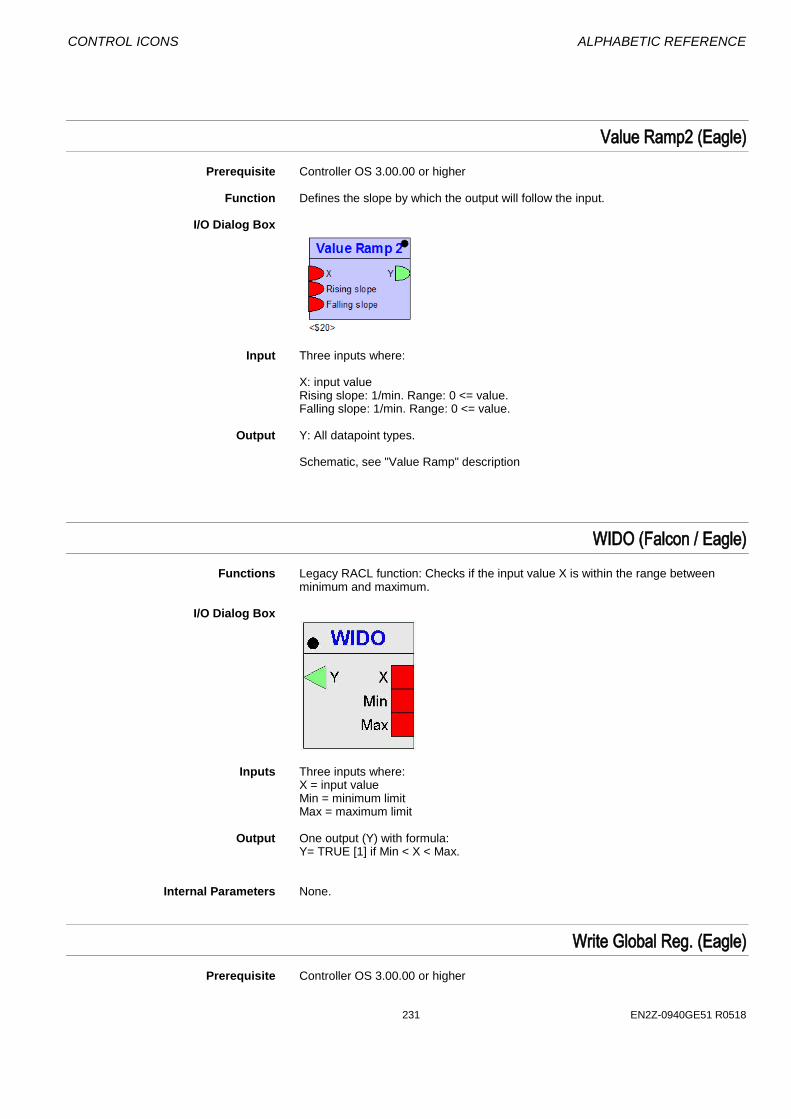
CONTROL ICONS ALPHABETIC REFERENCE
231 EN2Z-0940GE51 R0518
Value Ramp2 (Eagle)
Prerequisite Controller OS 3.00.00 or higher Function Defines the slope by which the output will follow the input. I/O Dialog Box
Input Three inputs where: X: input value
Rising slope: 1/min. Range: 0 <= value. Falling slope: 1/min. Range: 0 <= value.
Output Y: All datapoint types. Schematic, see "Value Ramp" description
WIDO (Falcon / Eagle)
Functions Legacy RACL function: Checks if the input value X is within the range between minimum and maximum.
I/O Dialog Box
Inputs Three inputs where:
X = input value Min = minimum limit Max = maximum limit
Output One output (Y) with formula:
Y= TRUE [1] if Min < X < Max. Internal Parameters None.
Write Global Reg. (Eagle)
Prerequisite Controller OS 3.00.00 or higher
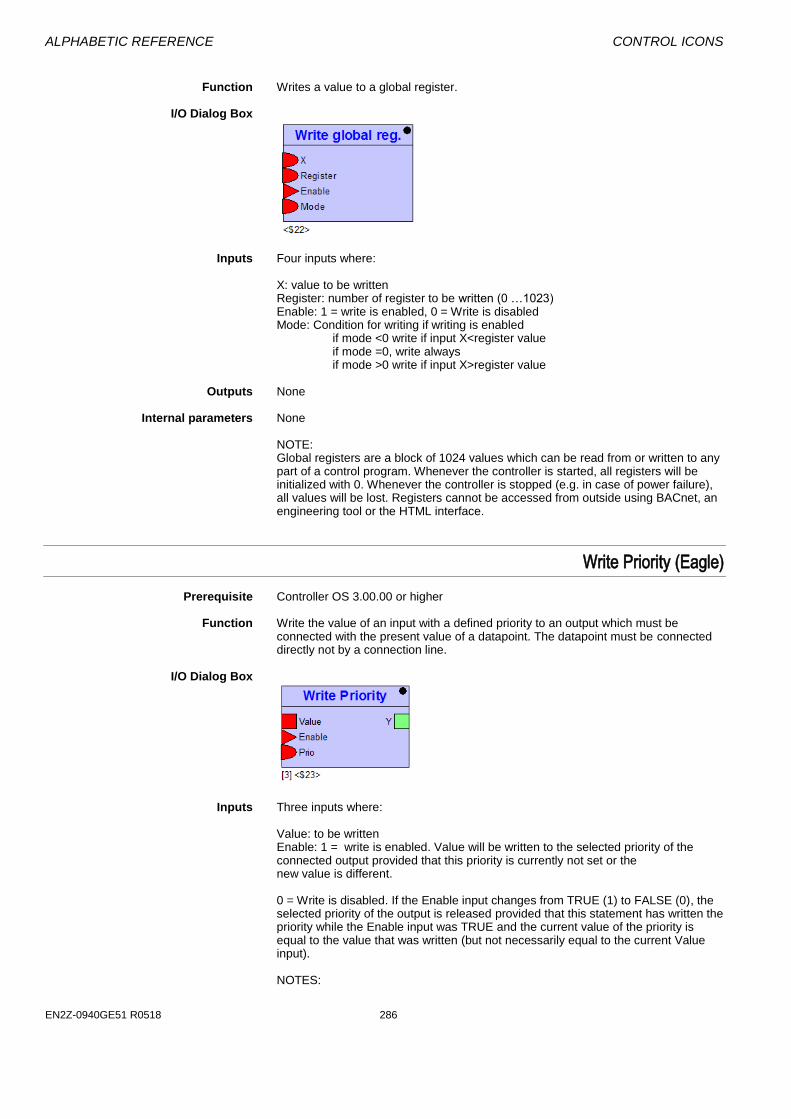
ALPHABETIC REFERENCE CONTROL ICONS
EN2Z-0940GE51 R0518 286
Function Writes a value to a global register. I/O Dialog Box
Inputs Four inputs where: X: value to be written Register: number of register to be written (0 …1023)
Enable: 1 = write is enabled, 0 = Write is disabled Mode: Condition for writing if writing is enabled
if mode <0 write if input X<register value if mode =0, write always
if mode >0 write if input X>register value Outputs None
Internal parameters None
NOTE: Global registers are a block of 1024 values which can be read from or written to any part of a control program. Whenever the controller is started, all registers will be initialized with 0. Whenever the controller is stopped (e.g. in case of power failure), all values will be lost. Registers cannot be accessed from outside using BACnet, an engineering tool or the HTML interface.
Write Priority (Eagle)
Prerequisite Controller OS 3.00.00 or higher Function Write the value of an input with a defined priority to an output which must be
connected with the present value of a datapoint. The datapoint must be connected directly not by a connection line.
I/O Dialog Box
Inputs Three inputs where: Value: to be written Enable: 1 = write is enabled. Value will be written to the selected priority of the
connected output provided that this priority is currently not set or the new value is different.
0 = Write is disabled. If the Enable input changes from TRUE (1) to FALSE (0), the
selected priority of the output is released provided that this statement has written the priority while the Enable input was TRUE and the current value of the priority is equal to the value that was written (but not necessarily equal to the current Value input). NOTES:

CONTROL ICONS ALPHABETIC REFERENCE
233 EN2Z-0940GE51 R0518
• It is strongly recommended not to change the priority while the Enable input is TRUE (1) or in the first cycle when it is FALSE. Using a constant for the priority will avoid unexpected misbehavior.
• If the Enable input is FALSE in the first executed cycle after application start the
priority is always released. Prio: priority level that will be applied for writing
Levels are 2-16
Outputs One output: Y = present value of datapoint Internal parameters None
Write / WIA
Function Write a value to an attribute of a user address. The value can come from a
parameter, physical point, or another control icon. WIA writes to a maximum of three attributes for one point.
Initial Dialog Box The WIA icon displays the following dialog box when you first place the icon in the
work space and click it. Select the point you want to write to and then connect it to the ADR output in the WIA box.
Output One point, any type (ADR). Attribute Selection Dialog Box After you connect an output to ADR, the Attribute Selection dialog box displays.
Select the desired attributes.
1. Select desired attributes by clicking the down arrow to display options and then
clicking desired attribute. (See Attributes Table for possible selections.) Click OK to save selections and close the dialog box. (Cancel closes the dialog
box without saving selections.)
RESULT The dialog box closes. The control strategy work space displays.

ALPHABETIC REFERENCE CONTROL ICONS
EN2Z-0940GE51 R0518 286
2. Click the WIA icon to display the secondary WIA I/O dialog box. Connect input attributes to other control icons or points as desired.
Inputs One digital input (XD1) to enable/disable write. Enable =1; disable = 0.
Two input values (1-255) for priority (X2 and X3). X2 is command priority. X3 is residual (overwrite) priority. If X3 is set to 0, there is no change. See Priorities note. One through three points, parameters, or control icon inputs (AD1, A2, and AD3). Note that a letter D after the A indicates a digital attribute. You can enter any of the inputs as parameters (engineering unit index number and value for each parameter).
Internal Parameters None. WIA Operation Flowchart The following flowchart illustrates WIA logic with input XD1 (enable/disable) and the
priority inputs (X2 and X3).
YES
YES
YES
NO
NO
NO
Set New Access Priority
Write Attributes
X3=0
X1=1
X2> Access Priority
END
WIA Operation Diagram
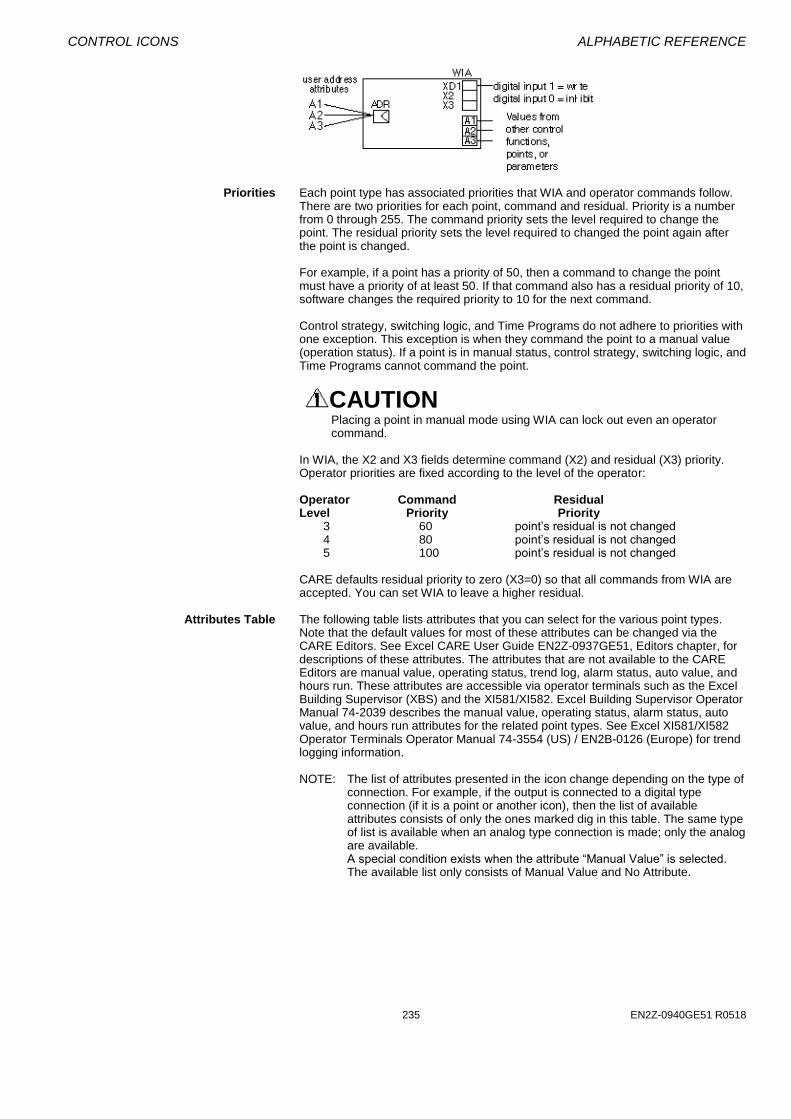
CONTROL ICONS ALPHABETIC REFERENCE
235 EN2Z-0940GE51 R0518
Priorities Each point type has associated priorities that WIA and operator commands follow.
There are two priorities for each point, command and residual. Priority is a number from 0 through 255. The command priority sets the level required to change the point. The residual priority sets the level required to changed the point again after the point is changed.
For example, if a point has a priority of 50, then a command to change the point must have a priority of at least 50. If that command also has a residual priority of 10, software changes the required priority to 10 for the next command. Control strategy, switching logic, and Time Programs do not adhere to priorities with one exception. This exception is when they command the point to a manual value (operation status). If a point is in manual status, control strategy, switching logic, and Time Programs cannot command the point.
CAUTION Placing a point in manual mode using WIA can lock out even an operator command.
In WIA, the X2 and X3 fields determine command (X2) and residual (X3) priority. Operator priorities are fixed according to the level of the operator:
Operator Command Residual Level Priority Priority 3 60 point’s residual is not changed 4 80 point’s residual is not changed 5 100 point’s residual is not changed
CARE defaults residual priority to zero (X3=0) so that all commands from WIA are accepted. You can set WIA to leave a higher residual.
Attributes Table The following table lists attributes that you can select for the various point types.
Note that the default values for most of these attributes can be changed via the CARE Editors. See Excel CARE User Guide EN2Z-0937GE51, Editors chapter, for descriptions of these attributes. The attributes that are not available to the CARE Editors are manual value, operating status, trend log, alarm status, auto value, and hours run. These attributes are accessible via operator terminals such as the Excel Building Supervisor (XBS) and the XI581/XI582. Excel Building Supervisor Operator Manual 74-2039 describes the manual value, operating status, alarm status, auto value, and hours run attributes for the related point types. See Excel XI581/XI582 Operator Terminals Operator Manual 74-3554 (US) / EN2B-0126 (Europe) for trend logging information. NOTE: The list of attributes presented in the icon change depending on the type of
connection. For example, if the output is connected to a digital type connection (if it is a point or another icon), then the list of available attributes consists of only the ones marked dig in this table. The same type of list is available when an analog type connection is made; only the analog are available. A special condition exists when the attribute “Manual Value” is selected. The available list only consists of Manual Value and No Attribute.
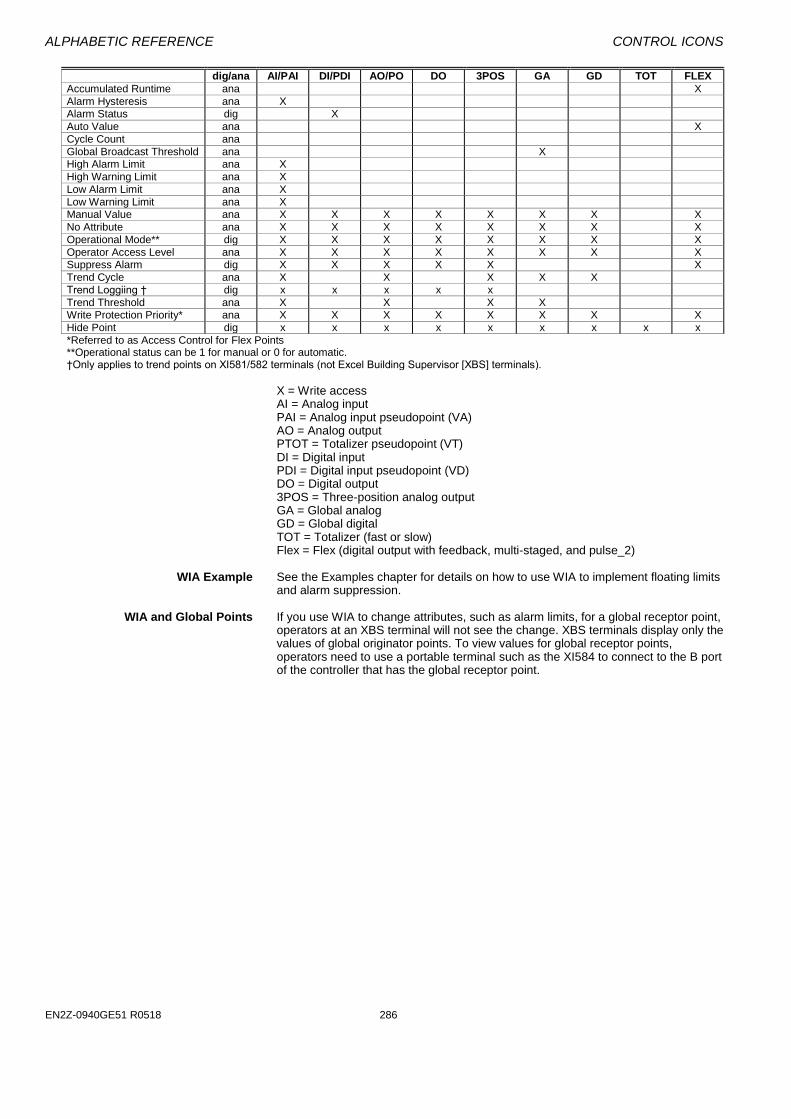
ALPHABETIC REFERENCE CONTROL ICONS
EN2Z-0940GE51 R0518 286
dig/ana AI/PAI DI/PDI AO/PO DO 3POS GA GD TOT FLEX
Accumulated Runtime ana X
Alarm Hysteresis ana X Alarm Status dig X
Auto Value ana X
Cycle Count ana
Global Broadcast Threshold ana X High Alarm Limit ana X
High Warning Limit ana X
Low Alarm Limit ana X
Low Warning Limit ana X Manual Value ana X X X X X X X X
No Attribute ana X X X X X X X X
Operational Mode** dig X X X X X X X X
Operator Access Level ana X X X X X X X X Suppress Alarm dig X X X X X X
Trend Cycle ana X X X X X
Trend Loggiing † dig x x x x x
Trend Threshold ana X X X X Write Protection Priority* ana X X X X X X X X
Hide Point dig x x x x x x x x x
*Referred to as Access Control for Flex Points **Operational status can be 1 for manual or 0 for automatic. †Only applies to trend points on XI581/582 terminals (not Excel Building Supervisor [XBS] terminals).
X = Write access AI = Analog input PAI = Analog input pseudopoint (VA) AO = Analog output PTOT = Totalizer pseudopoint (VT) DI = Digital input PDI = Digital input pseudopoint (VD) DO = Digital output 3POS = Three-position analog output GA = Global analog GD = Global digital TOT = Totalizer (fast or slow) Flex = Flex (digital output with feedback, multi-staged, and pulse_2)
WIA Example See the Examples chapter for details on how to use WIA to implement floating limits
and alarm suppression. WIA and Global Points If you use WIA to change attributes, such as alarm limits, for a global receptor point,
operators at an XBS terminal will not see the change. XBS terminals display only the values of global originator points. To view values for global receptor points, operators need to use a portable terminal such as the XI584 to connect to the B port of the controller that has the global receptor point.
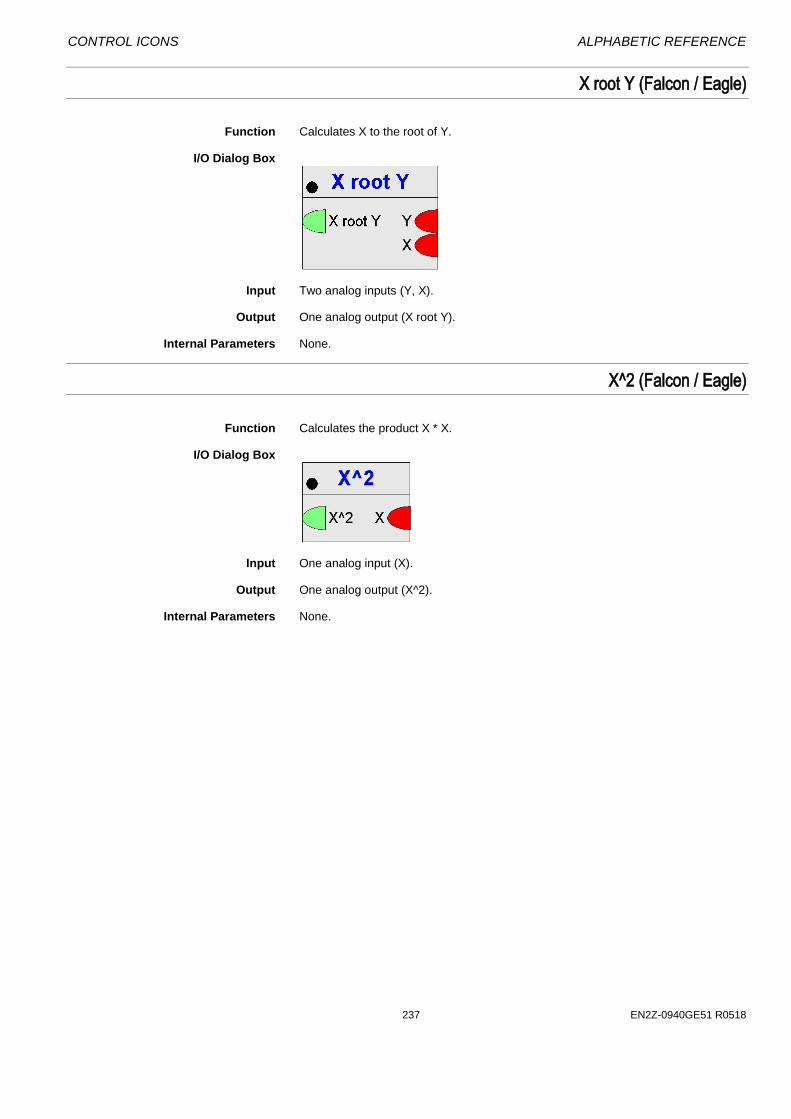
CONTROL ICONS ALPHABETIC REFERENCE
237 EN2Z-0940GE51 R0518
X root Y (Falcon / Eagle)
Function Calculates X to the root of Y. I/O Dialog Box
Input Two analog inputs (Y, X). Output One analog output (X root Y). Internal Parameters None.
X^2 (Falcon / Eagle)
Function Calculates the product X * X. I/O Dialog Box
Input One analog input (X). Output One analog output (X^2). Internal Parameters None.
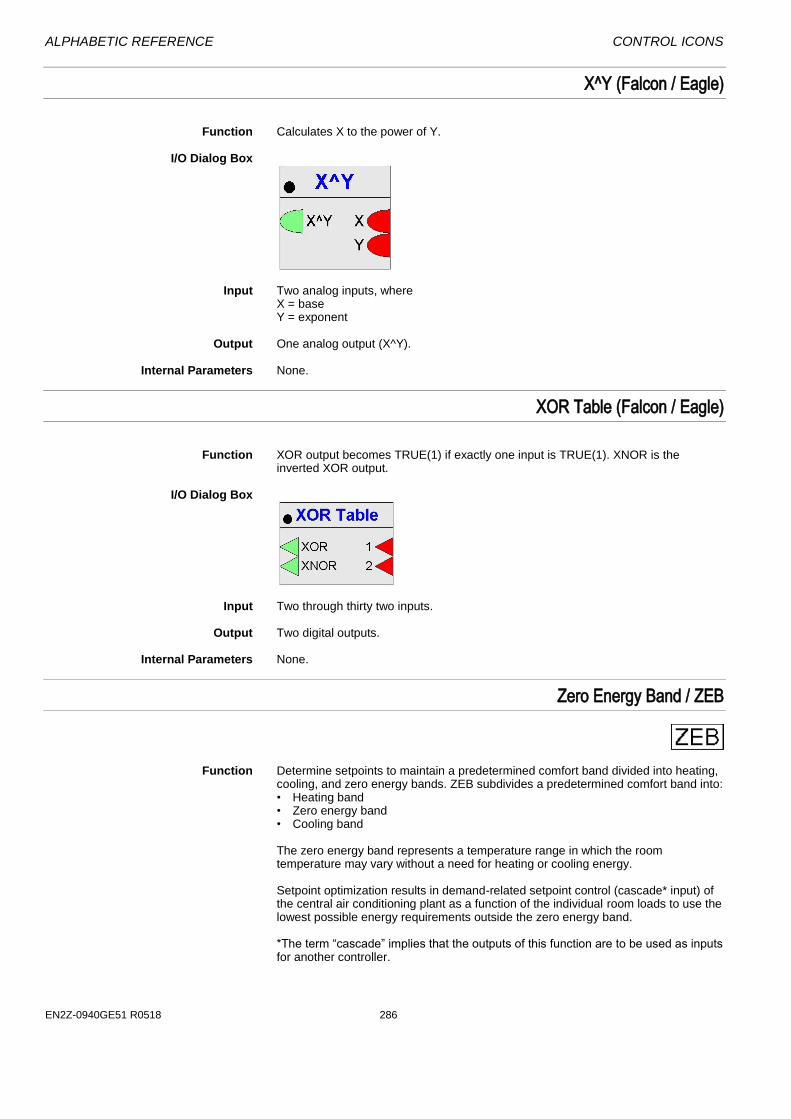
ALPHABETIC REFERENCE CONTROL ICONS
EN2Z-0940GE51 R0518 286
X^Y (Falcon / Eagle)
Function Calculates X to the power of Y. I/O Dialog Box
Input Two analog inputs, where
X = base Y = exponent
Output One analog output (X^Y). Internal Parameters None.
XOR Table (Falcon / Eagle)
Function XOR output becomes TRUE(1) if exactly one input is TRUE(1). XNOR is the
inverted XOR output. I/O Dialog Box
Input Two through thirty two inputs. Output Two digital outputs. Internal Parameters None.
Zero Energy Band / ZEB
Function Determine setpoints to maintain a predetermined comfort band divided into heating,
cooling, and zero energy bands. ZEB subdivides a predetermined comfort band into: • Heating band • Zero energy band • Cooling band
The zero energy band represents a temperature range in which the room temperature may vary without a need for heating or cooling energy. Setpoint optimization results in demand-related setpoint control (cascade* input) of the central air conditioning plant as a function of the individual room loads to use the lowest possible energy requirements outside the zero energy band. *The term “cascade” implies that the outputs of this function are to be used as inputs for another controller.
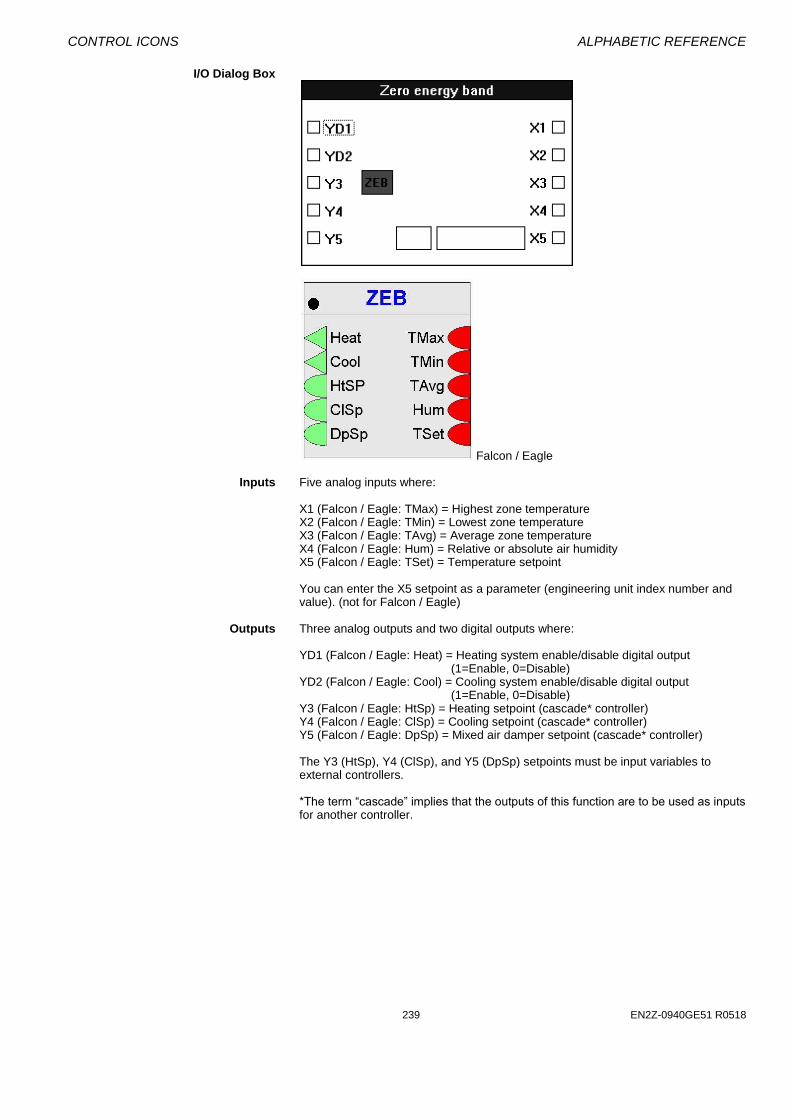
CONTROL ICONS ALPHABETIC REFERENCE
239 EN2Z-0940GE51 R0518
I/O Dialog Box
Falcon / Eagle Inputs Five analog inputs where:
X1 (Falcon / Eagle: TMax) = Highest zone temperature X2 (Falcon / Eagle: TMin) = Lowest zone temperature X3 (Falcon / Eagle: TAvg) = Average zone temperature X4 (Falcon / Eagle: Hum) = Relative or absolute air humidity X5 (Falcon / Eagle: TSet) = Temperature setpoint You can enter the X5 setpoint as a parameter (engineering unit index number and value). (not for Falcon / Eagle)
Outputs Three analog outputs and two digital outputs where:
YD1 (Falcon / Eagle: Heat) = Heating system enable/disable digital output (1=Enable, 0=Disable)
YD2 (Falcon / Eagle: Cool) = Cooling system enable/disable digital output (1=Enable, 0=Disable)
Y3 (Falcon / Eagle: HtSp) = Heating setpoint (cascade* controller) Y4 (Falcon / Eagle: ClSp) = Cooling setpoint (cascade* controller) Y5 (Falcon / Eagle: DpSp) = Mixed air damper setpoint (cascade* controller) The Y3 (HtSp), Y4 (ClSp), and Y5 (DpSp) setpoints must be input variables to external controllers. *The term “cascade” implies that the outputs of this function are to be used as inputs for another controller.
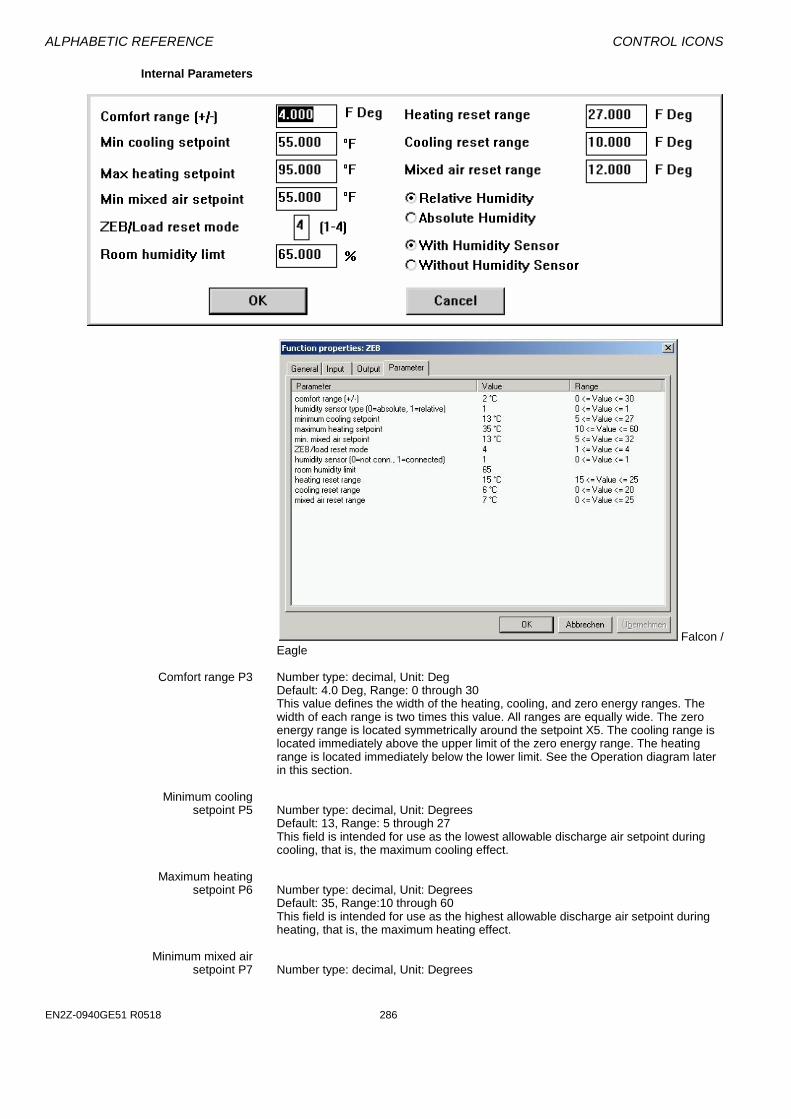
ALPHABETIC REFERENCE CONTROL ICONS
EN2Z-0940GE51 R0518 286
Internal Parameters
Falcon / Eagle
Comfort range P3 Number type: decimal, Unit: Deg Default: 4.0 Deg, Range: 0 through 30 This value defines the width of the heating, cooling, and zero energy ranges. The width of each range is two times this value. All ranges are equally wide. The zero energy range is located symmetrically around the setpoint X5. The cooling range is located immediately above the upper limit of the zero energy range. The heating range is located immediately below the lower limit. See the Operation diagram later in this section.
Minimum cooling setpoint P5 Number type: decimal, Unit: Degrees
Default: 13, Range: 5 through 27 This field is intended for use as the lowest allowable discharge air setpoint during cooling, that is, the maximum cooling effect.
Maximum heating setpoint P6 Number type: decimal, Unit: Degrees
Default: 35, Range:10 through 60 This field is intended for use as the highest allowable discharge air setpoint during heating, that is, the maximum heating effect.
Minimum mixed air setpoint P7 Number type: decimal, Unit: Degrees
CONTROL ICONS ALPHABETIC REFERENCE
241 EN2Z-0940GE51 R0518
Default: 13, Range: 5 through 32 Lowest mixed air, or discharge air setpoint while in the ZEB range.
ZEB/Load reset mode P8 1 = ZEB (Zero energy band)
2 = Heating control setpoint 3 = Cooling control setpoint 4 = Heating and cooling control setpoint
Room humidity limit P10 Number type: decimal, Unit: Percent
Default: 65 percent rh, Range: 40 through 80 percent rh Heating reset range P11 Number type: decimal, Unit: Deg
Default: 15, Range: 15 through 25 Cooling reset range P12 Number type: decimal, Unit: Deg
Default: 6K, Range: 0 through 20 Mixed air reset range P13 Number type: decimal, Unit: Deg
Default: 7, Range: 0 through 25 humidity sensor type (radio button) P4 Selection of the type of the humidity sensor (relative or absolute humidity).
Range: 0 through 1, default: 1 (1= relative, 0= absolute) humidity sensor (radio button) P9 Selection whether or not a humidity sensor is connected.
Range: 0 through 1, default: 1 (1= with sensor, 0= no sensor) Parameter Number Descriptions P3 Comfort range P4 Relative (1) or absolute (0) humidity sensor P5 Minimum cooling setpoint P6 Maximum heating setpoint P7 Minimum mixed air setpoint P8 ZEB/Load reset mode:
1=ZEB 2=Heating control setpoint 3=Cooling control setpoint 4=Heating and cooling control setpoint P9 With (1) or without (0) humidity sensor P10 Room humidity limit P11 Heating reset range P12 Cooling reset range P13 Mixed air reset range P14 Setpoint X5, if X5 is a parameter (not for Falcon / Eagle). :
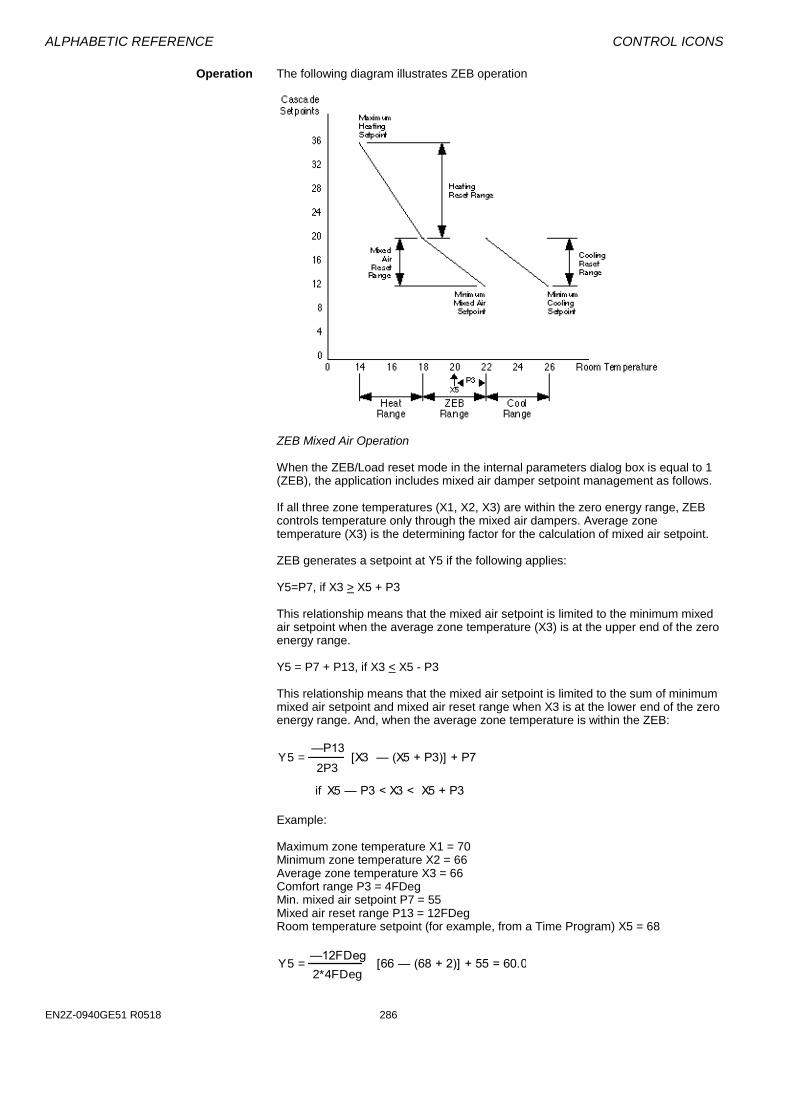
ALPHABETIC REFERENCE CONTROL ICONS
EN2Z-0940GE51 R0518 286
Operation The following diagram illustrates ZEB operation
ZEB Mixed Air Operation When the ZEB/Load reset mode in the internal parameters dialog box is equal to 1 (ZEB), the application includes mixed air damper setpoint management as follows. If all three zone temperatures (X1, X2, X3) are within the zero energy range, ZEB controls temperature only through the mixed air dampers. Average zone temperature (X3) is the determining factor for the calculation of mixed air setpoint. ZEB generates a setpoint at Y5 if the following applies: Y5=P7, if X3 > X5 + P3 This relationship means that the mixed air setpoint is limited to the minimum mixed air setpoint when the average zone temperature (X3) is at the upper end of the zero energy range. Y5 = P7 + P13, if X3 < X5 - P3 This relationship means that the mixed air setpoint is limited to the sum of minimum mixed air setpoint and mixed air reset range when X3 is at the lower end of the zero energy range. And, when the average zone temperature is within the ZEB:
Y5 = —P13
2P3[X3 — (X5 + P3)] + P7
if X5 — P3 < X3 < X5 + P3
Example: Maximum zone temperature X1 = 70 Minimum zone temperature X2 = 66 Average zone temperature X3 = 66 Comfort range P3 = 4FDeg Min. mixed air setpoint P7 = 55 Mixed air reset range P13 = 12FDeg Room temperature setpoint (for example, from a Time Program) X5 = 68
Y5 = —12FDeg
2*4FDeg[66 — (68 + 2)] + 55 = 60.0

CONTROL ICONS ALPHABETIC REFERENCE
243 EN2Z-0940GE51 R0518
ZEB Cooling Operation When the ZEB/Load reset mode (P8) in the internal parameters dialog box is equal to 1 (ZEB), 3 (Cooling control), or 4 (Heating and cooling), the ZEB energy management function calculates a cooling setpoint as follows. If the warmest temperature sensor value goes above the ZEB upper limit, mechanical cooling is enabled. Cooling is then controlled to maintain the cooling setpoint, Y4. To calculate the cooling setpoint, the maximum zone temperature (the highest value of all the configured zone sensors), Input X1, is required. Then the cooling setpoint is calculated based on a linear relationship with X1 and is sent to output Y4.
If the highest zone temperature is at or above the upper limit of the cooling band, then the minimum (lowest) cooling setpoint, P5, is used. This upper cooling band limit is specified by adding 3 times the comfort range, P3 (typically set to 4FDeg), to the room temperature setpoint (Input X5): Y4=P5, if X1 > X5 + (3*P3) If the highest zone temperature is at or below the lower limit of the cooling band, an offset called the “cooling reset range” (P12) is added to the minimum cooling setpoint, P5, and this sum is used for the cooling setpoint, Y4. The lower cooling band limit is specified by adding the comfort range, P3, to the room temperature setpoint, X5: Y4 = P5 + P12, if X1 < X5 + P3 When the highest zone temperature is inside the cooling band, the cooling setpoint, Y4, is calculated with the following formula:
Y4 = —P12
2P3[X1 — (X5 + 3P3)] + P5
if (X5 + P3) < X1 < (X5 * 3P3)
If the highest zone temperature sensor value is in the cooling band area (or higher), mechanical cooling is enabled, that is, YD2 is set to 1. Example: Maximum zone temperature X1 = 75 Minimum zone temperature X2 = 66 Average zone temperature X3 = 68 Room temperature setpoint X5 = 68 Comfort range P3 = 4FDeg Min. cooling setpoint P5 = 55 Cooling reset range P12 = 10FDeg
Y4 = —10FDeg
2*4FDeg[75 — (68 + 3*4FDeg)] + 55 = 61.25
ZEB Heating Operation When the ZEB/Load reset mode in the internal parameters dialog box is equal to 1 (ZEB), 2 (Heating control), or 4 (Heating and cooling), the application also includes heating setpoint management as follows. If the zone temperature falls below the zero energy range, ZEB implements a linear release of the heating energy through a continuous increase of the heating setpoint (Y3). The minimum zone temperature (X2) is the determining factor for the release of heating and the calculation of the heating setpoint (Y3). Y3=P6, if X2 < X5 - (3*P3)

ALPHABETIC REFERENCE CONTROL ICONS
EN2Z-0940GE51 R0518 286
This relationship means that the maximum heating setpoint (P6) is demanded when the lowest zone temperature is at or below the lower end of the heating range. Y3 = P6 -P11, if X2 = X5 - P3 This relationship means that the maximum heating setpoint (P6) minus the heating reset range (P11) is demanded when the lowest zone temperature just falls below the zero energy range.
Y3 = —P11
2P3[X2 — (X5 - 3P3)] + P6
if X5 — 3P3 < X2 < X5 - P3
If the lowest zone temperature is in this range, ZEB enables heating, that is, it assigns 1 to YD1. Example: Maximum zone temperature X1 = 68 Minimum zone temperature X2 = 61 Average zone temperature X3 = 66 Comfort range P3 = 4FDeg Max. heating setpoint P6 = 95 Heating reset range P11 = 27FDeg
2*4FDegY3 =
—27FDeg[61 — (68 + 3*4FDeg)] + 95 = 159.0
ZEB Dehumidification When the ZEB/Load reset mode in the internal parameters dialog box is equal to 1 (ZEB), 3 (Cooling control), or 4 (Heating and cooling), the application also includes dehumidification as follows. If the humidity measured by the X4 sensor exceeds the value of P10 (Room humidity limit), ZEB initiates cooling. Relative humidity is the determining factor for cooling. If you select an absolute humidity sensor in the internal parameters dialog box, ZEB performs a conversion to relative humidity. To monitor humidity, select the With humidity sensor option in the internal parameters dialog box. Note that with Heating and cooling applications (ZEB/Load reset mode equal to 4), ZEB only initiates cooling. This option does not inactivate heating. Cooling condenses moisture in the air so that it can then be removed. Because heating is still active, a downstream air heater can bring fresh air to the required temperature again.
With the ZEB application (ZEB/Load reset mode equal to 1), cooling takes place with a simultaneous inactivation of heating. In addition, setpoint management engages the mixed air dampers and demands a setpoint for the dampers determined by the maximum zone temperature. With the Cooling control application (ZEB/Load reset mode equal to 3), when air humidity exceeds the allowable value, ZEB only initiates cooling.
ZEB Example See the System Regulation application in the Examples chapter for a description of
a partial air conditioning system with mixed air dampers, an air heater, and an air cooler. Setpoint management using the ZEB statement followed by PID controllers regulates this system.
CONTROL ICONS
EN2Z-0940GE51 R1114 245
EXAMPLES
This chapter describes applications that combine multiple icons to perform a control function. Applications are arranged alphabetically and include the following:
Attenuator Use the MAT, SWI, and DIF control icons calculate a good approximation of a mean
value, in this example, an outdoor air temperature. Average Value Calculation Use the SWI, MAT, CYC, and EVC icons to calculate an average outdoor air
temperature over three days. Floating Limits and Alarm Suppression Fixed alarm limits for some sensors, such as a supply air sensor, are not
meaningful, so it is useful to adapt the limits to a setpoint within an adjustable interval. Also, it is often useful to suppress nuisance alarms. Use WIA, ADD, and DIF to float limits and suppress alarms.
Operating Pump Switchover Use RIA, SWI, and MAT to switch pump operation between two pumps dependent
on hours of operation. Optimized Start/Stop Calculate optimized values for starting and stopping air conditioning systems.
Systems should start at the latest possible time and should stop as soon as possible to save energy. This application uses the EOV, MAT, and SWI icons and may use the ZEB icon to determine operating mode (heating or cooling).
Positioning Signal Limitation Use the MIN and MAX icons to limit the range of the output value sent to a
positioning signal. Setpoint Adjustments Use the SWI, DIF, and MAT control icons to control the setpoint of a actuator
depending on time of day. System Regulation This application regulates a partial air conditioning system with mixed air dampers,
an air heater, and an air cooler. Setpoint management using the ZEB statement followed by PID controllers regulates this system. This application uses the SWI, ZEB, MAX, MIN, PID, and AVR icons.
Trend Buffer Control In many cases, trend logs include points whose values change frequently. Over a
lengthy time interval, these frequent variations in signal exhaust the capacity of the trend buffer. You can use CYC and SWI to control output to the trend buffer.
Summary Table The following table cross-references the icons used in these applications.

EXAMPLES CONTROL ICONS
EN2Z-0940GE51 R0518 286
ADD AVR CYC DIF EOV EVC MAT MAX MIN PID RIA SWI WIA ZEB
Attenuator X X X Average Value Calculation
X
X
X
X
Floating Limits and Alarm Suppres-sion
X
X
X
Operating Pump Switchover
X
X
X
Optimized Start/Stop
X
X
X
X
Positioning Signal Limitation
X
X
Setpoint Adjust- ments
X
X
X
System Regulation
X
X
X
X
X
X
Trend Buffer Control
X
X
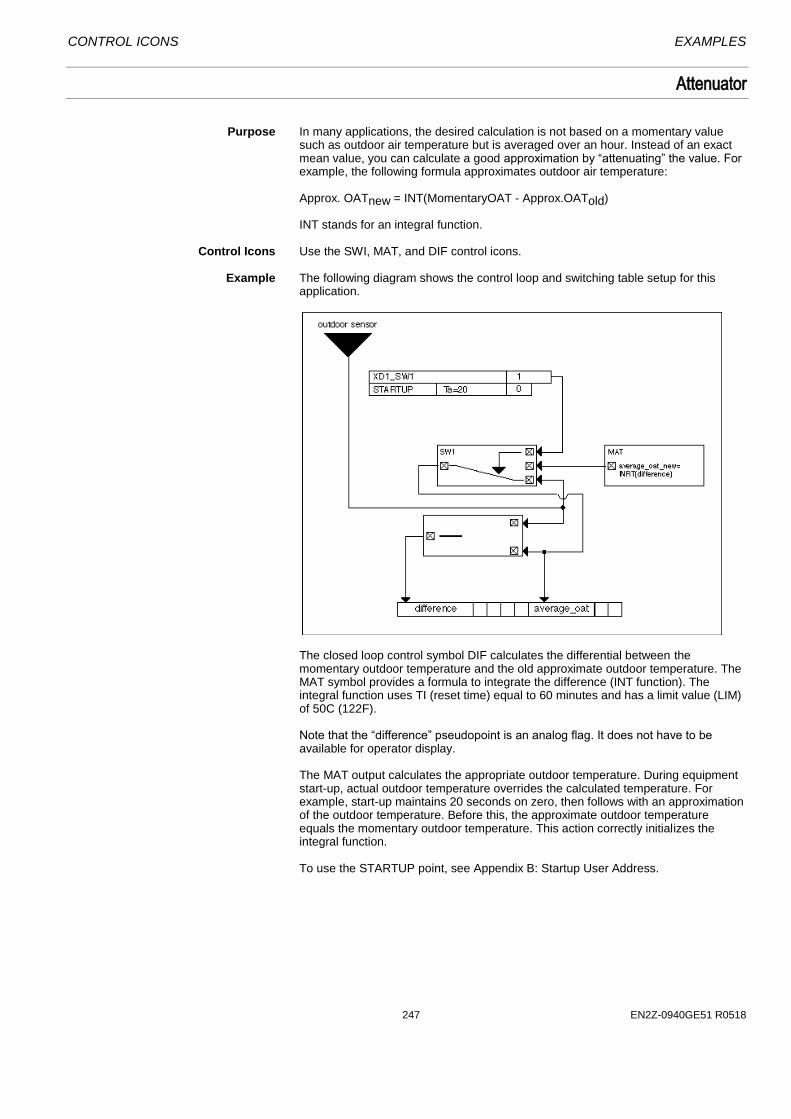
CONTROL ICONS EXAMPLES
247 EN2Z-0940GE51 R0518
Attenuator
Purpose In many applications, the desired calculation is not based on a momentary value
such as outdoor air temperature but is averaged over an hour. Instead of an exact mean value, you can calculate a good approximation by “attenuating” the value. For example, the following formula approximates outdoor air temperature:
Approx. OATnew = INT(MomentaryOAT - Approx.OATold) INT stands for an integral function.
Control Icons Use the SWI, MAT, and DIF control icons. Example The following diagram shows the control loop and switching table setup for this
application.
The closed loop control symbol DIF calculates the differential between the momentary outdoor temperature and the old approximate outdoor temperature. The MAT symbol provides a formula to integrate the difference (INT function). The integral function uses TI (reset time) equal to 60 minutes and has a limit value (LIM) of 50C (122F). Note that the “difference” pseudopoint is an analog flag. It does not have to be available for operator display. The MAT output calculates the appropriate outdoor temperature. During equipment start-up, actual outdoor temperature overrides the calculated temperature. For example, start-up maintains 20 seconds on zero, then follows with an approximation of the outdoor temperature. Before this, the approximate outdoor temperature equals the momentary outdoor temperature. This action correctly initializes the integral function. To use the STARTUP point, see Appendix B: Startup User Address.
EXAMPLES CONTROL ICONS
EN2Z-0940GE51 R0518 286
Average Value Calculation
Purpose The implementation of some heating limit functions require an average of outdoor air
temperature (OAT) over three days.
The formula for this calculation is: YAverage, new = (n*YAverage, old + X )/(n + 1) where n varies from 0 to i. Average, new is the momentary average value. Average, old is the average value calculated in the previous cycle. X is the actual value of the variable that is being averaged. The variable n serves to weight the average value relative to the actual value. As time increases, the weighting of the actual value always becomes less. The variable i serves to limit n. The following formula defines this limitation: i = T/t0 where T = Averaging duration and t0 = scan time. If n reaches the value of i, it must remain fixed at this value. To average temperature over three days, measure OAT every 10 minutes, that is, scan time (t0) is 10 minutes. Averaging duration T is 3 days or 4220 minutes. So, i is 4220/10 or 422. The formula to average three days of OAT (oat_72h) is then: oat_72h = (n*oat_72h + OAT)/(n + 1) where n varies from 0 through 422 and increases by 1 every 10 minutes.
Flowchart The following flowchart illustrates this averaging.
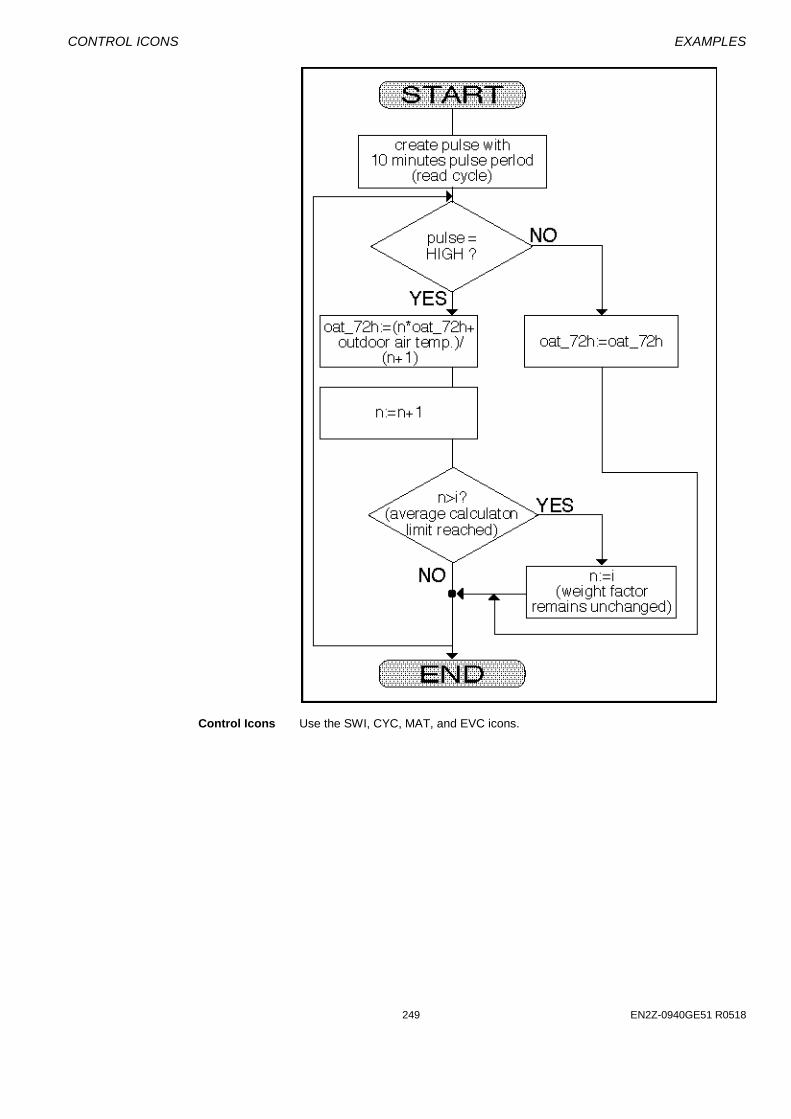
CONTROL ICONS EXAMPLES
249 EN2Z-0940GE51 R0518
Control Icons Use the SWI, CYC, MAT, and EVC icons.
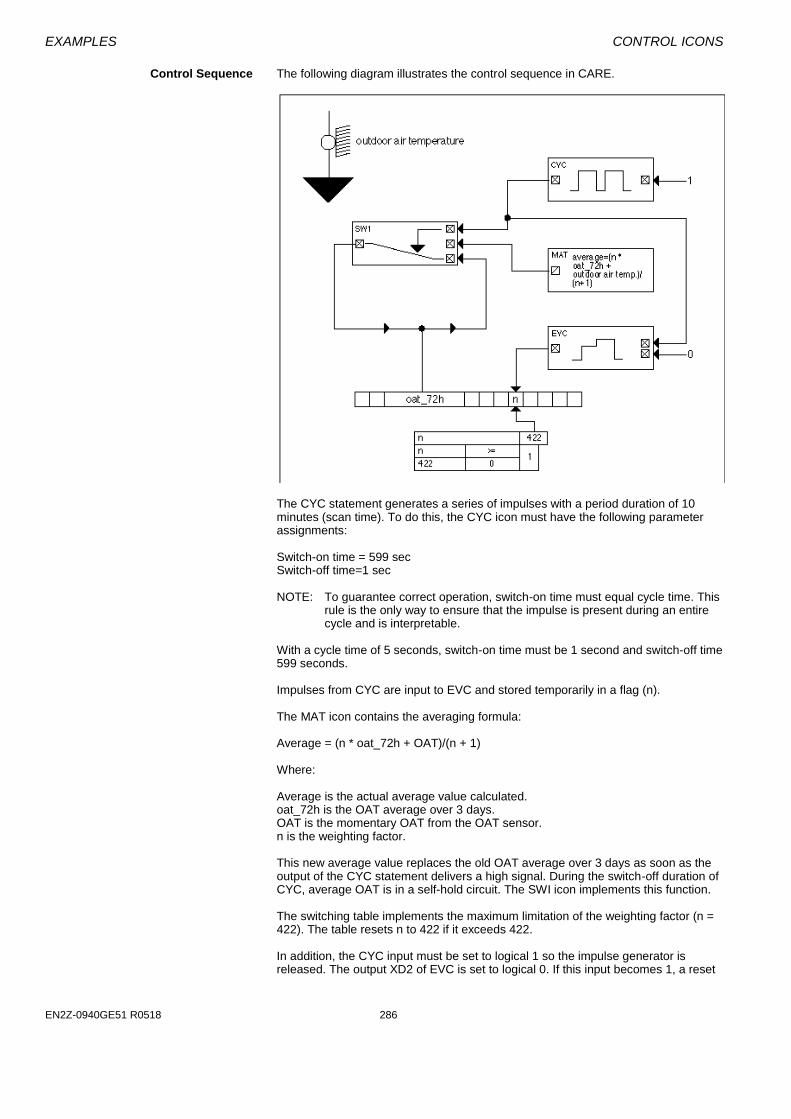
EXAMPLES CONTROL ICONS
EN2Z-0940GE51 R0518 286
Control Sequence The following diagram illustrates the control sequence in CARE.
The CYC statement generates a series of impulses with a period duration of 10 minutes (scan time). To do this, the CYC icon must have the following parameter assignments: Switch-on time = 599 sec Switch-off time=1 sec NOTE: To guarantee correct operation, switch-on time must equal cycle time. This
rule is the only way to ensure that the impulse is present during an entire cycle and is interpretable.
With a cycle time of 5 seconds, switch-on time must be 1 second and switch-off time 599 seconds. Impulses from CYC are input to EVC and stored temporarily in a flag (n). The MAT icon contains the averaging formula: Average = (n * oat_72h + OAT)/(n + 1) Where: Average is the actual average value calculated. oat_72h is the OAT average over 3 days. OAT is the momentary OAT from the OAT sensor. n is the weighting factor. This new average value replaces the old OAT average over 3 days as soon as the output of the CYC statement delivers a high signal. During the switch-off duration of CYC, average OAT is in a self-hold circuit. The SWI icon implements this function. The switching table implements the maximum limitation of the weighting factor (n = 422). The table resets n to 422 if it exceeds 422. In addition, the CYC input must be set to logical 1 so the impulse generator is released. The output XD2 of EVC is set to logical 0. If this input becomes 1, a reset

CONTROL ICONS EXAMPLES
251 EN2Z-0940GE51 R0518
is triggered on EVC that causes the calculation of the average value to start again. The new start can be triggered through a manual switch cabinet by a check of the system variable STARTUP. A switching table can implement the check of the STARTUP point: When STARTUP = 1, reset EVC to 1. The controller sets STARTUP to zero during a network failure. After the return of the network, STARTUP is 1 again. The switching table enables a new start of the OAT calculation after a network failure.
NOTE: If the STARTUP variable triggers a reset of EVC, ensure that STARTUP is
reset to zero after running through the first cycle. See Appendix B for a description of STARTUP reset.
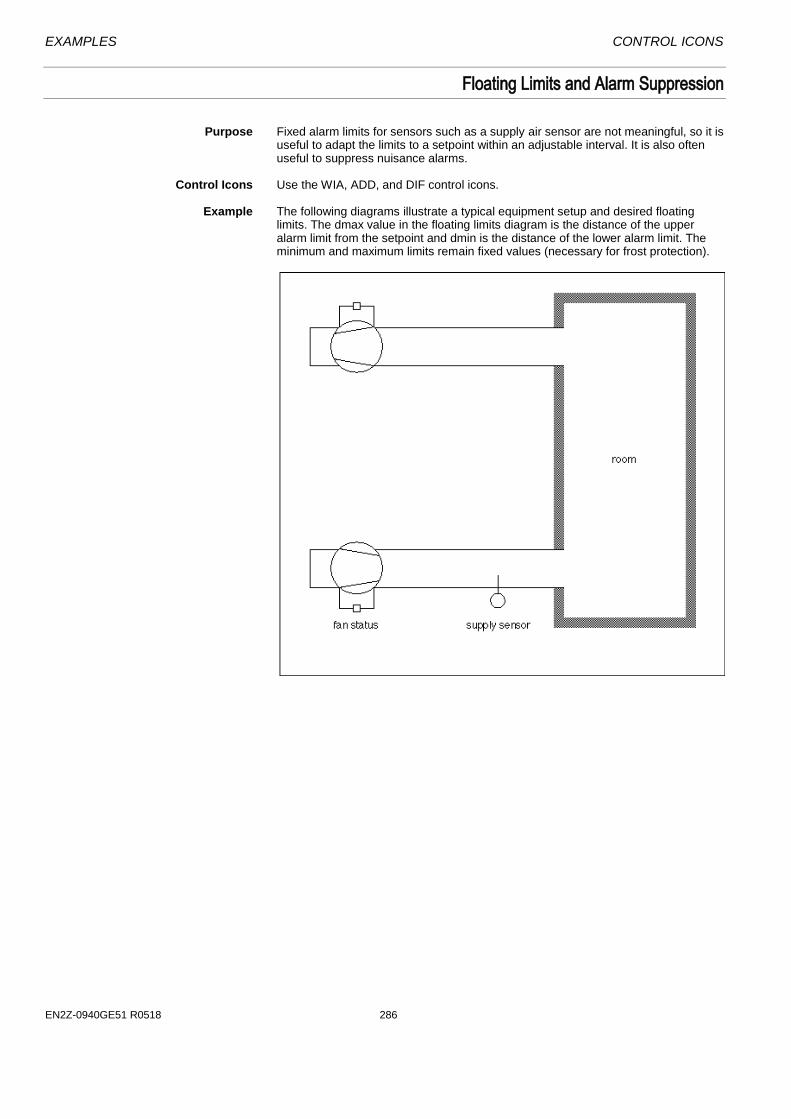
EXAMPLES CONTROL ICONS
EN2Z-0940GE51 R0518 286
Floating Limits and Alarm Suppression
Purpose Fixed alarm limits for sensors such as a supply air sensor are not meaningful, so it is
useful to adapt the limits to a setpoint within an adjustable interval. It is also often useful to suppress nuisance alarms.
Control Icons Use the WIA, ADD, and DIF control icons. Example The following diagrams illustrate a typical equipment setup and desired floating
limits. The dmax value in the floating limits diagram is the distance of the upper alarm limit from the setpoint and dmin is the distance of the lower alarm limit. The minimum and maximum limits remain fixed values (necessary for frost protection).
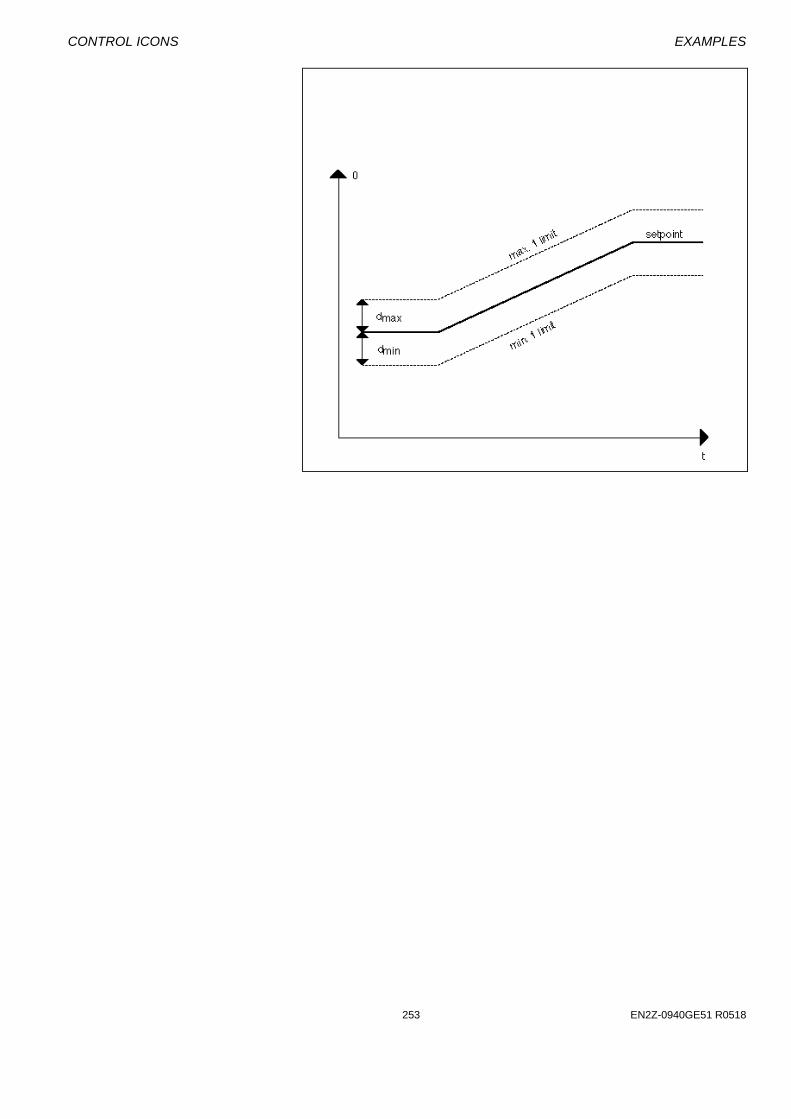
CONTROL ICONS EXAMPLES
253 EN2Z-0940GE51 R0518

EXAMPLES CONTROL ICONS
EN2Z-0940GE51 R0518 286
In addition to floating limits, the system should suppress all alarms as long as the supply air fan is off because the supply air sensor cannot measure correct values when the fan is off. The following diagram illustrates both alarm suppression and floating limits.
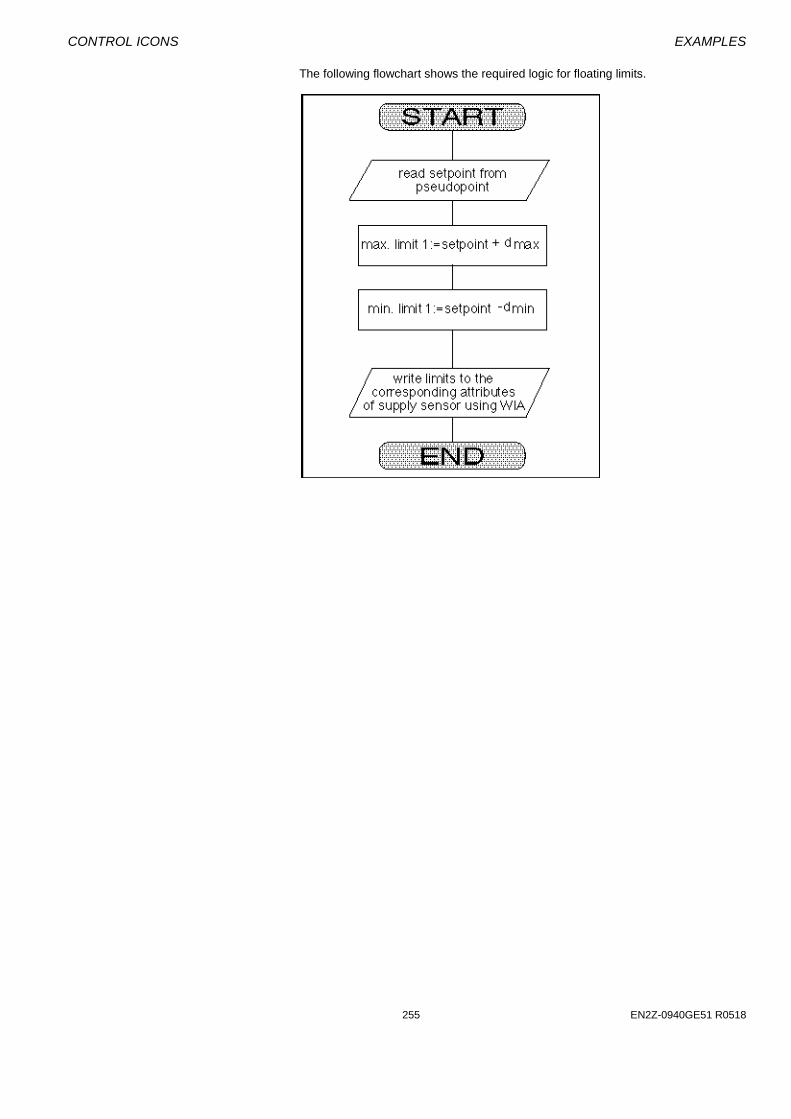
CONTROL ICONS EXAMPLES
255 EN2Z-0940GE51 R0518
The following flowchart shows the required logic for floating limits.

EXAMPLES CONTROL ICONS
EN2Z-0940GE51 R0518 286
The following flowchart shows the required logic for alarm suppression.

CONTROL ICONS EXAMPLES
257 EN2Z-0940GE51 R0518
To implement these procedures in CARE, you can use a switching table and a control loop with WIA, ADD, and DIF control icons. The following diagram illustrates the required CARE setup.

EXAMPLES CONTROL ICONS
EN2Z-0940GE51 R0518 286
Operating Pump Switchover
Purpose Switch pump operation between two pumps dependent on hours of operation. RIA
reads the operating hours attribute for each pump and provides the values to SWI icons for the switchover decision.
Control Icons Use the RIA, SWI, and MAT icons. Description Control operation switches on Pump 1 when the application program demands it
and estimates switch-off time depending on the number of operating hours. Pump 2 operation is similar.
The following flowcharts diagram program operation in three parts.

CONTROL ICONS EXAMPLES
259 EN2Z-0940GE51 R0518
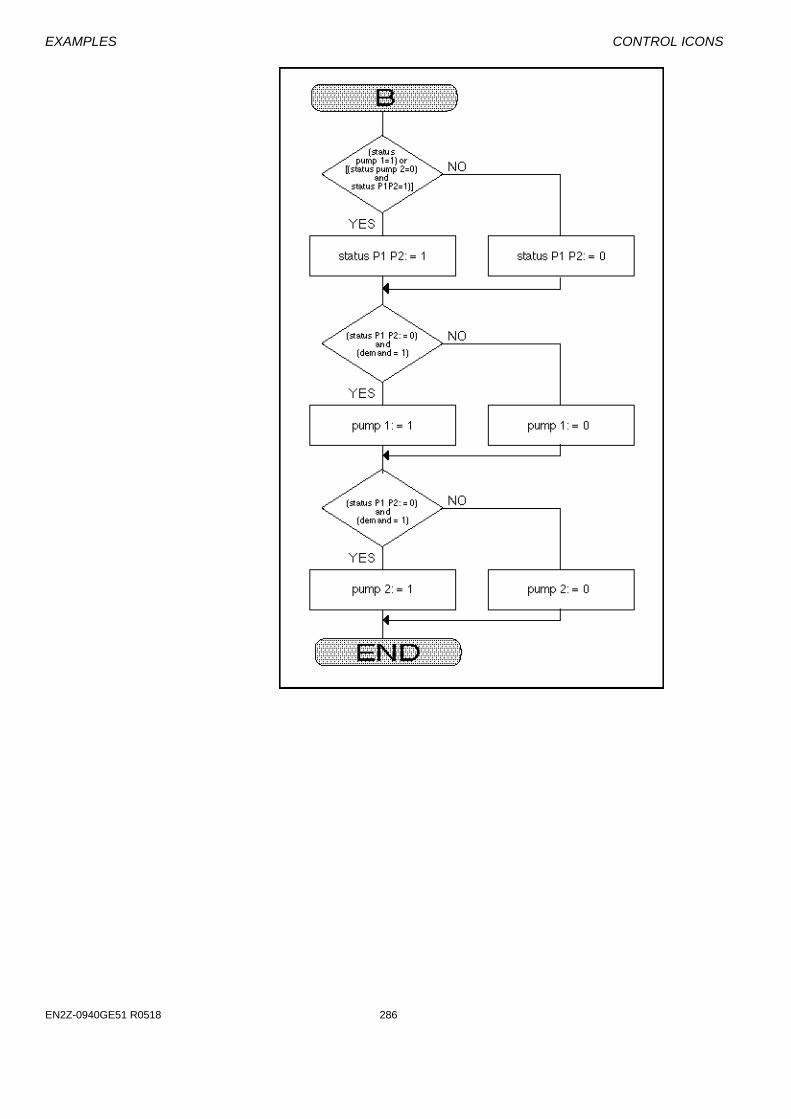
EXAMPLES CONTROL ICONS
EN2Z-0940GE51 R0518 286

CONTROL ICONS EXAMPLES
261 EN2Z-0940GE51 R0518
The following diagram shows the required CARE programming for this example.
Switchover occurs every 100 hours. The switching tables save the time period for status P1 and status P2. Y1 and Y2 are MAT formulas that work together to operate the switching tables. Y1 = run hours P1 - P1_Difference Y2 = run hours P2 - P2_Difference The control loop and switching tables use flags for the hours and statuses since these values are of no interest to a user at an operator’s terminal.

EXAMPLES CONTROL ICONS
EN2Z-0940GE51 R0518 286
Optimized Start/Stop
Purpose This application optimizes the start/stop of an air conditioning system. Systems
should start at the latest possible time and should stop as soon as possible to save energy.
Control Icons Use the EOV, SWI, MAT, and ZEB control icons. Description The following diagram shows the application in CARE.
Note that the user address Plant On must be a digital pseudopoint and set by a Time Program to an On or Off value. The ZEB icon decides whether the system is in heating or cooling mode. This example is operated with the corrected setpoint during optimized start-up. If the plant is in heating mode and optimized start-up is active (YD2 = 1), the SWI icon passes a higher room setpoint of 5K. If the plant is in cooling mode and optimized start-up is active (YD2 =1), the SWI icon passes a reduced room setpoint of 5K. In all other cases (no optimization), the room setpoint is unchanged. The Mathematical editor (MAT icon) calculates the increase/decrease of room setpoint: room_setpoint_high = room setpoint + 5 or room_setpoint_low = room setpoint - 5

CONTROL ICONS EXAMPLES
263 EN2Z-0940GE51 R0518
Positioning Signal Limitation
Purpose Limit the range of the output value sent to a positioning signal. For example, limit the
range of values sent to a damper to from 0 to 100 percent.
As shown in the following diagram, a function output can vary across all real numbers. However, the device being controlled may have a set range between a minimum and a maximum value.
Control Icons Use the MIN and MAX control icons. Example If the linear function Y = 2X-20 (where -50 < X < 150) defines the output signal for a
mixing valve with a three-position output (0 through 100 percent range), you need to limit the output to range between 0 and 100.
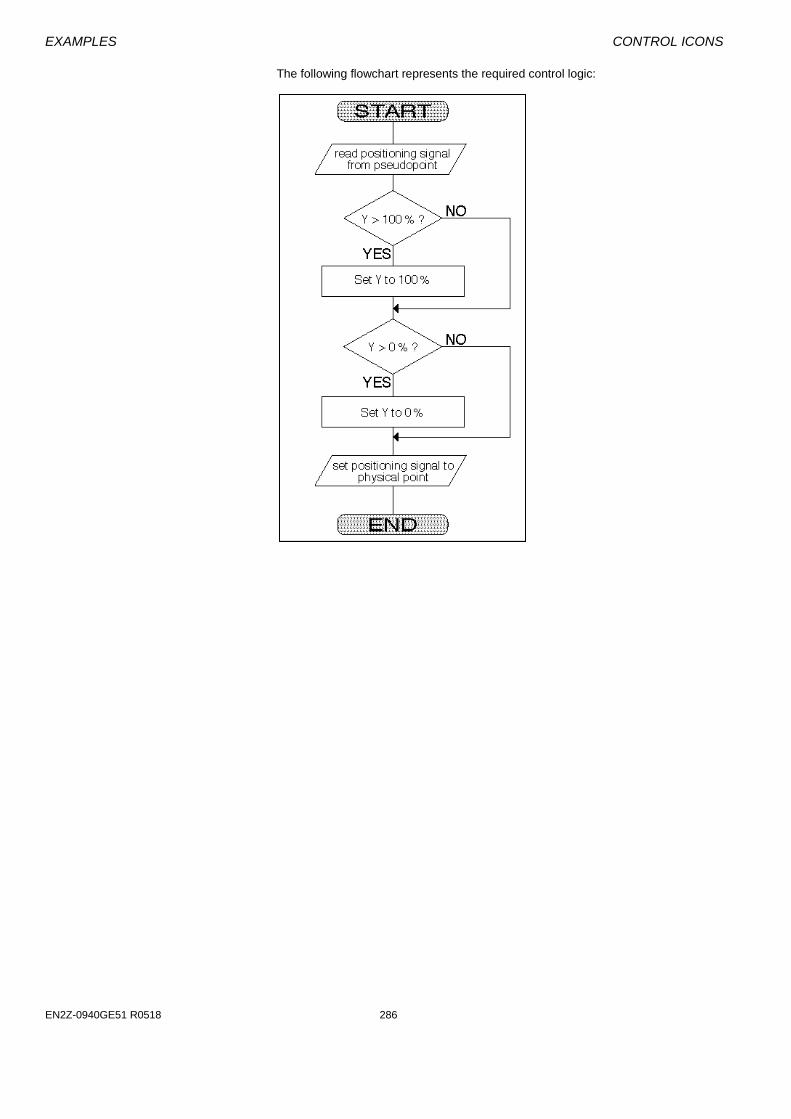
EXAMPLES CONTROL ICONS
EN2Z-0940GE51 R0518 286
The following flowchart represents the required control logic:

CONTROL ICONS EXAMPLES
265 EN2Z-0940GE51 R0518
The following diagram represents the control loop to implement the control logic:
The minimum and maximum values are best input as parameters as shown in the control loop diagram (0 and 100 percent). The MIN statement transmits Y values that are less than or equal to 100 percent. The MAX statement transmits Y values that are greater than or equal to 0 percent.
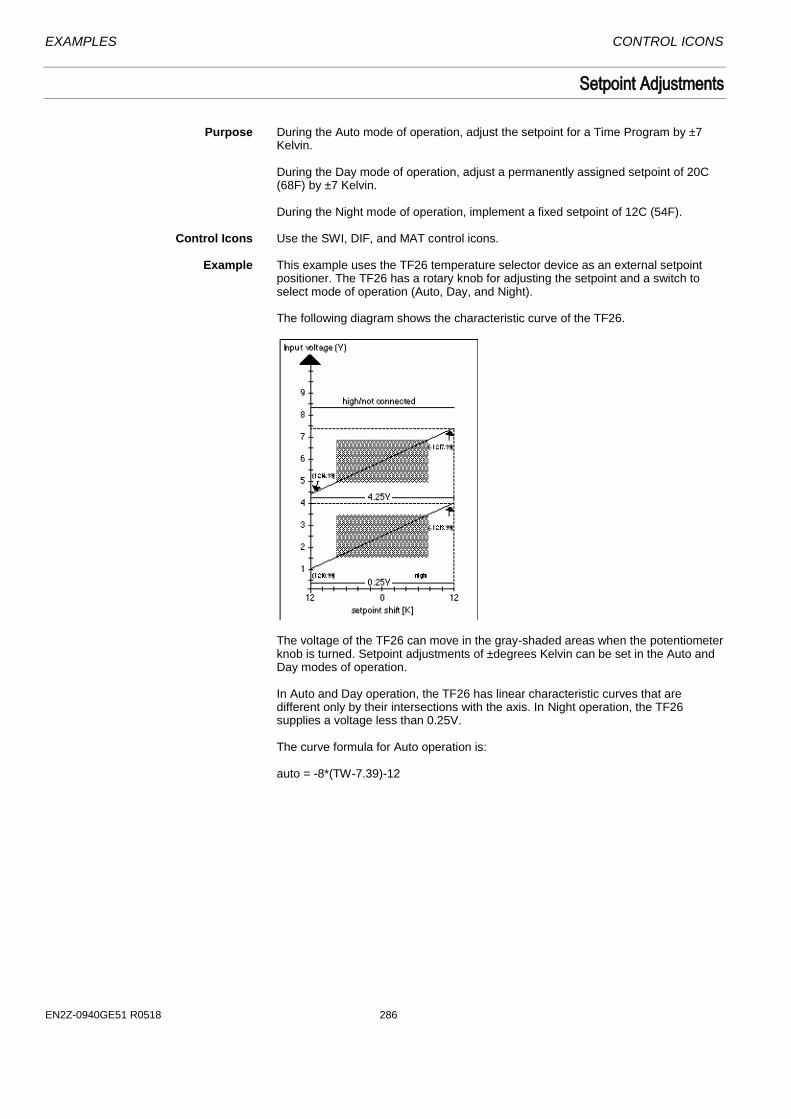
EXAMPLES CONTROL ICONS
EN2Z-0940GE51 R0518 286
Setpoint Adjustments
Purpose During the Auto mode of operation, adjust the setpoint for a Time Program by ±7
Kelvin.
During the Day mode of operation, adjust a permanently assigned setpoint of 20C (68F) by ±7 Kelvin.
During the Night mode of operation, implement a fixed setpoint of 12C (54F).
Control Icons Use the SWI, DIF, and MAT control icons. Example This example uses the TF26 temperature selector device as an external setpoint
positioner. The TF26 has a rotary knob for adjusting the setpoint and a switch to select mode of operation (Auto, Day, and Night).
The following diagram shows the characteristic curve of the TF26.
The voltage of the TF26 can move in the gray-shaded areas when the potentiometer knob is turned. Setpoint adjustments of ±degrees Kelvin can be set in the Auto and Day modes of operation. In Auto and Day operation, the TF26 has linear characteristic curves that are different only by their intersections with the axis. In Night operation, the TF26 supplies a voltage less than 0.25V. The curve formula for Auto operation is: auto = -8*(TW-7.39)-12
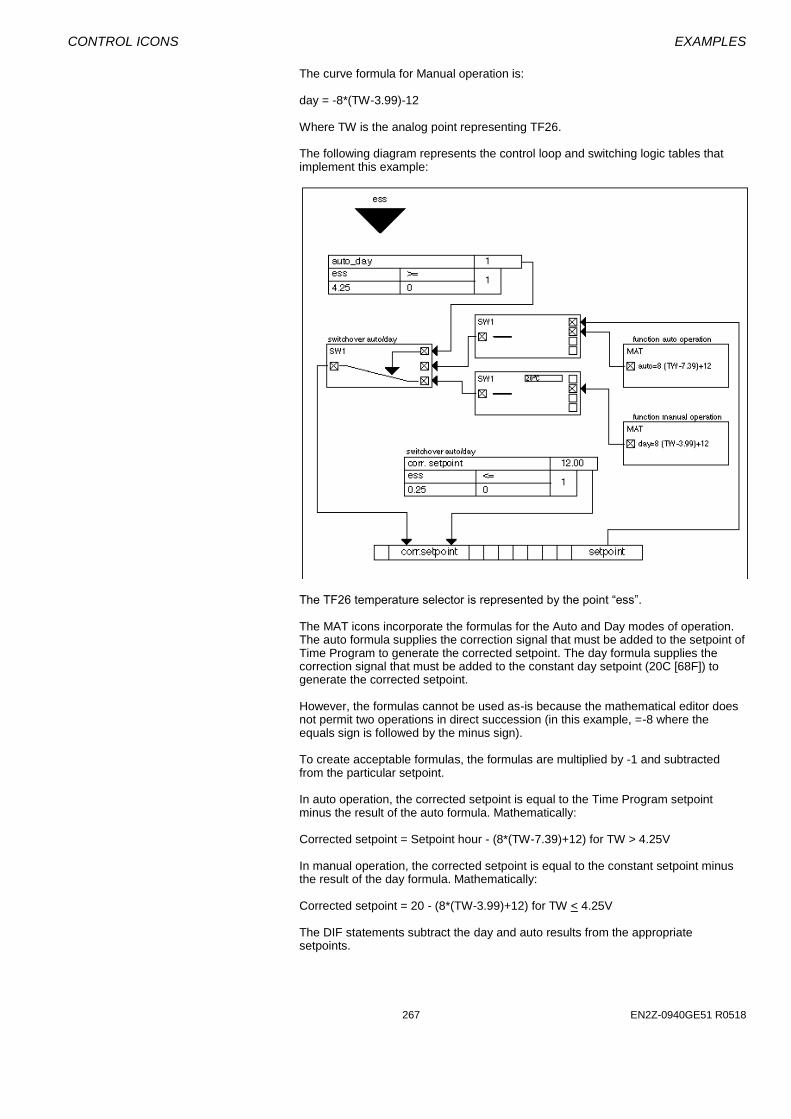
CONTROL ICONS EXAMPLES
267 EN2Z-0940GE51 R0518
The curve formula for Manual operation is: day = -8*(TW-3.99)-12 Where TW is the analog point representing TF26. The following diagram represents the control loop and switching logic tables that implement this example:
The TF26 temperature selector is represented by the point “ess”. The MAT icons incorporate the formulas for the Auto and Day modes of operation. The auto formula supplies the correction signal that must be added to the setpoint of Time Program to generate the corrected setpoint. The day formula supplies the correction signal that must be added to the constant day setpoint (20C [68F]) to generate the corrected setpoint. However, the formulas cannot be used as-is because the mathematical editor does not permit two operations in direct succession (in this example, =-8 where the equals sign is followed by the minus sign). To create acceptable formulas, the formulas are multiplied by -1 and subtracted from the particular setpoint. In auto operation, the corrected setpoint is equal to the Time Program setpoint minus the result of the auto formula. Mathematically: Corrected setpoint = Setpoint hour - (8*(TW-7.39)+12) for TW > 4.25V In manual operation, the corrected setpoint is equal to the constant setpoint minus the result of the day formula. Mathematically: Corrected setpoint = 20 - (8*(TW-3.99)+12) for TW < 4.25V The DIF statements subtract the day and auto results from the appropriate setpoints.

EXAMPLES CONTROL ICONS
EN2Z-0940GE51 R0518 286
Auto/day operation switchover is via a switching table comparison. If input voltage TW is greater than 4.24V, the switching table is 1 and the SWI statement transmits the automatic setpoint. Other, SWI transmits the day setpoint. Night operation also is via a switching table comparison. If the TW input voltage drops below 0.25V, the switching table writes a fixed setpoint of 12C (54F) to the corrected setpoint. Note that switching tables have priority over control loops so the night operation functions although the control loop writes the day setpoint on the corrected setpoint.
TW Linear Characteristic When defining the TW input, you need to define a linear characteristic curve of 0
through 10V.

CONTROL ICONS EXAMPLES
269 EN2Z-0940GE51 R0518
System Regulation
This application regulates a partial air conditioning system with mixed air dampers, an air heater, and an air cooler. Setpoint management using the ZEB statement followed by PID controllers regulates this system.
Description The following diagram illustrates system setup.
ZEB/Load reset mode is 1 (ZEB) to receive the mixed air damper setpoint.
With the controllers, it is especially important to ensure that the proportional ranges of the controller are set correctly. When crossing the particular heating, cooling, and zero energy ranges, the control loop must cover the maximum positioning signal change of the controller. The proportional ranges (Xp) of the controllers are as follows: Heater controller Xp = Heating reset range Cooler controller Xp = Cooling reset range Damper controller Xp = (P13*(100% + 20%)/(100% - 20%)) + P13 (Where P13 is the mixed air reset range.) With the controller for the mixed air dampers, there is also a minimum limitation of the positioning signal to 20 percent to guarantee a minimum fraction of outdoor air. In this example, the Y3, Y4, and Y5 outputs from ZEB provide the fresh air setpoints for the heating, cooling, and zero energy cases (pure damper operation). These outputs serve as reference variables for the PID controllers. The fresh air sensor provides the controlled variable. On the controllers for the cooler and the dampers, the controller inputs for the controlled variable and reference variables are deliberately exchanged to reverse the effects of the controller.
EXAMPLES CONTROL ICONS
EN2Z-0940GE51 R0518 286
Air Heater Controller The ZEB heating setpoint (Y3 output) connects to the controller for the air heater valve as the reference variable. If the ZEB statement initiates heating (YD1=1), the positioning signal from the controller reaches the valve drive. If YD1 equals zero, the controller is overridden and the valve is closed. Cooler Controller The ZEB cooling setpoint (Y4 output) connects to the controller for the cooling valve as the controlled variable. The connection is made as the controlled variable to reverse the direction in which the controller works. If the ZEB statement initiates cooling (YD2=1), the positioning signal from the controller reaches the valve drive. In addition, the mixed air setpoint connects to the damper controller for dehumidification when cooling is active. If YD2 equals zero, the controller is overridden and the valve is closed. Mixed Air Damper Controller ZEB releases the mixed air dampers if neither heating nor cooling is active (YD1 and YD2 are zero) or if cooling is active (YD2 is 1). If neither heating nor cooling is active, all temperatures are within the zero energy range. ZEB releases the dampers for air regulation. If cooling is active, ZEB must also release the dampers because dehumidification can activate cooling and then damper intervention is required. A switching table releases the dampers. The mixed air setpoint (Y5) connects to the damper controllers as the controlled variable (for reversal). The positioning signal from the controller reaches the damper drive when the dampers are released.
If the dampers are blocked, the controller is overridden and the dampers are closed to a minimum outdoor air proportion of 20 percent. The SWI control icon can provide the zero and 20 percent constants that override the controller when necessary. To guarantee a minimum outdoor air proportion when the dampers are released, minimum controller output has to be 20 percent.
CAUTION If the system is off, the control loop must guarantee that the outdoor air dampers are closed, as in other standard control applications to prevent unacceptable outdoor air within the system. Use separate switching tables to guarantee this action.
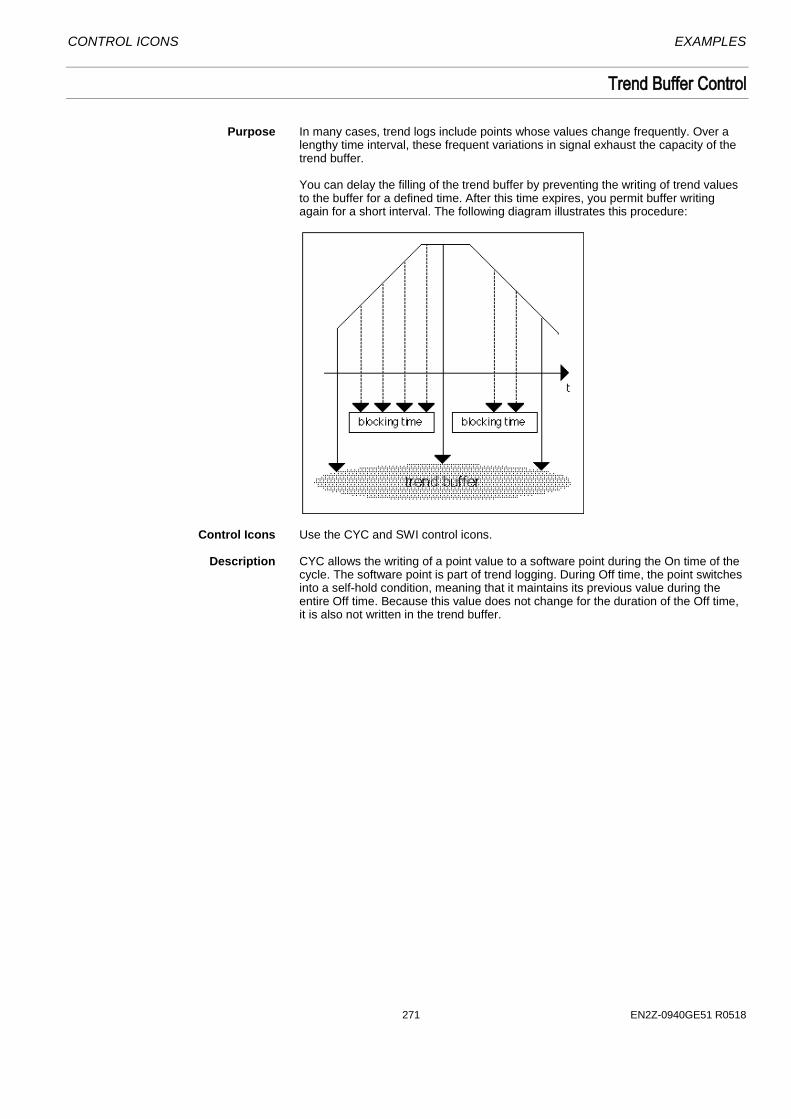
CONTROL ICONS EXAMPLES
271 EN2Z-0940GE51 R0518
Trend Buffer Control
Purpose In many cases, trend logs include points whose values change frequently. Over a
lengthy time interval, these frequent variations in signal exhaust the capacity of the trend buffer.
You can delay the filling of the trend buffer by preventing the writing of trend values to the buffer for a defined time. After this time expires, you permit buffer writing again for a short interval. The following diagram illustrates this procedure:
Control Icons Use the CYC and SWI control icons. Description CYC allows the writing of a point value to a software point during the On time of the
cycle. The software point is part of trend logging. During Off time, the point switches into a self-hold condition, meaning that it maintains its previous value during the entire Off time. Because this value does not change for the duration of the Off time, it is also not written in the trend buffer.
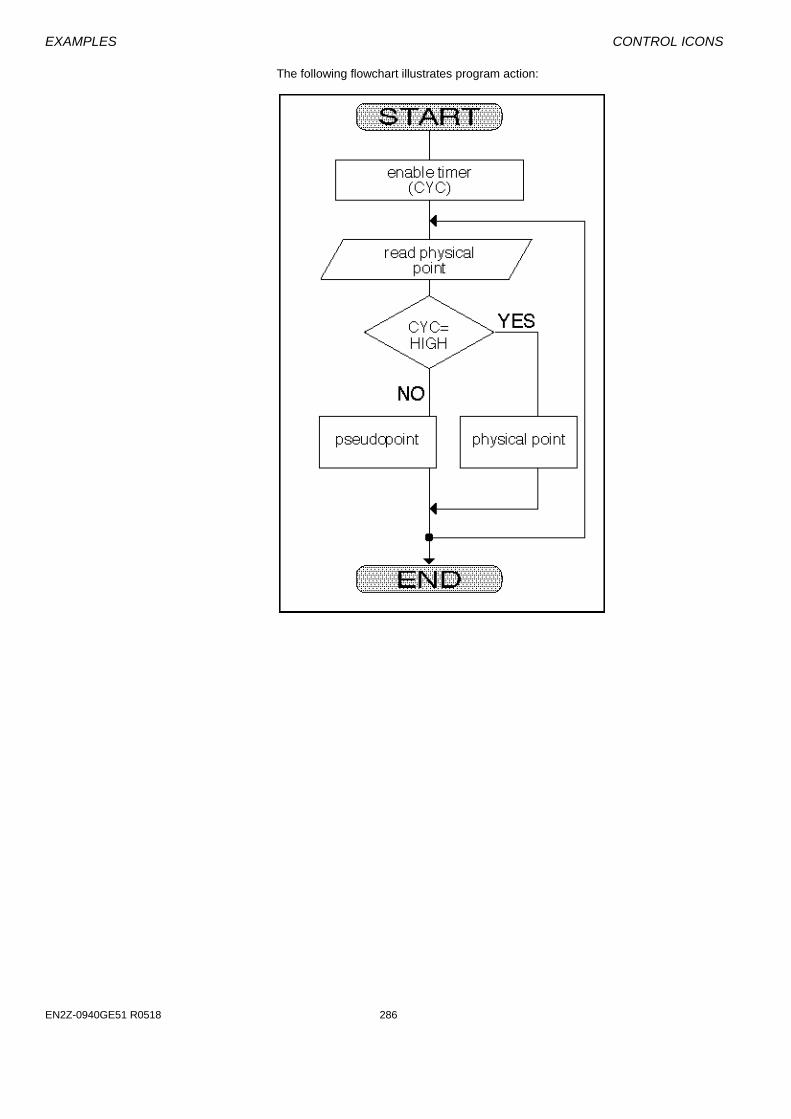
EXAMPLES CONTROL ICONS
EN2Z-0940GE51 R0518 286
The following flowchart illustrates program action:
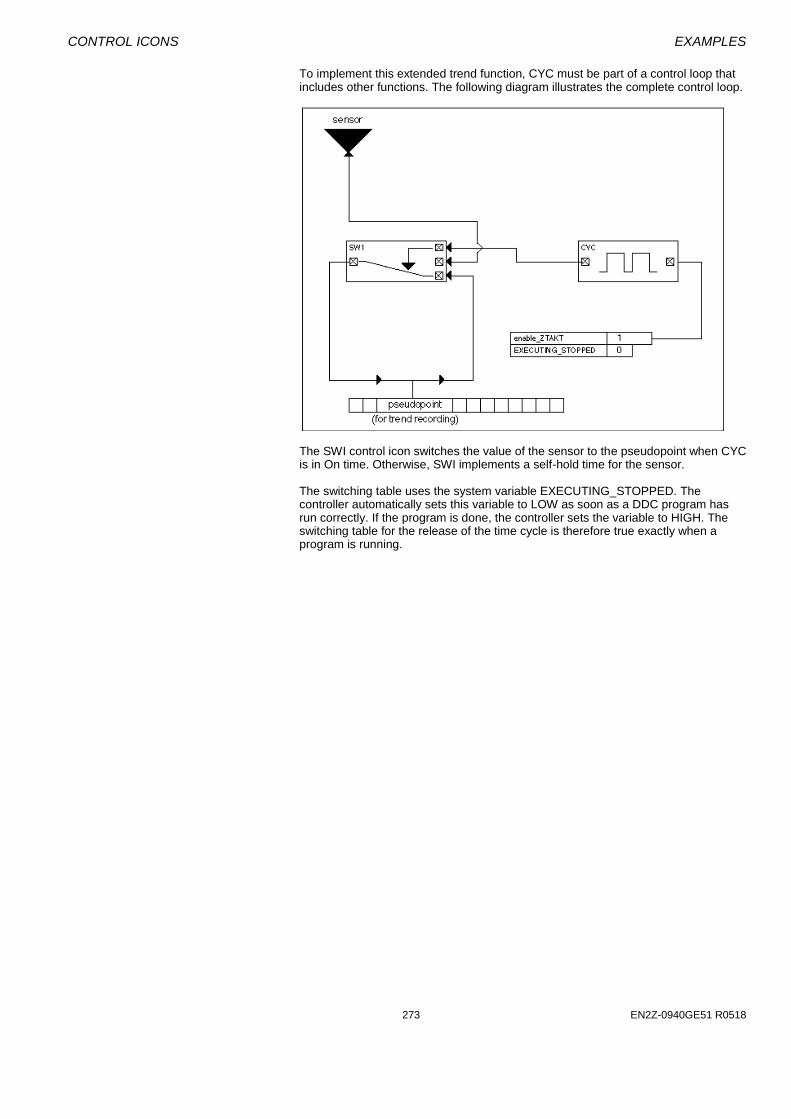
CONTROL ICONS EXAMPLES
273 EN2Z-0940GE51 R0518
To implement this extended trend function, CYC must be part of a control loop that includes other functions. The following diagram illustrates the complete control loop.
The SWI control icon switches the value of the sensor to the pseudopoint when CYC is in On time. Otherwise, SWI implements a self-hold time for the sensor. The switching table uses the system variable EXECUTING_STOPPED. The controller automatically sets this variable to LOW as soon as a DDC program has run correctly. If the program is done, the controller sets the variable to HIGH. The switching table for the release of the time cycle is therefore true exactly when a program is running.

CONTROL ICONS
EN2Z-0940GE51 R0516 274
APPENDIX A: PARAMETER LIST DESCRIPTION
Description When you translate a plant in CARE, CARE generates a parameter list file that
documents the parameters used in the control strategy and switching logic for the plant.
You can use this reference list after the CARE process is complete and you are testing the controller with the XI584 Operator Terminal. See also the XI584 Portable Operator´s User Guide and the CARE User Guide for detailed descriptions of the printout.
Example Main 1 Main module : M0
Module 2 Parameter file number : 0
List 3
4 P.Nr | Description | Value + Eng. Unit | Symbol Reference
5 ---------------------------------------------------------------------------------
6 1 | Internal use | 0.000 | |
7 2 | Internal use | 1.000 | |
8 Control 9 Plant :ah1
Loop 10 Control loop :loop1
List 11 Parameter file number :1
12 13 P.Nr | Description | Value + Eng. Unit | Symbol Reference
14 ---------------------------------------------------------------------------------
15 1 | Internal use | 0.000 |
16 2 | Internal use | 1.000 |
17 3 | Proportional band (Xp) | 12.000 | 2.1
18 4 | Derivate time (TV) | 0.000 | 2.1
19 5 | Internal use | 1000.000 | 2.1
20 6 | Minimum output | 0.000 | 2.1
21 7 | Maximum output | 100.000 | 2.1
23 8 | Integral action time (Tn) | 1000.000 | 2.1
24 Switch. 25 Plant : ah1
Table 26 Switching table : MaDmpr
List 27 Parameter file number : 2
28 29 P.Nr | Description | Value + Eng. Unit | Symbol Reference
30 -----------------------------------------------------------------------------------
31 1 | Internal use | 0.000 |
32 2 | Internal use | 1.000 |
33 3 | Hysteresis of Line 1 Table 1 | 5.000 | 1
34 4 | Comparison Value 2 of Line 1 Table 1 | 32.000 | 1
35 5 | Hysteresis of Line 2 Table 1 | 3.000 | 1
36 6 | Comparison Value 2 of Line 2 Table 1 | 55.000 | 1
37 7 | Hysteresis of Line 1 Table 2 | 5.000 | 2
38 8 | Comparison Value 2 of Line 1 Table 2 | 32.000 | 2
39 9 | Hysteresis of Line 2 Table 2 | 3.000 | 2
40 10 | Comparison Value 2 of Line 2 Table 2 | 55.000 | 2
41 11 | On-Delay of Column 1 Table 3 | 31.000 Sec | 3
42 12 | Hysteresis of Line 1 Table 3 | 5.000 | 3
43 13 | Comparison Value 2 of Line 1 Table 3 | 32.000 | 3
44 14 | Hysteresis of Line 2 Table 3 | 3.000 | 3
45 15 | Comparison Value 2 of Line 2 Table 3 | 55.000 | 3
46 16 | Output Value Table 3 | 100.000 | 3
47 17 | Output Value Table 2 | 50.000 | 2
48 18 | Output Value Table 1 | 0.000 | 1
49 50 Plant : ah1
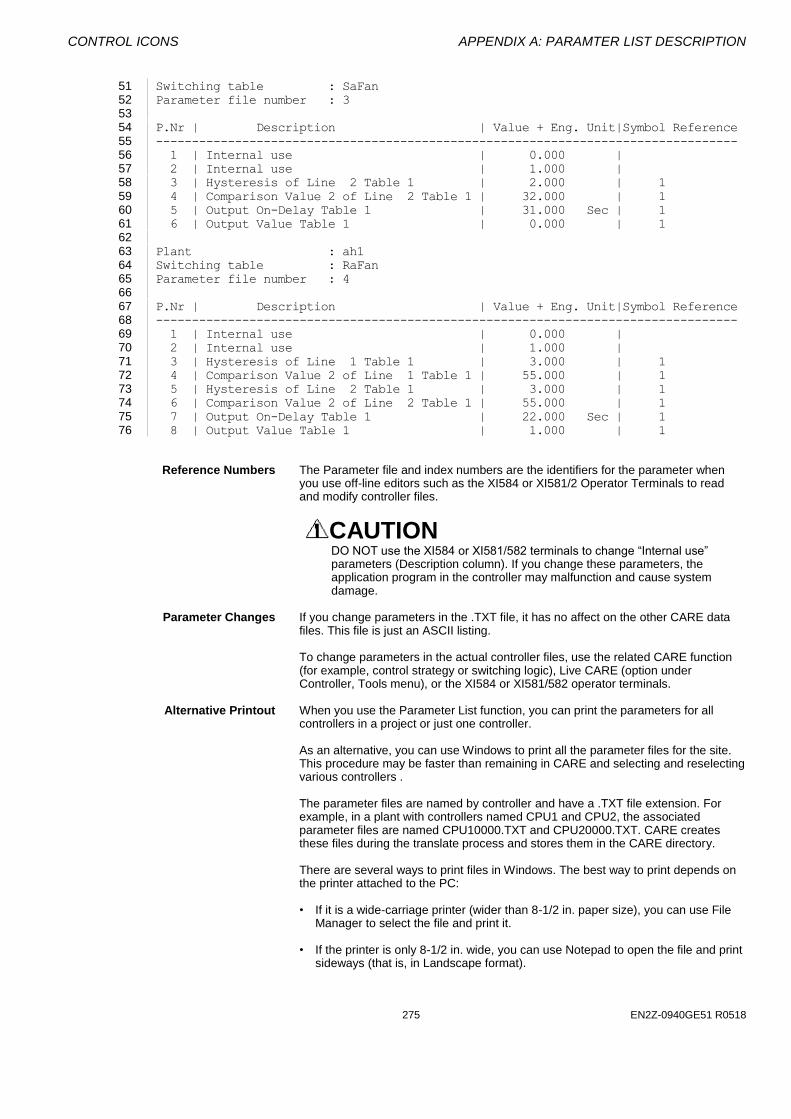
CONTROL ICONS APPENDIX A: PARAMTER LIST DESCRIPTION
275 EN2Z-0940GE51 R0518
51 Switching table : SaFan
52 Parameter file number : 3
53
54 P.Nr | Description | Value + Eng. Unit|Symbol Reference
55 ---------------------------------------------------------------------------------
56 1 | Internal use | 0.000 |
57 2 | Internal use | 1.000 |
58 3 | Hysteresis of Line 2 Table 1 | 2.000 | 1
59 4 | Comparison Value 2 of Line 2 Table 1 | 32.000 | 1
60 5 | Output On-Delay Table 1 | 31.000 Sec | 1
61 6 | Output Value Table 1 | 0.000 | 1
62 63 Plant : ah1
64 Switching table : RaFan
65 Parameter file number : 4
66
67 P.Nr | Description | Value + Eng. Unit|Symbol Reference
68 ---------------------------------------------------------------------------------
69 1 | Internal use | 0.000 |
70 2 | Internal use | 1.000 |
71 3 | Hysteresis of Line 1 Table 1 | 3.000 | 1
72 4 | Comparison Value 2 of Line 1 Table 1 | 55.000 | 1
73 5 | Hysteresis of Line 2 Table 1 | 3.000 | 1
74 6 | Comparison Value 2 of Line 2 Table 1 | 55.000 | 1
75 7 | Output On-Delay Table 1 | 22.000 Sec | 1
76 8 | Output Value Table 1 | 1.000 | 1
Reference Numbers The Parameter file and index numbers are the identifiers for the parameter when you use off-line editors such as the XI584 or XI581/2 Operator Terminals to read and modify controller files.
CAUTION DO NOT use the XI584 or XI581/582 terminals to change “Internal use” parameters (Description column). If you change these parameters, the application program in the controller may malfunction and cause system damage.
Parameter Changes If you change parameters in the .TXT file, it has no affect on the other CARE data
files. This file is just an ASCII listing.
To change parameters in the actual controller files, use the related CARE function (for example, control strategy or switching logic), Live CARE (option under Controller, Tools menu), or the XI584 or XI581/582 operator terminals.
Alternative Printout When you use the Parameter List function, you can print the parameters for all
controllers in a project or just one controller.
As an alternative, you can use Windows to print all the parameter files for the site. This procedure may be faster than remaining in CARE and selecting and reselecting various controllers . The parameter files are named by controller and have a .TXT file extension. For example, in a plant with controllers named CPU1 and CPU2, the associated parameter files are named CPU10000.TXT and CPU20000.TXT. CARE creates these files during the translate process and stores them in the CARE directory. There are several ways to print files in Windows. The best way to print depends on the printer attached to the PC:
• If it is a wide-carriage printer (wider than 8-1/2 in. paper size), you can use File
Manager to select the file and print it.
• If the printer is only 8-1/2 in. wide, you can use Notepad to open the file and print sideways (that is, in Landscape format).
APPENDIX A: PARAMTER LIST DESCRIPTION CONTROL ICONS
EN2Z-0940GE51 R0518 286
File Manager Procedure 1. Make File Manager the active window. One way to do this is to hold down the Alt key and press Tab until a message
displays “File Manager”. Release the keys.
Tip If the message box never says File Manager, the software is not active. Keep pressing Alt Tab until “Program Manager” displays. Release the keys. The Program Manager window displays. Find and double-click the File Manager icon.
RESULT: The File Manager window displays.
2. Display the directory that contains your CARE files, usually, C:\CARE. 3. Scroll until you find the appropriate .TXT file. You can use menu item View,
dropdown item Sort by Name, to resort the list and find the file more easily. Click the file name to select it.
4. Click menu item File, dropdown item Print. Click OK when the print dialog box
displays.
RESULT: The .TXT file prints. Notepad Procedure 1. Open Notepad. You can find Notepad in a Program Manager window. To get to Program
Manager, hold down the Alt key and press Tab until a message box displays “Program Manager”. Release the keys. Find the icon for Notepad and double-click the icon to open Notepad.
2 Click menu item File, then dropdown item Open.
RESULT: The Open dialog box displays with a list of drives and directories. 3. Select the drive and directory that contains the .TXT files (usually, C:\CARE)
and scroll until you find the desired .TXT file. Double-click the file name to select it and close the dialog box.
RESULT: The .TXT file appears in the Notepad window.
4. Click menu item File, then dropdown item Print setup.
RESULT: The Print Setup dialog box displays. 5. Click Landscape. Then click OK to close the dialog box. 6. Click menu item File, then dropdown item Print. Click OK when the print dialog
box displays.
RESULT: The .TXT file prints.
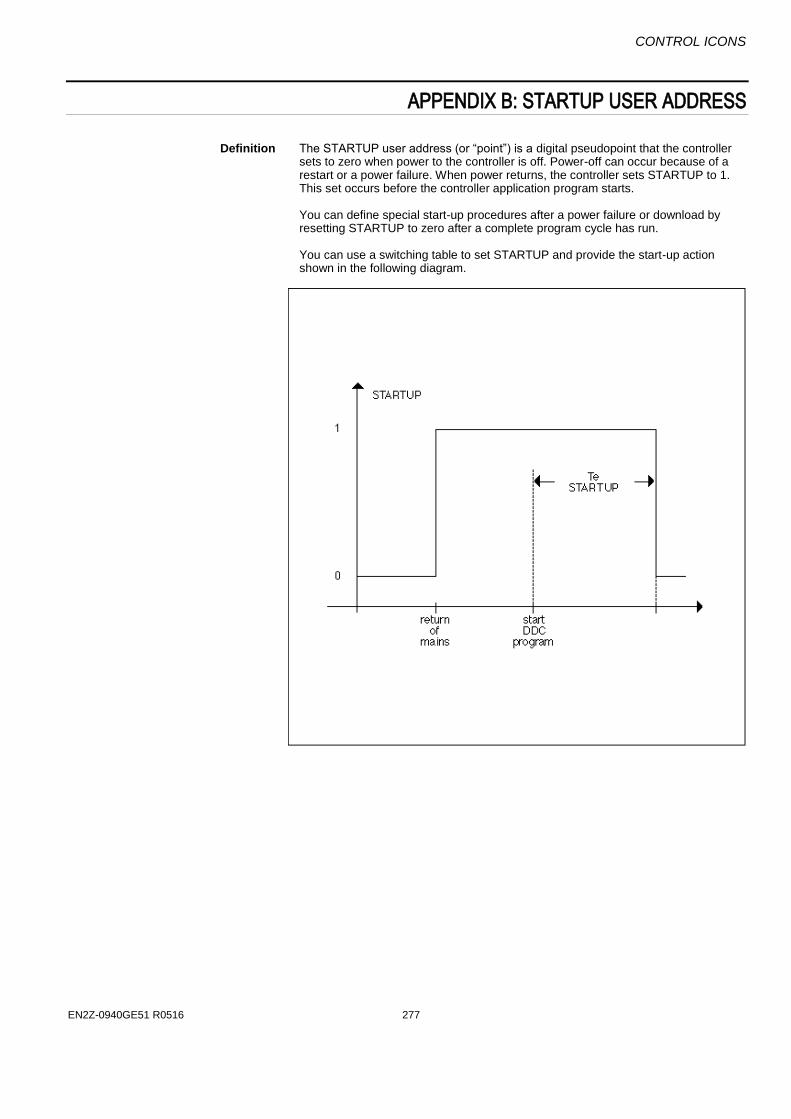
CONTROL ICONS
EN2Z-0940GE51 R0516 277
APPENDIX B: STARTUP USER ADDRESS
Definition The STARTUP user address (or “point”) is a digital pseudopoint that the controller
sets to zero when power to the controller is off. Power-off can occur because of a restart or a power failure. When power returns, the controller sets STARTUP to 1. This set occurs before the controller application program starts.
You can define special start-up procedures after a power failure or download by resetting STARTUP to zero after a complete program cycle has run.
You can use a switching table to set STARTUP and provide the start-up action shown in the following diagram.

APPENDIX B: STARTUP USER ADDRESS CONTROL ICONS
EN2Z-0940GE51 R0518 286
Switching Table Example This example shows how to set the start-up action for a two-stage ventilator. After power returns, the ventilator should start in the first stage, even if the Time Program that controls the ventilator requests the second stage. The following diagram shows the switching logic required for this application:
Gray Switching Table The switching table with the gray background defines start-up action after a power
failure.
Line 2 of the switching table contains the determining condition. The controller sets STARTUP to 1 before the application program starts. Because Line 2 contains a switch-on delay, the table transmits the 1 only after a delay of 20 seconds. Until then, the condition of this line, STARTUP=0, is true. After 20 seconds, the table senses STARTUP=1 and the condition is false. The table sets STARTUP to zero. Note that you do not use a switching table with a zero output because zero switching tables do not automatically toggle between 1 and 0. In other words, zero switching tables do not generate a one when they become false.
CAUTION Delay time (Te) must be larger than the maximum cycle time. This action guarantees that a DDC cycle is done before STARTUP switches to zero. Only then can other switching tables evaluate the negative cycle.
Line 3 of the table provides a “self-latching” function. If STARTUP was previously equal to 1, it sets STARTUP to 1 again. If STARTUP was previously equal to zero, it
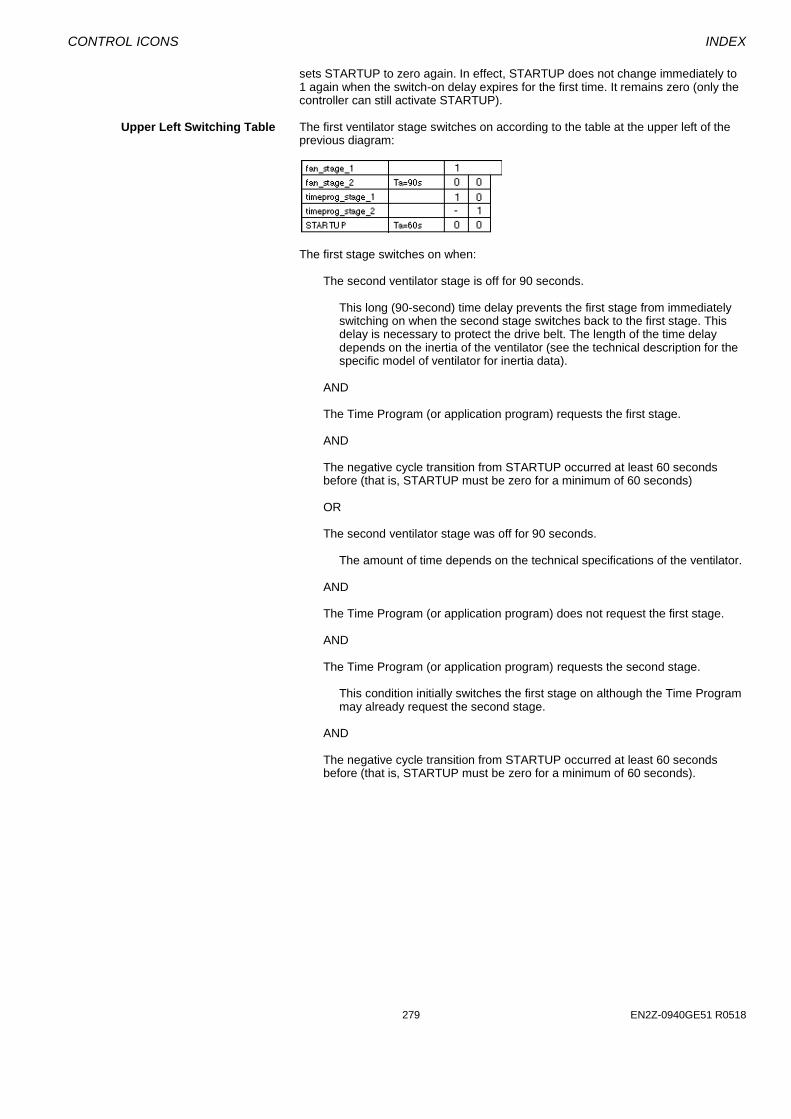
CONTROL ICONS INDEX
279 EN2Z-0940GE51 R0518
sets STARTUP to zero again. In effect, STARTUP does not change immediately to 1 again when the switch-on delay expires for the first time. It remains zero (only the controller can still activate STARTUP).
Upper Left Switching Table The first ventilator stage switches on according to the table at the upper left of the
previous diagram:
The first stage switches on when:
The second ventilator stage is off for 90 seconds.
This long (90-second) time delay prevents the first stage from immediately switching on when the second stage switches back to the first stage. This delay is necessary to protect the drive belt. The length of the time delay depends on the inertia of the ventilator (see the technical description for the specific model of ventilator for inertia data).
AND The Time Program (or application program) requests the first stage. AND The negative cycle transition from STARTUP occurred at least 60 seconds before (that is, STARTUP must be zero for a minimum of 60 seconds) OR The second ventilator stage was off for 90 seconds.
The amount of time depends on the technical specifications of the ventilator.
AND The Time Program (or application program) does not request the first stage. AND The Time Program (or application program) requests the second stage.
This condition initially switches the first stage on although the Time Program may already request the second stage.
AND The negative cycle transition from STARTUP occurred at least 60 seconds before (that is, STARTUP must be zero for a minimum of 60 seconds).

APPENDIX B: STARTUP USER ADDRESS CONTROL ICONS
EN2Z-0940GE51 R0518 286
The second stage switches on when:
The first ventilator stage is switched on for at least 60 seconds. AND The Time Program (or application program) requests the second stage.
These two conditions guarantee that the switch from first to second stage occurs 30 seconds after the second stage is requested.
AND The negative cycle transition from STARTUP occurred at least 60 seconds before (that is, STARTUP must be zero for a minimum of 60 seconds) OR The Time Program (or application program) requests the second stage. AND The second stage was already on.
These two conditions prevent the second stage from switching off immediately after switching on.
AND The negative cycle transition from STARTUP occurred at least 60 seconds before (that is, STARTUP must be zero for a minimum of 60 seconds).
Switching action summary: After power returns, nothing happens for 20 seconds, that is, both ventilator stages remain switched off even if the Time Program requests a stage. After the 20-second delay, there is another delay time of 60 seconds. This time varies ventilator switch-on in case there are multiple ventilators. When the 60-second time delay expires, there are two cases:
1. The Time Program requests the first stage. The first stage starts. 2. The Time Program requests the second stage. The first stage starts for 30
seconds to bring the ventilator into rotation. After a delay of 30 seconds, the first stage switches off and the second stage switches on.

CONTROL ICONS INDEX
281 EN2Z-0940GE51 R0518
When switching from the second stage back to the first stage, both stages switch off for 90 seconds. This action lets the ventilator “run out”. The first stage switches back on only after 90 seconds. This action serves the drive belt by avoiding abrupt changes in acceleration. The follow diagram illustrates switching action:
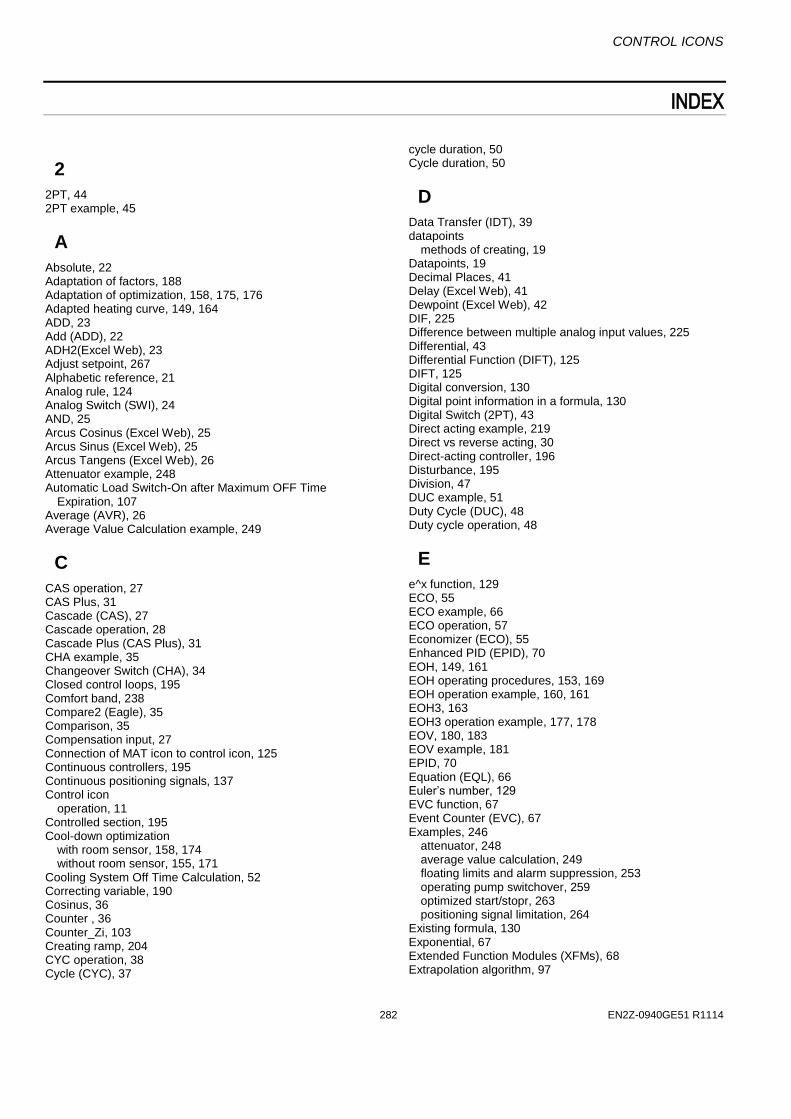
CONTROL ICONS
282 EN2Z-0940GE51 R1114
INDEX
2 2PT, 44 2PT example, 45
A
Absolute, 22 Adaptation of factors, 188 Adaptation of optimization, 158, 175, 176 Adapted heating curve, 149, 164 ADD, 23 Add (ADD), 22 ADH2(Excel Web), 23 Adjust setpoint, 267 Alphabetic reference, 21 Analog rule, 124 Analog Switch (SWI), 24 AND, 25 Arcus Cosinus (Excel Web), 25 Arcus Sinus (Excel Web), 25 Arcus Tangens (Excel Web), 26 Attenuator example, 248 Automatic Load Switch-On after Maximum OFF Time
Expiration, 107 Average (AVR), 26 Average Value Calculation example, 249
C
CAS operation, 27 CAS Plus, 31 Cascade (CAS), 27 Cascade operation, 28 Cascade Plus (CAS Plus), 31 CHA example, 35 Changeover Switch (CHA), 34 Closed control loops, 195 Comfort band, 238 Compare2 (Eagle), 35 Comparison, 35 Compensation input, 27 Connection of MAT icon to control icon, 125 Continuous controllers, 195 Continuous positioning signals, 137 Control icon
operation, 11 Controlled section, 195 Cool-down optimization
with room sensor, 158, 174 without room sensor, 155, 171
Cooling System Off Time Calculation, 52 Correcting variable, 190 Cosinus, 36 Counter , 36 Counter_Zi, 103 Creating ramp, 204 CYC operation, 38 Cycle (CYC), 37
cycle duration, 50 Cycle duration, 50
D Data Transfer (IDT), 39 datapoints
methods of creating, 19 Datapoints, 19 Decimal Places, 41 Delay (Excel Web), 41 Dewpoint (Excel Web), 42 DIF, 225 Difference between multiple analog input values, 225 Differential, 43 Differential Function (DIFT), 125 DIFT, 125 Digital conversion, 130 Digital point information in a formula, 130 Digital Switch (2PT), 43 Direct acting example, 219 Direct vs reverse acting, 30 Direct-acting controller, 196 Disturbance, 195 Division, 47 DUC example, 51 Duty Cycle (DUC), 48 Duty cycle operation, 48
E e^x function, 129 ECO, 55 ECO example, 66 ECO operation, 57 Economizer (ECO), 55 Enhanced PID (EPID), 70 EOH, 149, 161 EOH operating procedures, 153, 169 EOH operation example, 160, 161 EOH3, 163 EOH3 operation example, 177, 178 EOV, 180, 183 EOV example, 181 EPID, 70 Equation (EQL), 66 Euler’s number, 129 EVC function, 67 Event Counter (EVC), 67 Examples, 246
attenuator, 248 average value calculation, 249 floating limits and alarm suppression, 253 operating pump switchover, 259 optimized start/stopr, 263 positioning signal limitation, 264
Existing formula, 130 Exponential, 67 Extended Function Modules (XFMs), 68 Extrapolation algorithm, 97
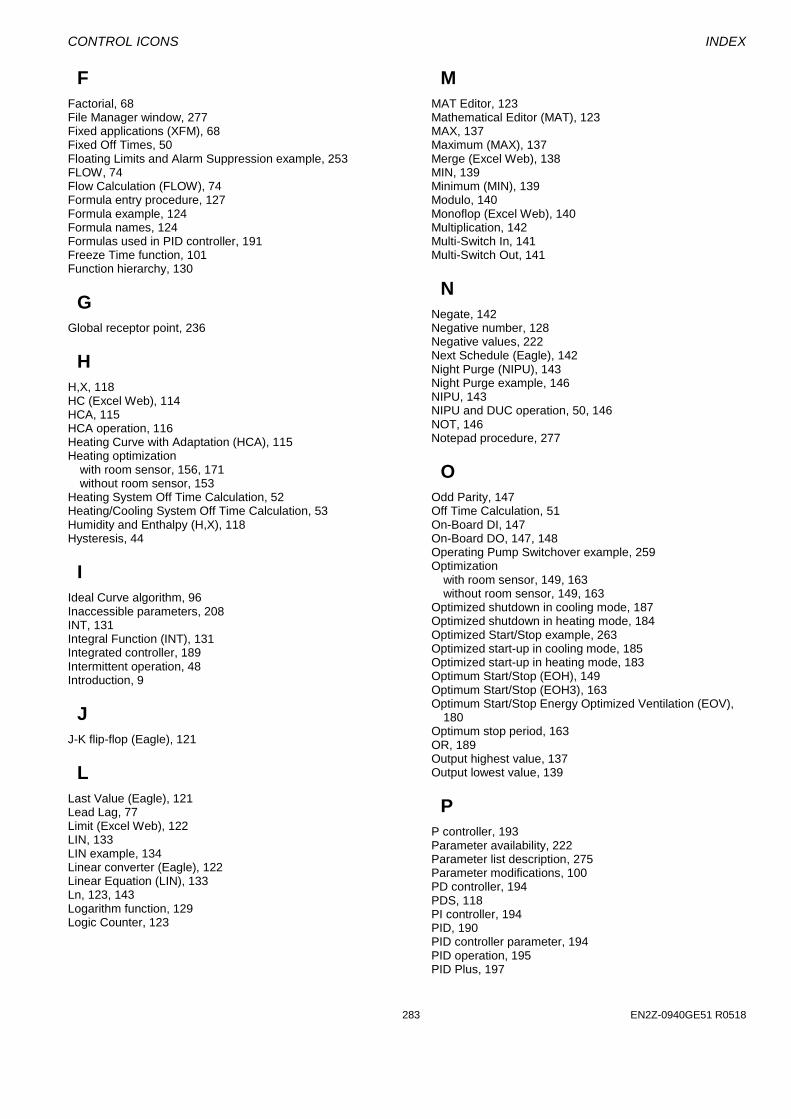
CONTROL ICONS INDEX
283 EN2Z-0940GE51 R0518
F
Factorial, 68 File Manager window, 277 Fixed applications (XFM), 68 Fixed Off Times, 50 Floating Limits and Alarm Suppression example, 253 FLOW, 74 Flow Calculation (FLOW), 74 Formula entry procedure, 127 Formula example, 124 Formula names, 124 Formulas used in PID controller, 191 Freeze Time function, 101 Function hierarchy, 130
G Global receptor point, 236
H H,X, 118 HC (Excel Web), 114 HCA, 115 HCA operation, 116 Heating Curve with Adaptation (HCA), 115 Heating optimization
with room sensor, 156, 171 without room sensor, 153
Heating System Off Time Calculation, 52 Heating/Cooling System Off Time Calculation, 53 Humidity and Enthalpy (H,X), 118 Hysteresis, 44
I Ideal Curve algorithm, 96 Inaccessible parameters, 208 INT, 131 Integral Function (INT), 131 Integrated controller, 189 Intermittent operation, 48 Introduction, 9
J J-K flip-flop (Eagle), 121
L
Last Value (Eagle), 121 Lead Lag, 77 Limit (Excel Web), 122 LIN, 133 LIN example, 134 Linear converter (Eagle), 122 Linear Equation (LIN), 133 Ln, 123, 143 Logarithm function, 129 Logic Counter, 123
M
MAT Editor, 123 Mathematical Editor (MAT), 123 MAX, 137 Maximum (MAX), 137 Merge (Excel Web), 138 MIN, 139 Minimum (MIN), 139 Modulo, 140 Monoflop (Excel Web), 140 Multiplication, 142 Multi-Switch In, 141 Multi-Switch Out, 141
N
Negate, 142 Negative number, 128 Negative values, 222 Next Schedule (Eagle), 142 Night Purge (NIPU), 143 Night Purge example, 146 NIPU, 143 NIPU and DUC operation, 50, 146 NOT, 146 Notepad procedure, 277
O Odd Parity, 147 Off Time Calculation, 51 On-Board DI, 147 On-Board DO, 147, 148 Operating Pump Switchover example, 259 Optimization
with room sensor, 149, 163 without room sensor, 149, 163
Optimized shutdown in cooling mode, 187 Optimized shutdown in heating mode, 184 Optimized Start/Stop example, 263 Optimized start-up in cooling mode, 185 Optimized start-up in heating mode, 183 Optimum Start/Stop (EOH), 149 Optimum Start/Stop (EOH3), 163 Optimum Start/Stop Energy Optimized Ventilation (EOV),
180 Optimum stop period, 163 OR, 189 Output highest value, 137 Output lowest value, 139
P P controller, 193 Parameter availability, 222 Parameter list description, 275 Parameter modifications, 100 PD controller, 194 PDS, 118 PI controller, 194 PID, 190 PID controller parameter, 194 PID operation, 195 PID Plus, 197
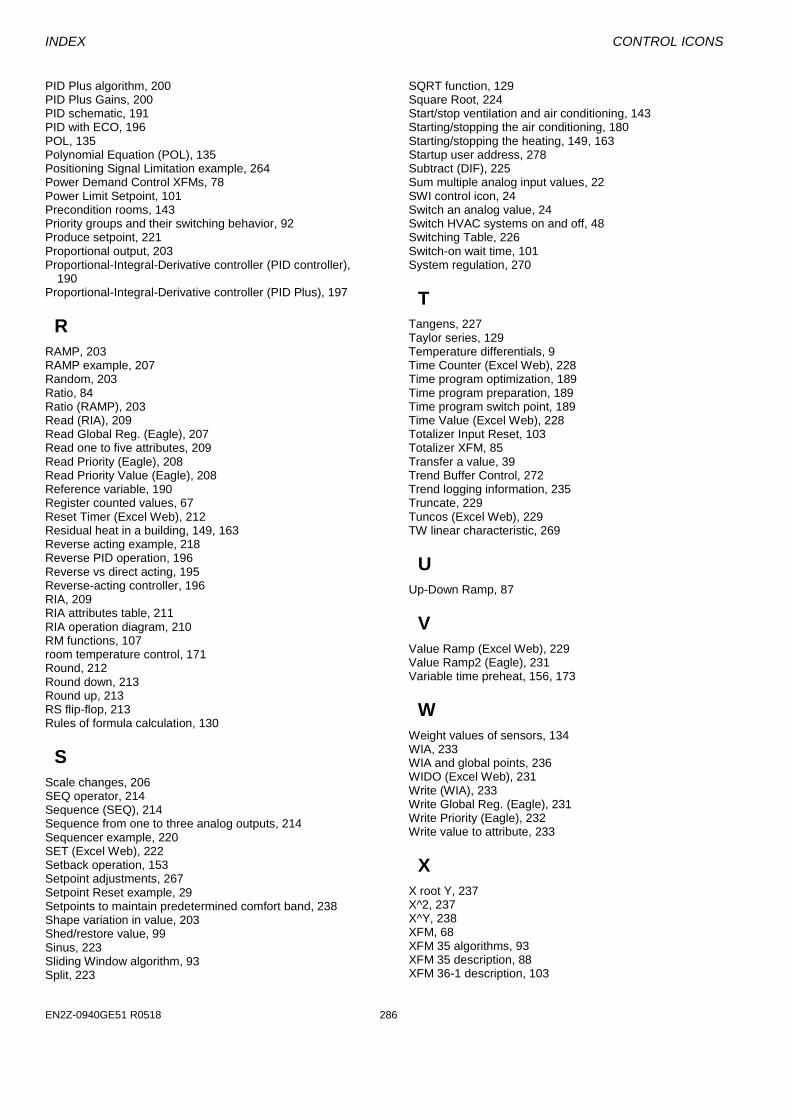
INDEX CONTROL ICONS
EN2Z-0940GE51 R0518 286
PID Plus algorithm, 200 PID Plus Gains, 200 PID schematic, 191 PID with ECO, 196 POL, 135 Polynomial Equation (POL), 135 Positioning Signal Limitation example, 264 Power Demand Control XFMs, 78 Power Limit Setpoint, 101 Precondition rooms, 143 Priority groups and their switching behavior, 92 Produce setpoint, 221 Proportional output, 203 Proportional-Integral-Derivative controller (PID controller),
190 Proportional-Integral-Derivative controller (PID Plus), 197
R RAMP, 203 RAMP example, 207 Random, 203 Ratio, 84 Ratio (RAMP), 203 Read (RIA), 209 Read Global Reg. (Eagle), 207 Read one to five attributes, 209 Read Priority (Eagle), 208 Read Priority Value (Eagle), 208 Reference variable, 190 Register counted values, 67 Reset Timer (Excel Web), 212 Residual heat in a building, 149, 163 Reverse acting example, 218 Reverse PID operation, 196 Reverse vs direct acting, 195 Reverse-acting controller, 196 RIA, 209 RIA attributes table, 211 RIA operation diagram, 210 RM functions, 107 room temperature control, 171 Round, 212 Round down, 213 Round up, 213 RS flip-flop, 213 Rules of formula calculation, 130
S Scale changes, 206 SEQ operator, 214 Sequence (SEQ), 214 Sequence from one to three analog outputs, 214 Sequencer example, 220 SET (Excel Web), 222 Setback operation, 153 Setpoint adjustments, 267 Setpoint Reset example, 29 Setpoints to maintain predetermined comfort band, 238 Shape variation in value, 203 Shed/restore value, 99 Sinus, 223 Sliding Window algorithm, 93 Split, 223
SQRT function, 129 Square Root, 224 Start/stop ventilation and air conditioning, 143 Starting/stopping the air conditioning, 180 Starting/stopping the heating, 149, 163 Startup user address, 278 Subtract (DIF), 225 Sum multiple analog input values, 22 SWI control icon, 24 Switch an analog value, 24 Switch HVAC systems on and off, 48 Switching Table, 226 Switch-on wait time, 101 System regulation, 270
T Tangens, 227 Taylor series, 129 Temperature differentials, 9 Time Counter (Excel Web), 228 Time program optimization, 189 Time program preparation, 189 Time program switch point, 189 Time Value (Excel Web), 228 Totalizer Input Reset, 103 Totalizer XFM, 85 Transfer a value, 39 Trend Buffer Control, 272 Trend logging information, 235 Truncate, 229 Tuncos (Excel Web), 229 TW linear characteristic, 269
U Up-Down Ramp, 87
V Value Ramp (Excel Web), 229 Value Ramp2 (Eagle), 231 Variable time preheat, 156, 173
W
Weight values of sensors, 134 WIA, 233 WIA and global points, 236 WIDO (Excel Web), 231 Write (WIA), 233 Write Global Reg. (Eagle), 231 Write Priority (Eagle), 232 Write value to attribute, 233
X X root Y, 237 X^2, 237 X^Y, 238 XFM, 68 XFM 35 algorithms, 93 XFM 35 description, 88 XFM 36-1 description, 103

CONTROL ICONS INDEX
285 EN2Z-0940GE51 R0518
XFM 36-1 general functions, 108 XFM 36-1 Priority Group assignment, 109 XFM 36-1/R Rotational Load Switching, 112 XFM 36-1/S Sequential Load Switching, 110 XFM 36-1/S/R Switching Behavior, 109 XFMs in custom control strategies, 69 XOR Table, 238
Y Year-round compensated space setpoint, 207
Z
ZEB, 238 ZEB Cooling operation, 243 ZEB Dehumidification, 244 ZEB example, 245 ZEB Heating operation, 243 ZEB Mixed Air operation, 242 ZEB operation, 241 Zero Energy Band (ZEB), 238

Manufactured for and on behalf of the Environmental and Energy Solutions Division of Honeywell Technologies Sàrl, Rolle, Z.A. La Pièce 16, Switzerland by its Authorized Representative
CentraLine
Honeywell GmbH
Böblinger Strasse 17
71101 Schönaich, Germany
Phone +49 (0) 7031 637 845
Fax +49 (0) 7031 637 740
www.centraline.com
Subject to change without notice
EN2Z-0940GE51 R0518