Embed Size (px)
Citation preview

Excel as an Organizational & Litigation Tool
AOKI LAW PLLC Russell M. Aoki, Leslie Miller, Isham Reavis & Kate Snow
DEFENDER SERVICES OFFICE TRAINING DIVISION Sean Broderick National Litigation Support Administrator
Excel as an Organizational & Litigation Tool i
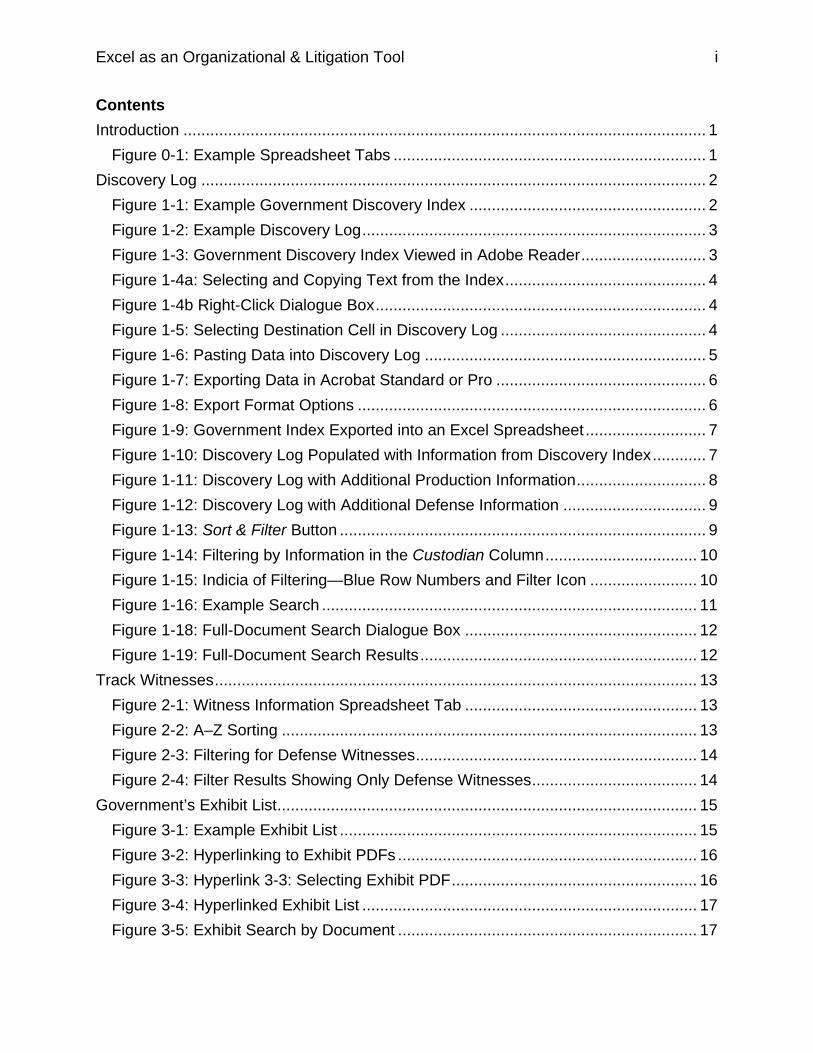
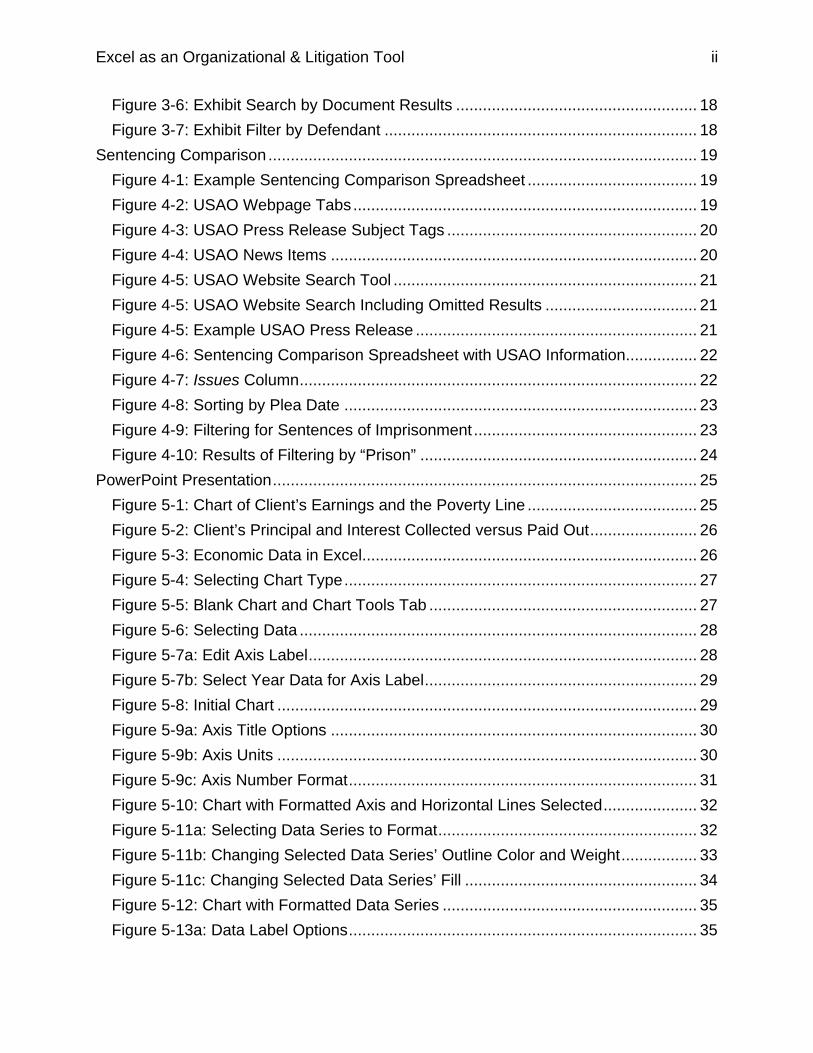
Contents Introduction ..................................................................................................................... 1
Figure 0-1: Example Spreadsheet Tabs ...................................................................... 1
Discovery Log ................................................................................................................. 2
Figure 1-1: Example Government Discovery Index ..................................................... 2
Figure 1-2: Example Discovery Log ............................................................................. 3
Figure 1-3: Government Discovery Index Viewed in Adobe Reader ............................ 3
Figure 1-4a: Selecting and Copying Text from the Index ............................................. 4
Figure 1-4b Right-Click Dialogue Box .......................................................................... 4
Figure 1-5: Selecting Destination Cell in Discovery Log .............................................. 4
Figure 1-6: Pasting Data into Discovery Log ............................................................... 5
Figure 1-7: Exporting Data in Acrobat Standard or Pro ............................................... 6
Figure 1-8: Export Format Options .............................................................................. 6
Figure 1-9: Government Index Exported into an Excel Spreadsheet ........................... 7
Figure 1-10: Discovery Log Populated with Information from Discovery Index ............ 7
Figure 1-11: Discovery Log with Additional Production Information ............................. 8
Figure 1-12: Discovery Log with Additional Defense Information ................................ 9
Figure 1-13: Sort & Filter Button .................................................................................. 9
Figure 1-14: Filtering by Information in the Custodian Column .................................. 10
Figure 1-15: Indicia of Filtering—Blue Row Numbers and Filter Icon ........................ 10
Figure 1-16: Example Search .................................................................................... 11
Figure 1-18: Full-Document Search Dialogue Box .................................................... 12
Figure 1-19: Full-Document Search Results .............................................................. 12
Track Witnesses ............................................................................................................ 13
Figure 2-1: Witness Information Spreadsheet Tab .................................................... 13
Figure 2-2: A–Z Sorting ............................................................................................. 13
Figure 2-3: Filtering for Defense Witnesses ............................................................... 14
Figure 2-4: Filter Results Showing Only Defense Witnesses ..................................... 14
Government’s Exhibit List .............................................................................................. 15
Figure 3-1: Example Exhibit List ................................................................................ 15
Figure 3-2: Hyperlinking to Exhibit PDFs ................................................................... 16
Figure 3-3: Hyperlink 3-3: Selecting Exhibit PDF ....................................................... 16
Figure 3-4: Hyperlinked Exhibit List ........................................................................... 17
Figure 3-5: Exhibit Search by Document ................................................................... 17
Excel as an Organizational & Litigation Tool ii
Figure 3-6: Exhibit Search by Document Results ...................................................... 18
Figure 3-7: Exhibit Filter by Defendant ...................................................................... 18
Sentencing Comparison ................................................................................................ 19
Figure 4-1: Example Sentencing Comparison Spreadsheet ...................................... 19
Figure 4-2: USAO Webpage Tabs ............................................................................. 19
Figure 4-3: USAO Press Release Subject Tags ........................................................ 20
Figure 4-4: USAO News Items .................................................................................. 20
Figure 4-5: USAO Website Search Tool .................................................................... 21
Figure 4-5: USAO Website Search Including Omitted Results .................................. 21
Figure 4-5: Example USAO Press Release ............................................................... 21
Figure 4-6: Sentencing Comparison Spreadsheet with USAO Information ................ 22
Figure 4-7: Issues Column ......................................................................................... 22
Figure 4-8: Sorting by Plea Date ............................................................................... 23
Figure 4-9: Filtering for Sentences of Imprisonment .................................................. 23
Figure 4-10: Results of Filtering by “Prison” .............................................................. 24
PowerPoint Presentation ............................................................................................... 25
Figure 5-1: Chart of Client’s Earnings and the Poverty Line ...................................... 25
Figure 5-2: Client’s Principal and Interest Collected versus Paid Out ........................ 26
Figure 5-3: Economic Data in Excel........................................................................... 26
Figure 5-4: Selecting Chart Type ............................................................................... 27
Figure 5-5: Blank Chart and Chart Tools Tab ............................................................ 27
Figure 5-6: Selecting Data ......................................................................................... 28
Figure 5-7a: Edit Axis Label ....................................................................................... 28
Figure 5-7b: Select Year Data for Axis Label ............................................................. 29
Figure 5-8: Initial Chart .............................................................................................. 29
Figure 5-9a: Axis Title Options .................................................................................. 30
Figure 5-9b: Axis Units .............................................................................................. 30
Figure 5-9c: Axis Number Format .............................................................................. 31
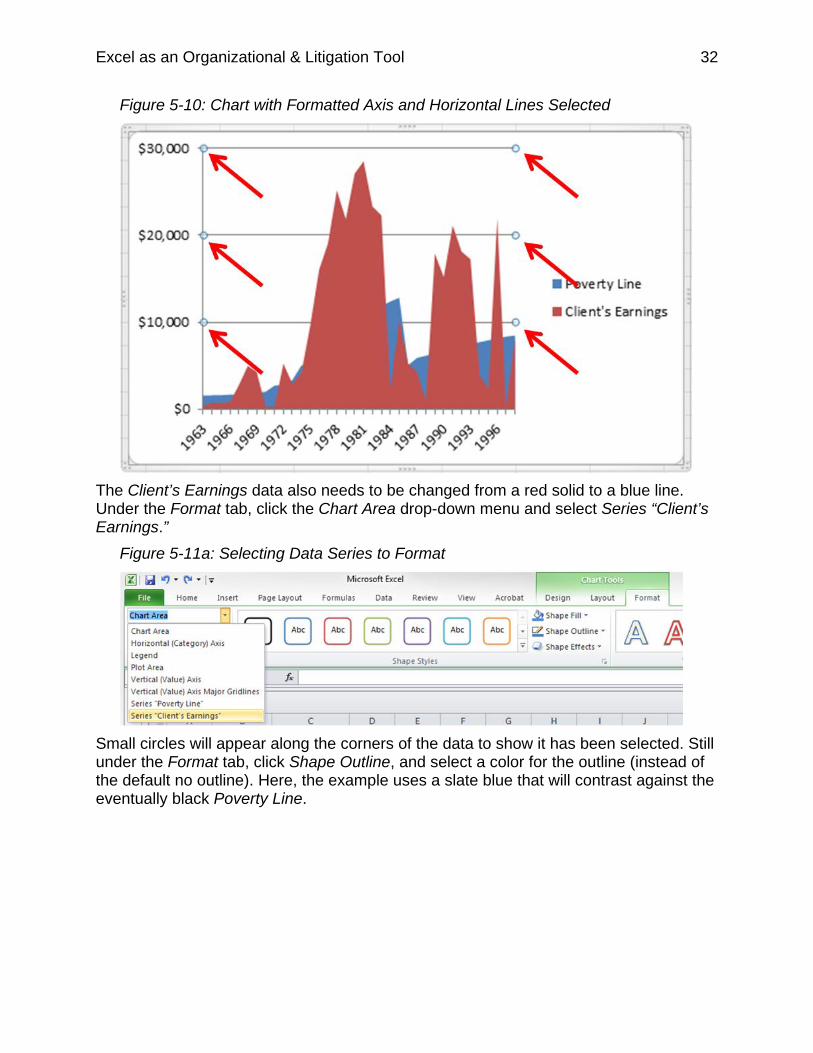
Figure 5-10: Chart with Formatted Axis and Horizontal Lines Selected ..................... 32
Figure 5-11a: Selecting Data Series to Format .......................................................... 32
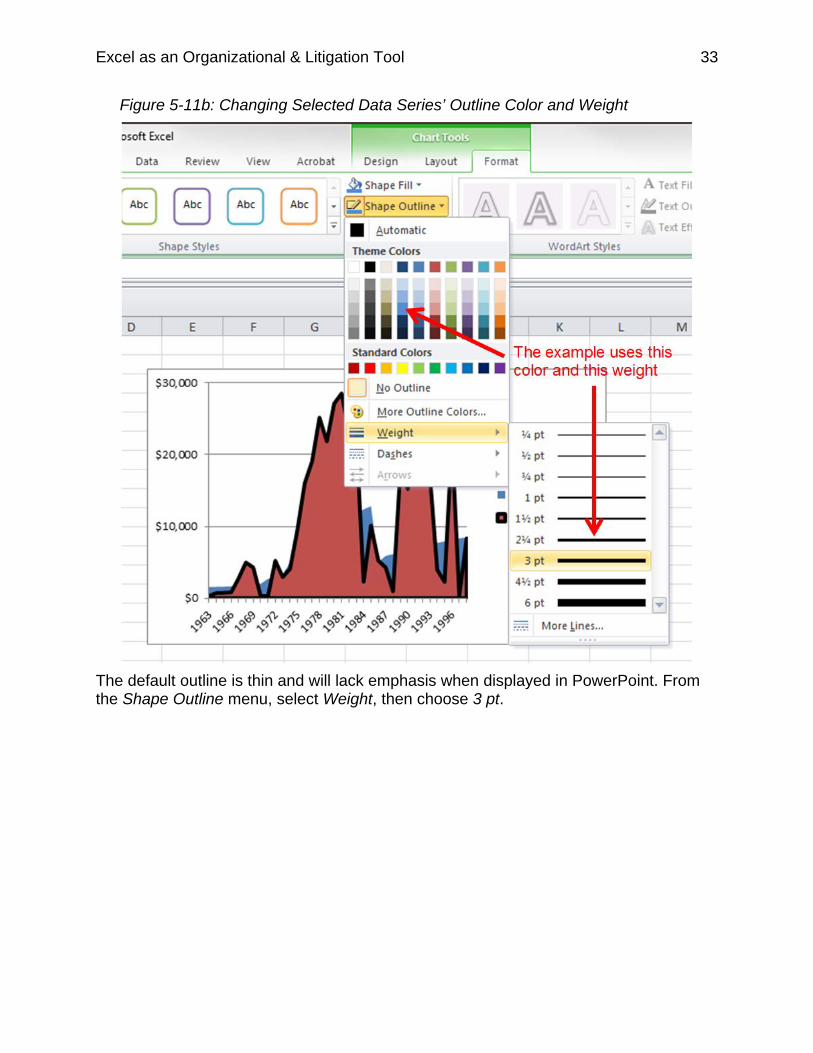
Figure 5-11b: Changing Selected Data Series’ Outline Color and Weight ................. 33
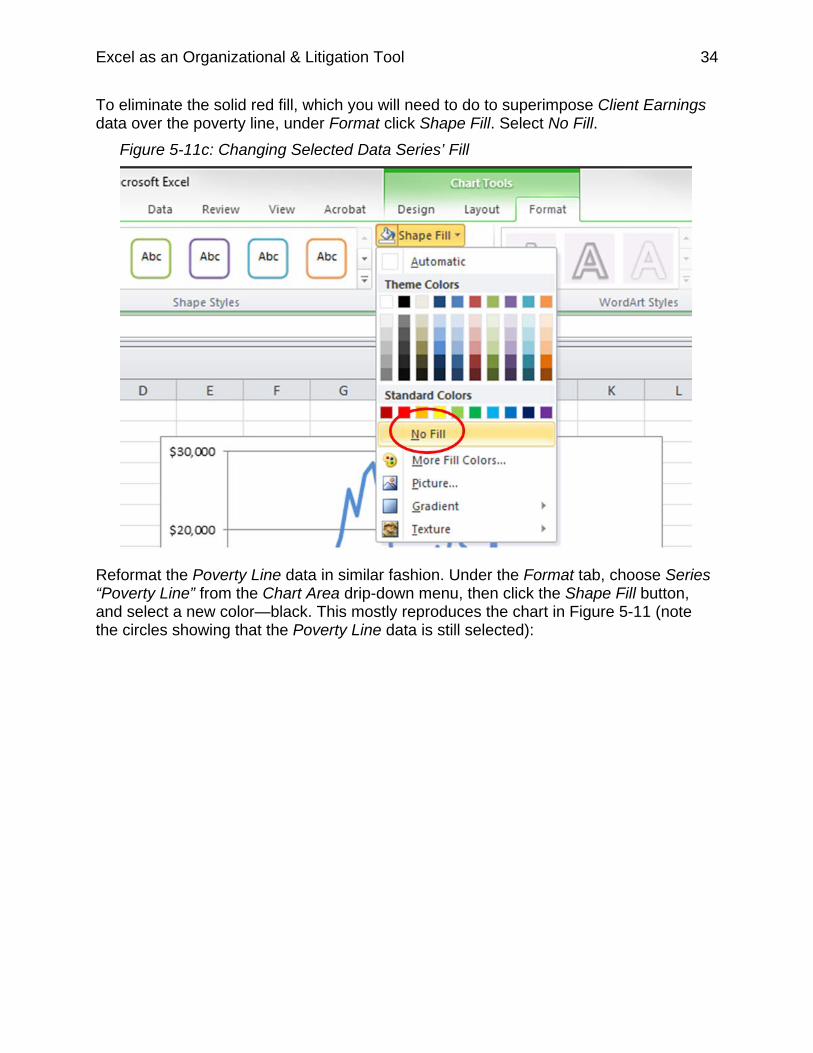
Figure 5-11c: Changing Selected Data Series’ Fill .................................................... 34
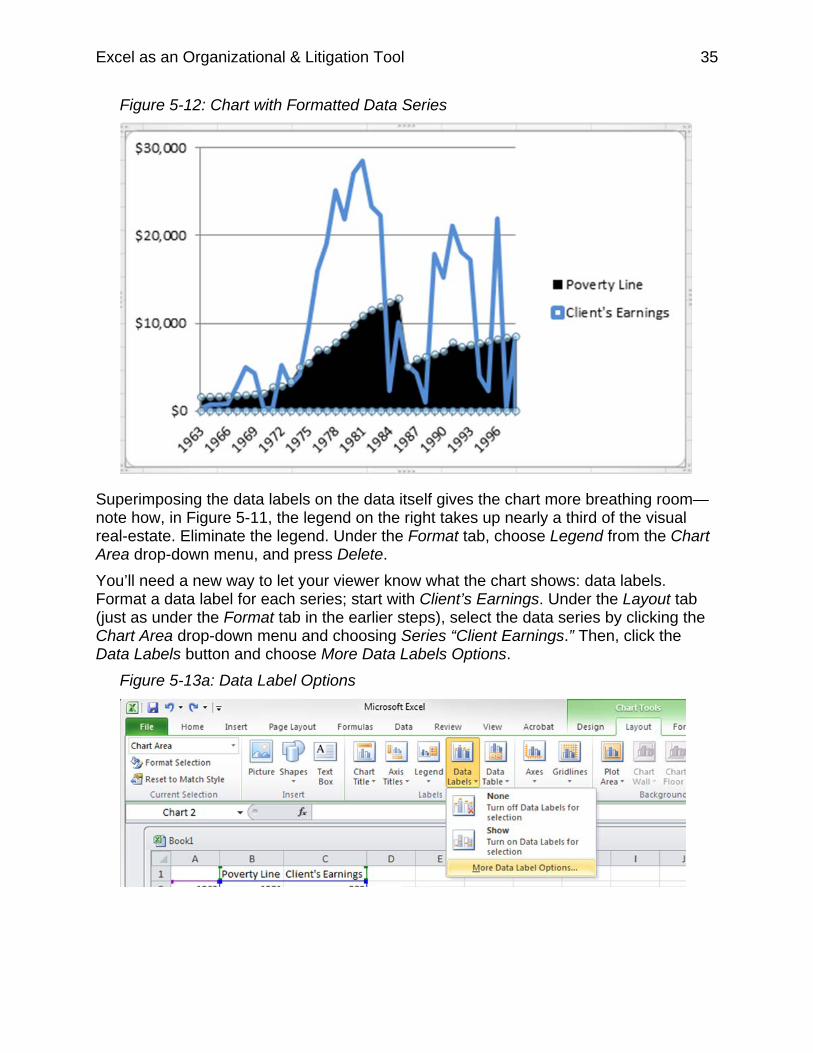
Figure 5-12: Chart with Formatted Data Series ......................................................... 35
Figure 5-13a: Data Label Options .............................................................................. 35
Excel as an Organizational & Litigation Tool iii
Figure 5-13b: Adding a Data Label for Series Name ................................................. 36
Figure 5-13c: Selecting the Data Label ...................................................................... 37
Figure 5-13d: Changing Data Label Text Color ......................................................... 37
Figure 5-13e: Formatted and Positioned Data Label ................................................. 38
Figure 5-13f: Chart with Formatted Data Labels ........................................................ 38
Figure 5-14a: Choosing a Shape to Insert Into the Chart .......................................... 39
Figure 5-14b: Selected Line Shape ........................................................................... 39
Figure 5-14c: Changing Line Format ......................................................................... 40
Figure 5-15a: Text Box .............................................................................................. 40
Figure 5-15b: Typing in the Text Box ......................................................................... 41
Figure 5-16: PowerPoint Slide with Chart .................................................................. 41
Conclusion .................................................................................................................... 42
Additional Help .............................................................................................................. 42
Excel as an Organizational & Litigation Tool 1
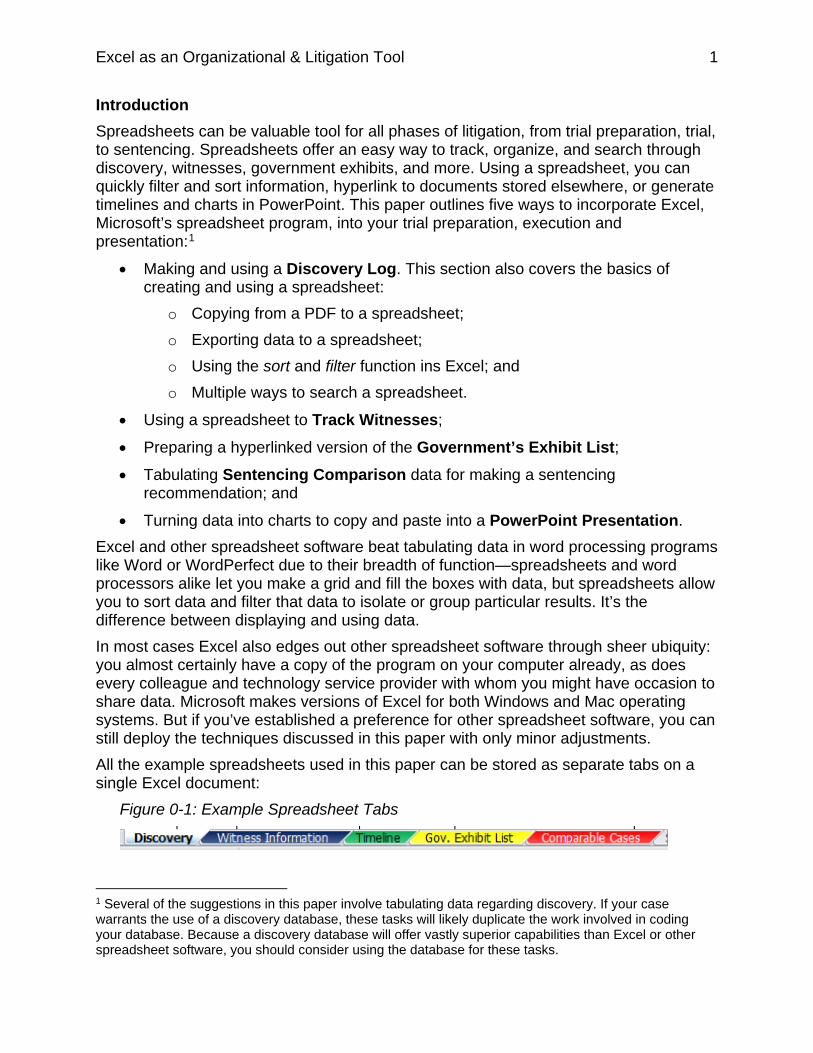
Introduction Spreadsheets can be valuable tool for all phases of litigation, from trial preparation, trial, to sentencing. Spreadsheets offer an easy way to track, organize, and search through discovery, witnesses, government exhibits, and more. Using a spreadsheet, you can quickly filter and sort information, hyperlink to documents stored elsewhere, or generate timelines and charts in PowerPoint. This paper outlines five ways to incorporate Excel, Microsoft’s spreadsheet program, into your trial preparation, execution and presentation:1
• Making and using a Discovery Log. This section also covers the basics of creating and using a spreadsheet:
o Copying from a PDF to a spreadsheet; o Exporting data to a spreadsheet; o Using the sort and filter function ins Excel; and o Multiple ways to search a spreadsheet.
• Using a spreadsheet to Track Witnesses;
• Preparing a hyperlinked version of the Government’s Exhibit List; • Tabulating Sentencing Comparison data for making a sentencing
recommendation; and
• Turning data into charts to copy and paste into a PowerPoint Presentation. Excel and other spreadsheet software beat tabulating data in word processing programs like Word or WordPerfect due to their breadth of function—spreadsheets and word processors alike let you make a grid and fill the boxes with data, but spreadsheets allow you to sort data and filter that data to isolate or group particular results. It’s the difference between displaying and using data. In most cases Excel also edges out other spreadsheet software through sheer ubiquity: you almost certainly have a copy of the program on your computer already, as does every colleague and technology service provider with whom you might have occasion to share data. Microsoft makes versions of Excel for both Windows and Mac operating systems. But if you’ve established a preference for other spreadsheet software, you can still deploy the techniques discussed in this paper with only minor adjustments. All the example spreadsheets used in this paper can be stored as separate tabs on a single Excel document:
Figure 0-1: Example Spreadsheet Tabs
1 Several of the suggestions in this paper involve tabulating data regarding discovery. If your case warrants the use of a discovery database, these tasks will likely duplicate the work involved in coding your database. Because a discovery database will offer vastly superior capabilities than Excel or other spreadsheet software, you should consider using the database for these tasks.
Excel as an Organizational & Litigation Tool 2
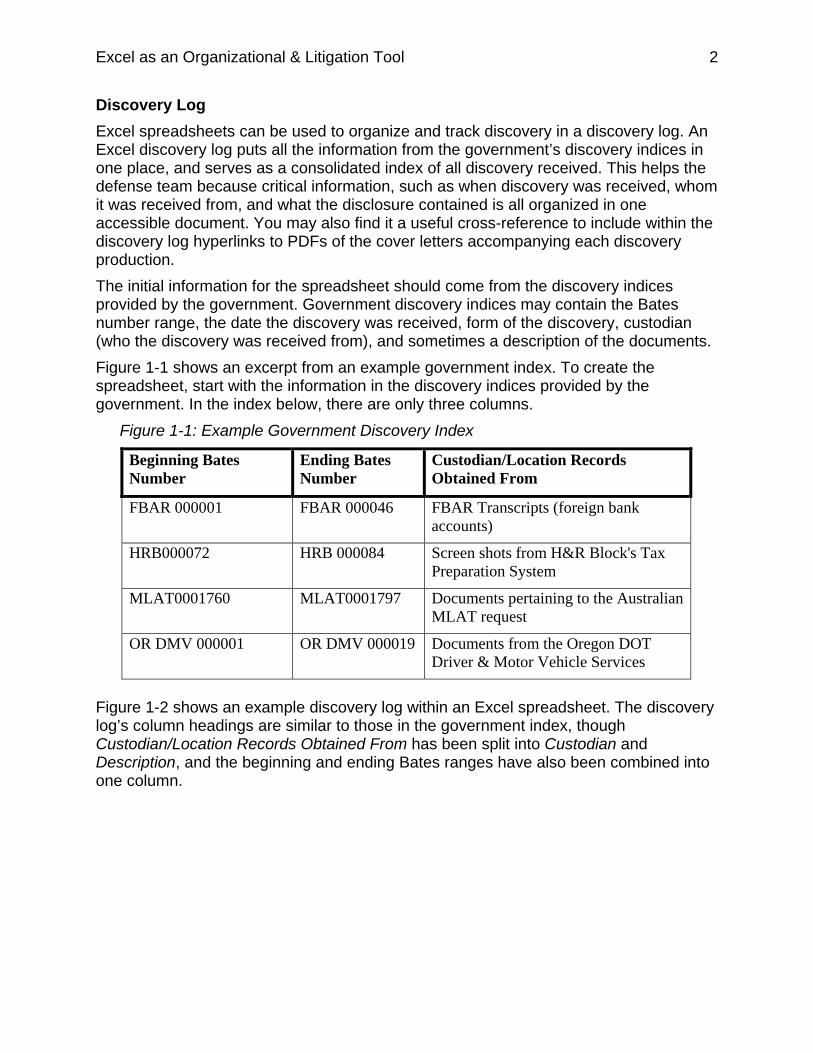
Discovery Log Excel spreadsheets can be used to organize and track discovery in a discovery log. An Excel discovery log puts all the information from the government’s discovery indices in one place, and serves as a consolidated index of all discovery received. This helps the defense team because critical information, such as when discovery was received, whom it was received from, and what the disclosure contained is all organized in one accessible document. You may also find it a useful cross-reference to include within the discovery log hyperlinks to PDFs of the cover letters accompanying each discovery production. The initial information for the spreadsheet should come from the discovery indices provided by the government. Government discovery indices may contain the Bates number range, the date the discovery was received, form of the discovery, custodian (who the discovery was received from), and sometimes a description of the documents. Figure 1-1 shows an excerpt from an example government index. To create the spreadsheet, start with the information in the discovery indices provided by the government. In the index below, there are only three columns.
Figure 1-1: Example Government Discovery Index
Beginning Bates Number
Ending Bates Number
Custodian/Location Records Obtained From
FBAR 000001 FBAR 000046 FBAR Transcripts (foreign bank accounts)
HRB000072 HRB 000084 Screen shots from H&R Block's Tax Preparation System
MLAT0001760 MLAT0001797 Documents pertaining to the Australian MLAT request
OR DMV 000001 OR DMV 000019 Documents from the Oregon DOT Driver & Motor Vehicle Services
Figure 1-2 shows an example discovery log within an Excel spreadsheet. The discovery log’s column headings are similar to those in the government index, though Custodian/Location Records Obtained From has been split into Custodian and Description, and the beginning and ending Bates ranges have also been combined into one column.
Excel as an Organizational & Litigation Tool 3
Figure 1-2: Example Discovery Log
If you have searchable PDFs of the government’s indices, you may be able to copy and paste the information into the discovery spreadsheet. When using the copy-and-paste-function, you may find differences in the quality of text copied from a computer-generated document compared with scanned paper that was made searchable with optical character recognition. Be sure to check the latter for errors. To transfer the information, open the searchable PDF in an Adobe Acrobat program (Adobe Reader, Acrobat Standard, or Acrobat Pro).
Figure 1-3: Government Discovery Index Viewed in Adobe Reader
Excel as an Organizational & Litigation Tool 4
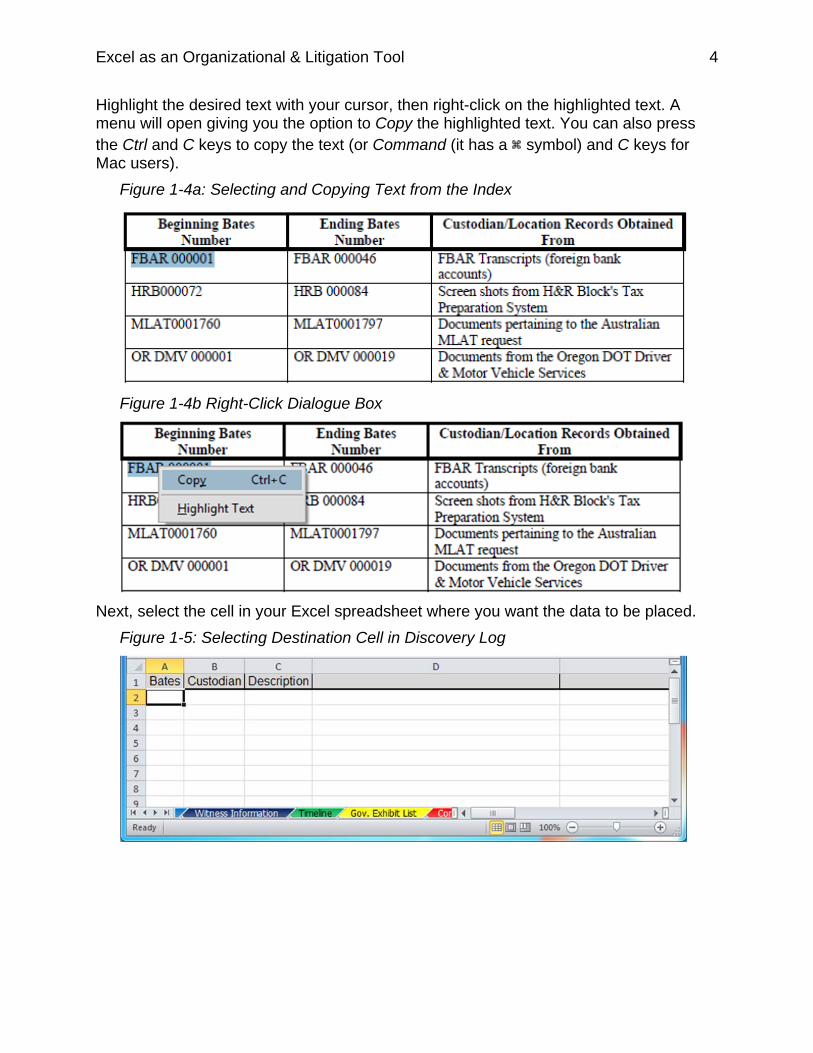
Highlight the desired text with your cursor, then right-click on the highlighted text. A menu will open giving you the option to Copy the highlighted text. You can also press the Ctrl and C keys to copy the text (or Command (it has a symbol) and C keys for Mac users).
Figure 1-4a: Selecting and Copying Text from the Index
Figure 1-4b Right-Click Dialogue Box
Next, select the cell in your Excel spreadsheet where you want the data to be placed.
Figure 1-5: Selecting Destination Cell in Discovery Log
Excel as an Organizational & Litigation Tool 5
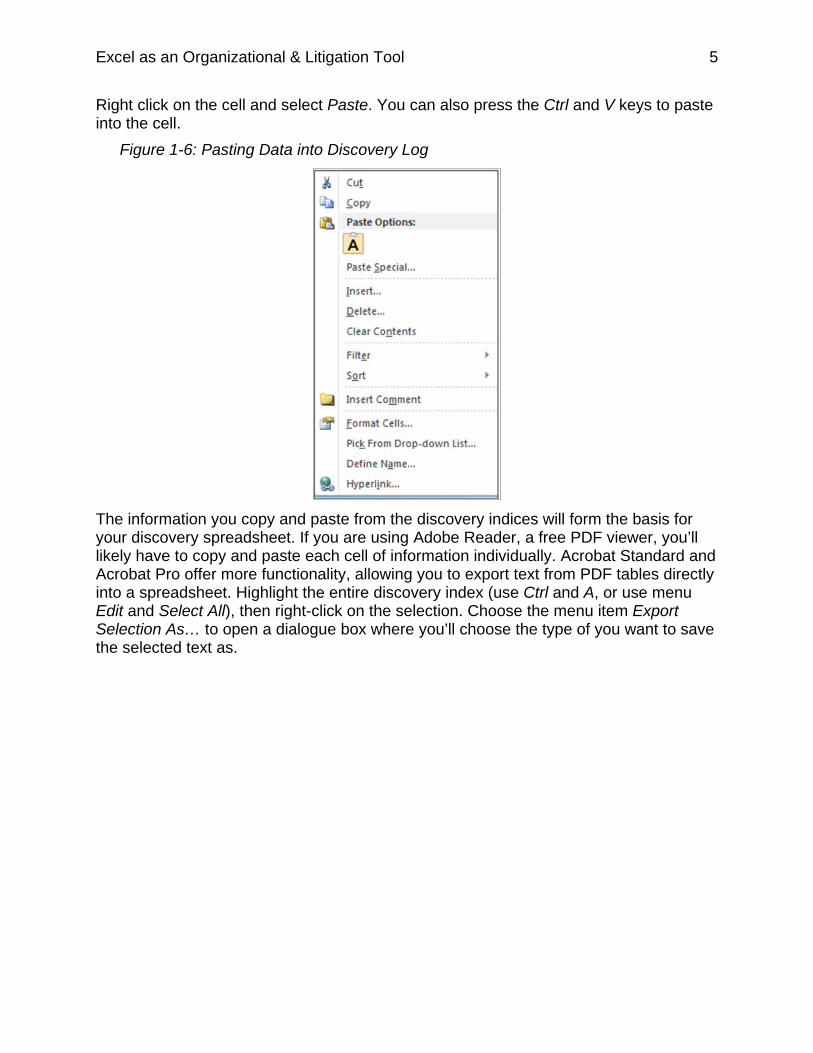
Right click on the cell and select Paste. You can also press the Ctrl and V keys to paste into the cell.
Figure 1-6: Pasting Data into Discovery Log
The information you copy and paste from the discovery indices will form the basis for your discovery spreadsheet. If you are using Adobe Reader, a free PDF viewer, you’ll likely have to copy and paste each cell of information individually. Acrobat Standard and Acrobat Pro offer more functionality, allowing you to export text from PDF tables directly into a spreadsheet. Highlight the entire discovery index (use Ctrl and A, or use menu Edit and Select All), then right-click on the selection. Choose the menu item Export Selection As… to open a dialogue box where you’ll choose the type of you want to save the selected text as.
Excel as an Organizational & Litigation Tool 6
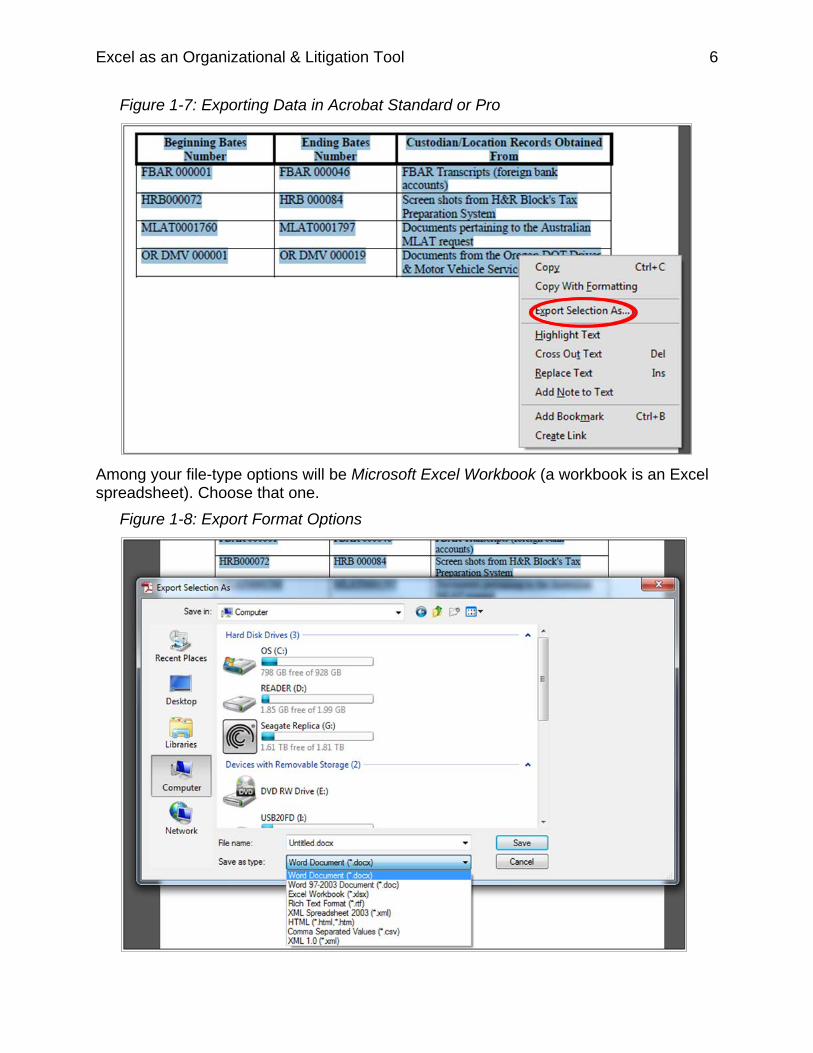
Figure 1-7: Exporting Data in Acrobat Standard or Pro
Among your file-type options will be Microsoft Excel Workbook (a workbook is an Excel spreadsheet). Choose that one.
Figure 1-8: Export Format Options
Excel as an Organizational & Litigation Tool 7
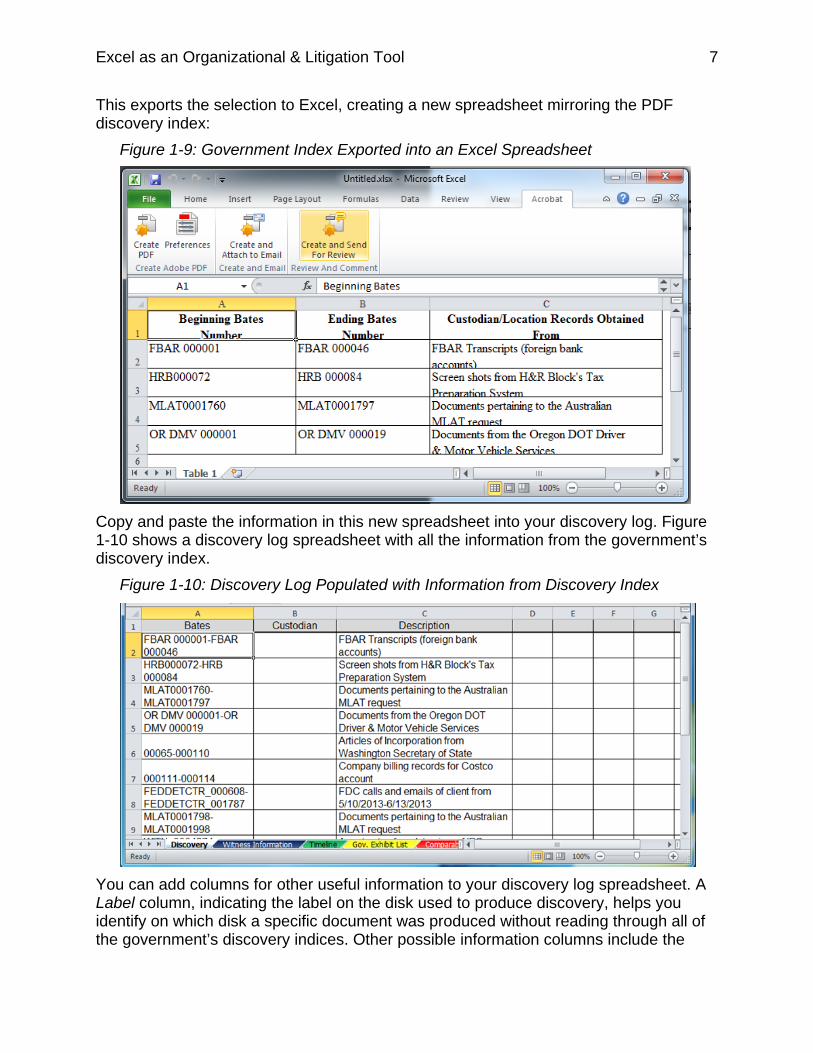
This exports the selection to Excel, creating a new spreadsheet mirroring the PDF discovery index:
Figure 1-9: Government Index Exported into an Excel Spreadsheet
Copy and paste the information in this new spreadsheet into your discovery log. Figure 1-10 shows a discovery log spreadsheet with all the information from the government’s discovery index.
Figure 1-10: Discovery Log Populated with Information from Discovery Index
You can add columns for other useful information to your discovery log spreadsheet. A Label column, indicating the label on the disk used to produce discovery, helps you identify on which disk a specific document was produced without reading through all of the government’s discovery indices. Other possible information columns include the
Excel as an Organizational & Litigation Tool 8
date you received the discovery, the media of production, and who provided the discovery (the government as opposed to previous counsel, for example). You will find most of this information in the discovery indices or from your personal experience. Some U.S. Attorney’s Offices will also inform you of the custodian for each item of discovery; other times you can glean this from the discovery index. In Figure 1-10’s example, the government identifies custodians in the description. Figure 1-11 shows a discovery log with columns added for additional information regarding the manner of production.
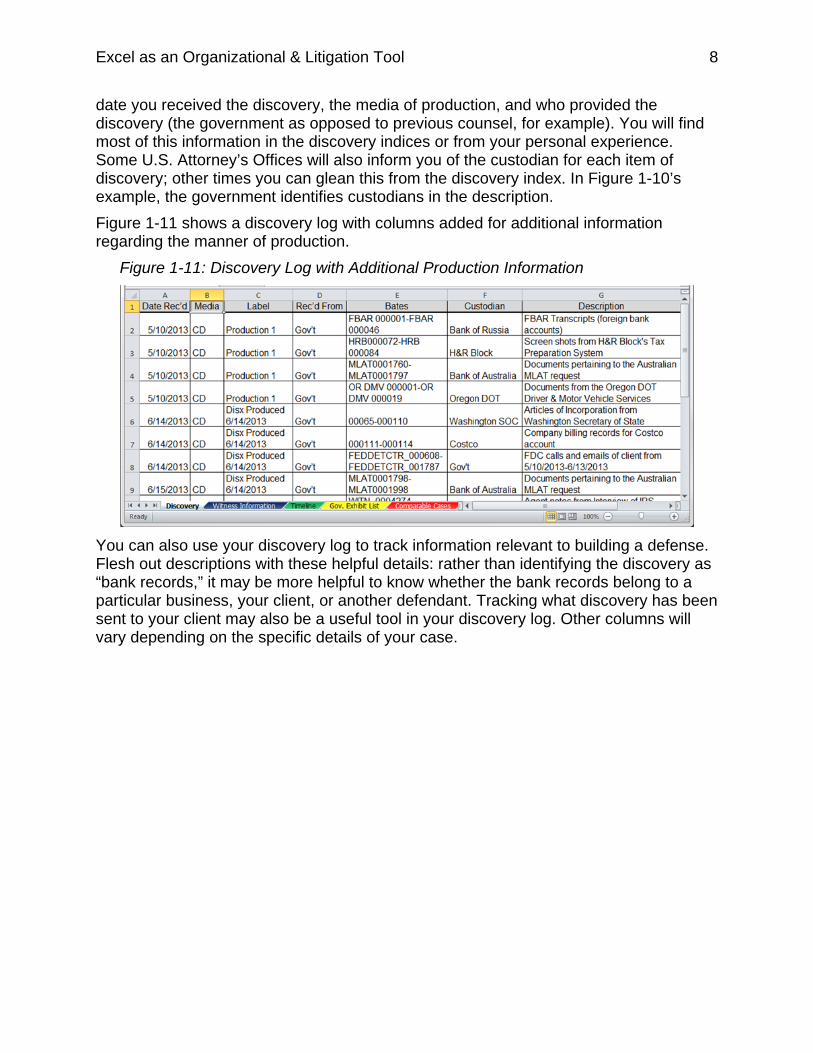
Figure 1-11: Discovery Log with Additional Production Information
You can also use your discovery log to track information relevant to building a defense. Flesh out descriptions with these helpful details: rather than identifying the discovery as “bank records,” it may be more helpful to know whether the bank records belong to a particular business, your client, or another defendant. Tracking what discovery has been sent to your client may also be a useful tool in your discovery log. Other columns will vary depending on the specific details of your case.
Excel as an Organizational & Litigation Tool 9
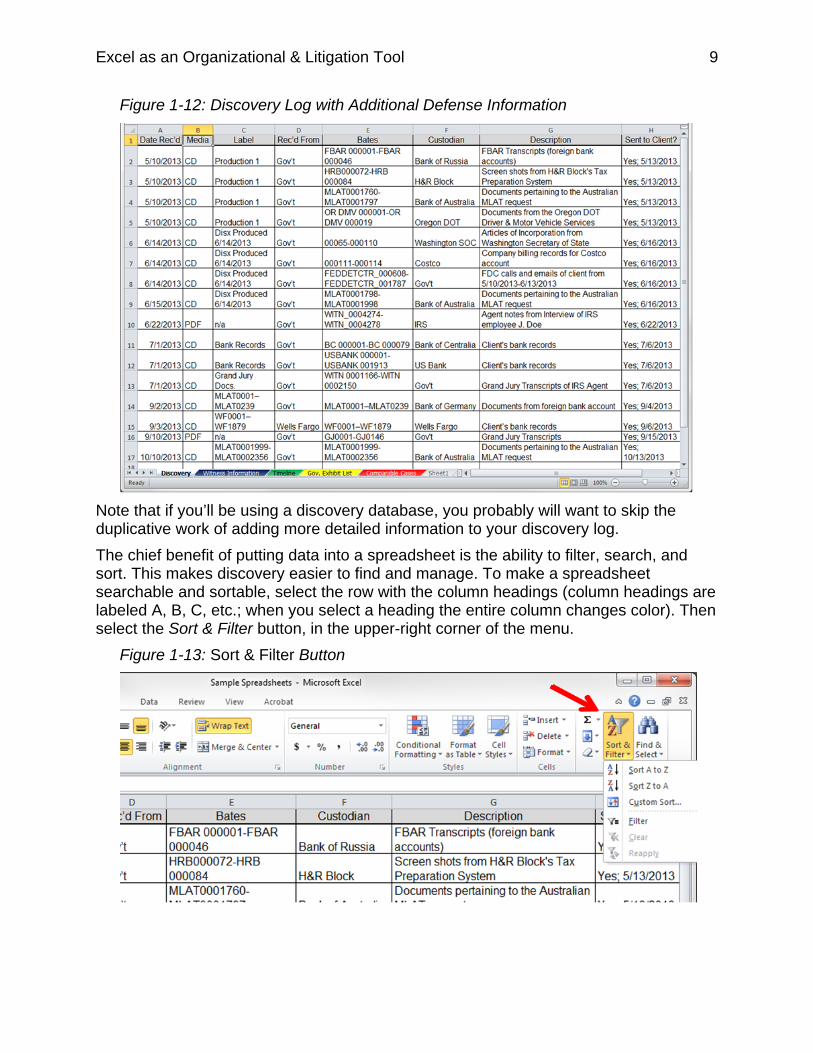
Figure 1-12: Discovery Log with Additional Defense Information
Note that if you’ll be using a discovery database, you probably will want to skip the duplicative work of adding more detailed information to your discovery log. The chief benefit of putting data into a spreadsheet is the ability to filter, search, and sort. This makes discovery easier to find and manage. To make a spreadsheet searchable and sortable, select the row with the column headings (column headings are labeled A, B, C, etc.; when you select a heading the entire column changes color). Then select the Sort & Filter button, in the upper-right corner of the menu.
Figure 1-13: Sort & Filter Button
Excel as an Organizational & Litigation Tool 10
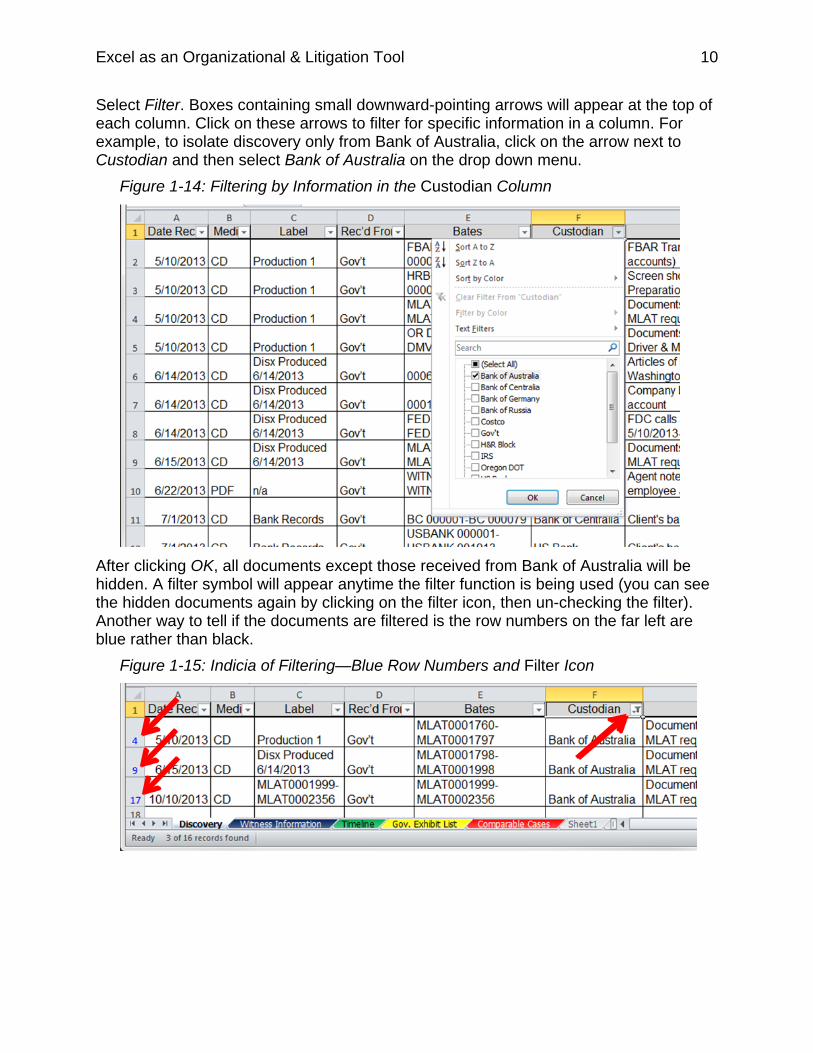
Select Filter. Boxes containing small downward-pointing arrows will appear at the top of each column. Click on these arrows to filter for specific information in a column. For example, to isolate discovery only from Bank of Australia, click on the arrow next to Custodian and then select Bank of Australia on the drop down menu.
Figure 1-14: Filtering by Information in the Custodian Column
After clicking OK, all documents except those received from Bank of Australia will be hidden. A filter symbol will appear anytime the filter function is being used (you can see the hidden documents again by clicking on the filter icon, then un-checking the filter). Another way to tell if the documents are filtered is the row numbers on the far left are blue rather than black.
Figure 1-15: Indicia of Filtering—Blue Row Numbers and Filter Icon
Excel as an Organizational & Litigation Tool 11
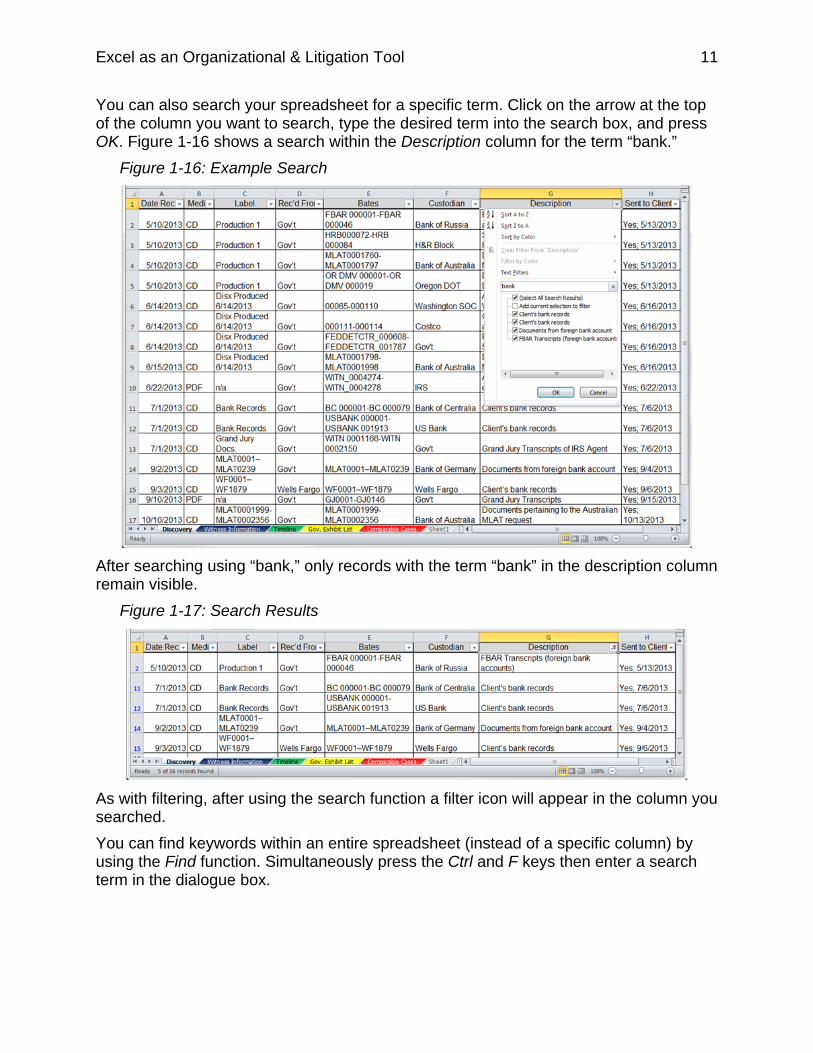
You can also search your spreadsheet for a specific term. Click on the arrow at the top of the column you want to search, type the desired term into the search box, and press OK. Figure 1-16 shows a search within the Description column for the term “bank.”
Figure 1-16: Example Search
After searching using “bank,” only records with the term “bank” in the description column remain visible.
Figure 1-17: Search Results
As with filtering, after using the search function a filter icon will appear in the column you searched. You can find keywords within an entire spreadsheet (instead of a specific column) by using the Find function. Simultaneously press the Ctrl and F keys then enter a search term in the dialogue box.
Excel as an Organizational & Litigation Tool 12
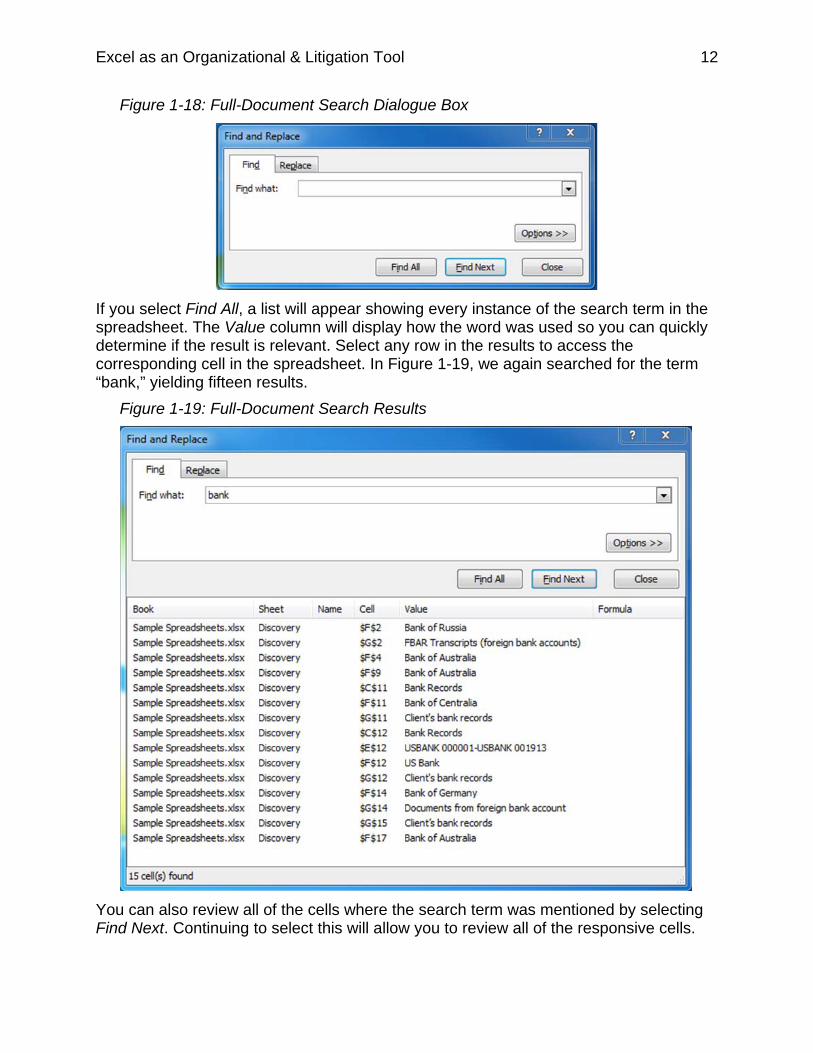
Figure 1-18: Full-Document Search Dialogue Box
If you select Find All, a list will appear showing every instance of the search term in the spreadsheet. The Value column will display how the word was used so you can quickly determine if the result is relevant. Select any row in the results to access the corresponding cell in the spreadsheet. In Figure 1-19, we again searched for the term “bank,” yielding fifteen results.
Figure 1-19: Full-Document Search Results
You can also review all of the cells where the search term was mentioned by selecting Find Next. Continuing to select this will allow you to review all of the responsive cells.
Excel as an Organizational & Litigation Tool 13
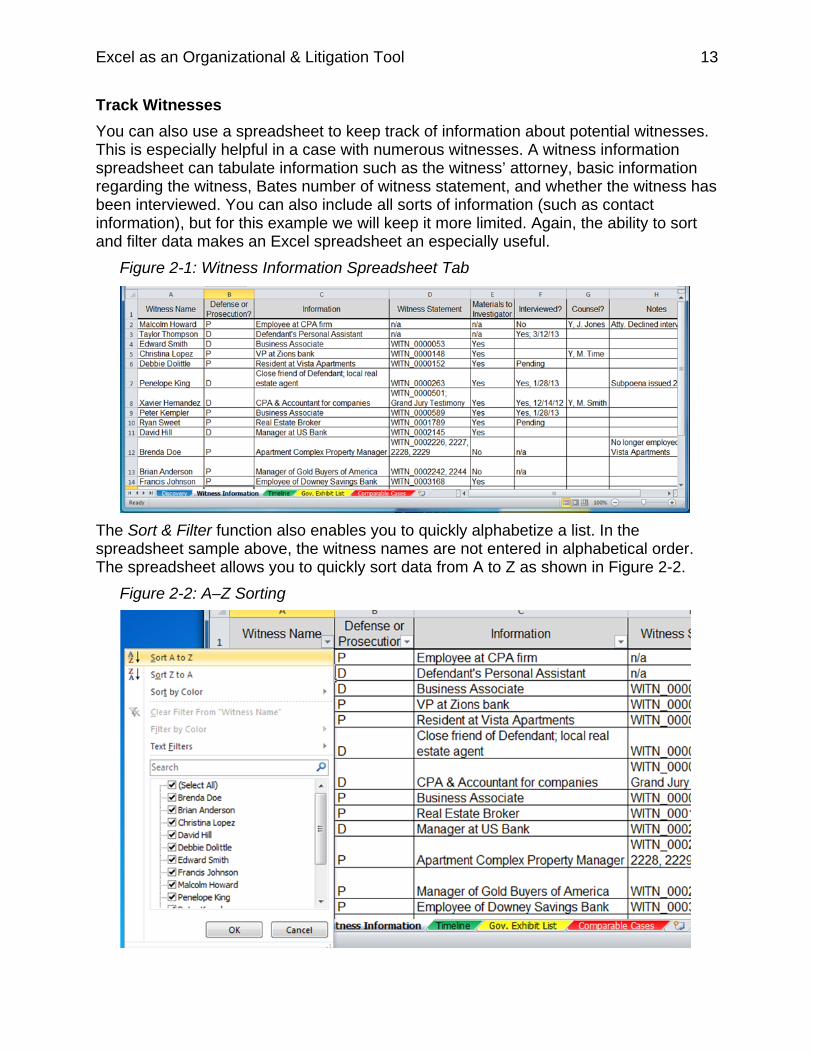
Track Witnesses You can also use a spreadsheet to keep track of information about potential witnesses. This is especially helpful in a case with numerous witnesses. A witness information spreadsheet can tabulate information such as the witness’ attorney, basic information regarding the witness, Bates number of witness statement, and whether the witness has been interviewed. You can also include all sorts of information (such as contact information), but for this example we will keep it more limited. Again, the ability to sort and filter data makes an Excel spreadsheet an especially useful.
Figure 2-1: Witness Information Spreadsheet Tab
The Sort & Filter function also enables you to quickly alphabetize a list. In the spreadsheet sample above, the witness names are not entered in alphabetical order. The spreadsheet allows you to quickly sort data from A to Z as shown in Figure 2-2.
Figure 2-2: A–Z Sorting
Excel as an Organizational & Litigation Tool 14
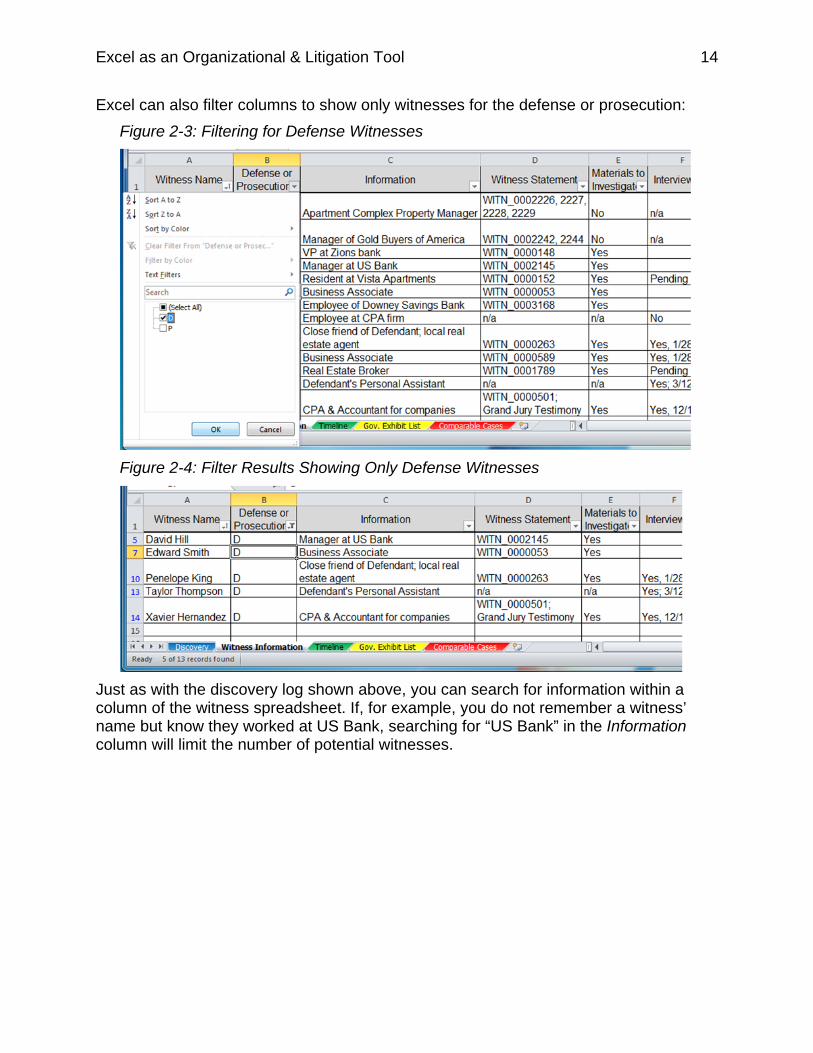
Excel can also filter columns to show only witnesses for the defense or prosecution: Figure 2-3: Filtering for Defense Witnesses
Figure 2-4: Filter Results Showing Only Defense Witnesses
Just as with the discovery log shown above, you can search for information within a column of the witness spreadsheet. If, for example, you do not remember a witness’ name but know they worked at US Bank, searching for “US Bank” in the Information column will limit the number of potential witnesses.
Excel as an Organizational & Litigation Tool 15
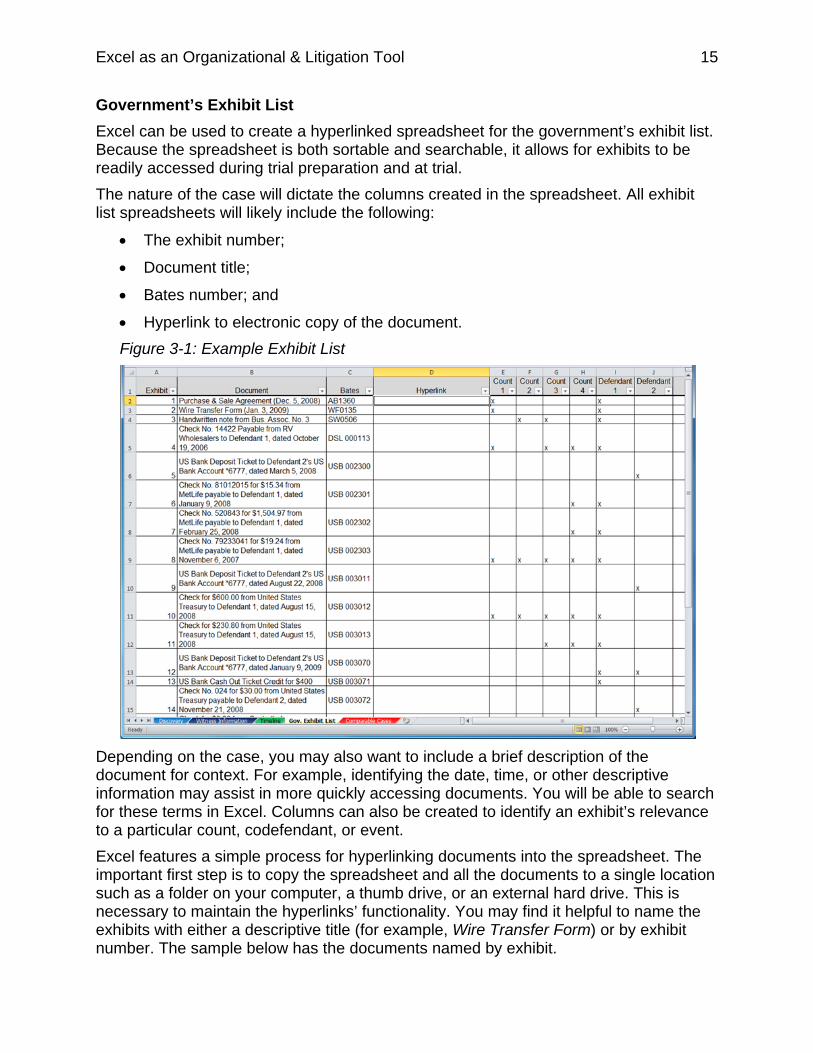
Government’s Exhibit List Excel can be used to create a hyperlinked spreadsheet for the government’s exhibit list. Because the spreadsheet is both sortable and searchable, it allows for exhibits to be readily accessed during trial preparation and at trial. The nature of the case will dictate the columns created in the spreadsheet. All exhibit list spreadsheets will likely include the following:
• The exhibit number;
• Document title;
• Bates number; and
• Hyperlink to electronic copy of the document. Figure 3-1: Example Exhibit List
Depending on the case, you may also want to include a brief description of the document for context. For example, identifying the date, time, or other descriptive information may assist in more quickly accessing documents. You will be able to search for these terms in Excel. Columns can also be created to identify an exhibit’s relevance to a particular count, codefendant, or event. Excel features a simple process for hyperlinking documents into the spreadsheet. The important first step is to copy the spreadsheet and all the documents to a single location such as a folder on your computer, a thumb drive, or an external hard drive. This is necessary to maintain the hyperlinks’ functionality. You may find it helpful to name the exhibits with either a descriptive title (for example, Wire Transfer Form) or by exhibit number. The sample below has the documents named by exhibit.
Excel as an Organizational & Litigation Tool 16
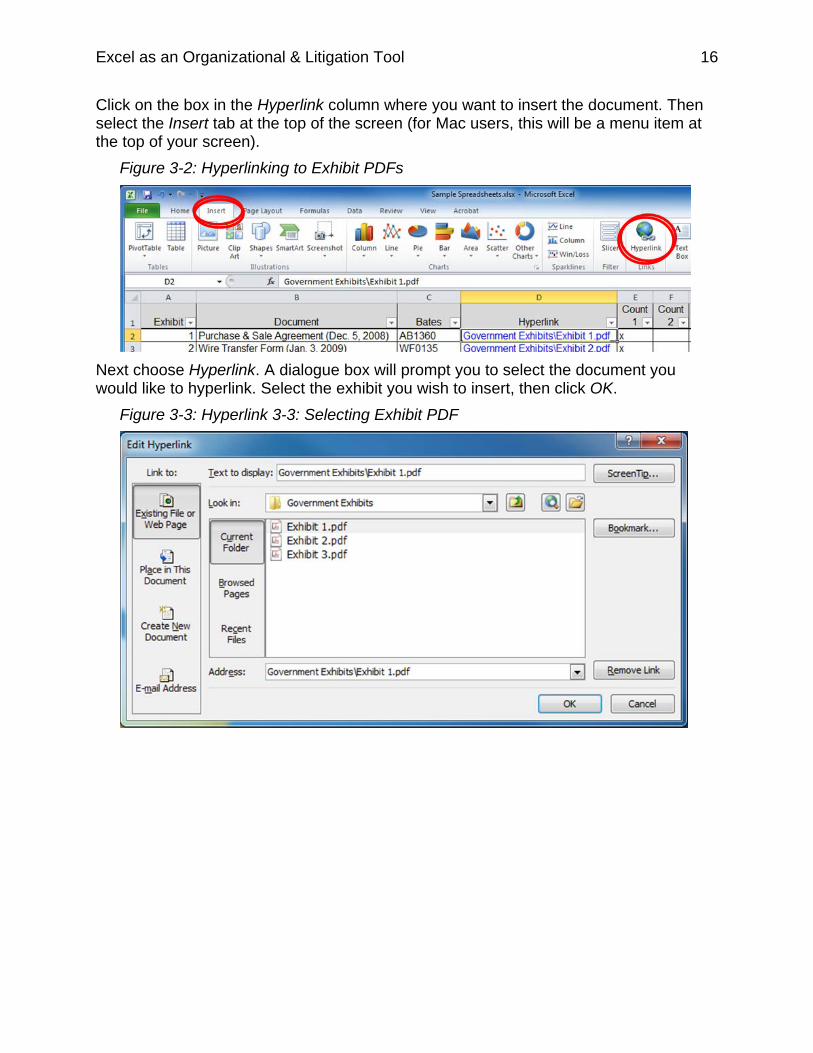
Click on the box in the Hyperlink column where you want to insert the document. Then select the Insert tab at the top of the screen (for Mac users, this will be a menu item at the top of your screen).
Figure 3-2: Hyperlinking to Exhibit PDFs
Next choose Hyperlink. A dialogue box will prompt you to select the document you would like to hyperlink. Select the exhibit you wish to insert, then click OK.
Figure 3-3: Hyperlink 3-3: Selecting Exhibit PDF
Excel as an Organizational & Litigation Tool 17
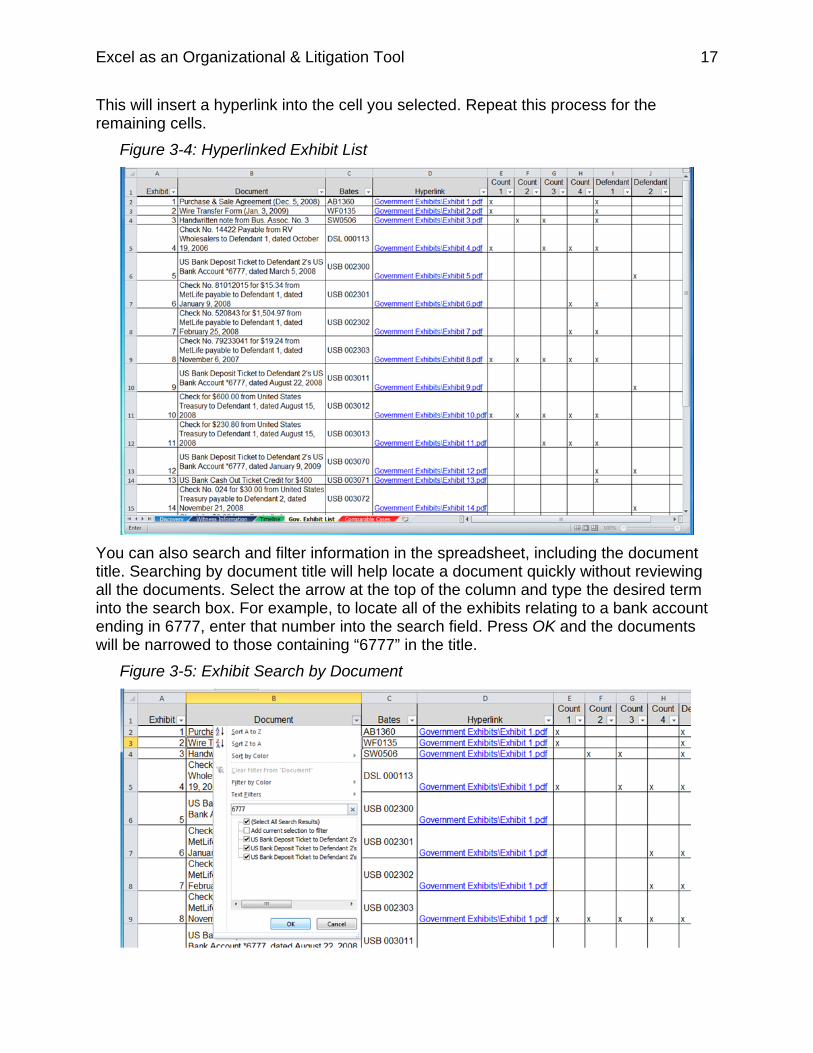
This will insert a hyperlink into the cell you selected. Repeat this process for the remaining cells.
Figure 3-4: Hyperlinked Exhibit List
You can also search and filter information in the spreadsheet, including the document title. Searching by document title will help locate a document quickly without reviewing all the documents. Select the arrow at the top of the column and type the desired term into the search box. For example, to locate all of the exhibits relating to a bank account ending in 6777, enter that number into the search field. Press OK and the documents will be narrowed to those containing “6777” in the title.
Figure 3-5: Exhibit Search by Document
Excel as an Organizational & Litigation Tool 18
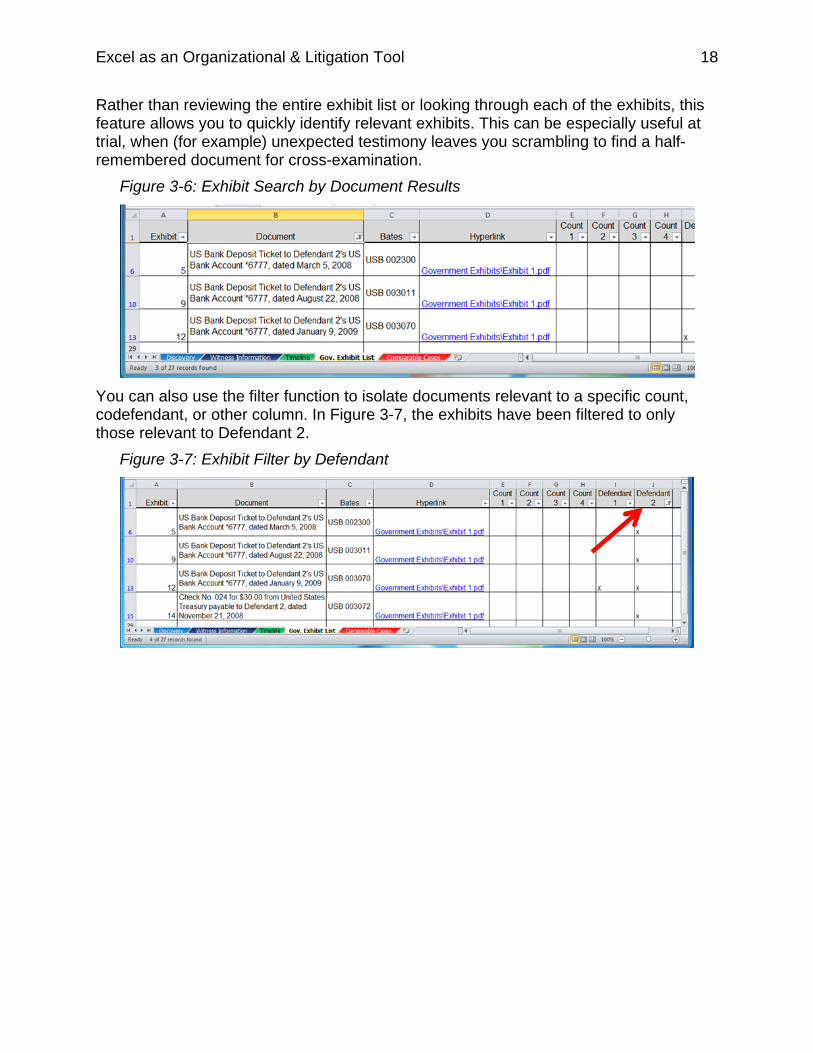
Rather than reviewing the entire exhibit list or looking through each of the exhibits, this feature allows you to quickly identify relevant exhibits. This can be especially useful at trial, when (for example) unexpected testimony leaves you scrambling to find a half-remembered document for cross-examination.
Figure 3-6: Exhibit Search by Document Results
You can also use the filter function to isolate documents relevant to a specific count, codefendant, or other column. In Figure 3-7, the exhibits have been filtered to only those relevant to Defendant 2.
Figure 3-7: Exhibit Filter by Defendant
Excel as an Organizational & Litigation Tool 19
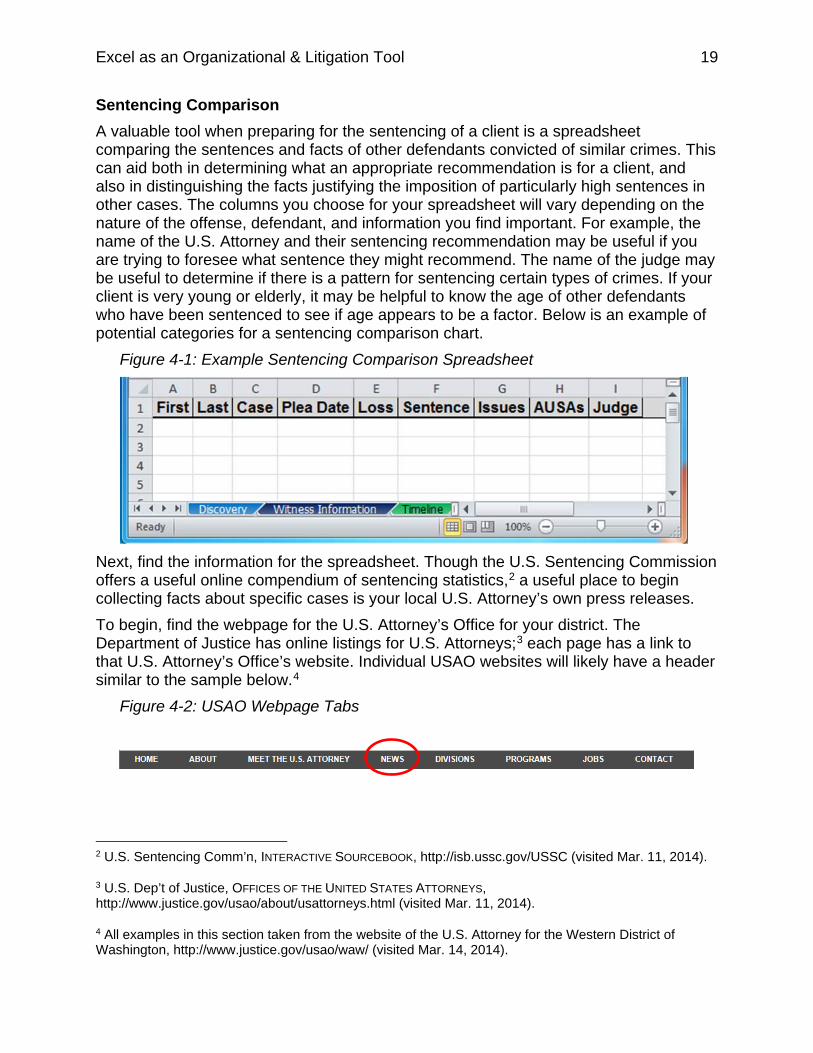
Sentencing Comparison A valuable tool when preparing for the sentencing of a client is a spreadsheet comparing the sentences and facts of other defendants convicted of similar crimes. This can aid both in determining what an appropriate recommendation is for a client, and also in distinguishing the facts justifying the imposition of particularly high sentences in other cases. The columns you choose for your spreadsheet will vary depending on the nature of the offense, defendant, and information you find important. For example, the name of the U.S. Attorney and their sentencing recommendation may be useful if you are trying to foresee what sentence they might recommend. The name of the judge may be useful to determine if there is a pattern for sentencing certain types of crimes. If your client is very young or elderly, it may be helpful to know the age of other defendants who have been sentenced to see if age appears to be a factor. Below is an example of potential categories for a sentencing comparison chart.
Figure 4-1: Example Sentencing Comparison Spreadsheet
Next, find the information for the spreadsheet. Though the U.S. Sentencing Commission offers a useful online compendium of sentencing statistics,2 a useful place to begin collecting facts about specific cases is your local U.S. Attorney’s own press releases. To begin, find the webpage for the U.S. Attorney’s Office for your district. The Department of Justice has online listings for U.S. Attorneys;3 each page has a link to that U.S. Attorney’s Office’s website. Individual USAO websites will likely have a header similar to the sample below.4
Figure 4-2: USAO Webpage Tabs
2 U.S. Sentencing Comm’n, INTERACTIVE SOURCEBOOK, http://isb.ussc.gov/USSC (visited Mar. 11, 2014).
3 U.S. Dep’t of Justice, OFFICES OF THE UNITED STATES ATTORNEYS, http://www.justice.gov/usao/about/usattorneys.html (visited Mar. 11, 2014).
4 All examples in this section taken from the website of the U.S. Attorney for the Western District of Washington, http://www.justice.gov/usao/waw/ (visited Mar. 14, 2014).
Excel as an Organizational & Litigation Tool 20
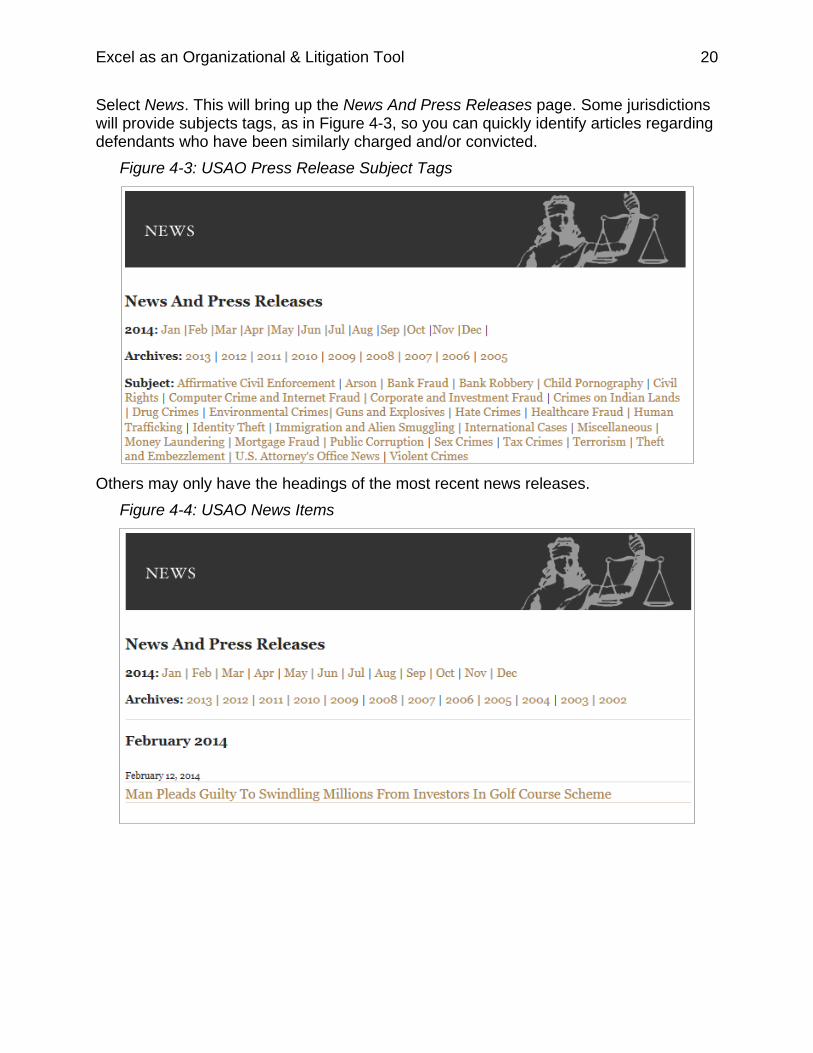
Select News. This will bring up the News And Press Releases page. Some jurisdictions will provide subjects tags, as in Figure 4-3, so you can quickly identify articles regarding defendants who have been similarly charged and/or convicted.
Figure 4-3: USAO Press Release Subject Tags
Others may only have the headings of the most recent news releases.
Figure 4-4: USAO News Items
Excel as an Organizational & Litigation Tool 21
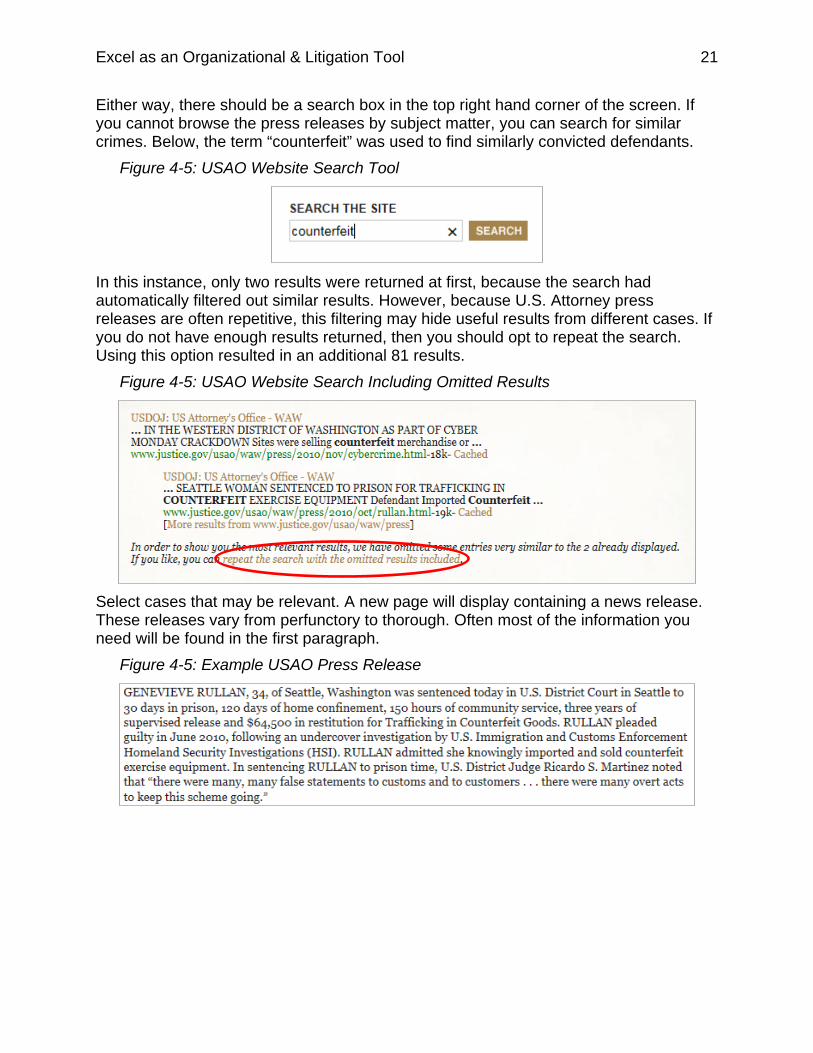
Either way, there should be a search box in the top right hand corner of the screen. If you cannot browse the press releases by subject matter, you can search for similar crimes. Below, the term “counterfeit” was used to find similarly convicted defendants.
Figure 4-5: USAO Website Search Tool
In this instance, only two results were returned at first, because the search had automatically filtered out similar results. However, because U.S. Attorney press releases are often repetitive, this filtering may hide useful results from different cases. If you do not have enough results returned, then you should opt to repeat the search. Using this option resulted in an additional 81 results.
Figure 4-5: USAO Website Search Including Omitted Results
Select cases that may be relevant. A new page will display containing a news release. These releases vary from perfunctory to thorough. Often most of the information you need will be found in the first paragraph.
Figure 4-5: Example USAO Press Release
Excel as an Organizational & Litigation Tool 22
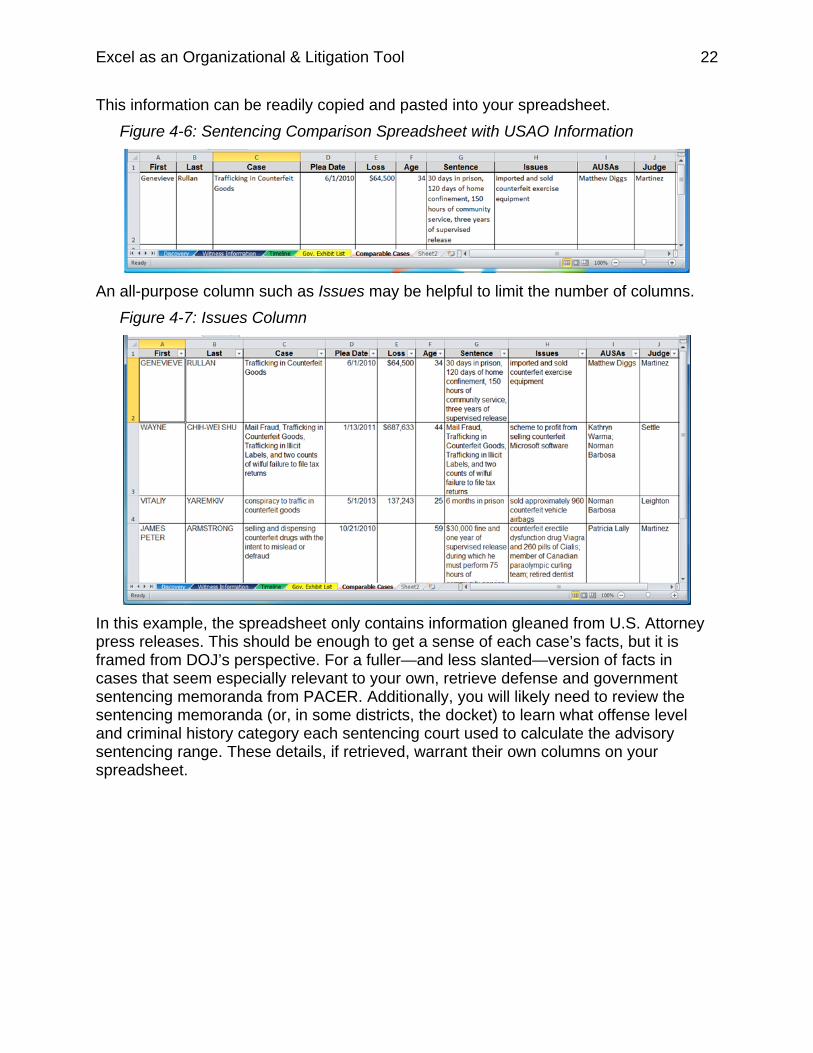
This information can be readily copied and pasted into your spreadsheet. Figure 4-6: Sentencing Comparison Spreadsheet with USAO Information
An all-purpose column such as Issues may be helpful to limit the number of columns.
Figure 4-7: Issues Column
In this example, the spreadsheet only contains information gleaned from U.S. Attorney press releases. This should be enough to get a sense of each case’s facts, but it is framed from DOJ’s perspective. For a fuller—and less slanted—version of facts in cases that seem especially relevant to your own, retrieve defense and government sentencing memoranda from PACER. Additionally, you will likely need to review the sentencing memoranda (or, in some districts, the docket) to learn what offense level and criminal history category each sentencing court used to calculate the advisory sentencing range. These details, if retrieved, warrant their own columns on your spreadsheet.
Excel as an Organizational & Litigation Tool 23
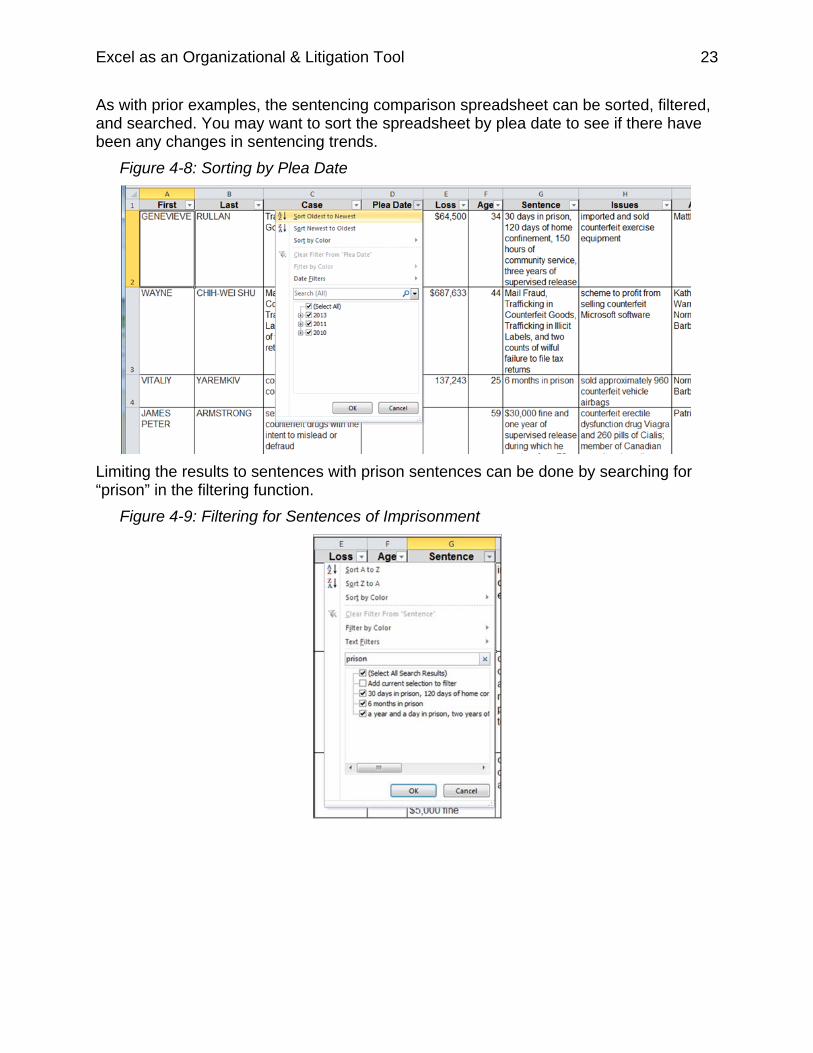
As with prior examples, the sentencing comparison spreadsheet can be sorted, filtered, and searched. You may want to sort the spreadsheet by plea date to see if there have been any changes in sentencing trends.
Figure 4-8: Sorting by Plea Date
Limiting the results to sentences with prison sentences can be done by searching for “prison” in the filtering function.
Figure 4-9: Filtering for Sentences of Imprisonment
Excel as an Organizational & Litigation Tool 24
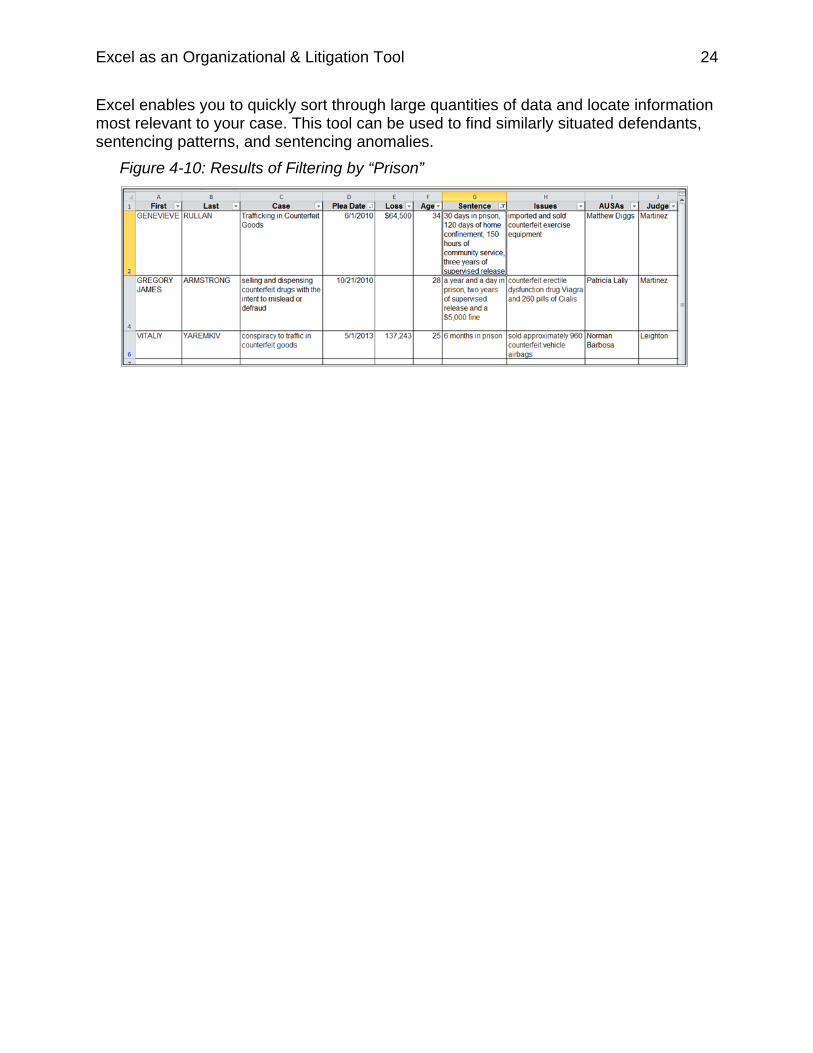
Excel enables you to quickly sort through large quantities of data and locate information most relevant to your case. This tool can be used to find similarly situated defendants, sentencing patterns, and sentencing anomalies.
Figure 4-10: Results of Filtering by “Prison”
Excel as an Organizational & Litigation Tool 25
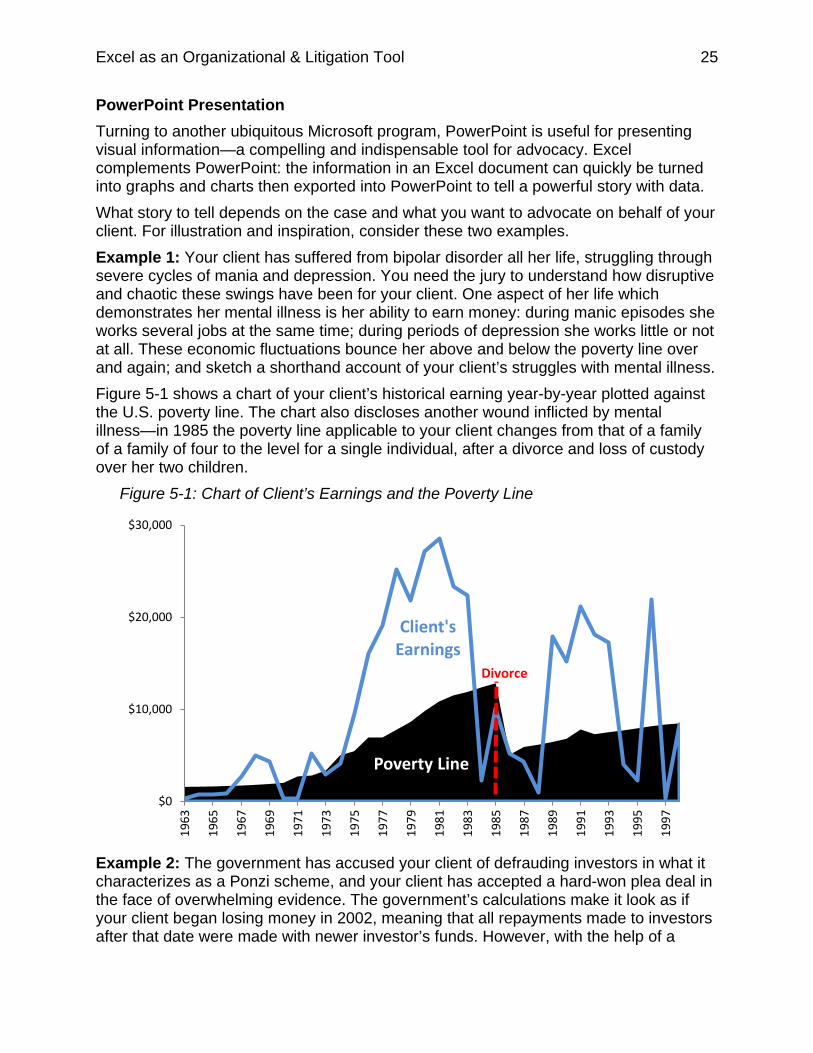
PowerPoint Presentation Turning to another ubiquitous Microsoft program, PowerPoint is useful for presenting visual information—a compelling and indispensable tool for advocacy. Excel complements PowerPoint: the information in an Excel document can quickly be turned into graphs and charts then exported into PowerPoint to tell a powerful story with data. What story to tell depends on the case and what you want to advocate on behalf of your client. For illustration and inspiration, consider these two examples. Example 1: Your client has suffered from bipolar disorder all her life, struggling through severe cycles of mania and depression. You need the jury to understand how disruptive and chaotic these swings have been for your client. One aspect of her life which demonstrates her mental illness is her ability to earn money: during manic episodes she works several jobs at the same time; during periods of depression she works little or not at all. These economic fluctuations bounce her above and below the poverty line over and again; and sketch a shorthand account of your client’s struggles with mental illness. Figure 5-1 shows a chart of your client’s historical earning year-by-year plotted against the U.S. poverty line. The chart also discloses another wound inflicted by mental illness—in 1985 the poverty line applicable to your client changes from that of a family of a family of four to the level for a single individual, after a divorce and loss of custody over her two children.
Figure 5-1: Chart of Client’s Earnings and the Poverty Line
Example 2: The government has accused your client of defrauding investors in what it characterizes as a Ponzi scheme, and your client has accepted a hard-won plea deal in the face of overwhelming evidence. The government’s calculations make it look as if your client began losing money in 2002, meaning that all repayments made to investors after that date were made with newer investor’s funds. However, with the help of a
Poverty Line
Client's Earnings
$0
$10,000
$20,000
$30,000
1963
1965
1967
1969
1971
1973
1975
1977
1979
1981
1983
1985
1987
1989
1991
1993
1995
1997
Divorce
Excel as an Organizational & Litigation Tool 26
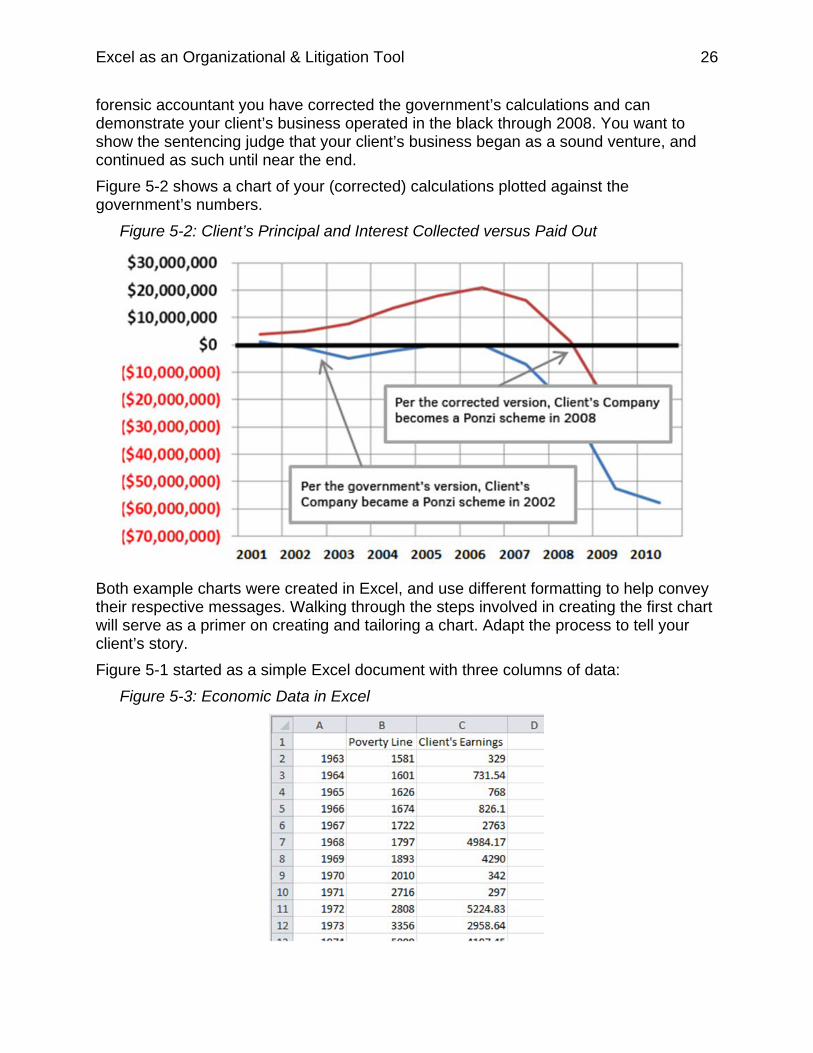
forensic accountant you have corrected the government’s calculations and can demonstrate your client’s business operated in the black through 2008. You want to show the sentencing judge that your client’s business began as a sound venture, and continued as such until near the end. Figure 5-2 shows a chart of your (corrected) calculations plotted against the government’s numbers.
Figure 5-2: Client’s Principal and Interest Collected versus Paid Out
Both example charts were created in Excel, and use different formatting to help convey their respective messages. Walking through the steps involved in creating the first chart will serve as a primer on creating and tailoring a chart. Adapt the process to tell your client’s story. Figure 5-1 started as a simple Excel document with three columns of data:
Figure 5-3: Economic Data in Excel
Excel as an Organizational & Litigation Tool 27
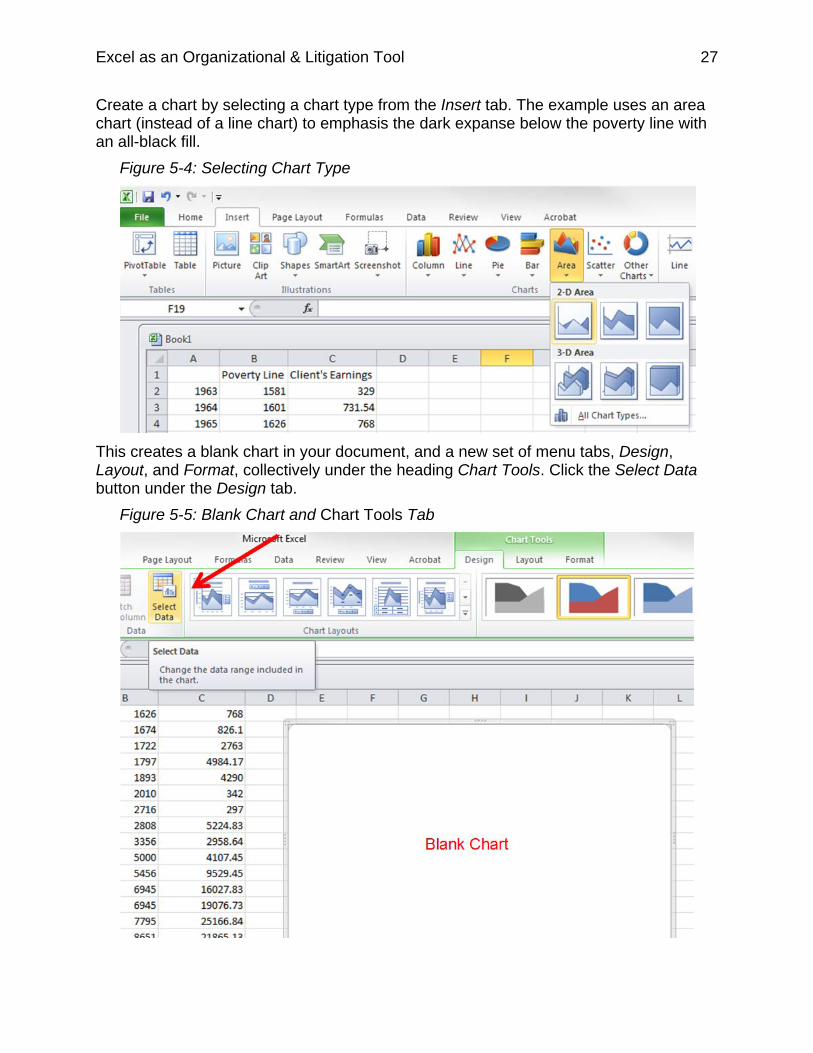
Create a chart by selecting a chart type from the Insert tab. The example uses an area chart (instead of a line chart) to emphasis the dark expanse below the poverty line with an all-black fill.
Figure 5-4: Selecting Chart Type
This creates a blank chart in your document, and a new set of menu tabs, Design, Layout, and Format, collectively under the heading Chart Tools. Click the Select Data button under the Design tab.
Figure 5-5: Blank Chart and Chart Tools Tab
Excel as an Organizational & Litigation Tool 28
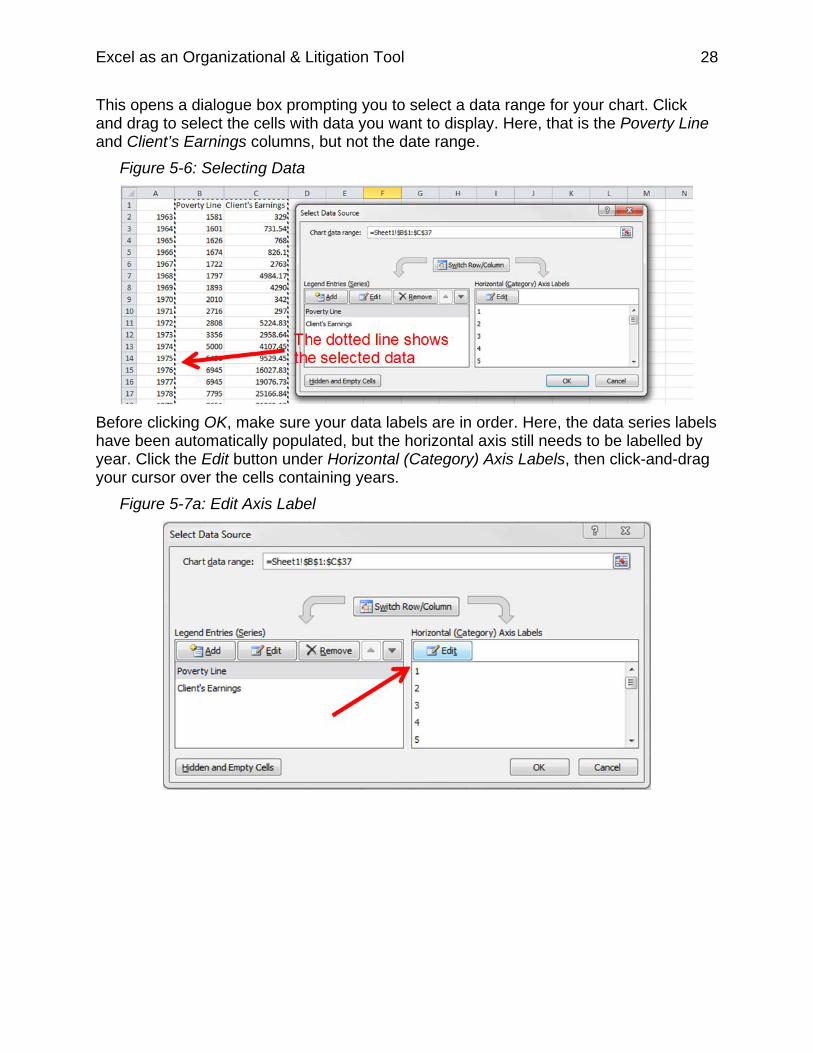
This opens a dialogue box prompting you to select a data range for your chart. Click and drag to select the cells with data you want to display. Here, that is the Poverty Line and Client’s Earnings columns, but not the date range.
Figure 5-6: Selecting Data
Before clicking OK, make sure your data labels are in order. Here, the data series labels have been automatically populated, but the horizontal axis still needs to be labelled by year. Click the Edit button under Horizontal (Category) Axis Labels, then click-and-drag your cursor over the cells containing years.
Figure 5-7a: Edit Axis Label
Excel as an Organizational & Litigation Tool 29
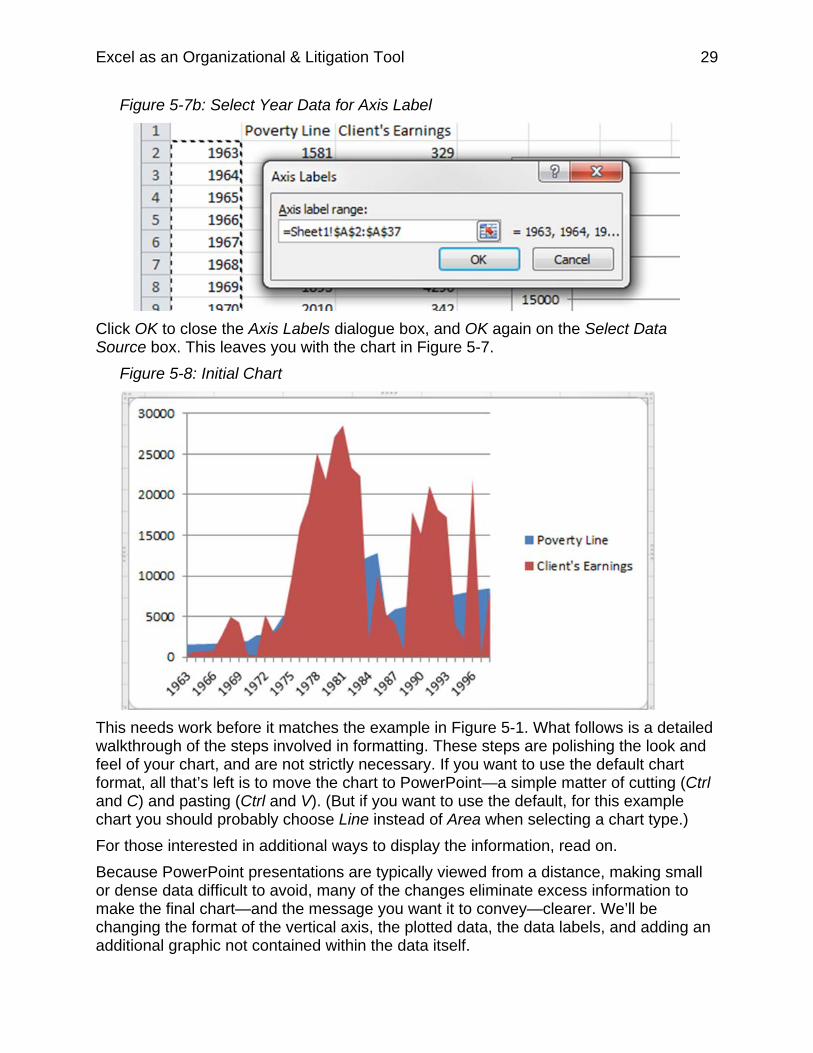
Figure 5-7b: Select Year Data for Axis Label
Click OK to close the Axis Labels dialogue box, and OK again on the Select Data Source box. This leaves you with the chart in Figure 5-7.
Figure 5-8: Initial Chart
This needs work before it matches the example in Figure 5-1. What follows is a detailed walkthrough of the steps involved in formatting. These steps are polishing the look and feel of your chart, and are not strictly necessary. If you want to use the default chart format, all that’s left is to move the chart to PowerPoint—a simple matter of cutting (Ctrl and C) and pasting (Ctrl and V). (But if you want to use the default, for this example chart you should probably choose Line instead of Area when selecting a chart type.) For those interested in additional ways to display the information, read on. Because PowerPoint presentations are typically viewed from a distance, making small or dense data difficult to avoid, many of the changes eliminate excess information to make the final chart—and the message you want it to convey—clearer. We’ll be changing the format of the vertical axis, the plotted data, the data labels, and adding an additional graphic not contained within the data itself.
Excel as an Organizational & Litigation Tool 30
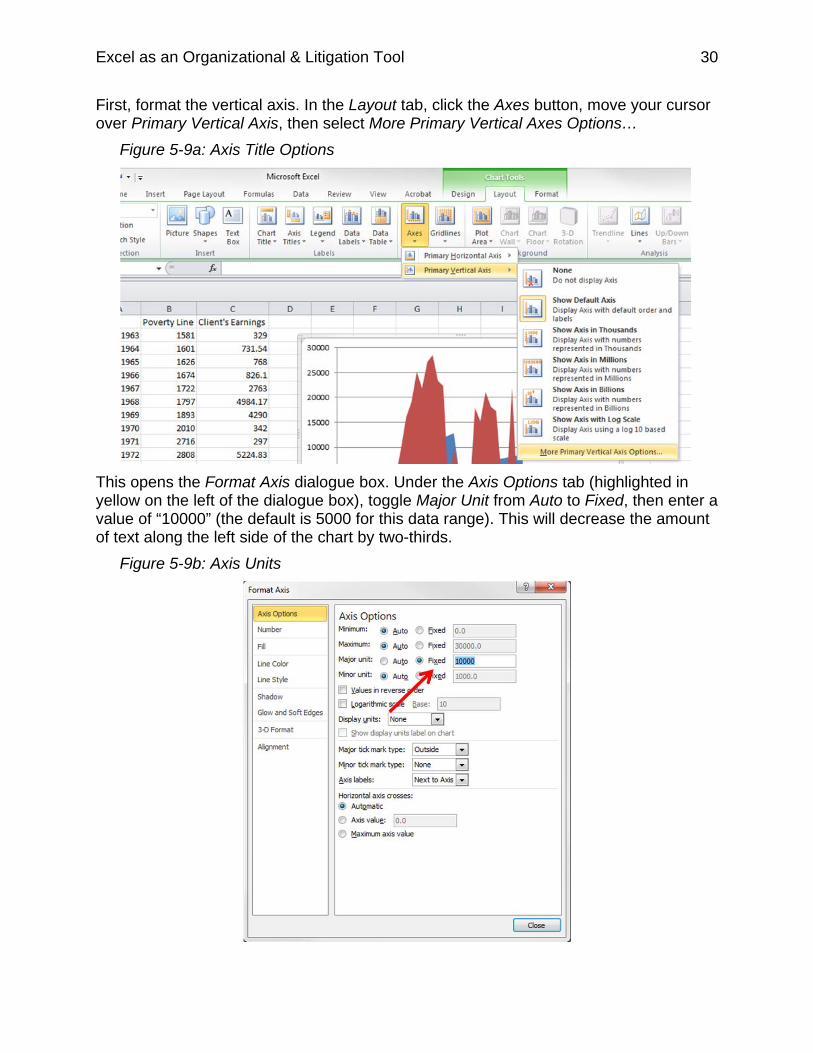
First, format the vertical axis. In the Layout tab, click the Axes button, move your cursor over Primary Vertical Axis, then select More Primary Vertical Axes Options…
Figure 5-9a: Axis Title Options
This opens the Format Axis dialogue box. Under the Axis Options tab (highlighted in yellow on the left of the dialogue box), toggle Major Unit from Auto to Fixed, then enter a value of “10000” (the default is 5000 for this data range). This will decrease the amount of text along the left side of the chart by two-thirds.
Figure 5-9b: Axis Units
Excel as an Organizational & Litigation Tool 31
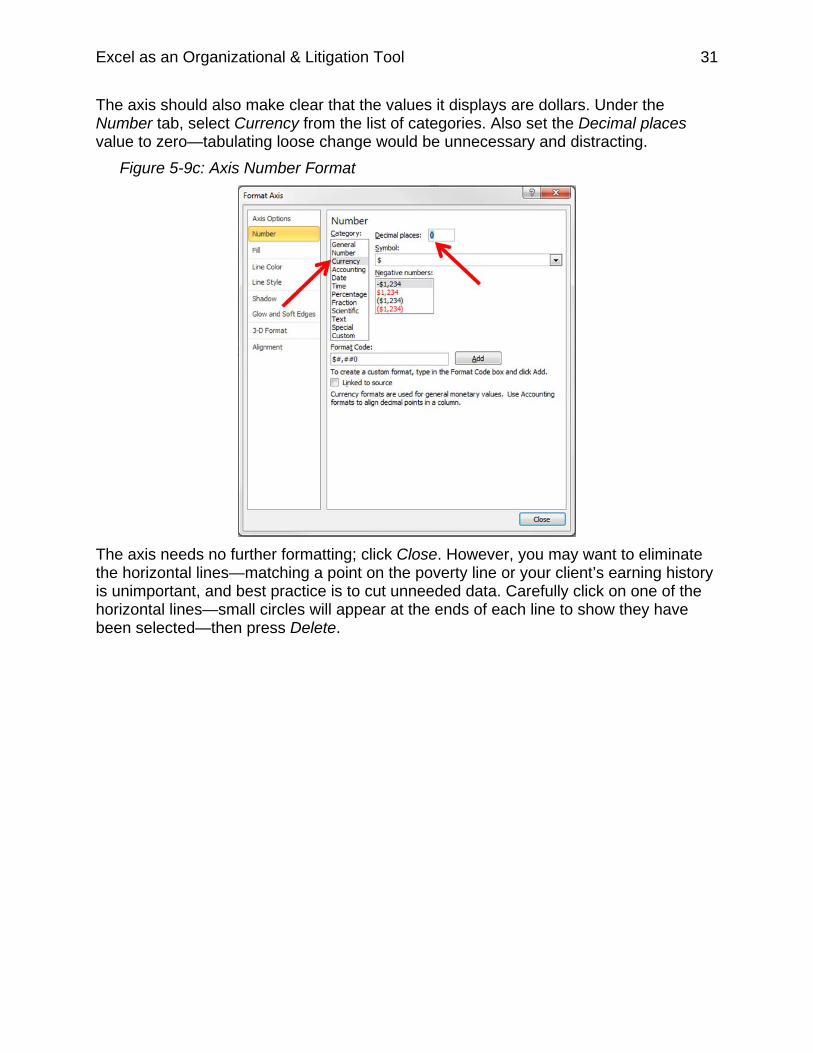
The axis should also make clear that the values it displays are dollars. Under the Number tab, select Currency from the list of categories. Also set the Decimal places value to zero—tabulating loose change would be unnecessary and distracting.
Figure 5-9c: Axis Number Format
The axis needs no further formatting; click Close. However, you may want to eliminate the horizontal lines—matching a point on the poverty line or your client’s earning history is unimportant, and best practice is to cut unneeded data. Carefully click on one of the horizontal lines—small circles will appear at the ends of each line to show they have been selected—then press Delete.
Excel as an Organizational & Litigation Tool 32
Figure 5-10: Chart with Formatted Axis and Horizontal Lines Selected
The Client’s Earnings data also needs to be changed from a red solid to a blue line. Under the Format tab, click the Chart Area drop-down menu and select Series “Client’s Earnings.”
Figure 5-11a: Selecting Data Series to Format
Small circles will appear along the corners of the data to show it has been selected. Still under the Format tab, click Shape Outline, and select a color for the outline (instead of the default no outline). Here, the example uses a slate blue that will contrast against the eventually black Poverty Line.
Excel as an Organizational & Litigation Tool 33
Figure 5-11b: Changing Selected Data Series’ Outline Color and Weight
The default outline is thin and will lack emphasis when displayed in PowerPoint. From the Shape Outline menu, select Weight, then choose 3 pt.
Excel as an Organizational & Litigation Tool 34
To eliminate the solid red fill, which you will need to do to superimpose Client Earnings data over the poverty line, under Format click Shape Fill. Select No Fill.
Figure 5-11c: Changing Selected Data Series’ Fill
Reformat the Poverty Line data in similar fashion. Under the Format tab, choose Series “Poverty Line” from the Chart Area drip-down menu, then click the Shape Fill button, and select a new color—black. This mostly reproduces the chart in Figure 5-11 (note the circles showing that the Poverty Line data is still selected):
Excel as an Organizational & Litigation Tool 35
Figure 5-12: Chart with Formatted Data Series
Superimposing the data labels on the data itself gives the chart more breathing room—note how, in Figure 5-11, the legend on the right takes up nearly a third of the visual real-estate. Eliminate the legend. Under the Format tab, choose Legend from the Chart Area drop-down menu, and press Delete. You’ll need a new way to let your viewer know what the chart shows: data labels. Format a data label for each series; start with Client’s Earnings. Under the Layout tab (just as under the Format tab in the earlier steps), select the data series by clicking the Chart Area drop-down menu and choosing Series “Client Earnings.” Then, click the Data Labels button and choose More Data Labels Options.
Figure 5-13a: Data Label Options
Excel as an Organizational & Litigation Tool 36
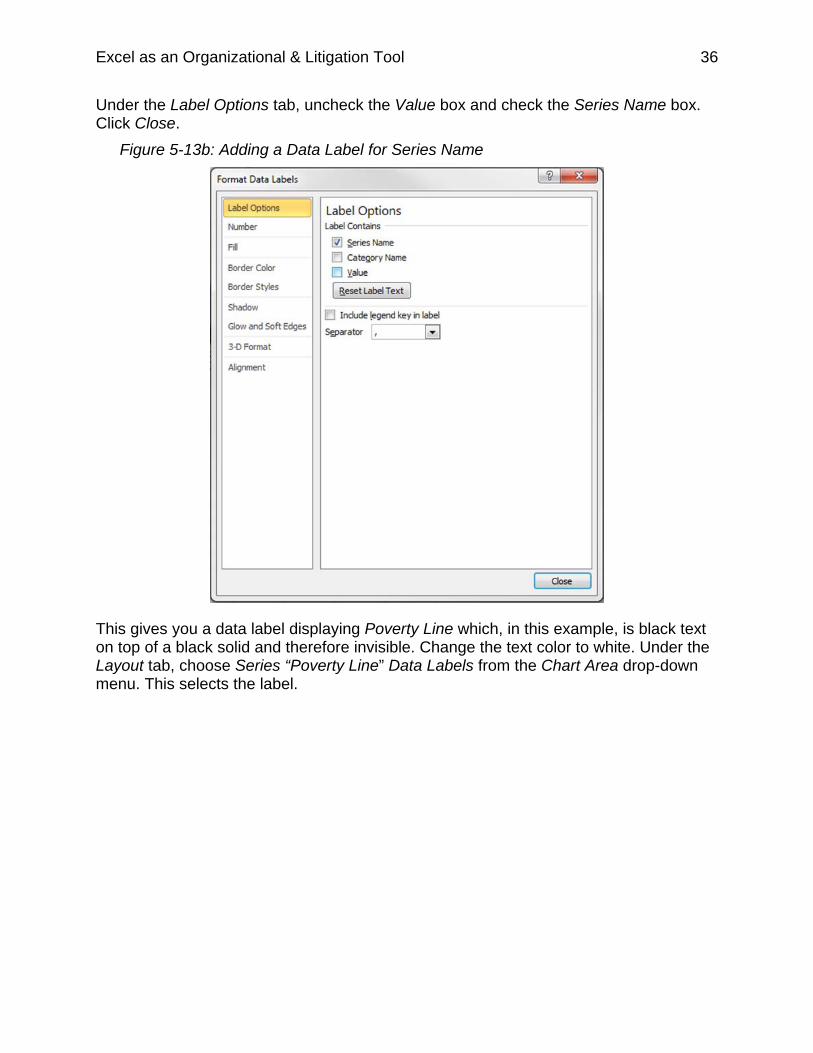
Under the Label Options tab, uncheck the Value box and check the Series Name box. Click Close.
Figure 5-13b: Adding a Data Label for Series Name
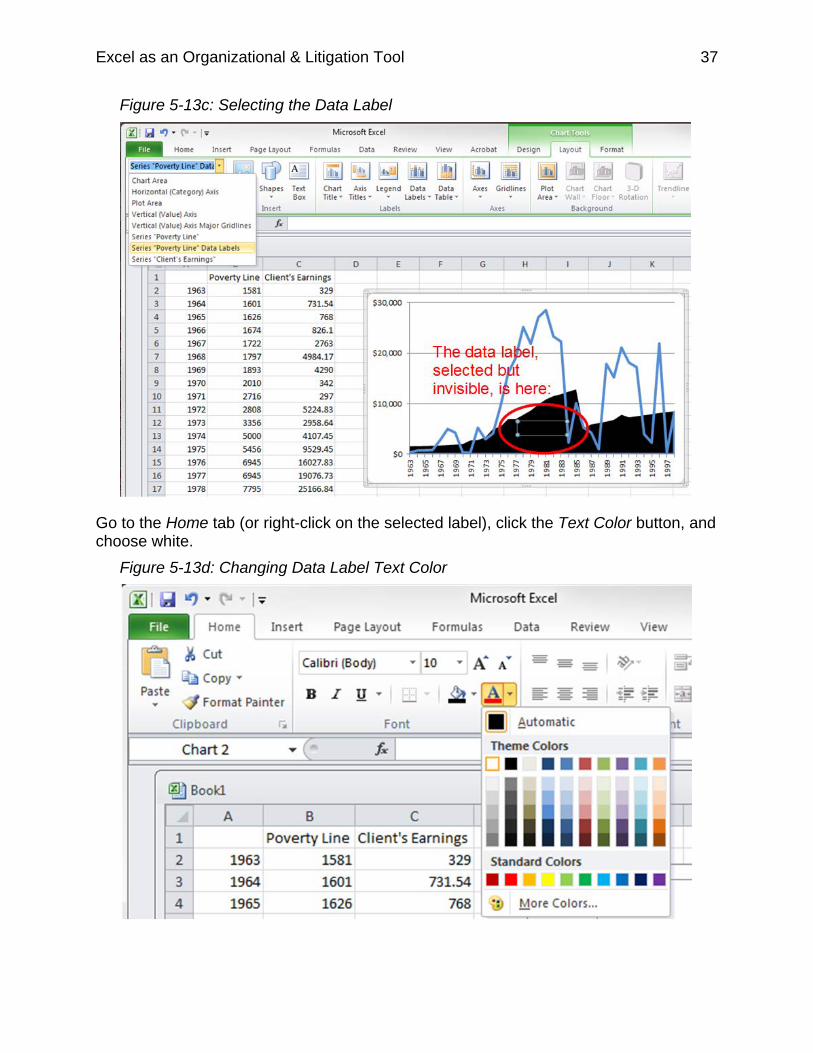
This gives you a data label displaying Poverty Line which, in this example, is black text on top of a black solid and therefore invisible. Change the text color to white. Under the Layout tab, choose Series “Poverty Line” Data Labels from the Chart Area drop-down menu. This selects the label.
Excel as an Organizational & Litigation Tool 37
Figure 5-13c: Selecting the Data Label
Go to the Home tab (or right-click on the selected label), click the Text Color button, and choose white.
Figure 5-13d: Changing Data Label Text Color
Excel as an Organizational & Litigation Tool 38
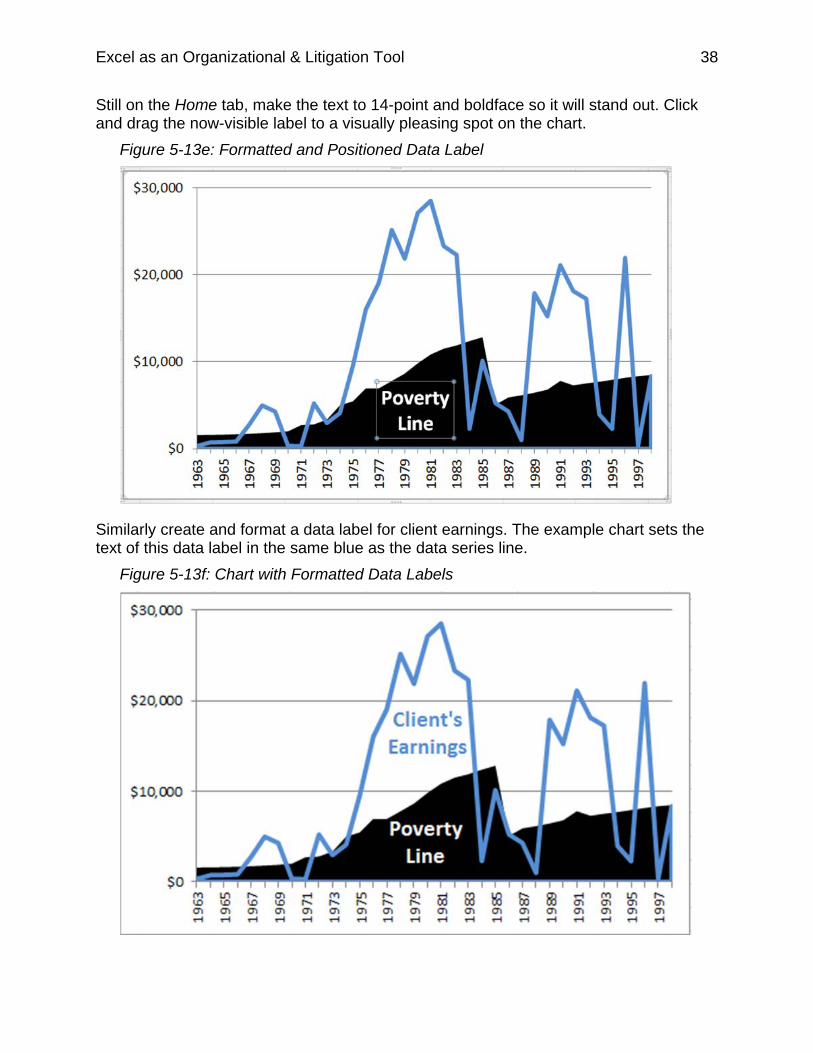
Still on the Home tab, make the text to 14-point and boldface so it will stand out. Click and drag the now-visible label to a visually pleasing spot on the chart.
Figure 5-13e: Formatted and Positioned Data Label
Similarly create and format a data label for client earnings. The example chart sets the text of this data label in the same blue as the data series line.
Figure 5-13f: Chart with Formatted Data Labels
Excel as an Organizational & Litigation Tool 39
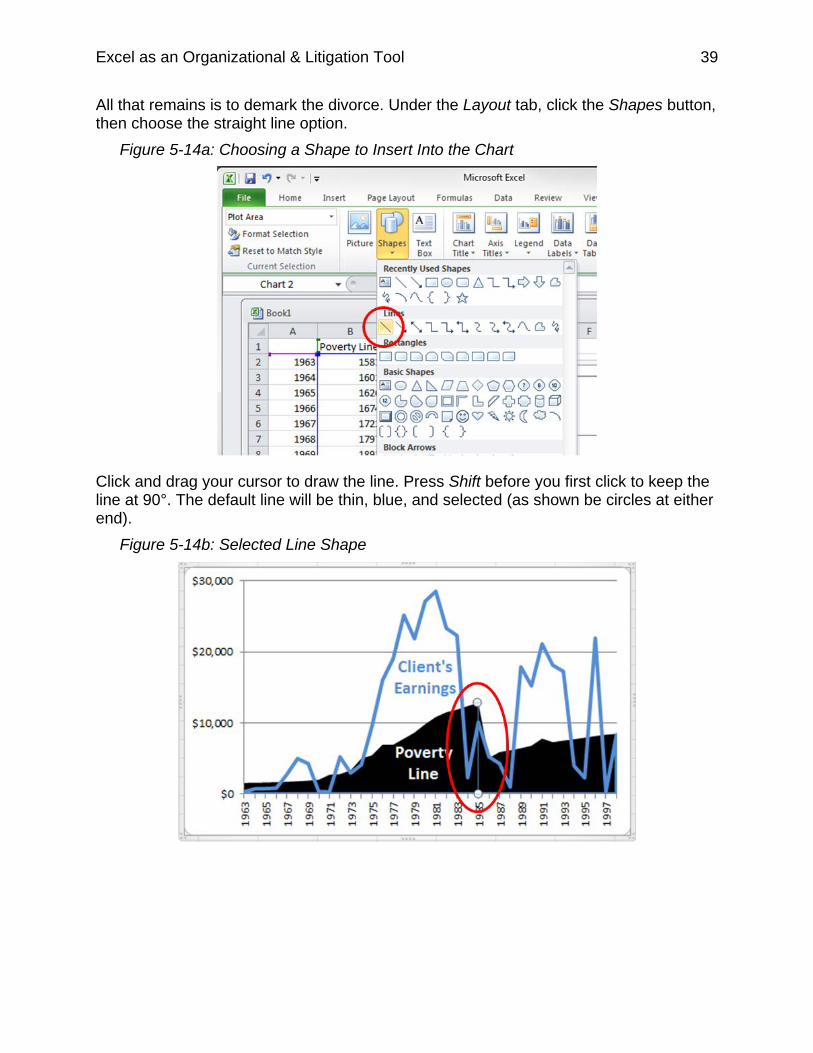
All that remains is to demark the divorce. Under the Layout tab, click the Shapes button, then choose the straight line option.
Figure 5-14a: Choosing a Shape to Insert Into the Chart
Click and drag your cursor to draw the line. Press Shift before you first click to keep the line at 90°. The default line will be thin, blue, and selected (as shown be circles at either end).
Figure 5-14b: Selected Line Shape
Excel as an Organizational & Litigation Tool 40
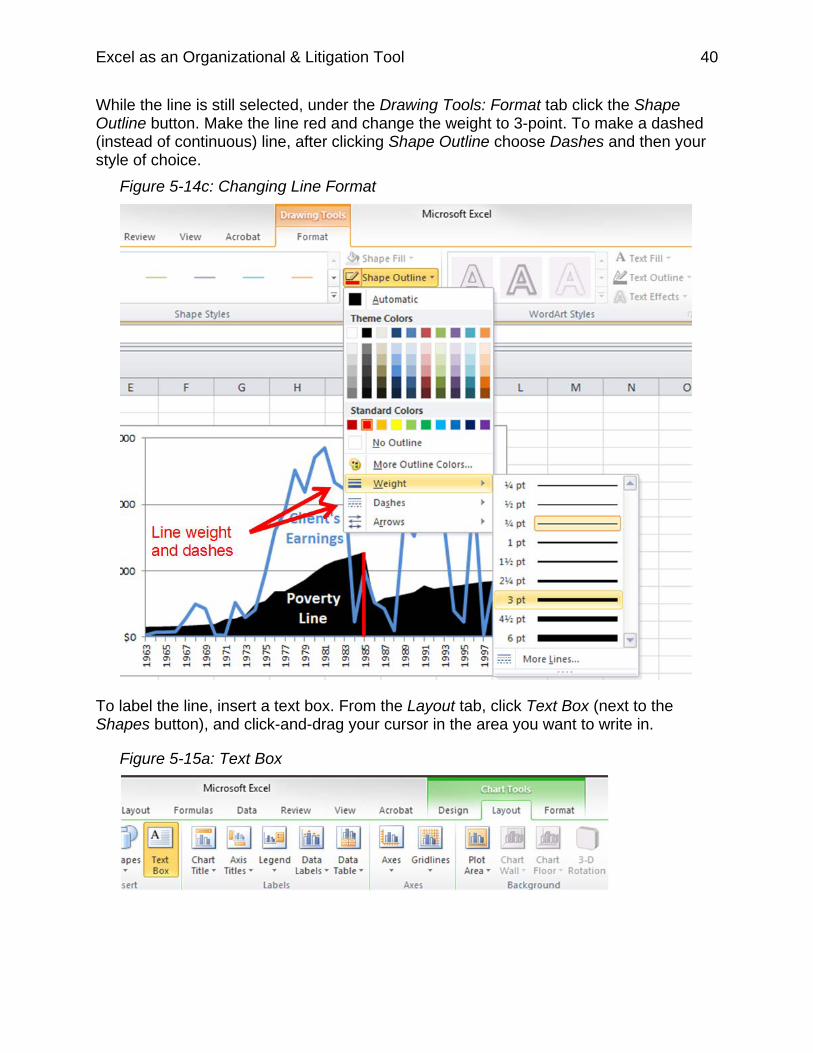
While the line is still selected, under the Drawing Tools: Format tab click the Shape Outline button. Make the line red and change the weight to 3-point. To make a dashed (instead of continuous) line, after clicking Shape Outline choose Dashes and then your style of choice.
Figure 5-14c: Changing Line Format
To label the line, insert a text box. From the Layout tab, click Text Box (next to the Shapes button), and click-and-drag your cursor in the area you want to write in.
Figure 5-15a: Text Box
Excel as an Organizational & Litigation Tool 41
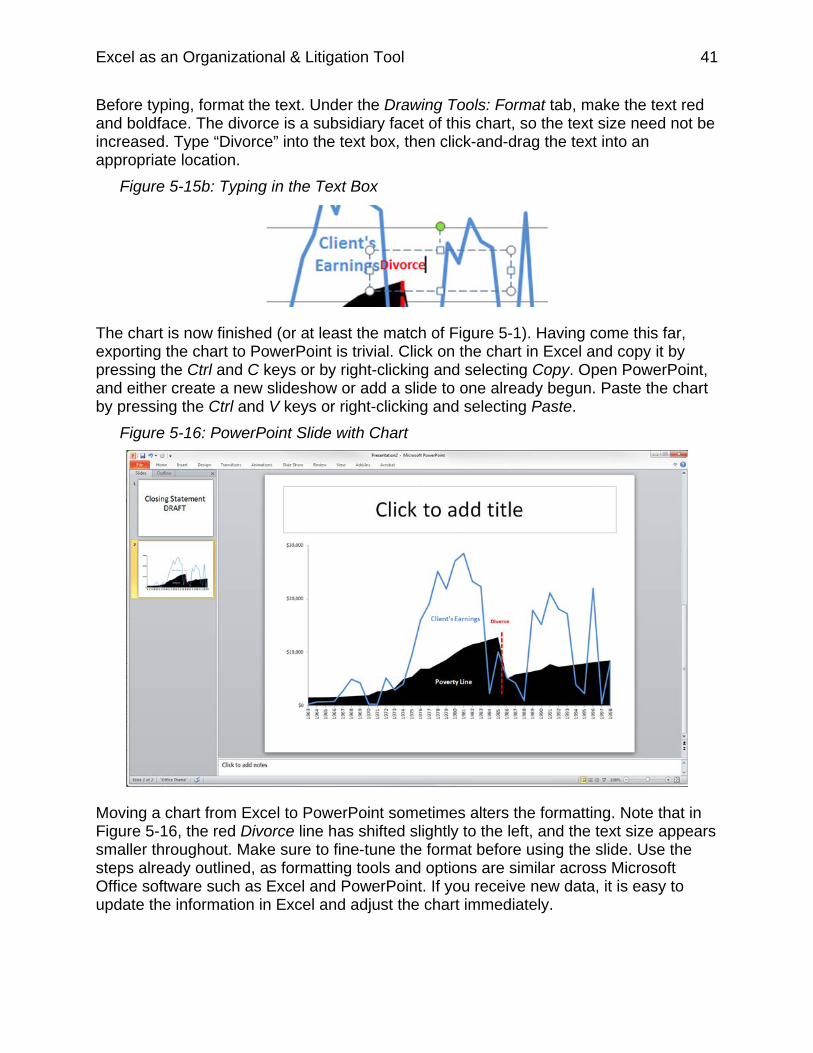
Before typing, format the text. Under the Drawing Tools: Format tab, make the text red and boldface. The divorce is a subsidiary facet of this chart, so the text size need not be increased. Type “Divorce” into the text box, then click-and-drag the text into an appropriate location.
Figure 5-15b: Typing in the Text Box
The chart is now finished (or at least the match of Figure 5-1). Having come this far, exporting the chart to PowerPoint is trivial. Click on the chart in Excel and copy it by pressing the Ctrl and C keys or by right-clicking and selecting Copy. Open PowerPoint, and either create a new slideshow or add a slide to one already begun. Paste the chart by pressing the Ctrl and V keys or right-clicking and selecting Paste.
Figure 5-16: PowerPoint Slide with Chart
Moving a chart from Excel to PowerPoint sometimes alters the formatting. Note that in Figure 5-16, the red Divorce line has shifted slightly to the left, and the text size appears smaller throughout. Make sure to fine-tune the format before using the slide. Use the steps already outlined, as formatting tools and options are similar across Microsoft Office software such as Excel and PowerPoint. If you receive new data, it is easy to update the information in Excel and adjust the chart immediately.
Excel as an Organizational & Litigation Tool 42
Conclusion These five examples demonstrate the possibilities for using Excel spreadsheets as organizational tools. The ability to quickly sort, filter, and search through large quantities of data make spreadsheets an invaluable tool for trial preparation and execution.
Additional Help This is an overview of Excel Spreadsheets. If you wish to explore other features of Excel or have questions, please contact the resources below.
Defender Services Office—National Litigation Support Team: 510 637-3500
Aoki Law PLLC: 206 624-1900
Other resources are available at www.fd.org under Litigation Support, or the National Litigation Support blog at http://nlsblog.org/.


![(5) C n & Excel Excel 7 v) Excel Excel 7 )Þ77 Excel Excel ... · (5) C n & Excel Excel 7 v) Excel Excel 7 )Þ77 Excel Excel Excel 3 97 l) 70 1900 r-kž 1937 (filllß)_] 136.8cm 136.8cm](https://img.pdfslide.us/doc/110x75/5f71a890b98d435cfa116d55/5-c-n-excel-excel-7-v-excel-excel-7-77-excel-excel-5-c-n-.jpg)