Embed Size (px)
Citation preview
Company Presentation
May 2021
March 2021 | Page 2
Overview
Activities
Financials
Annex
March 2021 | Page 3
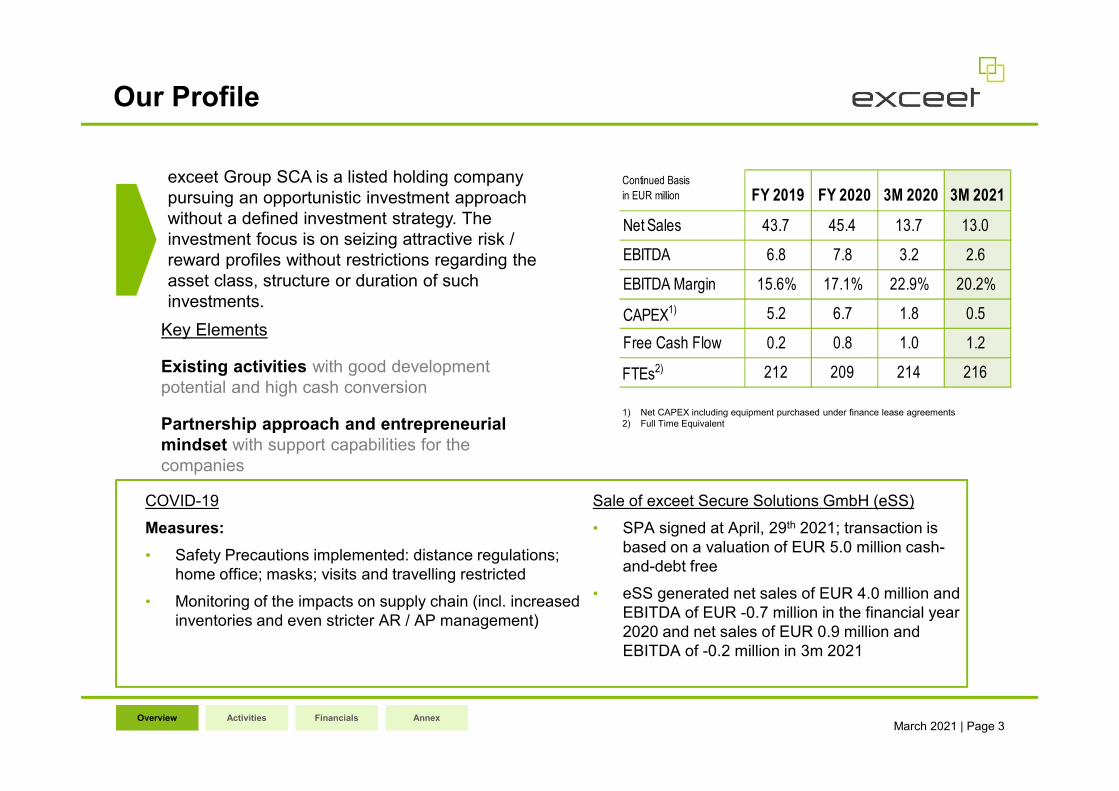
Our Profile
exceet Group SCA is a listed holding company
pursuing an opportunistic investment approach
without a defined investment strategy. The
investment focus is on seizing attractive risk /
reward profiles without restrictions regarding the
asset class, structure or duration of such
investments.
1) Net CAPEX including equipment purchased under finance lease agreements
2) Full Time Equivalent
Continued Basis
in EUR million FY 2019 FY 2020 3M 2020 3M 2021
Net Sales 43.7 45.4 13.7 13.0
EBITDA 6.8 7.8 3.2 2.6
EBITDA Margin 15.6% 17.1% 22.9% 20.2%
CAPEX1) 5.2 6.7 1.8 0.5
Free Cash Flow 0.2 0.8 1.0 1.2
FTEs2) 212 209 214 216
Key Elements
Existing activities with good development
potential and high cash conversion
Partnership approach and entrepreneurial
mindset with support capabilities for the
companies
Financials AnnexOverview Activities
COVID-19
Measures:
• Safety Precautions implemented: distance regulations;
home office; masks; visits and travelling restricted
• Monitoring of the impacts on supply chain (incl. increased
inventories and even stricter AR / AP management)
Sale of exceet Secure Solutions GmbH (eSS)
• SPA signed at April, 29th 2021; transaction is
based on a valuation of EUR 5.0 million cash-
and-debt free
• eSS generated net sales of EUR 4.0 million and
EBITDA of EUR -0.7 million in the financial year
2020 and net sales of EUR 0.9 million and
EBITDA of -0.2 million in 3m 2021
March 2021 | Page 4
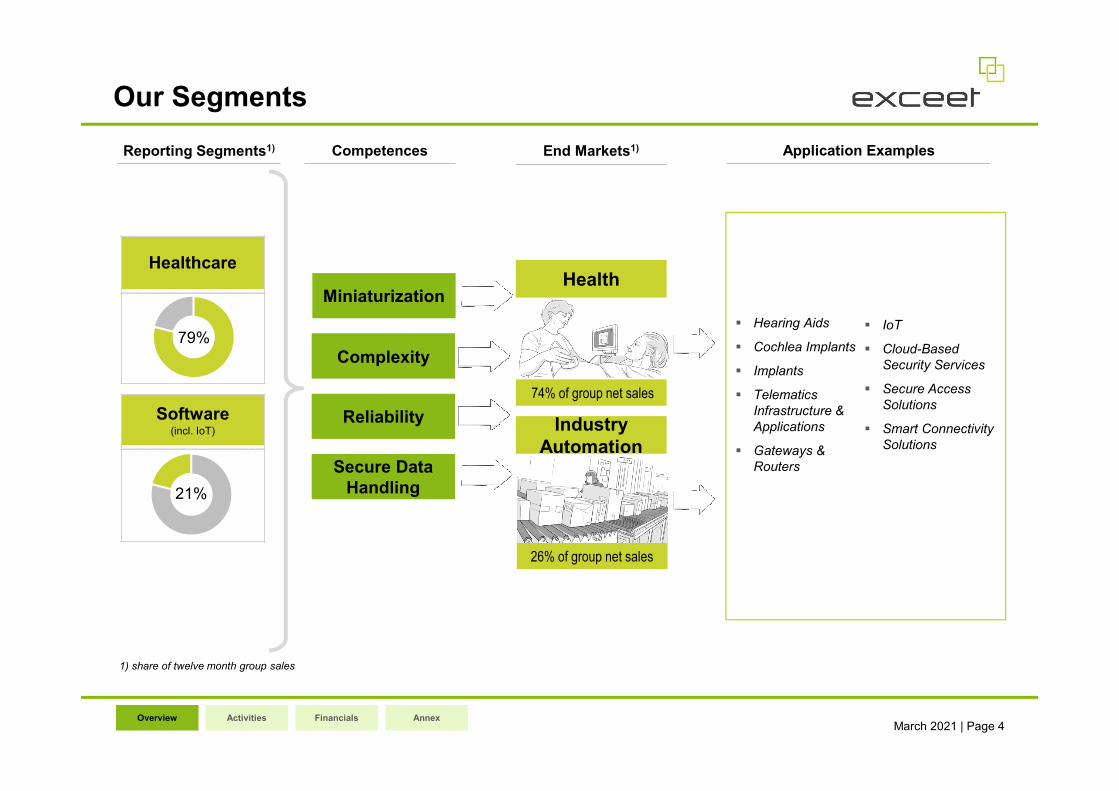
Our Segments
Reporting Segments1)
Healthcare
1) share of twelve month group sales
Miniaturization
Complexity
Reliability
Secure Data
Handling
Software(incl. IoT)
79%
21%
Hearing Aids
Cochlea Implants
Implants
Telematics
Infrastructure &
Applications
Gateways &
Routers
Health
74% of group net sales
26% of group net sales
Industry
Automation
Competences End Markets1) Application Examples
Financials AnnexOverview Activities
IoT
Cloud-Based
Security Services
Secure Access
Solutions
Smart Connectivity
Solutions
March 2021 | Page 5
Overview
Activities
Financials
Annex
March 2021 | Page 6
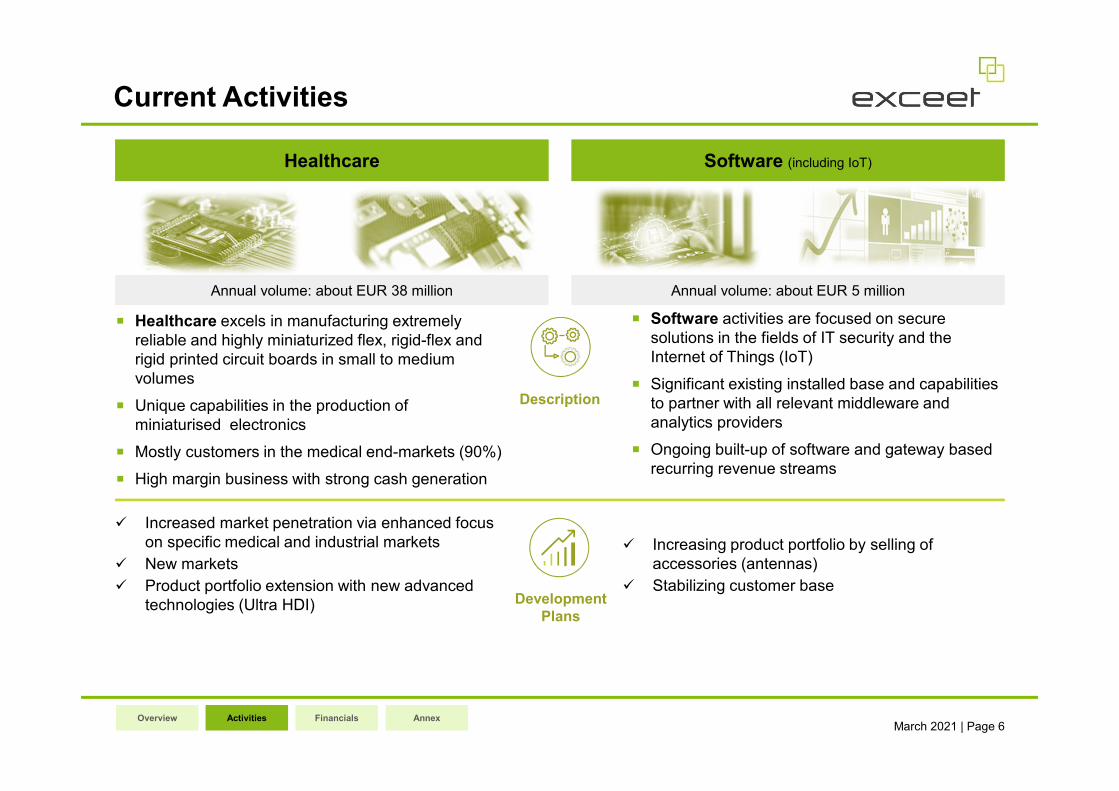
Increased market penetration via enhanced focus
on specific medical and industrial markets
New markets
Product portfolio extension with new advanced
technologies (Ultra HDI)
Current Activities
Healthcare Software (including IoT)
Annual volume: about EUR 38 million Annual volume: about EUR 5 million
� Healthcare excels in manufacturing extremely
reliable and highly miniaturized flex, rigid-flex and
rigid printed circuit boards in small to medium
volumes
� Unique capabilities in the production of
miniaturised electronics
� Mostly customers in the medical end-markets (90%)
� High margin business with strong cash generation
� Software activities are focused on secure
solutions in the fields of IT security and the
Internet of Things (IoT)
� Significant existing installed base and capabilities
to partner with all relevant middleware and
analytics providers
� Ongoing built-up of software and gateway based
recurring revenue streams
Description
Development
Plans
Increasing product portfolio by selling of
accessories (antennas)
Stabilizing customer base
Financials AnnexOverview Activities
March 2021 | Page 7
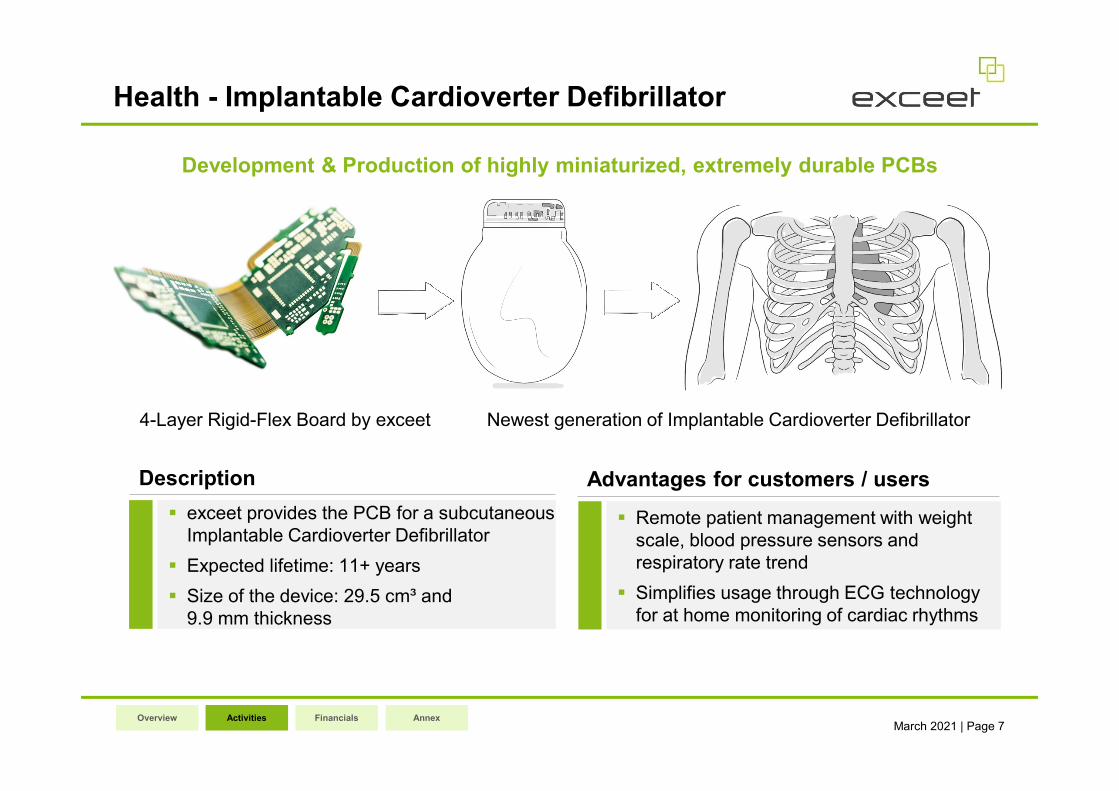
Health - Implantable Cardioverter Defibrillator
4-Layer Rigid-Flex Board by exceet Newest generation of Implantable Cardioverter Defibrillator
Development & Production of highly miniaturized, extremely durable PCBs
exceet provides the PCB for a subcutaneous
Implantable Cardioverter Defibrillator
Expected lifetime: 11+ years
Size of the device: 29.5 cm³ and
9.9 mm thickness
Description Advantages for customers / users
Remote patient management with weight
scale, blood pressure sensors and
respiratory rate trend
Simplifies usage through ECG technology
for at home monitoring of cardiac rhythms
Financials AnnexOverview Activities
March 2021 | Page 8
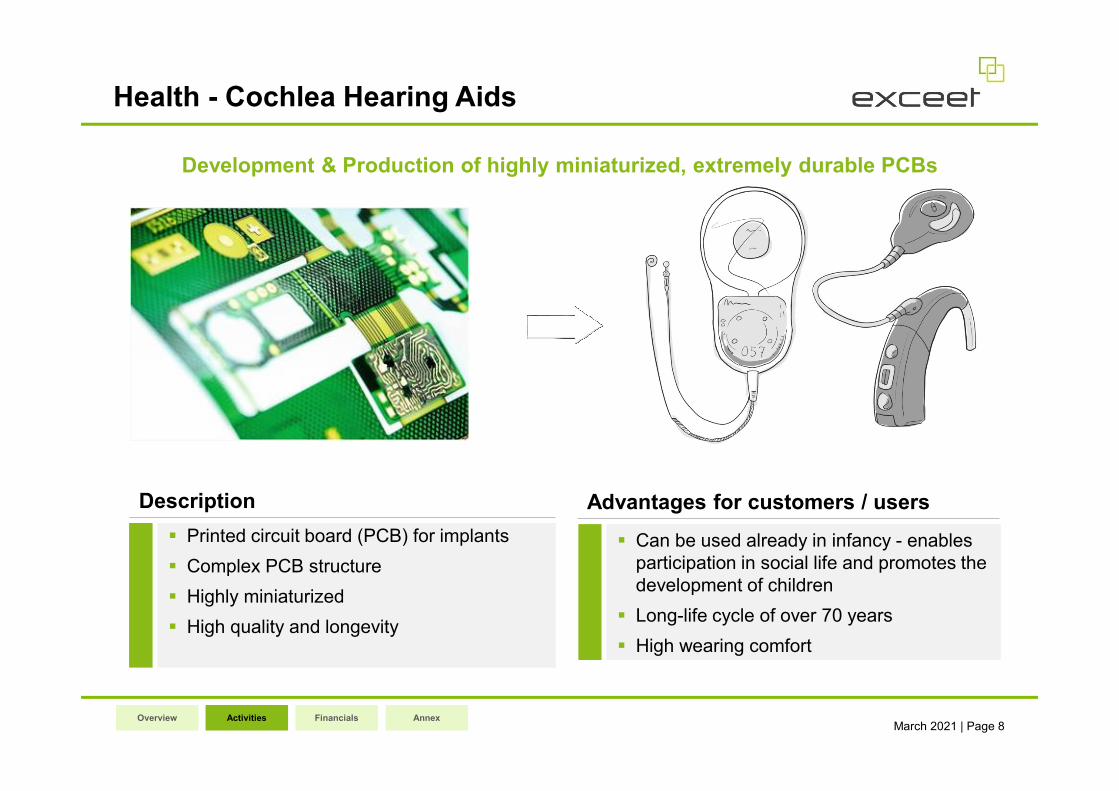
Health - Cochlea Hearing Aids
Development & Production of highly miniaturized, extremely durable PCBs
Printed circuit board (PCB) for implants
Complex PCB structure
Highly miniaturized
High quality and longevity
Description Advantages for customers / users
Can be used already in infancy - enables
participation in social life and promotes the
development of children
Long-life cycle of over 70 years
High wearing comfort
Financials AnnexOverview Activities
March 2021 | Page 9
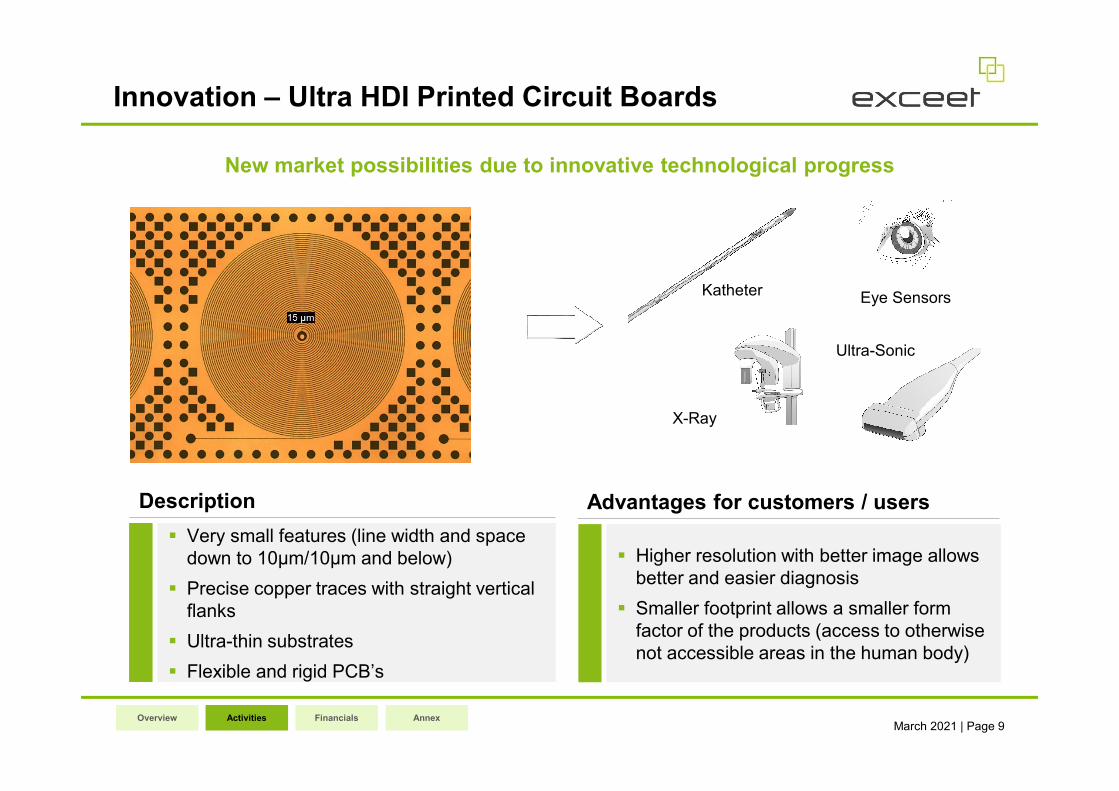
Innovation – Ultra HDI Printed Circuit Boards
New market possibilities due to innovative technological progress
Very small features (line width and space
down to 10µm/10µm and below)
Precise copper traces with straight vertical
flanks
Ultra-thin substrates
Flexible and rigid PCB’s
Description Advantages for customers / users
Higher resolution with better image allows
better and easier diagnosis
Smaller footprint allows a smaller form
factor of the products (access to otherwise
not accessible areas in the human body)
Eye SensorsKatheter
Ultra-Sonic
X-Ray
Financials AnnexOverview Activities
March 2021 | Page 10
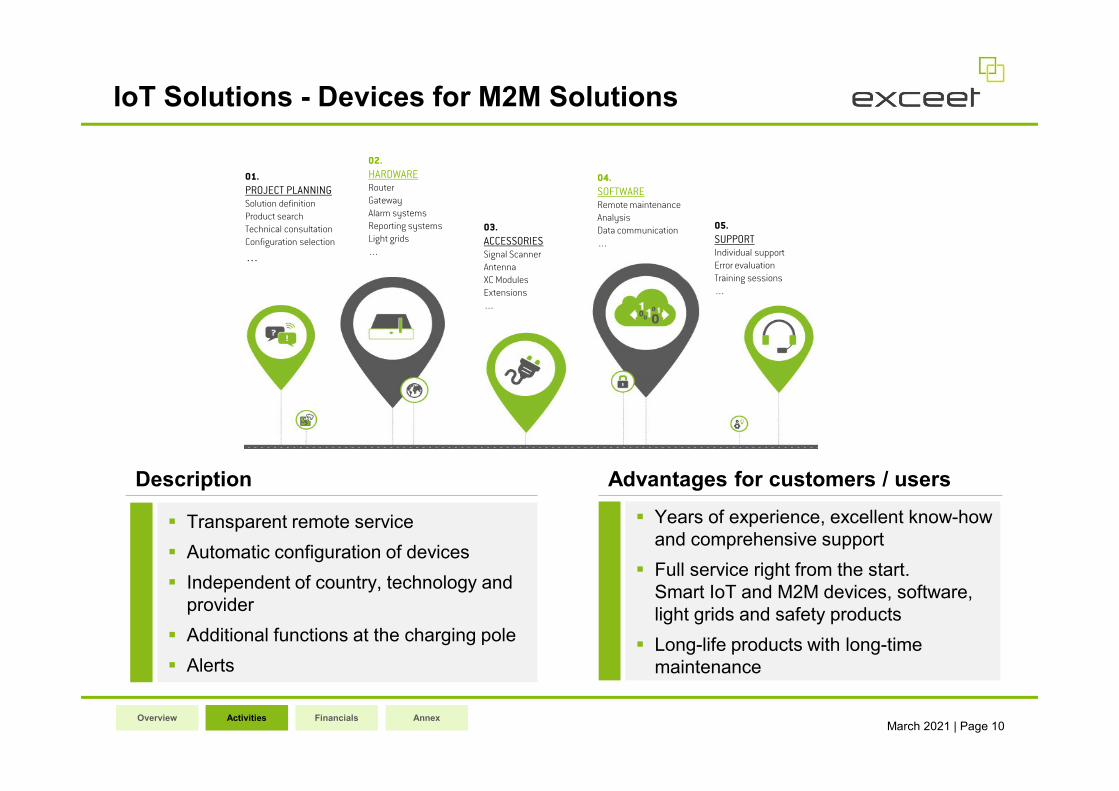
IoT Solutions - Devices for M2M Solutions
Financials AnnexOverview Activities
Transparent remote service
Automatic configuration of devices
Independent of country, technology and
provider
Additional functions at the charging pole
Alerts
Description Advantages for customers / users
Years of experience, excellent know-how
and comprehensive support
Full service right from the start.
Smart IoT and M2M devices, software,
light grids and safety products
Long-life products with long-time
maintenance
01.
PROJECT PLANNING
Solution definition
Product search
Technical consultation
Configuration selection
…
02.
HARDWARE
Router
Gateway
Alarm systems
Reporting systems
Light grids
…
03.
ACCESSORIES
Signal Scanner
Antenna
XC Modules
Extensions
…
04.
SOFTWARE
Remote maintenance
Analysis
Data communication
…
05.
SUPPORT
Individual support
Error evaluation
Training sessions
…
March 2021 | Page 11
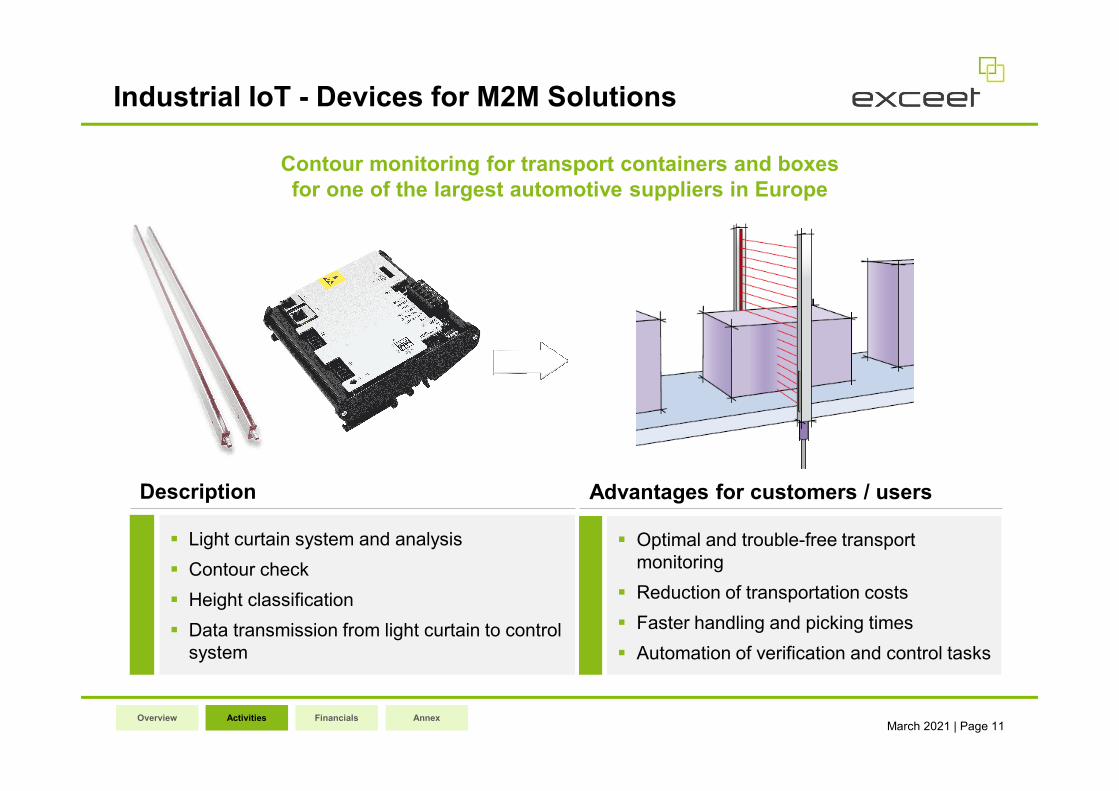
Industrial IoT - Devices for M2M Solutions
Light curtain system and analysis
Contour check
Height classification
Data transmission from light curtain to control
system
Description Advantages for customers / users
Optimal and trouble-free transport
monitoring
Reduction of transportation costs
Faster handling and picking times
Automation of verification and control tasks
Contour monitoring for transport containers and boxes
for one of the largest automotive suppliers in Europe
Financials AnnexOverview Activities
March 2021 | Page 12
Business Overview
Activities
Financials
Annex
March 2021 | Page 13
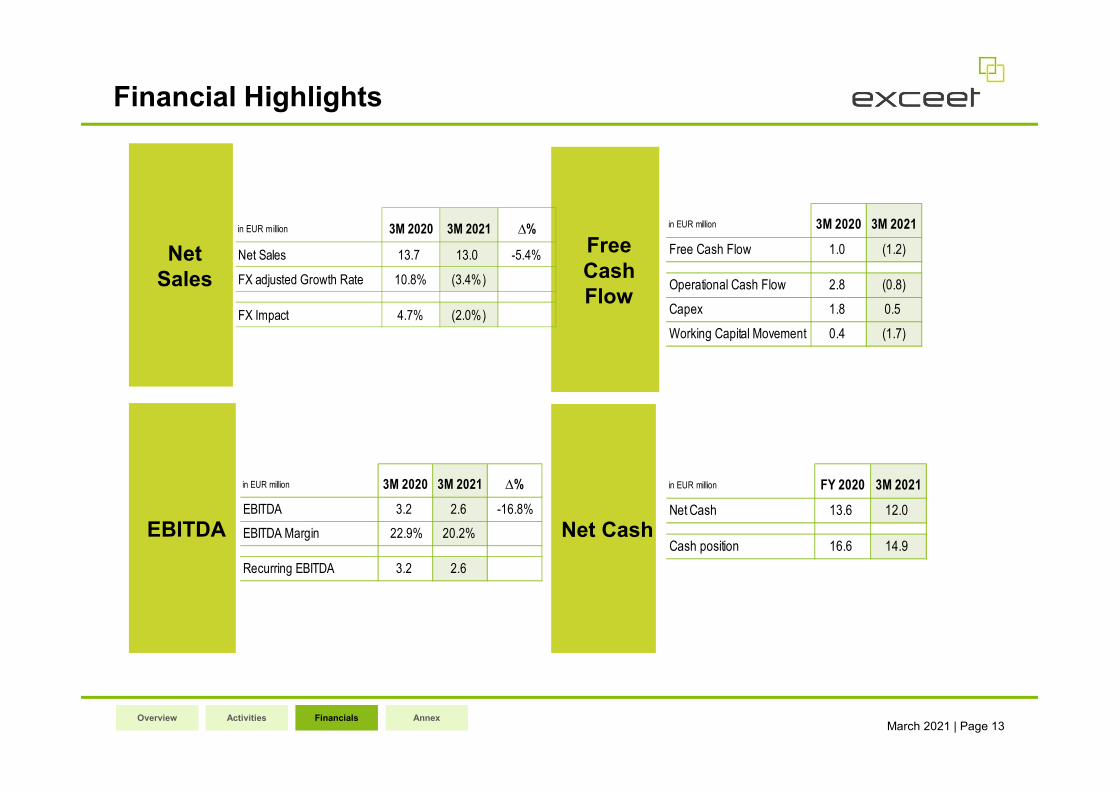
Financial Highlights
Net
Sales
EBITDA
Free
Cash
Flow
Net Cash
Financials AnnexOverview Activities
in EUR million 3M 2020 3M 2021 ∆%
Net Sales 13.7 13.0 -5.4%
FX adjusted Growth Rate 10.8% (3.4%)
FX Impact 4.7% (2.0%)
in EUR million 3M 2020 3M 2021 ∆%
EBITDA 3.2 2.6 -16.8%
EBITDA Margin 22.9% 20.2%
Recurring EBITDA 3.2 2.6
in EUR million FY 2020 3M 2021
Net Cash 13.6 12.0
Cash position 16.6 14.9
in EUR million 3M 2020 3M 2021
Free Cash Flow 1.0 (1.2)
Operational Cash Flow 2.8 (0.8)
Capex 1.8 0.5
Working Capital Movement 0.4 (1.7)
March 2021 | Page 14
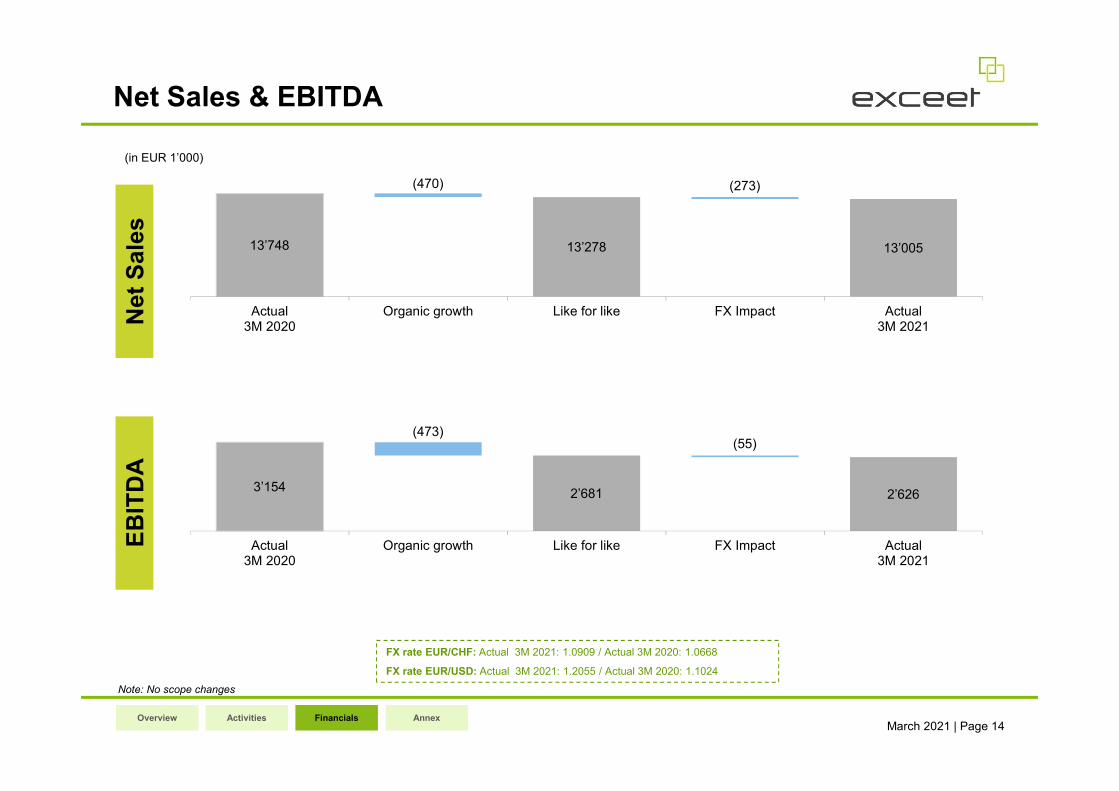
Net Sales & EBITDA
13’748 13’278 13’005
(470) (273)
Actual3M 2020
Organic growth Like for like FX Impact Actual3M 2021
3’1542’681 2’626
(473)(55)
Actual3M 2020
Organic growth Like for like FX Impact Actual3M 2021
Net
Sale
sE
BIT
DA
FX rate EUR/CHF: Actual 3M 2021: 1.0909 / Actual 3M 2020: 1.0668
FX rate EUR/USD: Actual 3M 2021: 1.2055 / Actual 3M 2020: 1.1024
Financials AnnexOverview Activities
Note: No scope changes
(in EUR 1’000)
March 2021 | Page 15
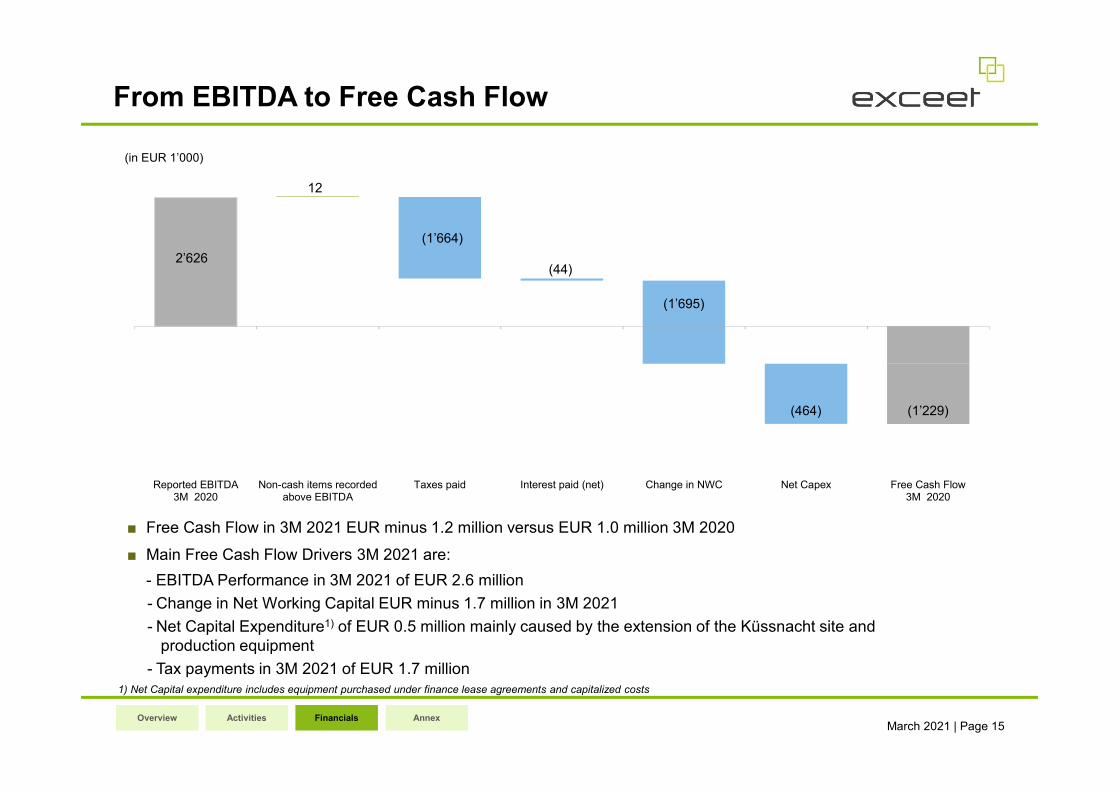
From EBITDA to Free Cash Flow
■ Free Cash Flow in 3M 2021 EUR minus 1.2 million versus EUR 1.0 million 3M 2020
■ Main Free Cash Flow Drivers 3M 2021 are:d
- EBITDA Performance in 3M 2021 of EUR 2.6 million
- Change in Net Working Capital EUR minus 1.7 million in 3M 2021
- Net Capital Expenditure1) of EUR 0.5 million mainly caused by the extension of the Küssnacht site and
production equipment
- Tax payments in 3M 2021 of EUR 1.7 million
1) Net Capital expenditure includes equipment purchased under finance lease agreements and capitalized costs
2’626
12
(1’664)
(44)
(1’695)
(464) (1’229)
Reported EBITDA3M 2020
Non-cash items recordedabove EBITDA
Taxes paid Interest paid (net) Change in NWC Net Capex Free Cash Flow3M 2020
Financials AnnexOverview Activities
(in EUR 1’000)
March 2021 | Page 16
Overview
Activities
Financials
Annex
March 2021 | Page 17
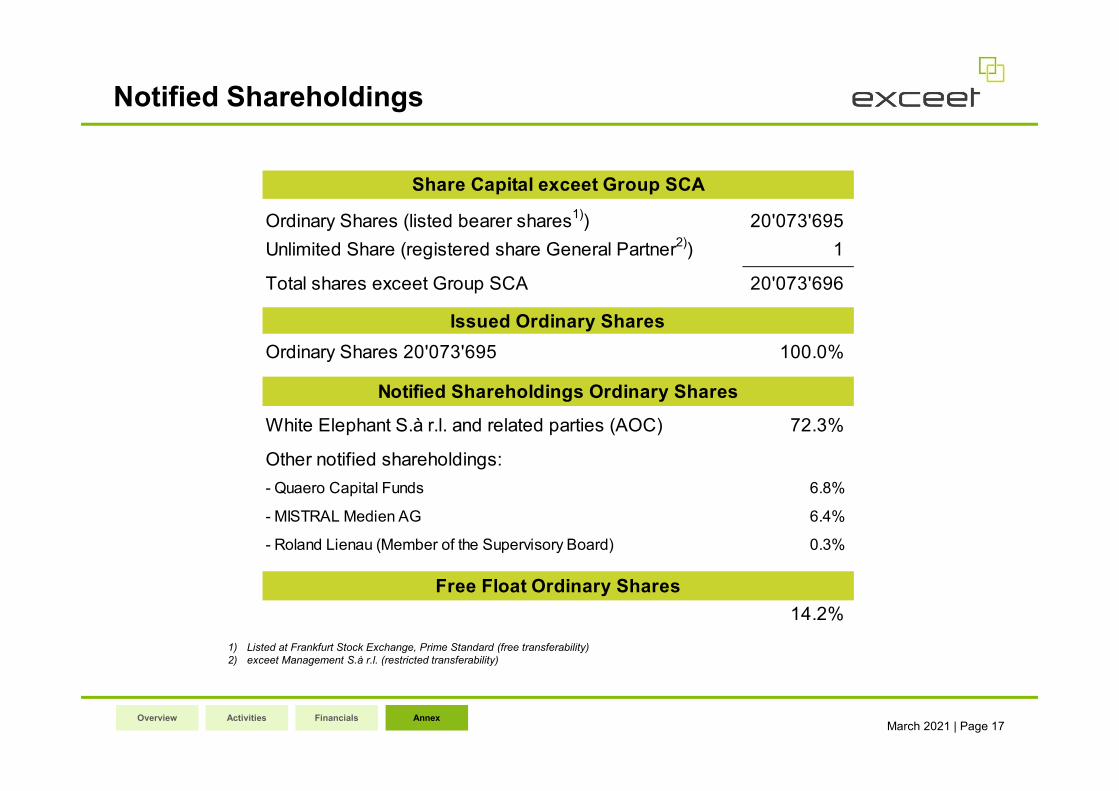
1) Listed at Frankfurt Stock Exchange, Prime Standard (free transferability)
2) exceet Management S.à r.l. (restricted transferability)
Notified Shareholdings
Share Capital exceet Group SCA
Ordinary Shares (listed bearer shares1)
) 20'073'695
Unlimited Share (registered share General Partner2)
) 1
Total shares exceet Group SCA 20'073'696
Issued Ordinary Shares
Ordinary Shares 20'073'695 100.0%
Notified Shareholdings Ordinary Shares
White Elephant S.à r.l. and related parties (AOC) 72.3%
Other notified shareholdings:
- Quaero Capital Funds 6.8%
- MISTRAL Medien AG 6.4%
- Roland Lienau (Member of the Supervisory Board) 0.3%
Free Float Ordinary Shares
14.2%
Financials AnnexOverview Activities
March 2021 | Page 18
Consolidated Financials
January – March 2021 & 2020
Financials AnnexOverview Activities
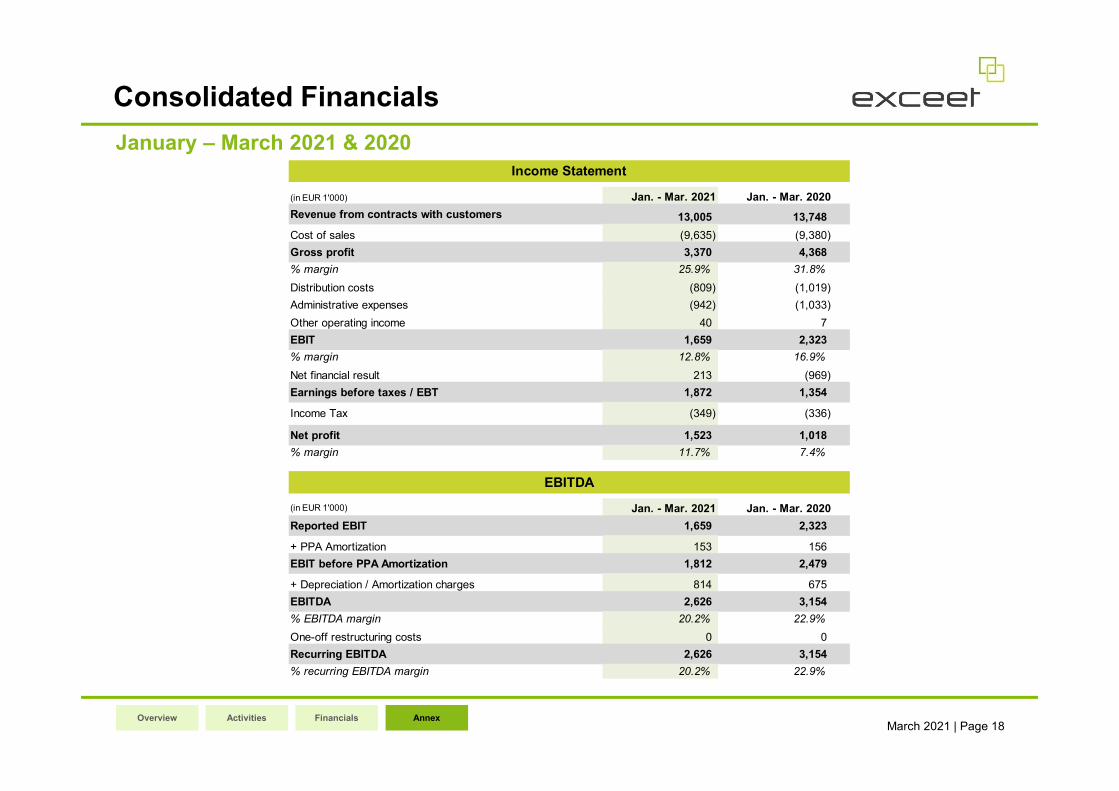
(in EUR 1'000) Jan. - Mar. 2021 Jan. - Mar. 2020
Revenue from contracts with customers 13,005 13,748
Cost of sales (9,635) (9,380)
Gross profit 3,370 4,368
% margin 25.9% 31.8%
Distribution costs (809) (1,019)
Administrative expenses (942) (1,033)
Other operating income 40 7
EBIT 1,659 2,323
% margin 12.8% 16.9%
Net financial result 213 (969)
Earnings before taxes / EBT 1,872 1,354
Income Tax (349) (336)
Net profit 1,523 1,018
% margin 11.7% 7.4%
EBITDA
(in EUR 1'000) Jan. - Mar. 2021 Jan. - Mar. 2020
Reported EBIT 1,659 2,323
+ PPA Amortization 153 156
EBIT before PPA Amortization 1,812 2,479
+ Depreciation / Amortization charges 814 675
EBITDA 2,626 3,154
% EBITDA margin 20.2% 22.9%
One-off restructuring costs 0 0
Recurring EBITDA 2,626 3,154
% recurring EBITDA margin 20.2% 22.9%
Income Statement
March 2021 | Page 19
Consolidated Financials
31 March 2021 & 31 December 2020
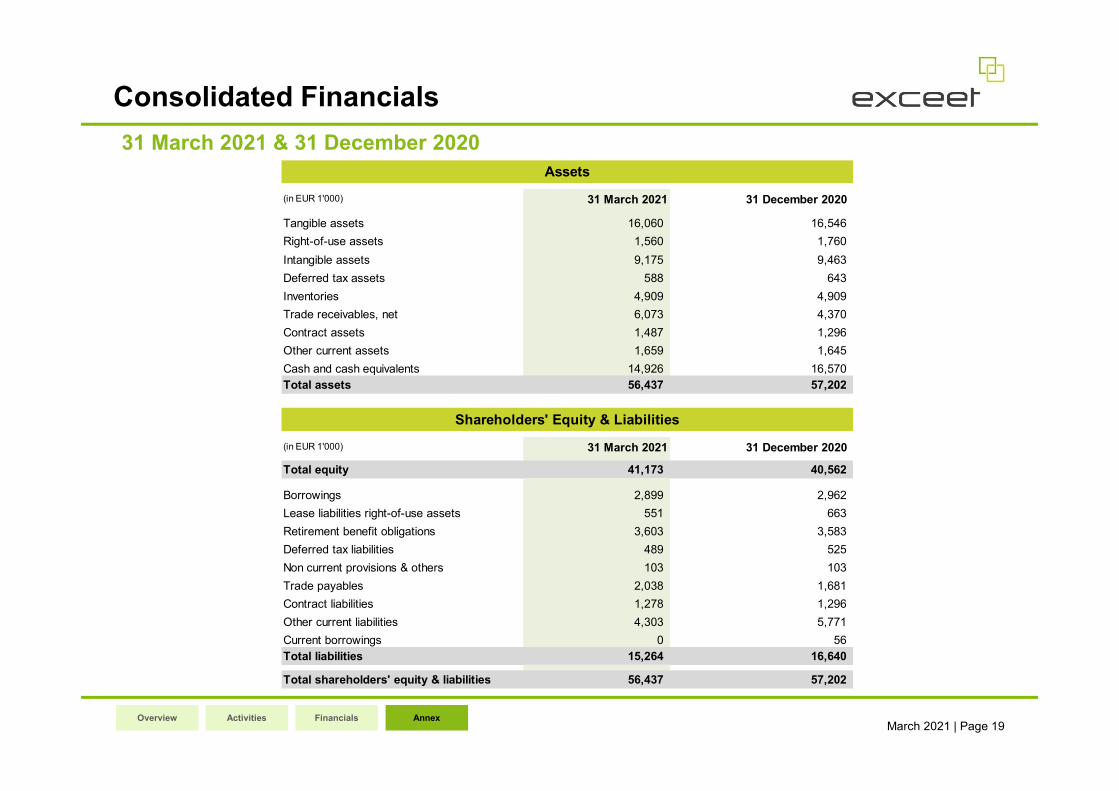
Assets
(in EUR 1'000) 31 March 2021 31 December 2020
Tangible assets 16,060 16,546
Right-of-use assets 1,560 1,760
Intangible assets 9,175 9,463
Deferred tax assets 588 643
Inventories 4,909 4,909
Trade receivables, net 6,073 4,370
Contract assets 1,487 1,296
Other current assets 1,659 1,645
Cash and cash equivalents 14,926 16,570
Total assets 56,437 57,202
Shareholders' Equity & Liabilities
(in EUR 1'000) 31 March 2021 31 December 2020
Total equity 41,173 40,562
Borrowings 2,899 2,962
Lease liabilities right-of-use assets 551 663
Retirement benefit obligations 3,603 3,583
Deferred tax liabilities 489 525
Non current provisions & others 103 103
Trade payables 2,038 1,681
Contract liabilities 1,278 1,296
Other current liabilities 4,303 5,771
Current borrowings 0 56
Total liabilities 15,264 16,640
Total shareholders' equity & liabilities 56,437 57,202
Financials AnnexOverview Activities
March 2021 | Page 20
Consolidated Financials
January – March 2021 & 2020
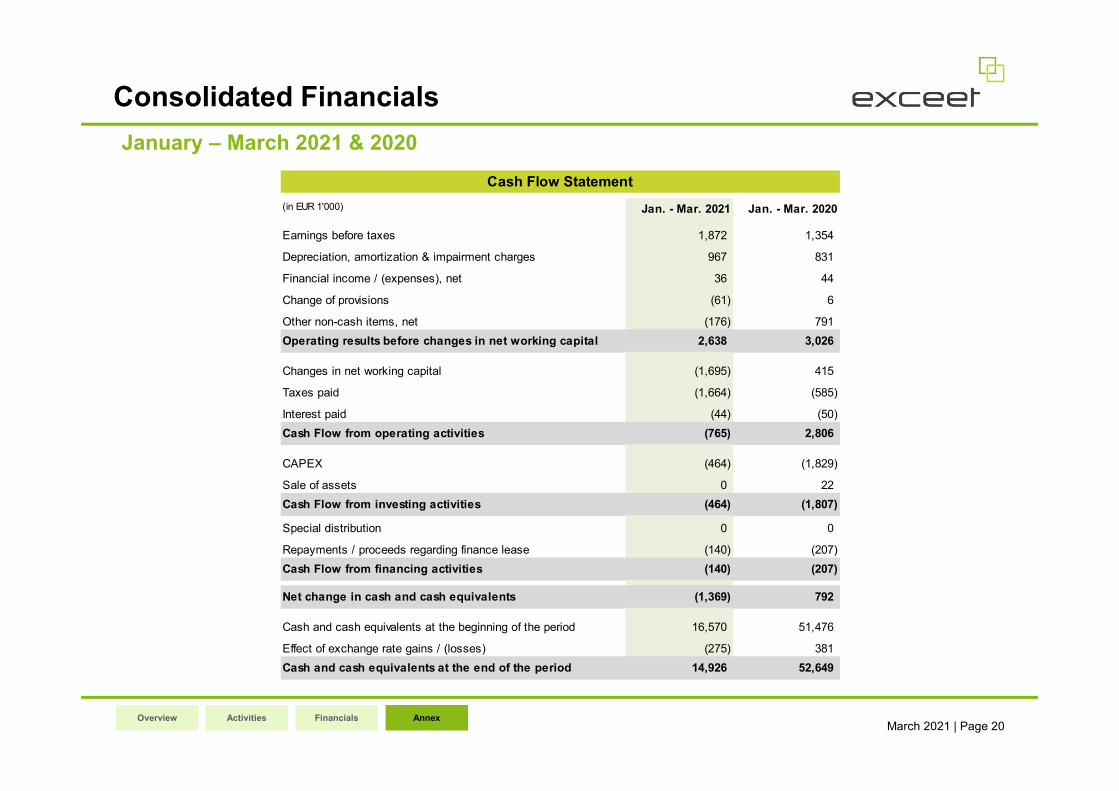
(in EUR 1'000) Jan. - Mar. 2021 Jan. - Mar. 2020
Earnings before taxes 1,872 1,354
Depreciation, amortization & impairment charges 967 831
Financial income / (expenses), net 36 44
Change of provisions (61) 6
Other non-cash items, net (176) 791
Operating results before changes in net working capital 2,638 3,026
Changes in net working capital (1,695) 415
Taxes paid (1,664) (585)
Interest paid (44) (50)
Cash Flow from operating activities (765) 2,806
CAPEX (464) (1,829)
Sale of assets 0 22
Cash Flow from investing activities (464) (1,807)
Special distribution 0 0
Repayments / proceeds regarding finance lease (140) (207)
Cash Flow from financing activities (140) (207)
Net change in cash and cash equivalents (1,369) 792
Cash and cash equivalents at the beginning of the period 16,570 51,476
Effect of exchange rate gains / (losses) (275) 381
Cash and cash equivalents at the end of the period 14,926 52,649
Cash Flow Statement
Financials AnnexOverview Activities
March 2021 | Page 21
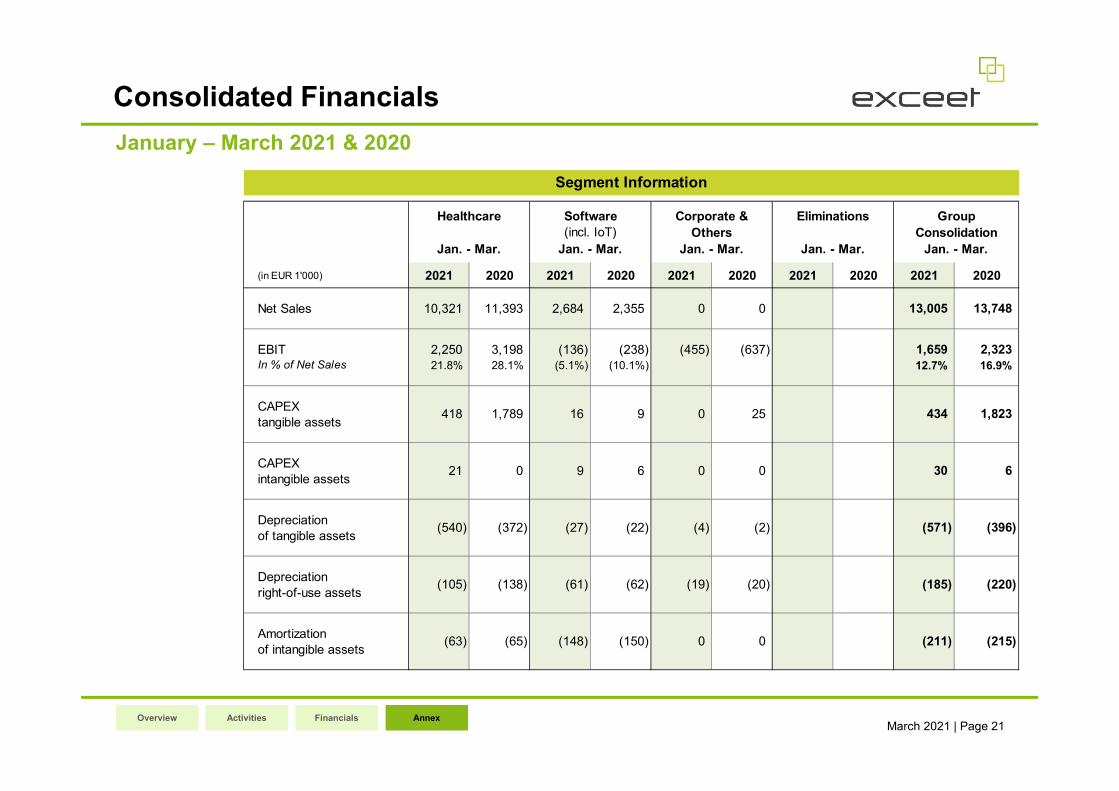
Consolidated Financials
January – March 2021 & 2020
Segment Information
Healthcare Software Eliminations Group
(incl. IoT) Consolidation
Jan. - Mar. Jan. - Mar. Jan. - Mar. Jan. - Mar. Jan. - Mar.
(in EUR 1'000) 2021 2020 2021 2020 2021 2020 2021 2020 2021 2020
Net Sales 10,321 11,393 2,684 2,355 0 0 13,005 13,748
EBIT 2,250 3,198 (136) (238) (455) (637) 1,659 2,323
In % of Net Sales 21.8% 28.1% (5.1%) (10.1%) 12.7% 16.9%
CAPEX
tangible assets
CAPEX
intangible assets
Depreciation
of tangible assets
Depreciation
right-of-use assets
Amortization
of intangible assets(150) 0 0 (211) (215)
(62) (19) (20) (185) (220)
(22) (4) (2) (571) (396)(540)
(105)
(63)
(372) (27)
(138) (61)
(65) (148)
434 1,823
21 0 9 6 0 0 30 6
418
Others
Corporate &
1,789 16 9 0 25
Financials AnnexOverview Activities
March 2021 | Page 22
Disclaimer & Contact
This presentation contains forward-looking statements based on beliefs of exceet Group SCA
management. Such statements reflect current views of exceet Group SCA with respect to future events
and results and are subject to risks and uncertainties. Actual results may vary materially from those
projected here, due to factors including changes in general economic and business conditions, changes in
currency exchange, the introduction of competing products, lack of market acceptance of new products,
services or technologies and changes in business strategy.
exceet Group SCA does not intend or assume any obligation to update these forward-looking statements.
Contact
exceet Group SCA | 17, rue de Flaxweiler | L-6776 Grevenmacher (Luxembourg)
www.exceet.com