Embed Size (px)
Citation preview
ISPE Nordic PAT COP 2009.03.25
Winner of the ISPE awardCompany of the Year 2008
Examples of use of Design of Experiments within manufacturing of Medical Devices“When you can measure what you are speaking about, and express it in numbers, you know something about it; but when you cannot your knowledge is of a unsatisfactory kind”Lord Kelvin
“A theory should be as simple as possible, but no simpler”“Perfection of means and confusion of goals seem to characterize our age”Albert Einstein
Per Vase
ISPE Nordic PAT COP 2009.03.25
Winner of the ISPE awardCompany of the Year 2008
Agenda
• Why DoE? Reduce Cost of Poor Quality• Health Authority view• Case 1: Ultrasonic welding• Case 2: Foam coating• Case 3: Injection moulding• Conclusions
ISPE Nordic PAT COP 2009.03.25
Winner of the ISPE awardCompany of the Year 2008
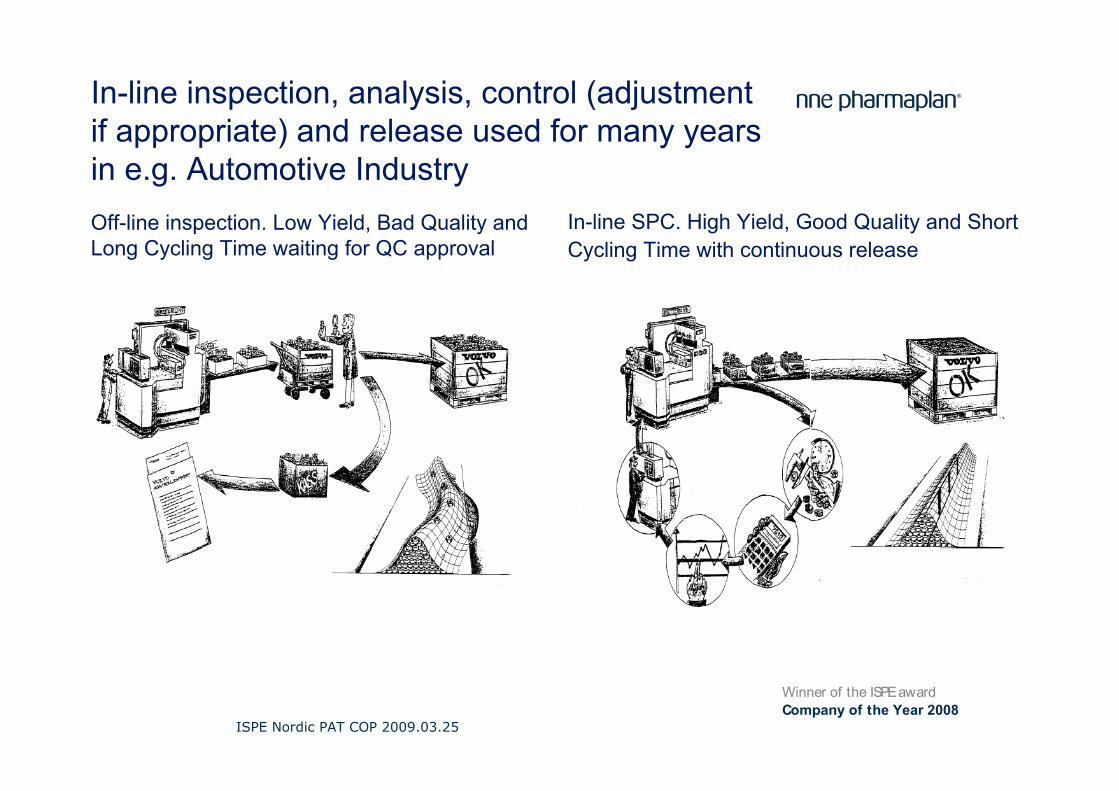
Off-line inspection. Low Yield, Bad Quality and Long Cycling Time waiting for QC approval
In-line SPC. High Yield, Good Quality and Short Cycling Time with continuous release
In-line inspection, analysis, control (adjustment if appropriate) and release used for many years in e.g. Automotive Industry
ISPE Nordic PAT COP 2009.03.25
Winner of the ISPE awardCompany of the Year 2008
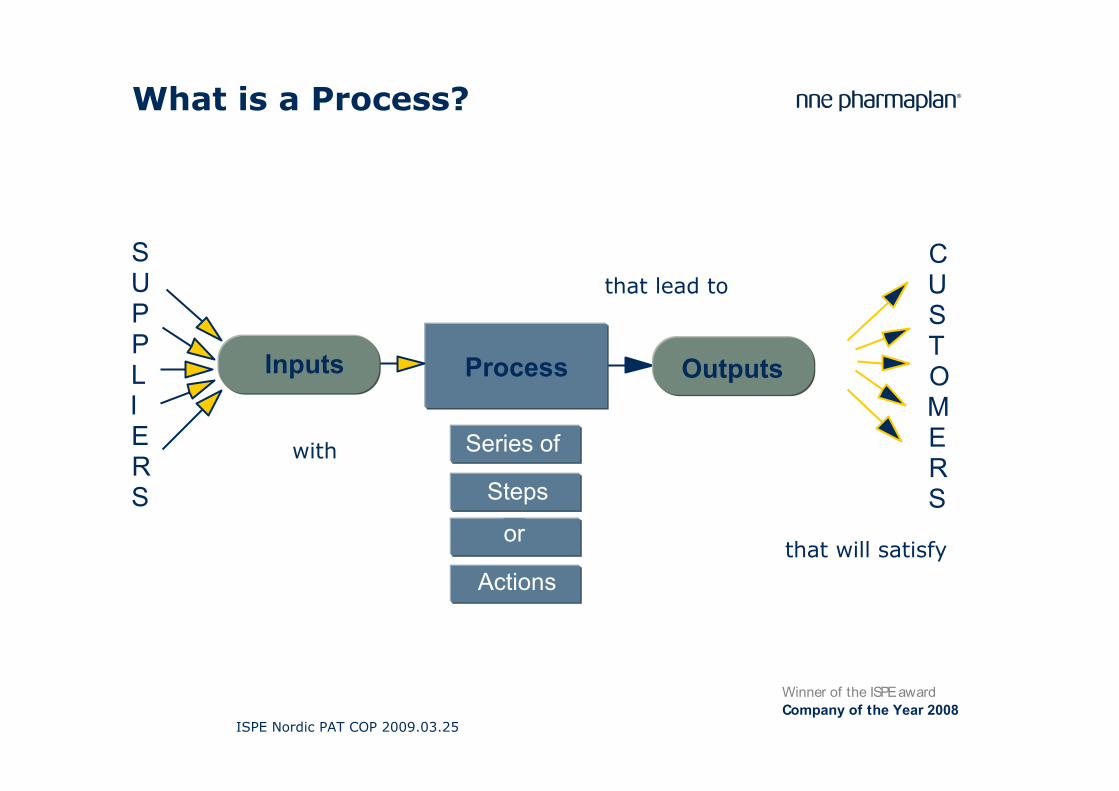
that lead tothat lead to
What is a Process?
C U S T O M E R S
OutputsProcess
Steps
or
Actions
Series of
that will satisfythat will satisfy
S U P P L I ER S
Inputs
withwith
ISPE Nordic PAT COP 2009.03.25
Winner of the ISPE awardCompany of the Year 2008
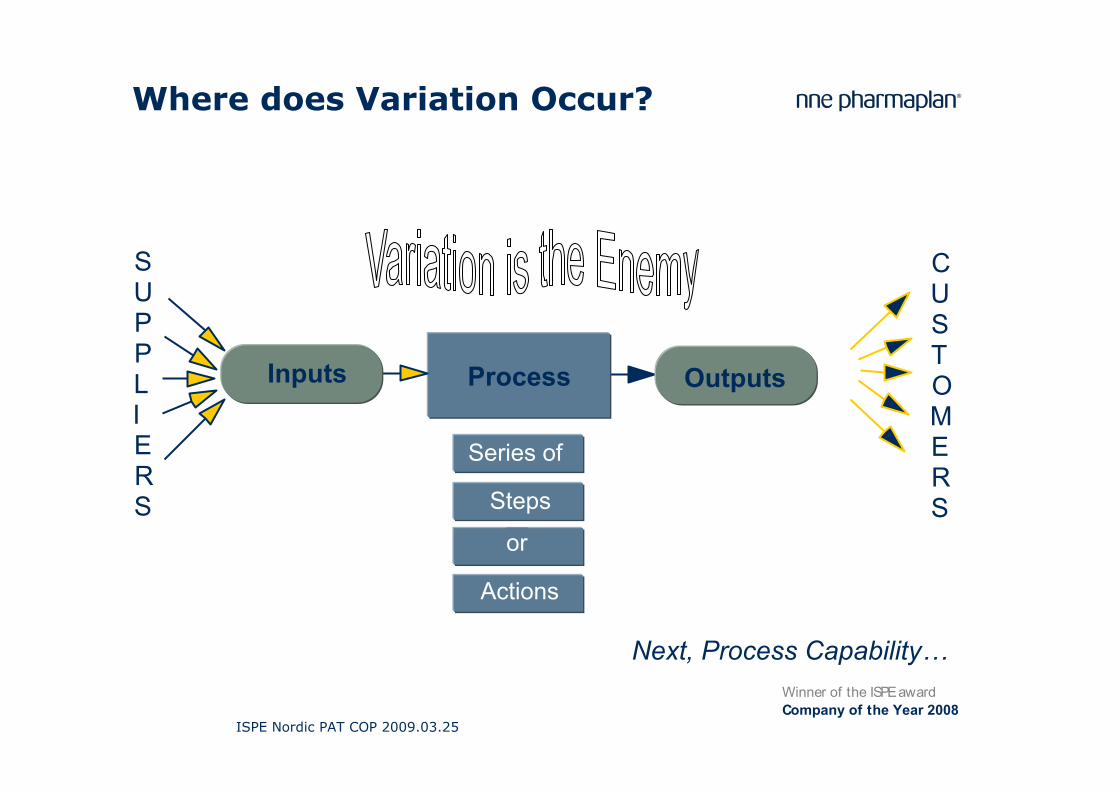
Where does Variation Occur?
C U S T O M E R S
OutputsProcess
Steps
or
Actions
Series of
S U P P L I ER S
Inputs
Next, Process Capability…
ISPE Nordic PAT COP 2009.03.25
Winner of the ISPE awardCompany of the Year 2008
0 2σ 4σ 6σ−2σ−4σ−6σ
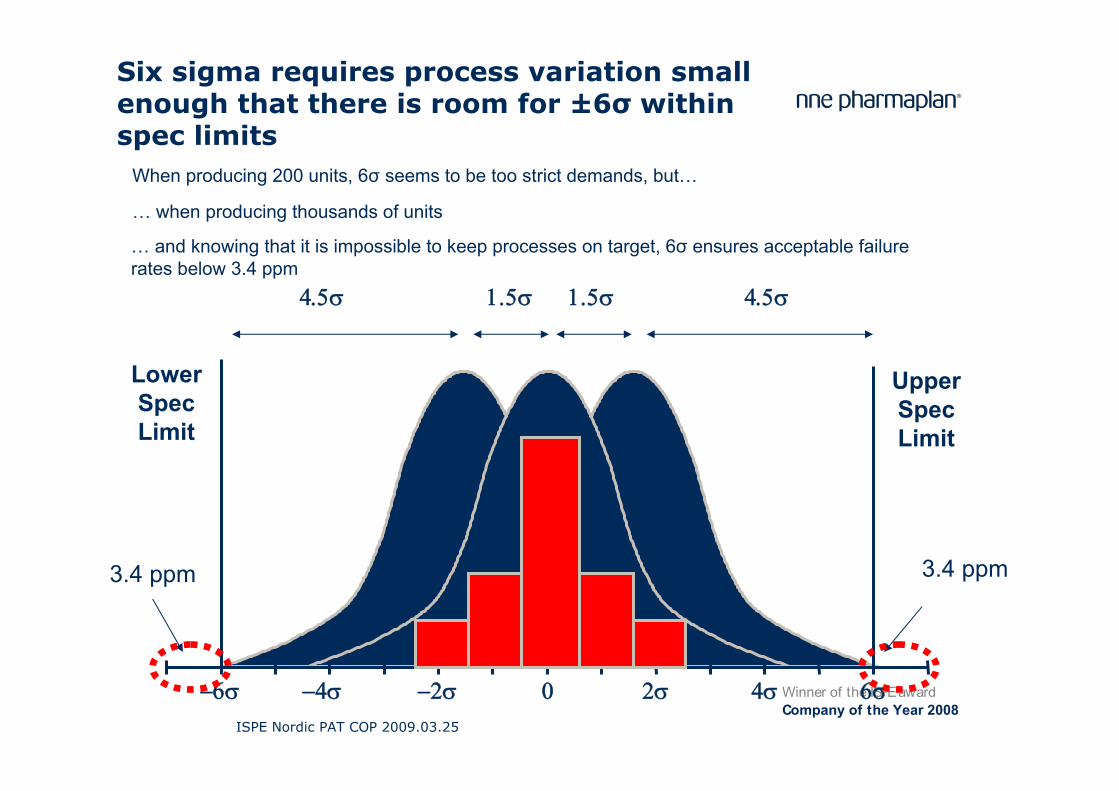
Six sigma requires process variation small enough that there is room for ±6σ within spec limits
LowerSpecLimit
UpperSpecLimit
1.5σ1.5σ 4.5σ4.5σ
3.4 ppm3.4 ppm
When producing 200 units, 6σ seems to be too strict demands, but…
… when producing thousands of units
… and knowing that it is impossible to keep processes on target, 6σ ensures acceptable failure rates below 3.4 ppm
ISPE Nordic PAT COP 2009.03.25
Winner of the ISPE awardCompany of the Year 2008
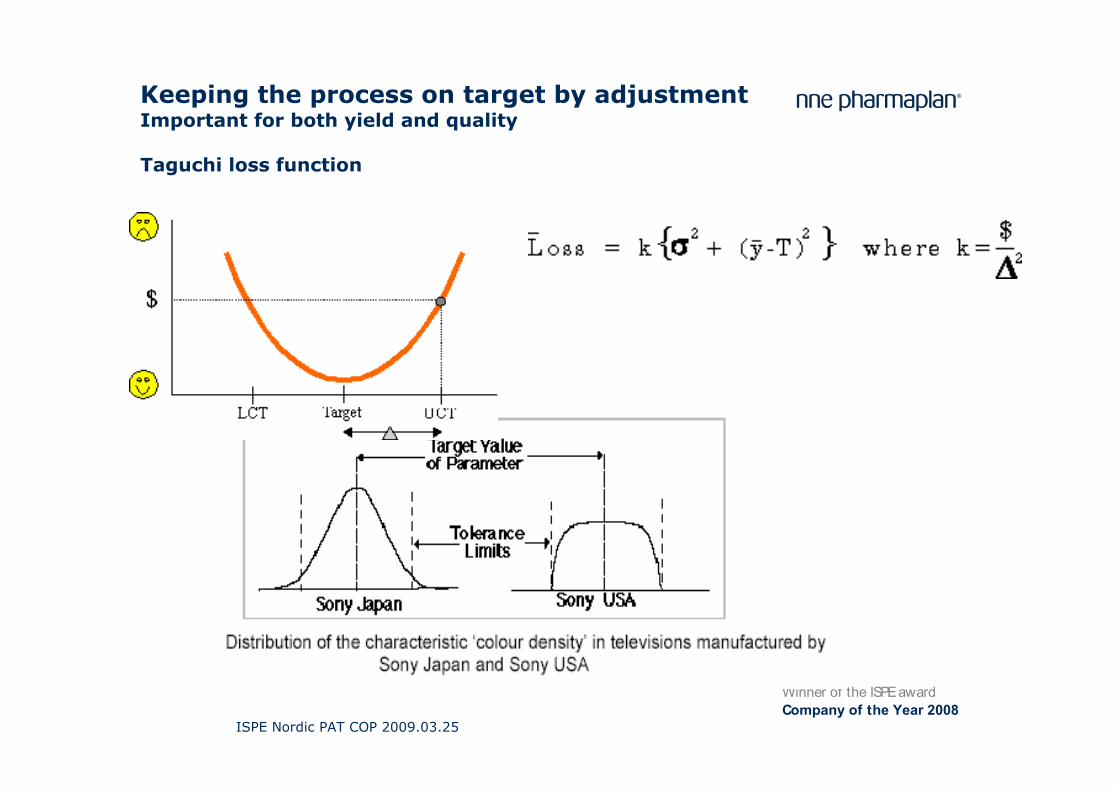
Keeping the process on target by adjustmentImportant for both yield and quality
Taguchi loss function
ISPE Nordic PAT COP 2009.03.25
Winner of the ISPE awardCompany of the Year 2008
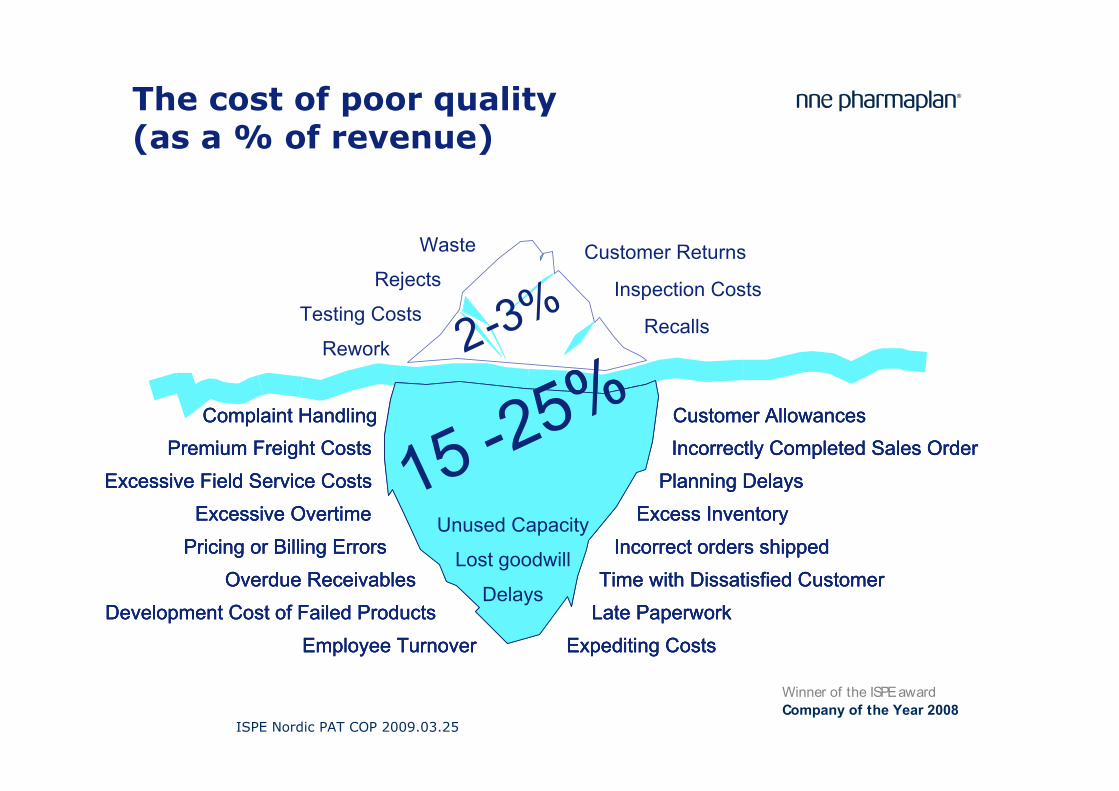
The cost of poor quality (as a % of revenue)
Customer Returns
Inspection Costs
Recalls
Waste
Rejects
Rework
Testing Costs
Customer AllowancesIncorrectly Completed Sales Order
Excess InventoryIncorrect orders shipped
Time with Dissatisfied CustomerLate Paperwork
Expediting Costs
Planning DelaysExcessive Overtime
Premium Freight CostsExcessive Field Service Costs
Pricing or Billing Errors
Complaint Handling
Overdue Receivables
Employee TurnoverDevelopment Cost of Failed Products
Customer AllowancesIncorrectly Completed Sales Order
Excess InventoryIncorrect orders shipped
Time with Dissatisfied CustomerLate Paperwork
Expediting Costs
Planning Delays
Customer AllowancesIncorrectly Completed Sales Order
Excess InventoryIncorrect orders shipped
Time with Dissatisfied CustomerLate Paperwork
Expediting Costs
Planning DelaysExcessive Overtime
Premium Freight CostsExcessive Field Service Costs
Pricing or Billing Errors
Complaint Handling
Overdue Receivables
Employee TurnoverDevelopment Cost of Failed Products
Excessive Overtime
Premium Freight CostsExcessive Field Service Costs
Pricing or Billing Errors
Complaint Handling
Overdue Receivables
Employee TurnoverDevelopment Cost of Failed Products
15 -25%
Unused Capacity
Lost goodwill
Delays
15 -25%
Unused Capacity
Lost goodwill
Delays
2-3%
ISPE Nordic PAT COP 2009.03.25
Winner of the ISPE awardCompany of the Year 2008
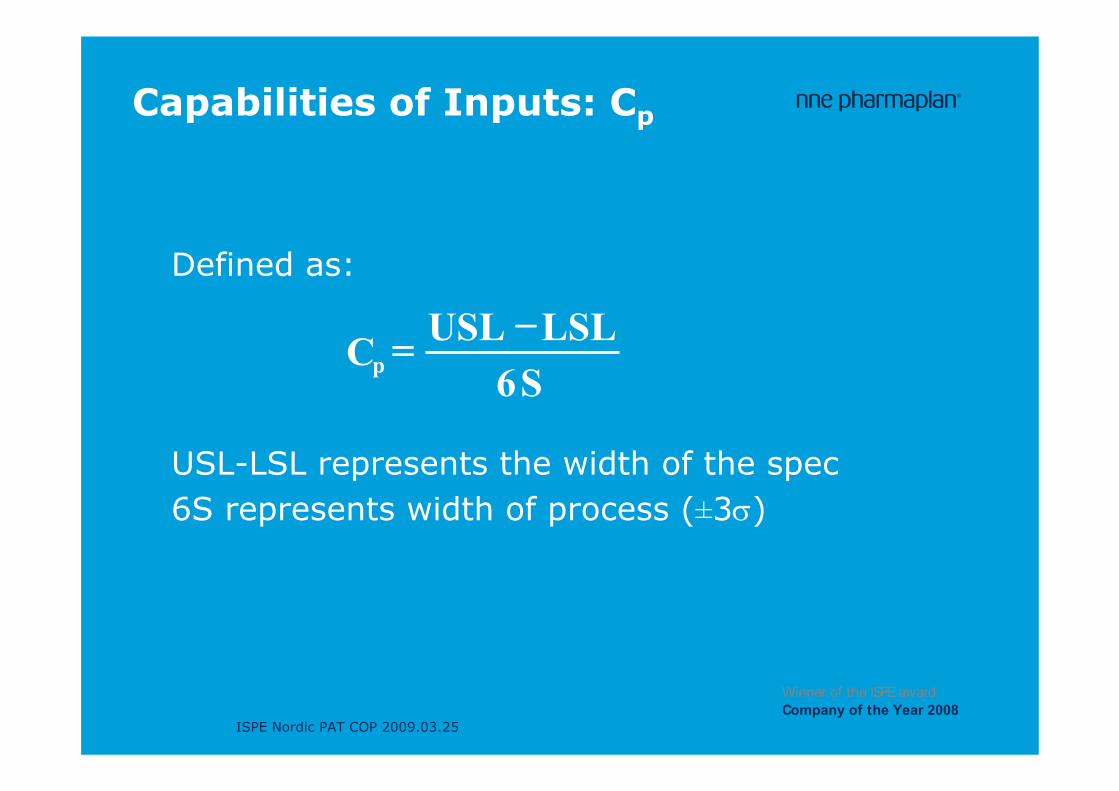
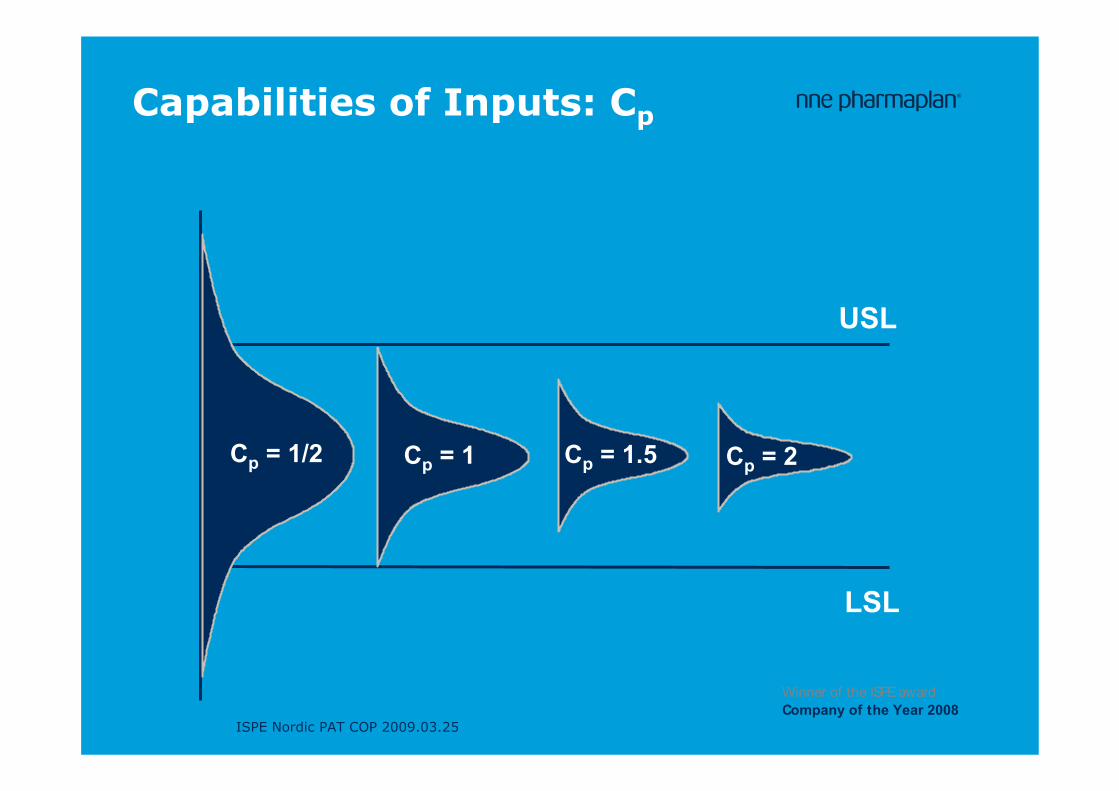
Capabilities of Inputs: Cp
•Defined as:
•USL-LSL represents the width of the spec•6S represents width of process (±3σ)
−=p S6
LSLUSLC
ISPE Nordic PAT COP 2009.03.25
Winner of the ISPE awardCompany of the Year 2008
Capabilities of Inputs: Cp
LSL
USL
Cp = 1/2 Cp = 1 Cp = 2Cp = 1.5
ISPE Nordic PAT COP 2009.03.25
Winner of the ISPE awardCompany of the Year 2008
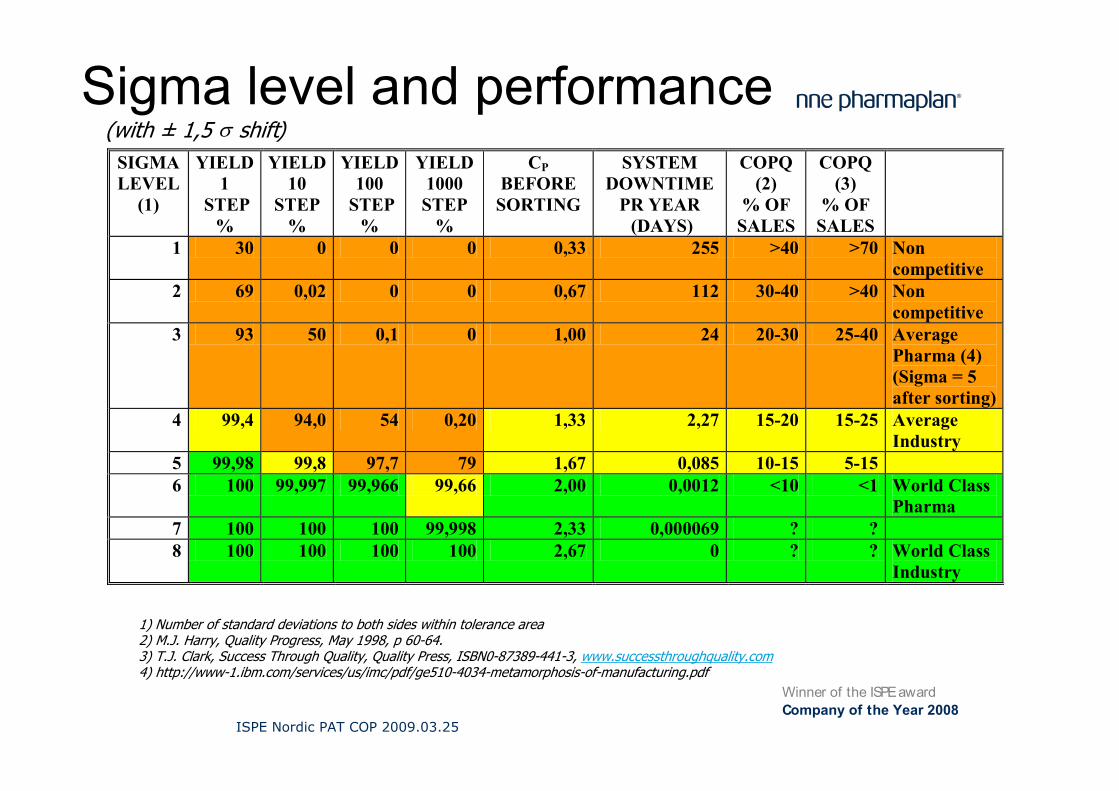
Sigma level and performance(with ± 1,5 σ shift)
1) Number of standard deviations to both sides within tolerance area2) M.J. Harry, Quality Progress, May 1998, p 60-64.3) T.J. Clark, Success Through Quality, Quality Press, ISBN0-87389-441-3, www.successthroughquality.com4) http://www-1.ibm.com/services/us/imc/pdf/ge510-4034-metamorphosis-of-manufacturing.pdf
SIGMALEVEL
(1)
YIELD 1
STEP %
YIELD 10
STEP %
YIELD 100
STEP %
YIELD 1000
STEP %
CP BEFORE
SORTING
SYSTEM DOWNTIME
PR YEAR (DAYS)
COPQ (2)
% OF SALES
COPQ (3)
% OF SALES
1 30 0 0 0 0,33 255 >40 >70 Non competitive
2 69 0,02 0 0 0,67 112 30-40 >40 Non competitive
3 93 50 0,1 0 1,00 24 20-30 25-40 Average Pharma (4) (Sigma = 5 after sorting)
4 99,4 94,0 54 0,20 1,33 2,27 15-20 15-25 Average Industry
5 99,98 99,8 97,7 79 1,67 0,085 10-15 5-15 6 100 99,997 99,966 99,66 2,00 0,0012 <10 <1 World Class
Pharma 7 100 100 100 99,998 2,33 0,000069 ? ? 8 100 100 100 100 2,67 0 ? ? World Class
Industry
ISPE Nordic PAT COP 2009.03.25
Winner of the ISPE awardCompany of the Year 2008
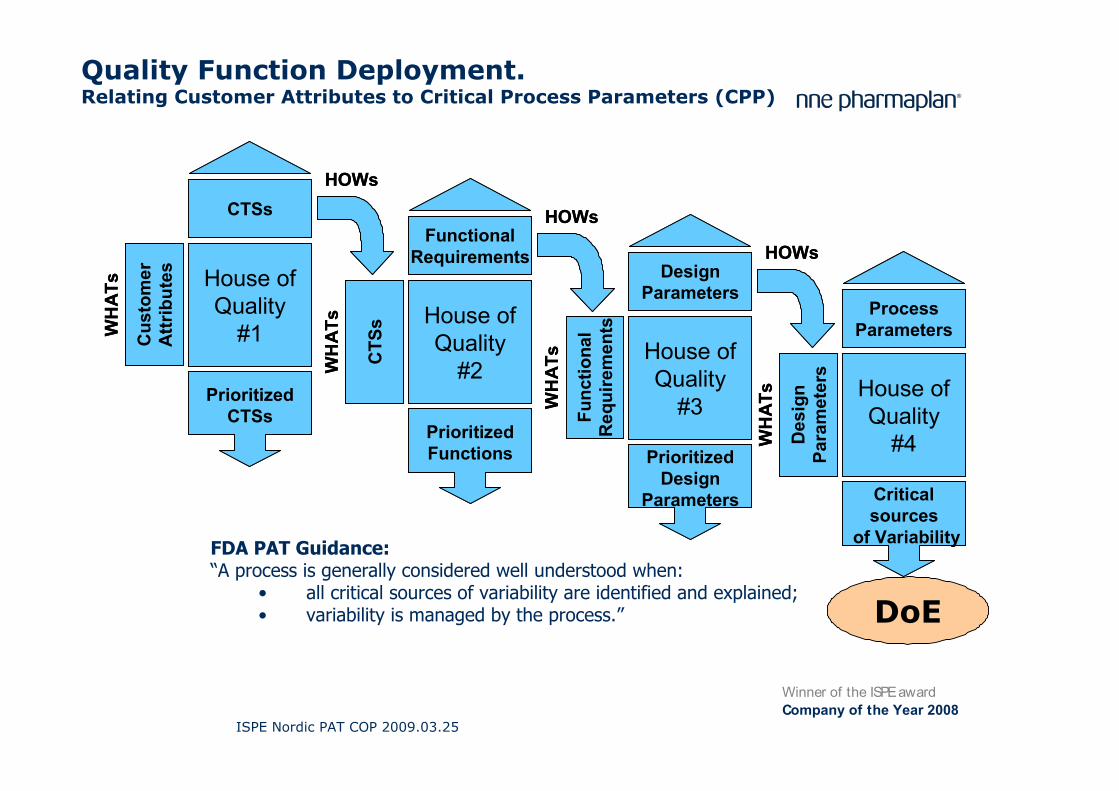
Quality Function Deployment.Relating Customer Attributes to Critical Process Parameters (CPP)
CTS = Critical to Satisfaction”Design for Six Sigma - A Roadmap for Product Development”, Yang, Kai et al, McGraw-Hill 2003
House ofQuality
#1Cus
tom
erA
ttrib
utes
WH
ATs
CTSs
PrioritizedCTSs
HOWs
House ofQuality
#1Cus
tom
erA
ttrib
utes
WH
ATs
CTSs
PrioritizedCTSs
HOWs
House ofQuality
#2CTS
s
WH
ATs
FunctionalRequirements
PrioritizedFunctions
HOWs
House ofQuality
#2CTS
s
WH
ATs
FunctionalRequirements
PrioritizedFunctions
HOWs
House ofQuality
#3Func
tiona
lR
equi
rem
ents
WH
ATs
DesignParameters
PrioritizedDesign
Parameters
HOWs
House ofQuality
#3Func
tiona
lR
equi
rem
ents
WH
ATs
DesignParameters
PrioritizedDesign
Parameters
HOWs
House ofQuality
#4Des
ign
Para
met
ers
WH
ATs
ProcessParameters
Criticalsources
of Variability
House ofQuality
#4Des
ign
Para
met
ers
WH
ATs
ProcessParameters
Criticalsources
of Variability
DoE
FDA PAT Guidance:“A process is generally considered well understood when:
• all critical sources of variability are identified and explained;• variability is managed by the process.”

ISPE Nordic PAT COP 2009.03.25
Winner of the ISPE awardCompany of the Year 2008
Agenda
••• Why DoE? Reduce Cost of Poor QualityWhy DoE? Reduce Cost of Poor QualityWhy DoE? Reduce Cost of Poor Quality• Health Authority view• Case 1: Ultrasonic welding• Case 2: Foam coating• Case 3: Injection moulding• Conclusions
ISPE Nordic PAT COP 2009.03.25
Winner of the ISPE awardCompany of the Year 2008
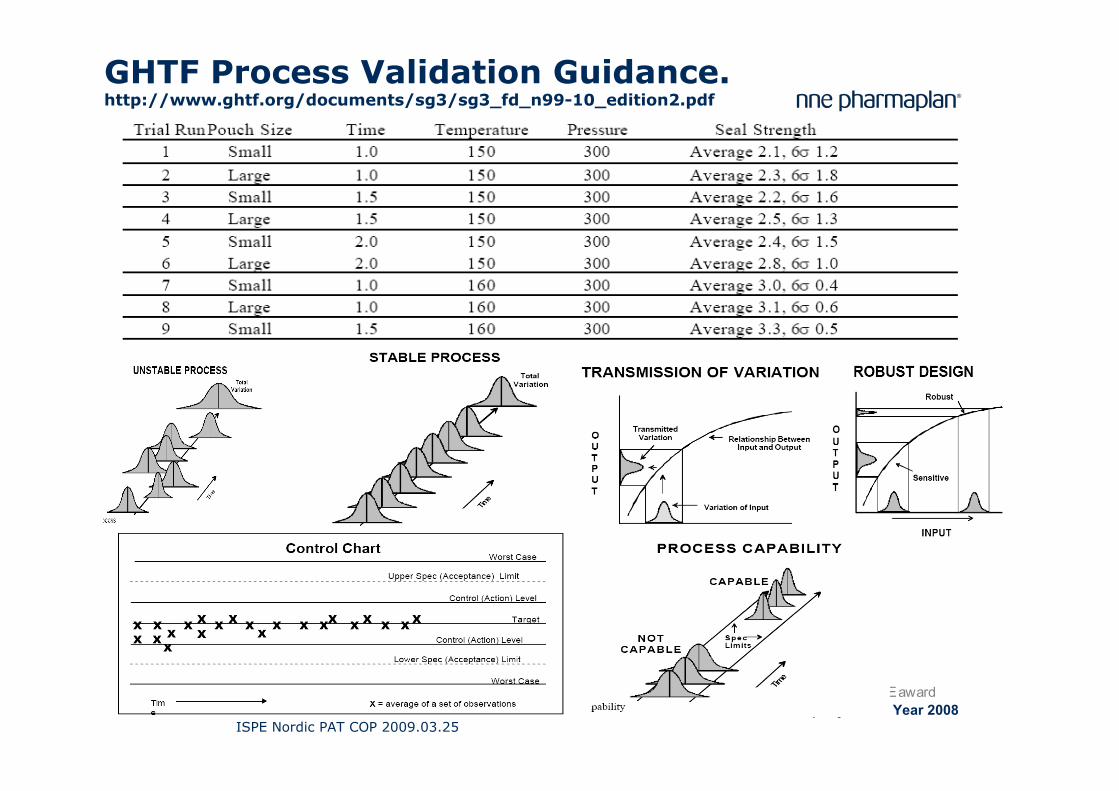
GHTF Process Validation Guidance.http://www.ghtf.org/documents/sg3/sg3_fd_n99-10_edition2.pdf
ISPE Nordic PAT COP 2009.03.25
Winner of the ISPE awardCompany of the Year 2008
FDA PAT Guidance
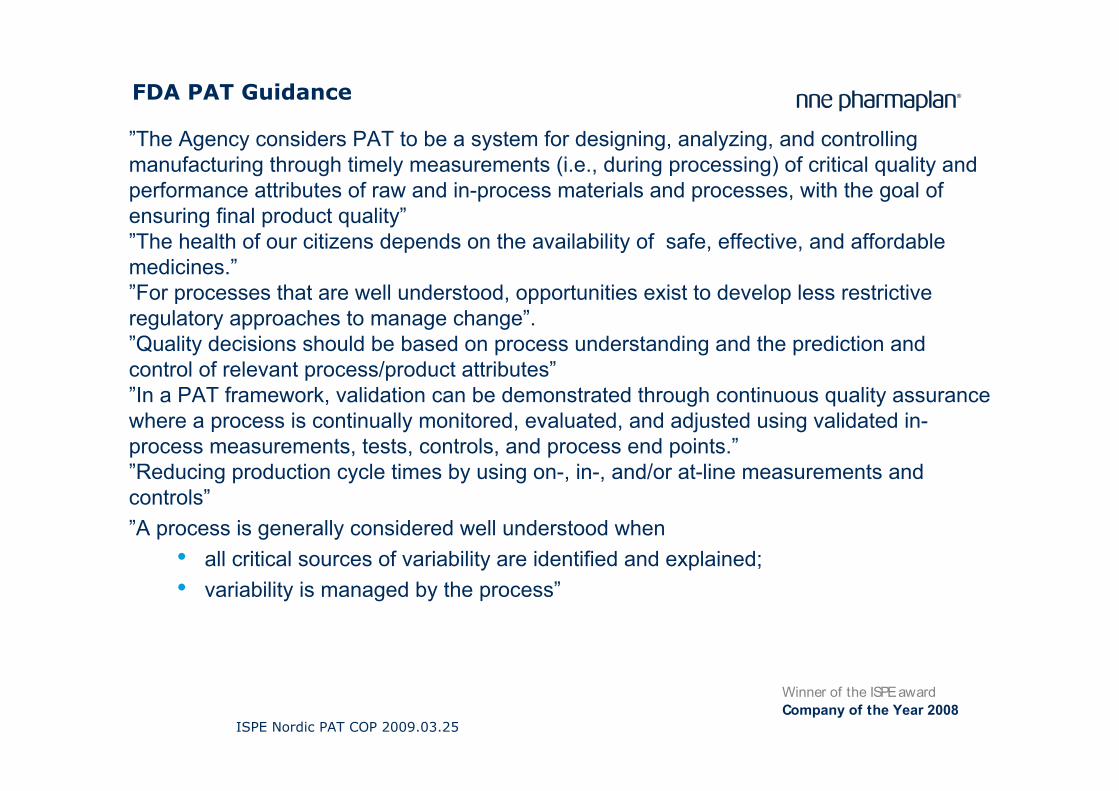
”The Agency considers PAT to be a system for designing, analyzing, and controlling manufacturing through timely measurements (i.e., during processing) of critical quality and performance attributes of raw and in-process materials and processes, with the goal of ensuring final product quality””The health of our citizens depends on the availability of safe, effective, and affordable medicines.””For processes that are well understood, opportunities exist to develop less restrictive regulatory approaches to manage change”.”Quality decisions should be based on process understanding and the prediction and control of relevant process/product attributes””In a PAT framework, validation can be demonstrated through continuous quality assurance where a process is continually monitored, evaluated, and adjusted using validated in-process measurements, tests, controls, and process end points.””Reducing production cycle times by using on-, in-, and/or at-line measurements and controls””A process is generally considered well understood when
• all critical sources of variability are identified and explained;• variability is managed by the process”
ISPE Nordic PAT COP 2009.03.25
Winner of the ISPE awardCompany of the Year 2008
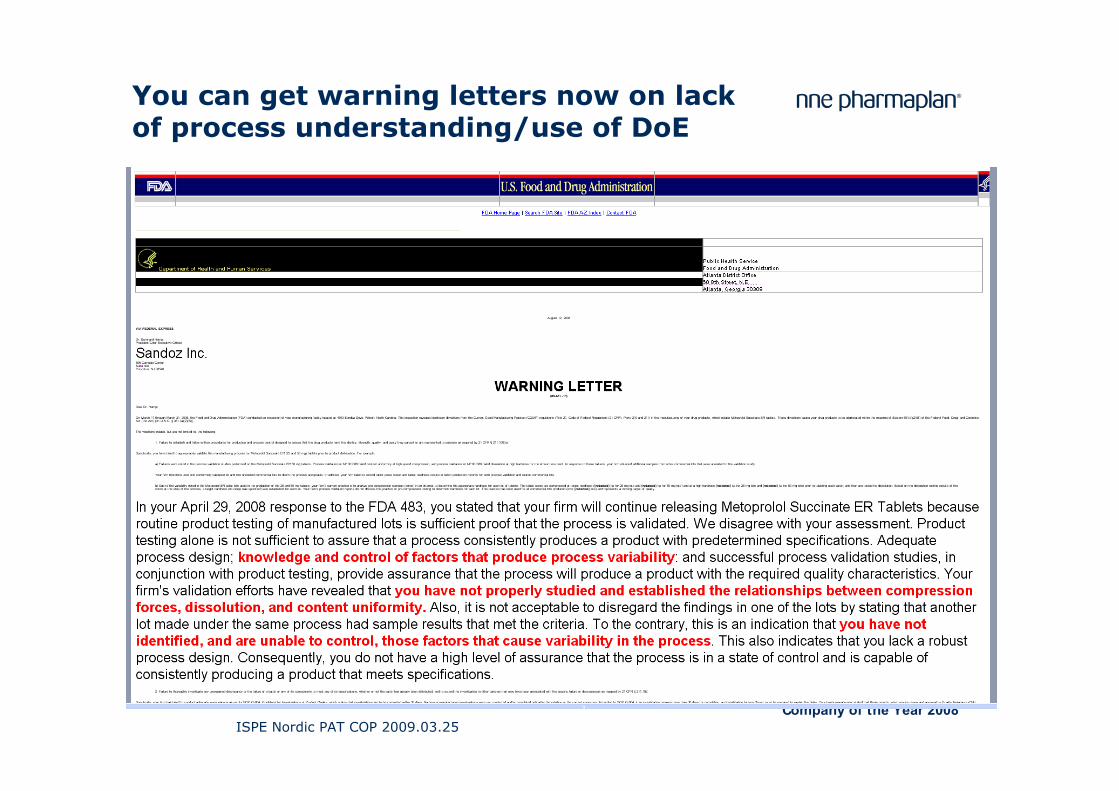
You can get warning letters now on lack of process understanding/use of DoE
ISPE Nordic PAT COP 2009.03.25
Winner of the ISPE awardCompany of the Year 2008
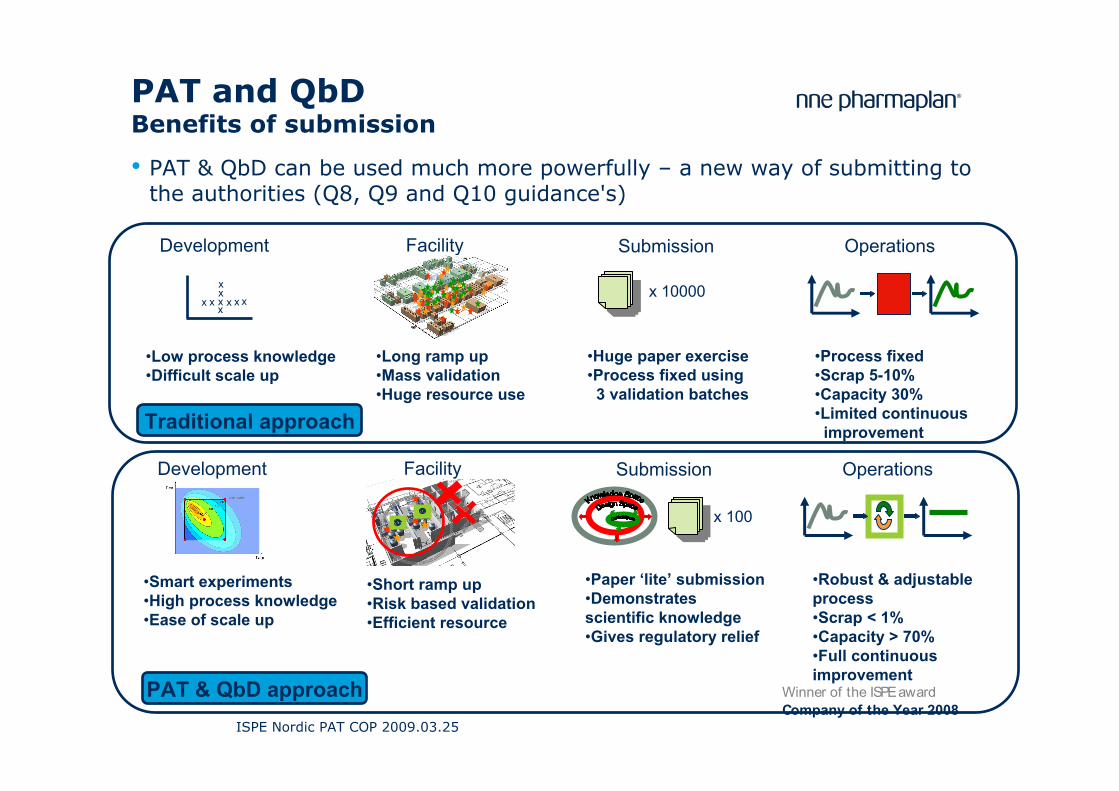
PAT and QbDBenefits of submission
• PAT & QbD can be used much more powerfully – a new way of submitting to the authorities (Q8, Q9 and Q10 guidance's)
Development Facility Submission Operations
xx
xxxx
x x x
•Low process knowledge•Difficult scale up
•Long ramp up•Mass validation•Huge resource use
•Huge paper exercise•Process fixed using
3 validation batches
x 10000
•Process fixed•Scrap 5-10%•Capacity 30%•Limited continuous
improvement
Development Facility Submission Operations
•Smart experiments•High process knowledge•Ease of scale up
•Short ramp up•Risk based validation•Efficient resource
•Paper ‘lite’ submission•Demonstrates scientific knowledge•Gives regulatory relief
x 100
•Robust & adjustable process•Scrap < 1%•Capacity > 70%•Full continuous improvement
Traditional approach
PAT & QbD approach

ISPE Nordic PAT COP 2009.03.25
Winner of the ISPE awardCompany of the Year 2008
Agenda
••• Why DoE? Reduce Cost of Poor QualityWhy DoE? Reduce Cost of Poor QualityWhy DoE? Reduce Cost of Poor Quality
••• Health Authority viewHealth Authority viewHealth Authority view• Case 1: Ultrasonic welding• Case 2: Foam coating• Case 3: Injection moulding• Conclusions
ISPE Nordic PAT COP 2009.03.25
Winner of the ISPE awardCompany of the Year 2008
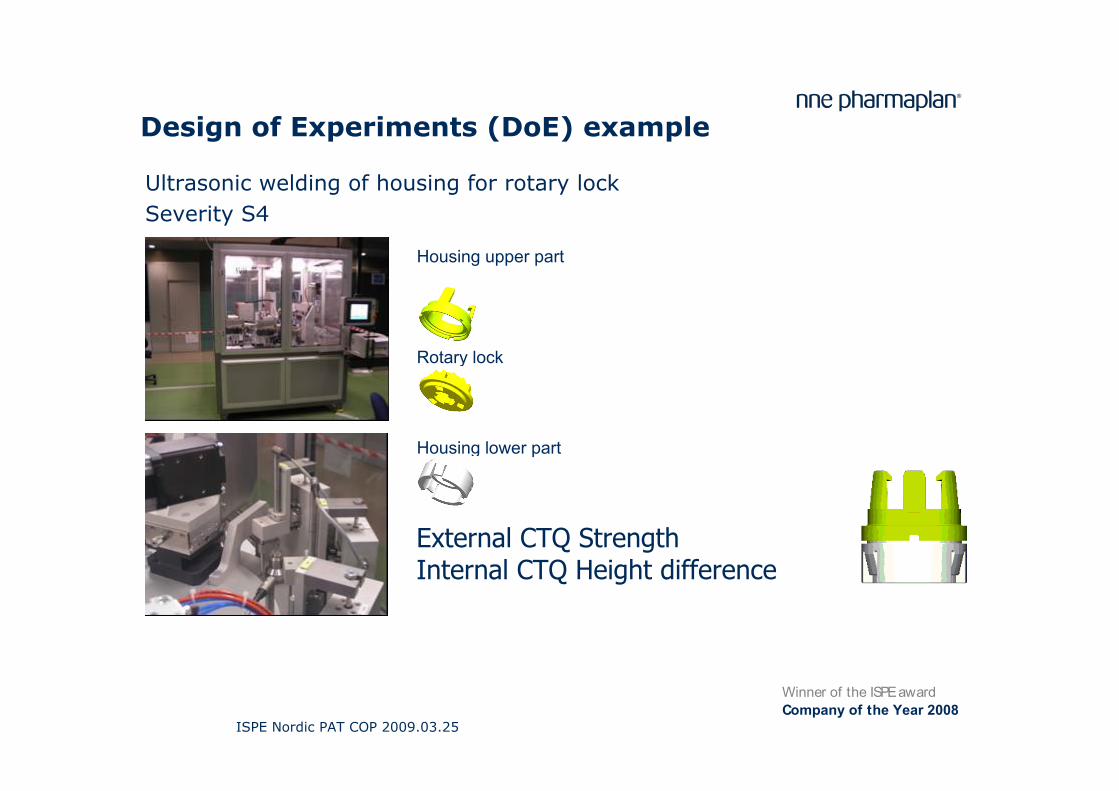
Design of Experiments (DoE) example
Ultrasonic welding of housing for rotary lockSeverity S4
Housing upper part
Rotary lock
Housing lower part
External CTQ StrengthInternal CTQ Height difference
ISPE Nordic PAT COP 2009.03.25
Winner of the ISPE awardCompany of the Year 2008
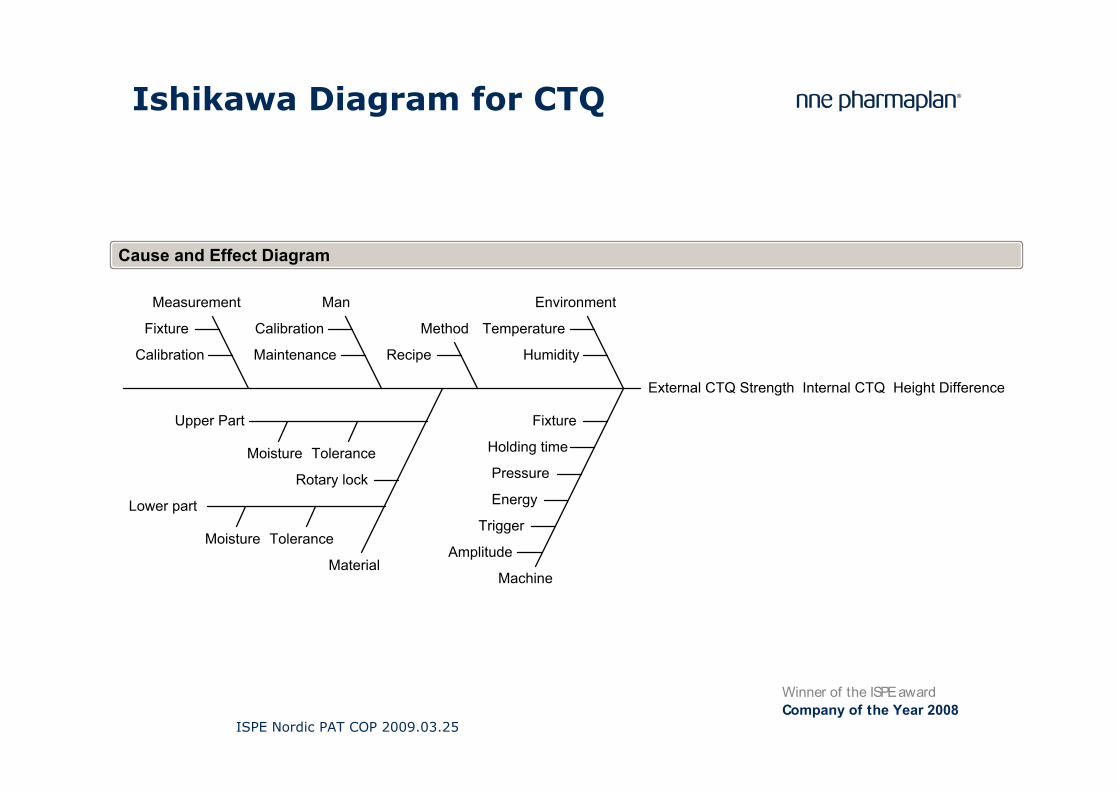
Ishikawa Diagram for CTQ
External CTQ Strength Internal CTQ Height Difference
Environment
Humidity
TemperatureMethod
Recipe
Machine
Fixture
Holding time
Pressure
Energy
Trigger
AmplitudeMaterial
Upper Part
ToleranceMoisture
Rotary lock
Lower part
ToleranceMoisture
Man
Maintenance
Calibration
Measurement
Calibration
Fixture
Cause and Effect Diagram
ISPE Nordic PAT COP 2009.03.25
Winner of the ISPE awardCompany of the Year 2008
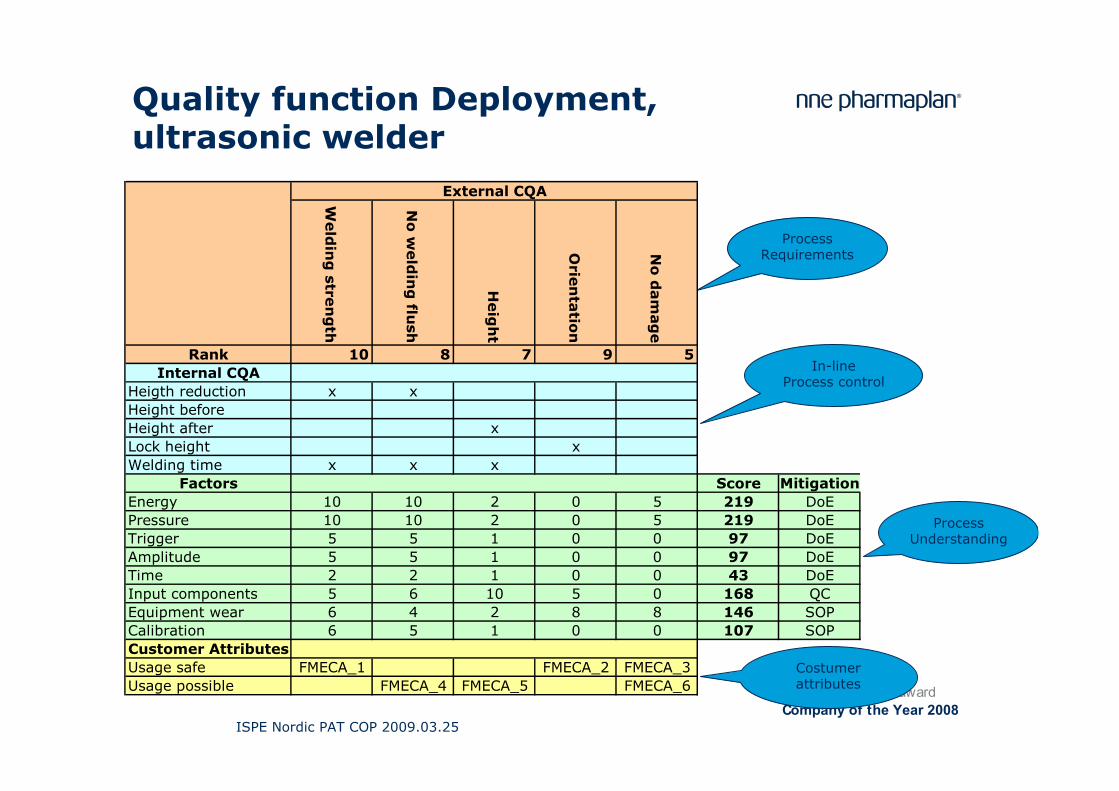
Quality function Deployment, ultrasonic welder
Costumerattributes
ProcessUnderstanding
In-lineProcess control
Process Requirements
Weld
ing
stren
gth
No
weld
ing
flush
Heig
ht
Orie
nta
tion
No
dam
ag
e
Rank 10 8 7 9 5Internal CQA
Heigth reduction x xHeight beforeHeight after xLock height xWelding time x x x
Factors Score MitigationEnergy 10 10 2 0 5 219 DoEPressure 10 10 2 0 5 219 DoETrigger 5 5 1 0 0 97 DoEAmplitude 5 5 1 0 0 97 DoETime 2 2 1 0 0 43 DoEInput components 5 6 10 5 0 168 QCEquipment wear 6 4 2 8 8 146 SOPCalibration 6 5 1 0 0 107 SOPCustomer AttributesUsage safe FMECA_1 FMECA_2 FMECA_3Usage possible FMECA_4 FMECA_5 FMECA_6
External CQA
ISPE Nordic PAT COP 2009.03.25
Winner of the ISPE awardCompany of the Year 2008
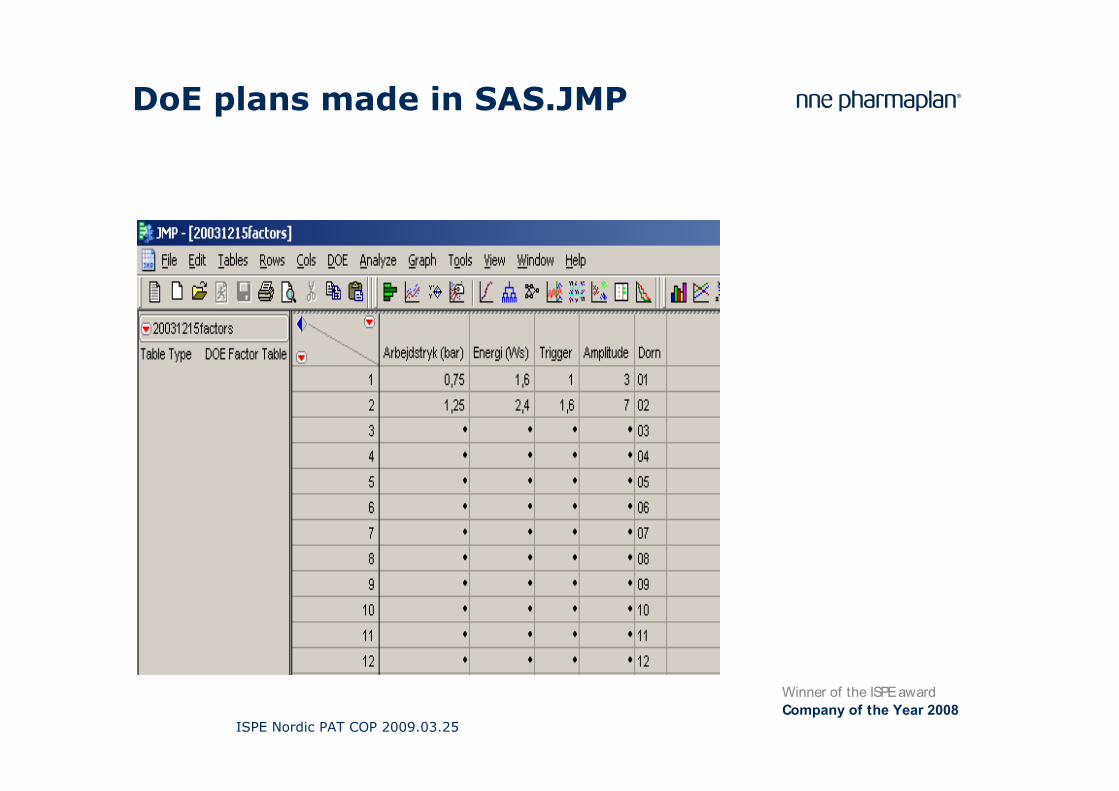
DoE plans made in SAS.JMP
ISPE Nordic PAT COP 2009.03.25
Winner of the ISPE awardCompany of the Year 2008
-0,35
-0,3
-0,25
-0,2
-0,15
-0,1
-0,05
0
0,05
Høj
de d
iffer
ens
Act
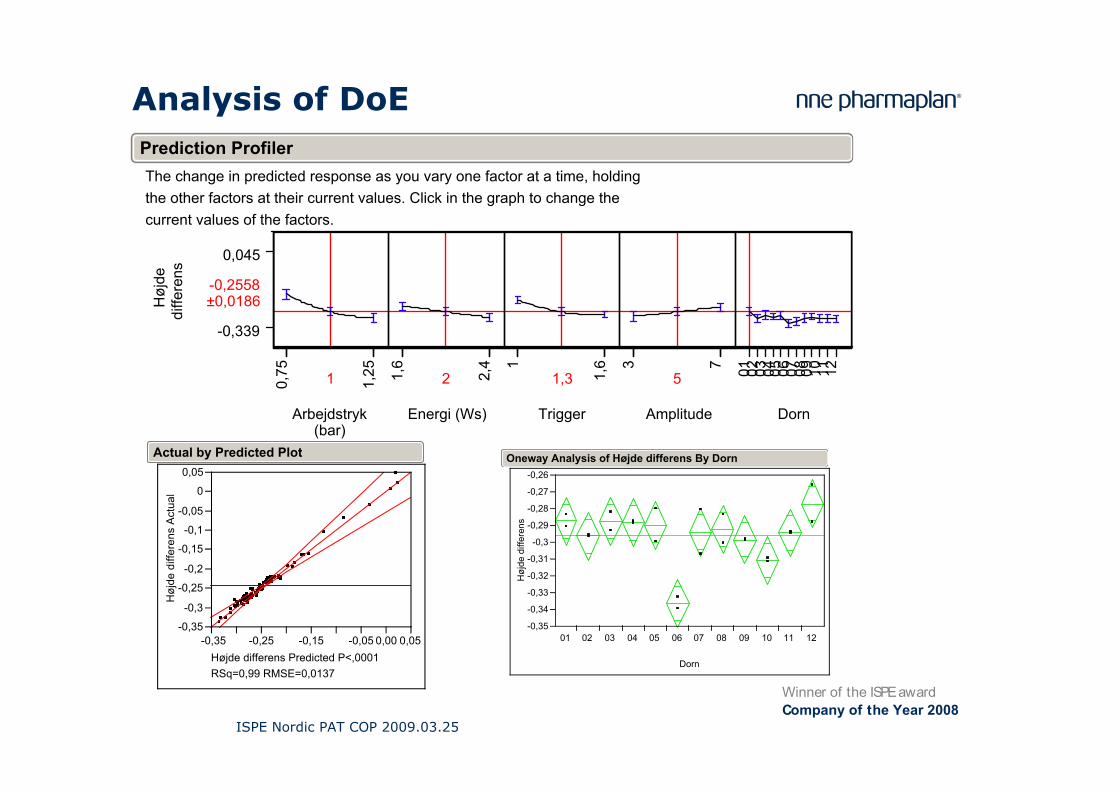
ual
-0,35 -0,25 -0,15 -0,05 0,00 0,05Højde differens Predicted P<,0001RSq=0,99 RMSE=0,0137
Actual by Predicted Plot
The change in predicted response as you vary one factor at a time, holdingthe other factors at their current values. Click in the graph to change thecurrent values of the factors.
Høj
dedi
ffere
ns
0,045
-0,339
-0,2558±0,0186
Arbejdstryk(bar)
0,75
1,251
Energi (Ws)1,
6
2,4
2
Trigger
1
1,6
1,3
Amplitude
3 7
5
Dorn
01 02 03 04 05 06 07 08 09 10 11 12
Prediction Profiler
Høj
de d
iffer
ens
-0,35
-0,34
-0,33
-0,32
-0,31
-0,3
-0,29
-0,28
-0,27
-0,26
01 02 03 04 05 06 07 08 09 10 11 12
Dorn
Oneway Analysis of Højde differens By Dorn
Analysis of DoE
ISPE Nordic PAT COP 2009.03.25
Winner of the ISPE awardCompany of the Year 2008
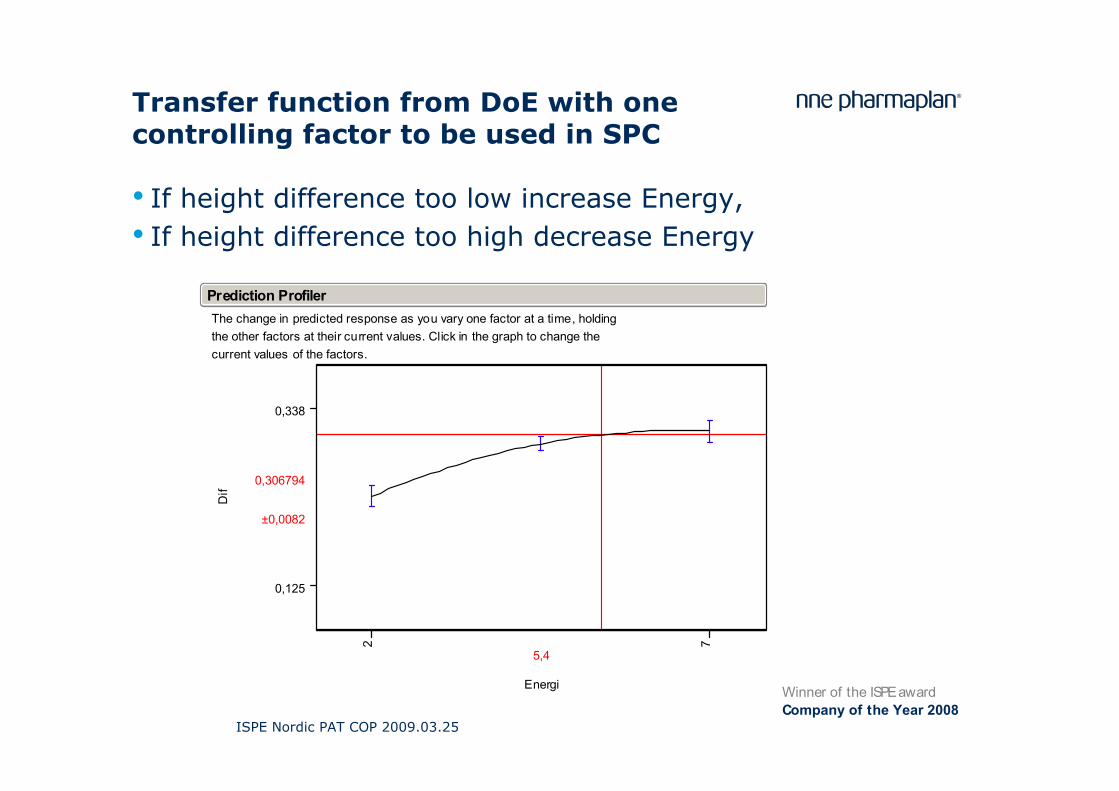
Transfer function from DoE with one controlling factor to be used in SPC
• If height difference too low increase Energy, • If height difference too high decrease Energy
The change in predicted response as you vary one factor at a time, holdingthe other factors at their current values. Click in the graph to change thecurrent values of the factors.
Dif
0,338
0,125
0,306794
±0,0082
Energi
2 7
5,4
Prediction Profiler
ISPE Nordic PAT COP 2009.03.25
Winner of the ISPE awardCompany of the Year 2008
0
50
100
150
200
250
300
Aftr
ækn
ings
kraf
t
-0,35 -0,3 -0,25 -0,2 -0,15 -0,1 -0,05 0 0,05Højde differens
Polynomial Fit Degree=2
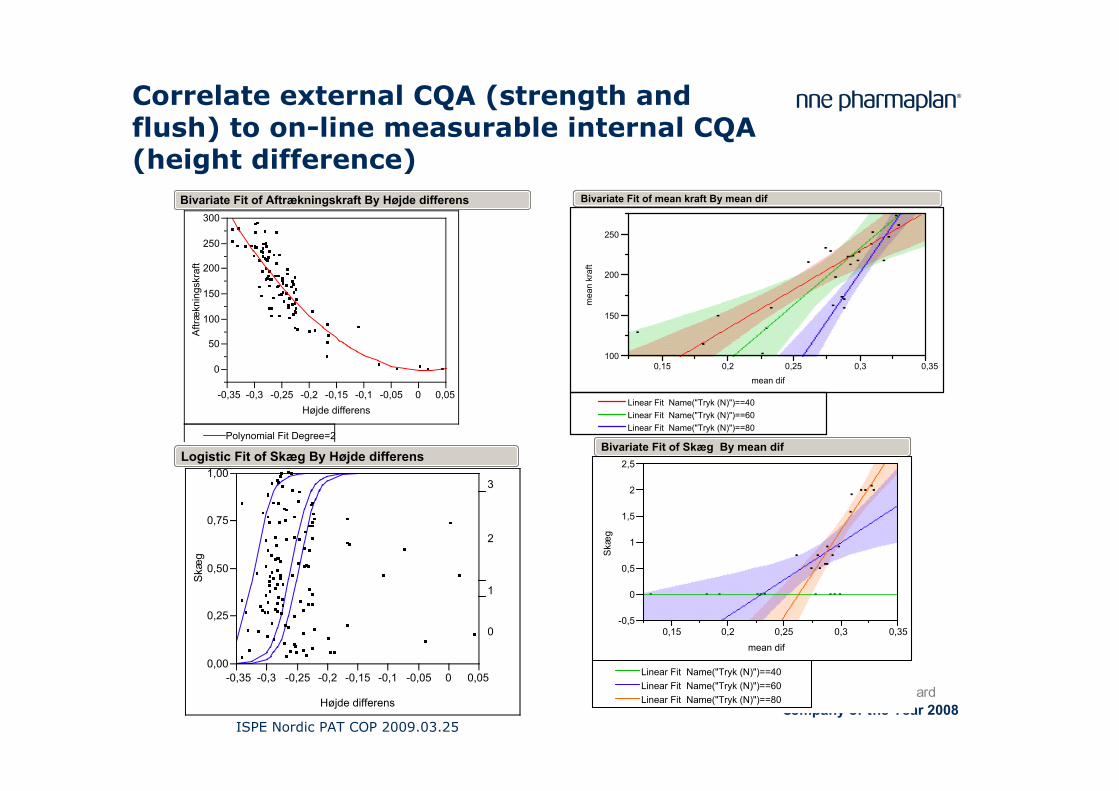
Bivariate Fit of Aftrækningskraft By Højde differensS
kæg
0,00
0,25
0,50
0,75
1,00
-0,35 -0,3 -0,25 -0,2 -0,15 -0,1 -0,05 0 0,05
Højde differens
0
1
2
3
Logistic Fit of Skæg By Højde differens
100
150
200
250
mea
n kr
aft
0,15 0,2 0,25 0,3 0,35mean dif
Linear Fit Name("Tryk (N)")==40Linear Fit Name("Tryk (N)")==60Linear Fit Name("Tryk (N)")==80
Bivariate Fit of mean kraft By mean dif
-0,5
0
0,5
1
1,5
2
2,5
Skæ
g
0,15 0,2 0,25 0,3 0,35mean dif
Linear Fit Name("Tryk (N)")==40Linear Fit Name("Tryk (N)")==60Linear Fit Name("Tryk (N)")==80
Bivariate Fit of Skæg By mean dif
Correlate external CQA (strength and flush) to on-line measurable internal CQA (height difference)
ISPE Nordic PAT COP 2009.03.25
Winner of the ISPE awardCompany of the Year 2008
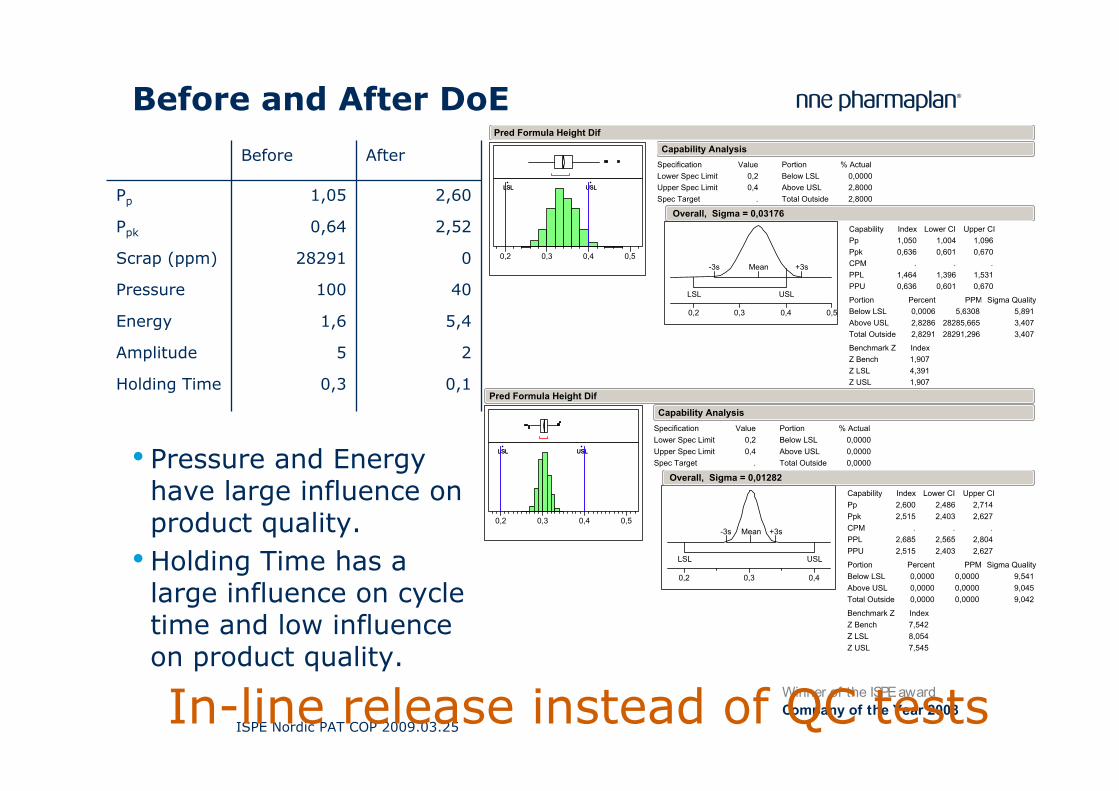
Before and After DoE
LSL USLLSL USL
0,2 0,3 0,4 0,5
Lower Spec LimitUpper Spec LimitSpec Target
Specification0,20,4
.
Value Below LSLAbove USLTotal Outside
Portion0,00002,80002,8000
% Actual
LSL USL
-3s +3sMean
0,2 0,3 0,4 0,5
PpPpkCPMPPLPPU
Capability1,0500,636
.1,4640,636
Index1,0040,601
.1,3960,601
Lower CI1,0960,670
.1,5310,670
Upper CI
Below LSLAbove USLTotal Outside
Portion0,00062,82862,8291
Percent5,6308
28285,66528291,296
PPM5,8913,4073,407
Sigma Quality
Z BenchZ LSLZ USL
Benchmark Z1,9074,3911,907
Index
Overall, Sigma = 0,03176
Capability Analysis
Pred Formula Height Dif
LSL USLLSL USL
0,2 0,3 0,4 0,5
Lower Spec LimitUpper Spec LimitSpec Target
Specification0,20,4
.
Value Below LSLAbove USLTotal Outside
Portion0,00000,00000,0000
% Actual
LSL USL
-3s +3sMean
0,2 0,3 0,4
PpPpkCPMPPLPPU
Capability2,6002,515
.2,6852,515
Index2,4862,403
.2,5652,403
Lower CI2,7142,627
.2,8042,627
Upper CI
Below LSLAbove USLTotal Outside
Portion0,00000,00000,0000
Percent0,00000,00000,0000
PPM9,5419,0459,042
Sigma Quality
Z BenchZ LSLZ USL
Benchmark Z7,5428,0547,545
Index
Overall, Sigma = 0,01282
Capability Analysis
Pred Formula Height Dif
25Amplitude
0,10,3Holding Time
5,41,6Energy
40100Pressure
028291Scrap (ppm)
2,520,64Ppk
2,601,05Pp
AfterBefore
In-line release instead of QC tests
• Pressure and Energy have large influence on product quality.
• Holding Time has a large influence on cycle time and low influence on product quality.
ISPE Nordic PAT COP 2009.03.25
Winner of the ISPE awardCompany of the Year 2008
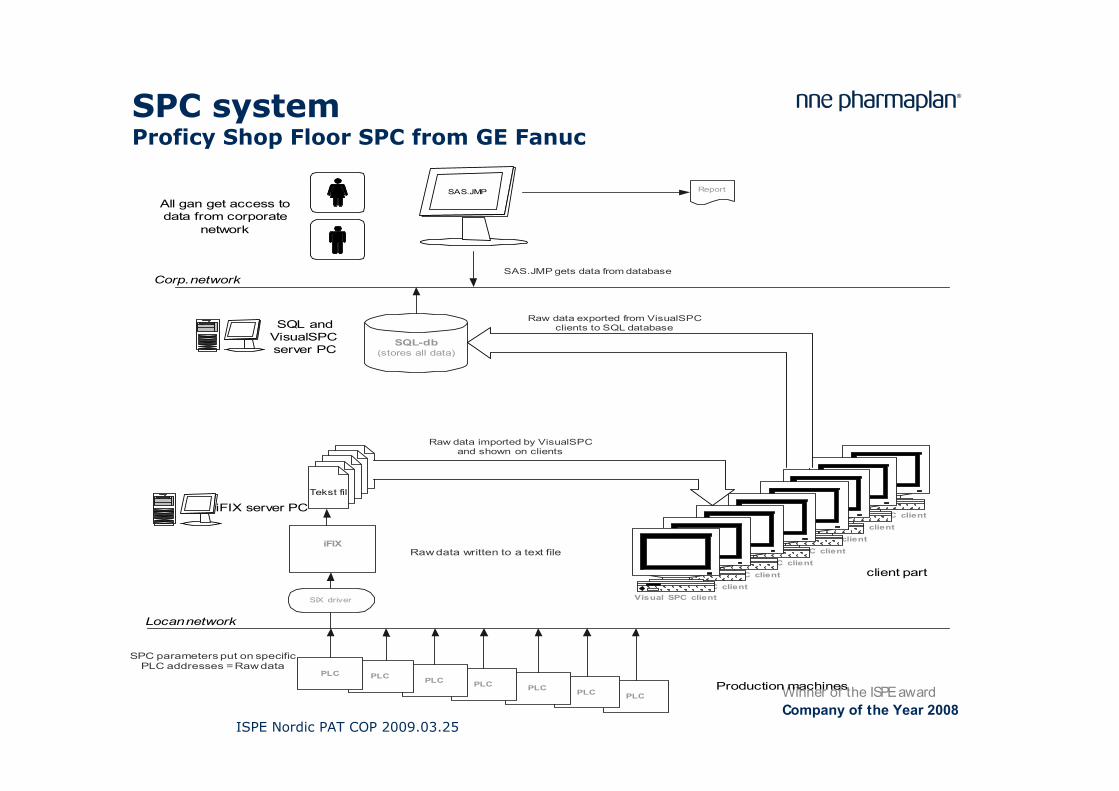
SPC system Proficy Shop Floor SPC from GE Fanuc
SQL-db(stores all data)
iFIX
Tekst fil
Report
SPC parameters put on specificPLC addresses = Raw data
Raw data imported by VisualSPCand shown on clients
Raw data exported from VisualSPCclients to SQL database
SAS.JMP gets data from database
PLCPLCPLCPLCPLCPLC
Visual SPC client
Visual SPC clientVisual SPC client
Visual SPC clientVisual SPC client
Visual SPC clientVisual SPC client
PLC
All gan get access todata from corporate
network
iFIX server PC
Production machines
SIX driver Visual SPC client
client part
Locan network
Corp. network
SQL andVisualSPCserver PC
SAS.JMP
Raw data written to a text file
ISPE Nordic PAT COP 2009.03.25
Winner of the ISPE awardCompany of the Year 2008
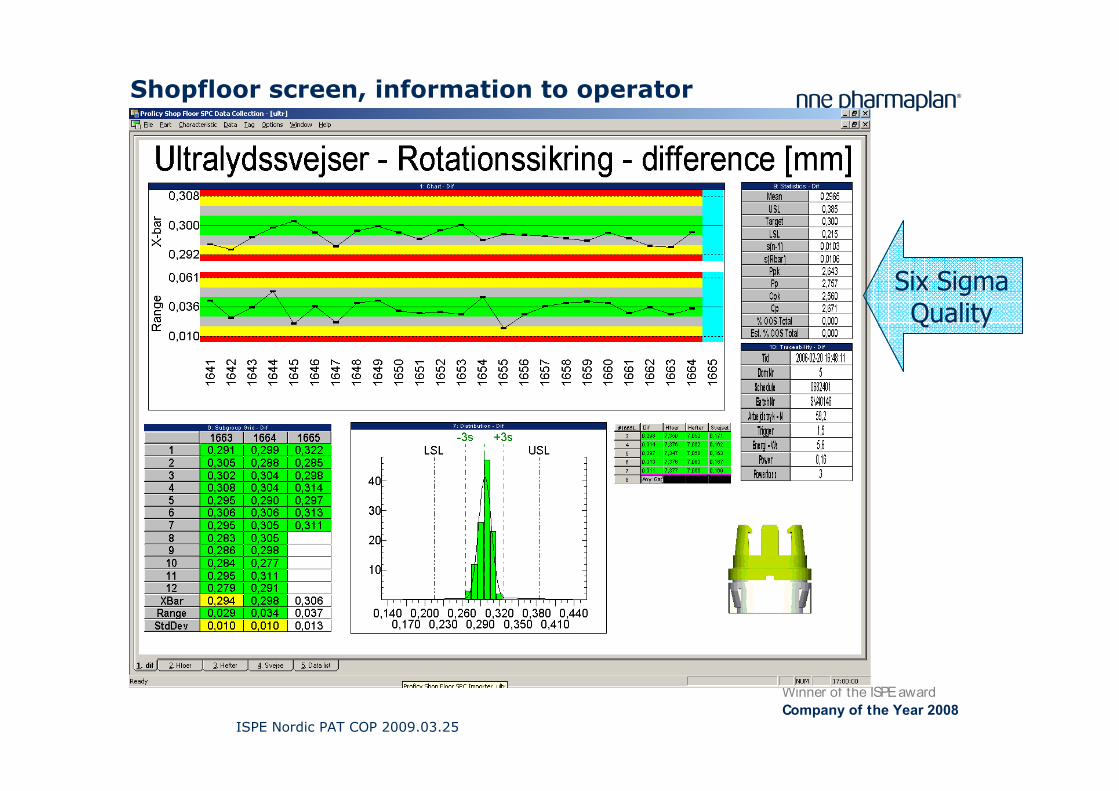
Shopfloor screen, information to operator
Six SigmaQuality
ISPE Nordic PAT COP 2009.03.25
Winner of the ISPE awardCompany of the Year 2008
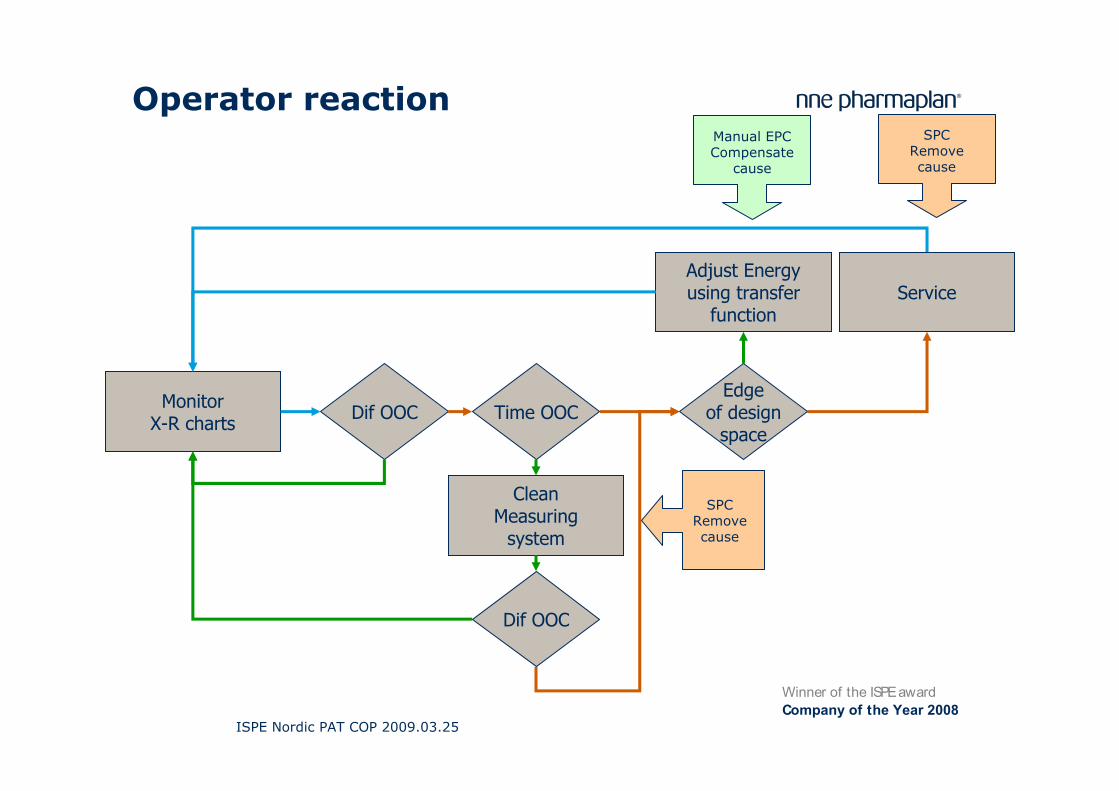
Operator reaction
MonitorX-R charts Dif OOC Time OOC
CleanMeasuring
system
Dif OOC
Edgeof design
space
ServiceAdjust Energyusing transfer
function
Manual EPCCompensate
cause
SPCRemovecause
SPCRemovecause
ISPE Nordic PAT COP 2009.03.25
Winner of the ISPE awardCompany of the Year 2008
Agenda
••• Why DoE? Reduce Cost of Poor QualityWhy DoE? Reduce Cost of Poor QualityWhy DoE? Reduce Cost of Poor Quality
••• Health Authority viewHealth Authority viewHealth Authority view••• Case 1: Ultrasonic weldingCase 1: Ultrasonic weldingCase 1: Ultrasonic welding• Case 2: Foam coating• Case 3: Injection moulding• Conclusions
ISPE Nordic PAT COP 2009.03.25
Winner of the ISPE awardCompany of the Year 2008
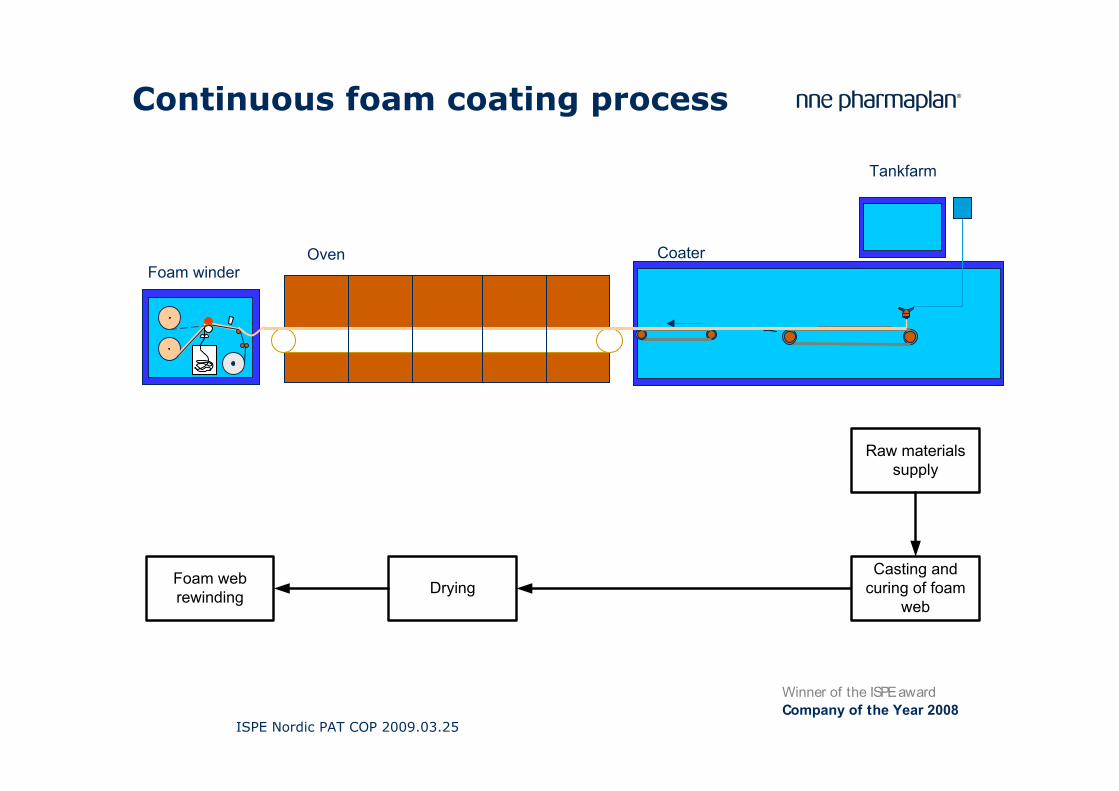
Continuous foam coating process
CoaterOvenFoam winder
Tankfarm
Foam webrewinding Drying
Casting andcuring of foam
web
Raw materialssupply
ISPE Nordic PAT COP 2009.03.25
Winner of the ISPE awardCompany of the Year 2008
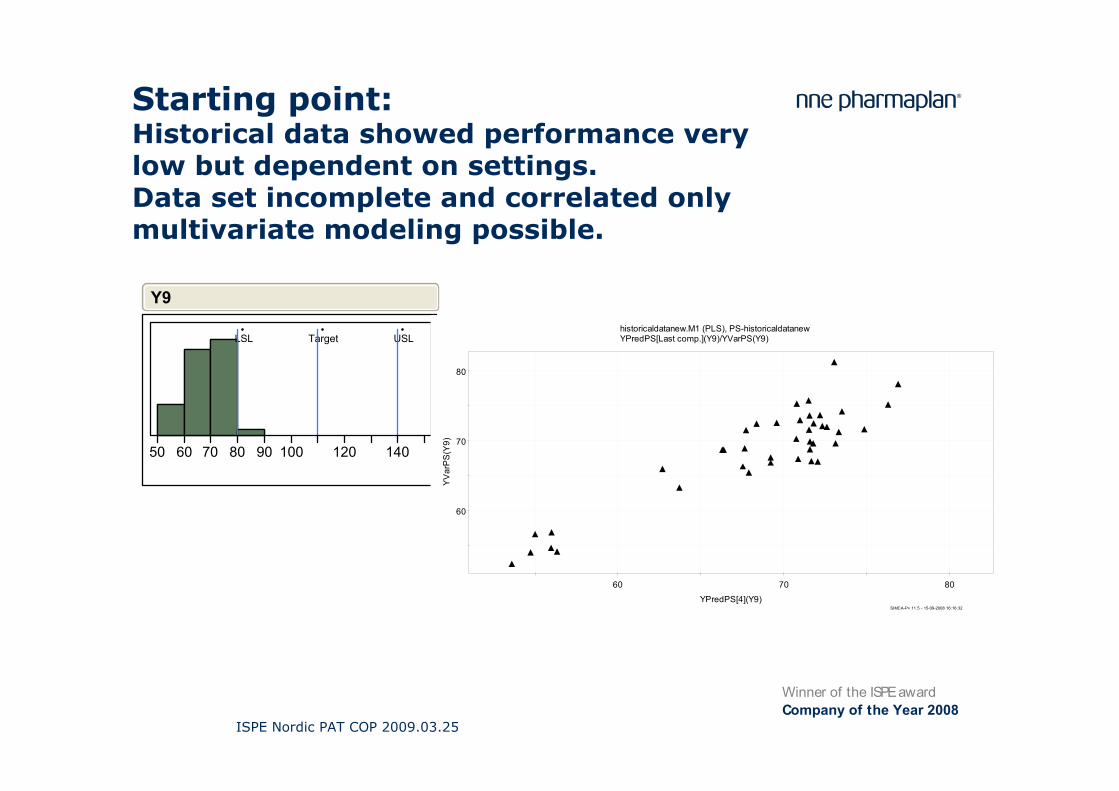
Starting point:Historical data showed performance very low but dependent on settings.Data set incomplete and correlated only multivariate modeling possible.
LSL USLTarget
50 60 70 80 90 100 120 140
Y9
60
70
80
60 70 80
YV
arP
S(Y
9)
YPredPS[4](Y9)
historicaldatanew.M1 (PLS), PS-historicaldatanewYPredPS[Last comp.](Y9)/YVarPS(Y9)
SIMCA-P+ 11.5 - 15-09-2008 16:16:32
ISPE Nordic PAT COP 2009.03.25
Winner of the ISPE awardCompany of the Year 2008
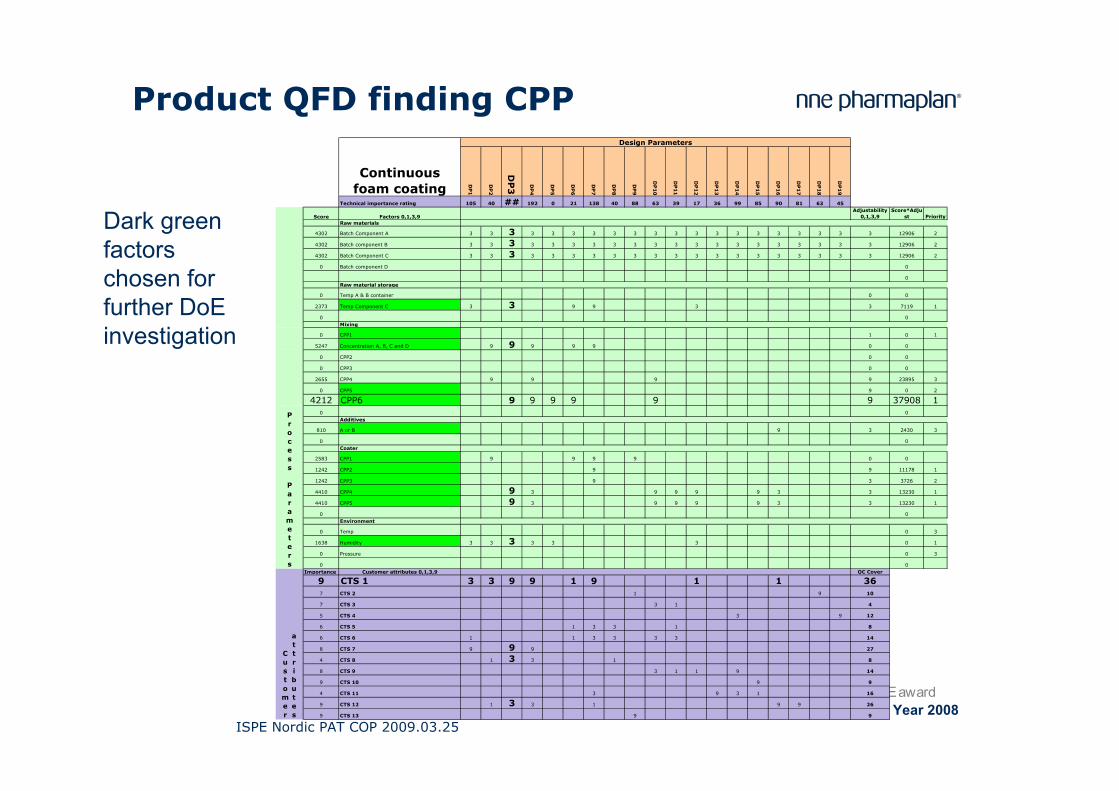
Product QFD finding CPP
Dark green factors chosen for further DoE investigation
DP
1
DP
2
DP
3 DP
4
DP
5
DP
6
DP
7
DP
8
DP
9
DP
10
DP
11
DP
12
DP
13
DP
14
DP
15
DP
16
DP
17
DP
18
DP
19
Technical importance rating 105 40 ## 192 0 21 138 40 88 63 39 17 36 99 85 90 81 63 45
Score Factors 0,1,3,9Adjustability
0,1,3,9Score*Adju
st PriorityRaw materials
4302 Batch Component A 3 3 3 3 3 3 3 3 3 3 3 3 3 3 3 3 3 3 3 3 12906 2
4302 Batch component B 3 3 3 3 3 3 3 3 3 3 3 3 3 3 3 3 3 3 3 3 12906 2
4302 Batch Component C 3 3 3 3 3 3 3 3 3 3 3 3 3 3 3 3 3 3 3 3 12906 2
0 Batch component D 0
0Raw material storage
0 Temp A & B container 0 0
2373 Temp Component C 3 3 9 9 3 3 7119 1
0 0Mixing
0 CPP1 1 0 1
5247 Concentration A, B, C and D 9 9 9 9 9 0 0
0 CPP2 0 0
0 CPP3 0 0
2655 CPP4 9 9 9 9 23895 3
0 CPP5 9 0 2
4212 CPP6 9 9 9 9 9 9 37908 10 0
Additives
810 A or B 9 3 2430 3
0 0Coater
2583 CPP1 9 9 9 9 0 0
1242 CPP2 9 9 11178 1
1242 CPP3 9 3 3726 2
4410 CPP4 9 3 9 9 9 9 3 3 13230 1
4410 CPP5 9 3 9 9 9 9 3 3 13230 1
0 0Environment
0 Temp 0 3
1638 Humidity 3 3 3 3 3 3 0 1
0 Pressure 0 3
0 0Importance Customer attributes 0,1,3,9 QC Cover
9 CTS 1 3 3 9 9 1 9 1 1 367 CTS 2 1 9 10
7 CTS 3 3 1 4
5 CTS 4 3 9 12
6 CTS 5 1 3 3 1 8
6 CTS 6 1 1 3 3 3 3 14
8 CTS 7 9 9 9 27
4 CTS 8 1 3 3 1 8
8 CTS 9 3 1 1 9 14
9 CTS 10 9 9
4 CTS 11 3 9 3 1 16
9 CTS 12 1 3 3 1 9 9 26
9 CTS 13 9 9
Process Parameters
Customer
attributes
Continuous foam coating
Design Parameters
ISPE Nordic PAT COP 2009.03.25
Winner of the ISPE awardCompany of the Year 2008
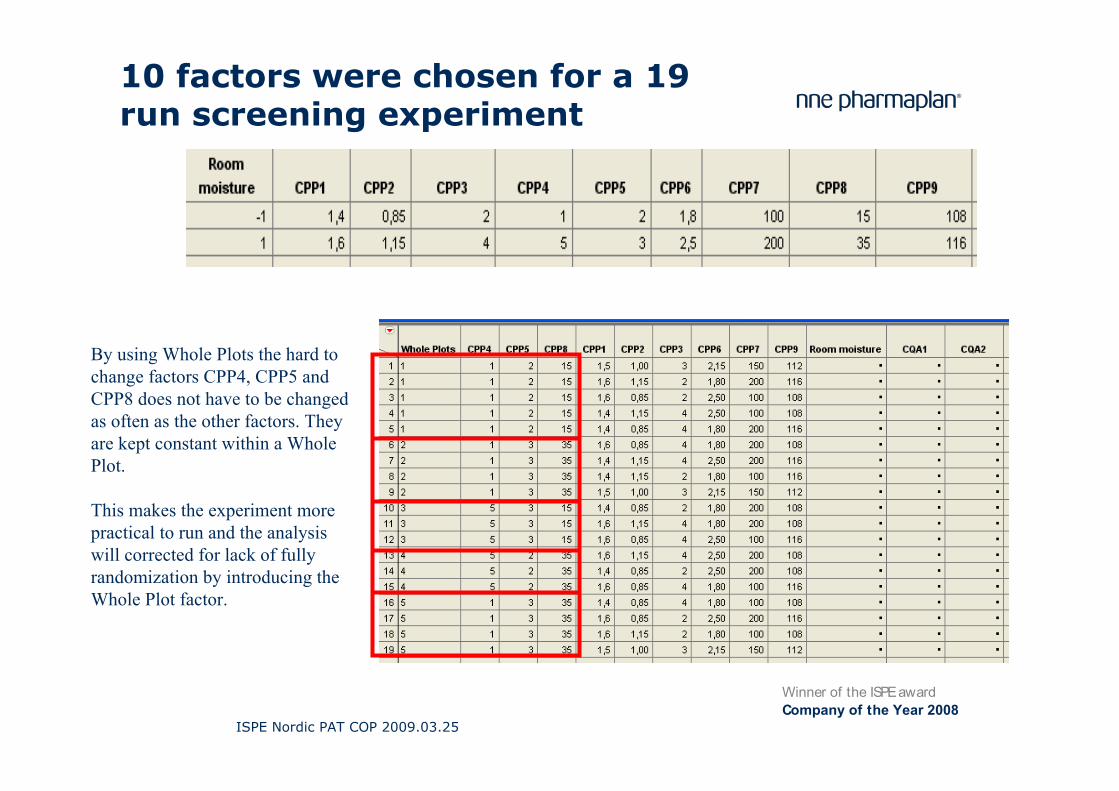
10 factors were chosen for a 19 run screening experiment
By using Whole Plots the hard to change factors CPP4, CPP5 and CPP8 does not have to be changed as often as the other factors. They are kept constant within a Whole Plot.
This makes the experiment more practical to run and the analysis will corrected for lack of fully randomization by introducing the Whole Plot factor.
ISPE Nordic PAT COP 2009.03.25
Winner of the ISPE awardCompany of the Year 2008
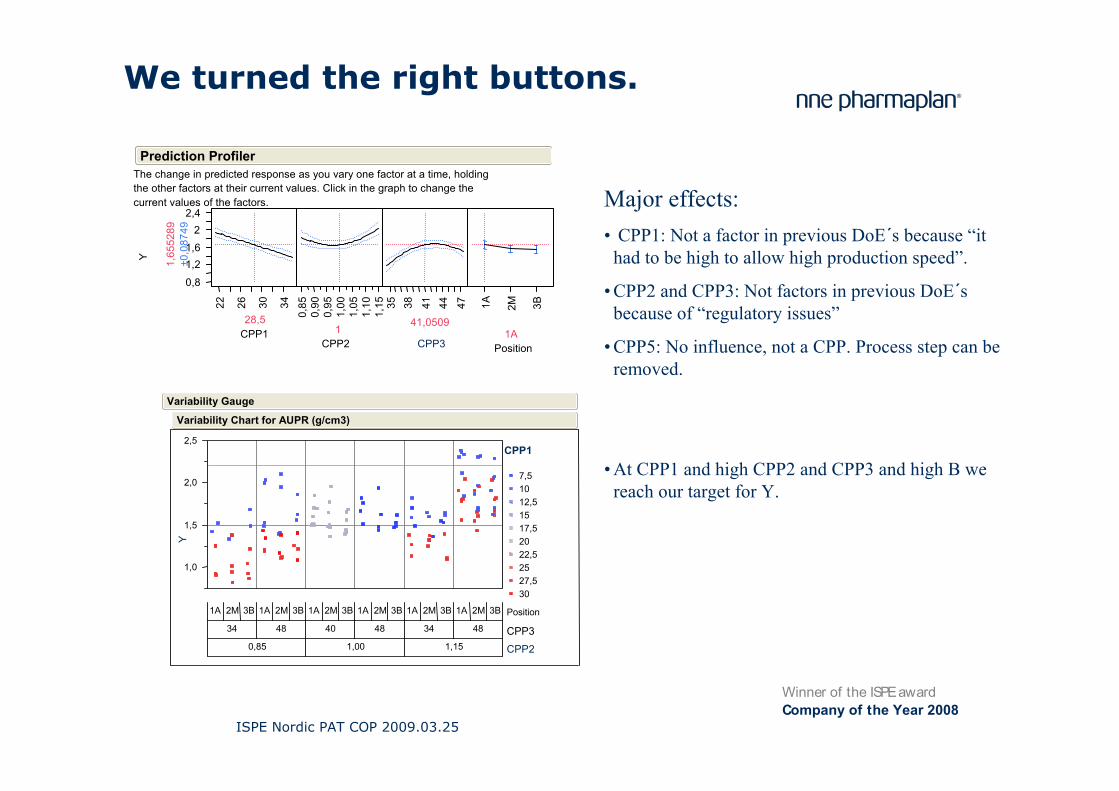
We turned the right buttons.
The change in predicted response as you vary one factor at a time, holdingthe other factors at their current values. Click in the graph to change thecurrent values of the factors.
0,8
1,21,6
22,4
Y 1,65
5289
±0,0
8749
22 26 30 34
28,5CPP1
0,85
0,90
0,95
1,00
1,05
1,10
1,15
1CPP2
35 38 41 44 47
41,0509
CPP3
1A 2M 3B
1APosition
Prediction Profiler
Y
1,0
1,5
2,0
2,5
7,51012,51517,52022,52527,530
CPP1
1A 2M 3B 1A 2M 3B 1A 2M 3B 1A 2M 3B 1A 2M 3B 1A 2M 3B Position
34 48 40 48 34 48 CPP30,85 1,00 1,15 CPP2
Variability Chart for AUPR (g/cm3)
Variability Gauge
Major effects: • CPP1: Not a factor in previous DoE´s because “it
had to be high to allow high production speed”.
• CPP2 and CPP3: Not factors in previous DoE´s because of “regulatory issues”
• CPP5: No influence, not a CPP. Process step can be removed.
• At CPP1 and high CPP2 and CPP3 and high B we reach our target for Y.
ISPE Nordic PAT COP 2009.03.25
Winner of the ISPE awardCompany of the Year 2008
1,4
1,6
1,8
2,0
2,2
2,4
2,6
2,8
3,0
Y
8 16 24 32 40 48 56 64 72 80 88 96
Sample
Avg=2,071
LCL=1,734
UCL=2,407
Individual Measurement of Y
,01
,05,10
,25
,50
,75
,90,95
,99
-3
-2
-1
0
1
2
3
Nor
mal
Qua
ntile
Plo
t
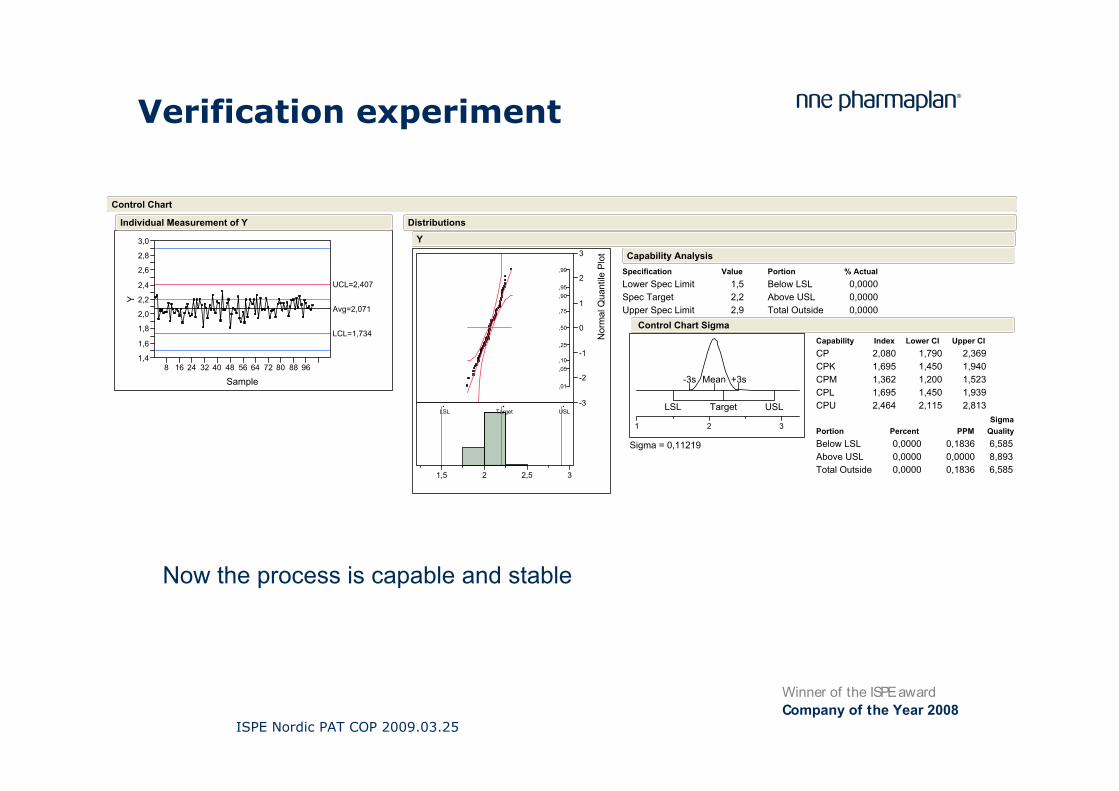
LSL USLTarget
1,5 2 2,5 3
Lower Spec LimitSpec TargetUpper Spec Limit
Specification1,52,22,9
Value Below LSLAbove USLTotal Outside
Portion0,00000,00000,0000
% Actual
LSL USLTarget
-3s +3sMean
1 2 3
Sigma = 0,11219
CPCPKCPMCPLCPU
Capability2,0801,6951,3621,6952,464
Index1,7901,4501,2001,4502,115
Lower CI2,3691,9401,5231,9392,813
Upper CI
Below LSLAbove USLTotal Outside
Portion0,00000,00000,0000
Percent0,18360,00000,1836
PPM6,5858,8936,585
SigmaQuality
Control Chart Sigma
Capability Analysis
Y
Distributions
Control Chart
Verification experiment
Now the process is capable and stable
ISPE Nordic PAT COP 2009.03.25
Winner of the ISPE awardCompany of the Year 2008
CToo High/Low Reduce/Increase CPP1 or Increase/Reduce CPP2
1,020
1,030
1,040
1,050
1,060
1,070
1,080
1,090
C
B
A
C
B
A 5 5
5
2008
-01-
23T0
7:58
2008
-01-
23T0
9:19
2008
-01-
23T0
9:55
2008
-01-
23T1
0:42
2008
-01-
23T1
1:29
2008
-01-
23T1
2:16
2008
-01-
23T1
3:01
2008
-01-
23T1
3:48
2008
-01-
23T1
4:36
TIME
µ0=1,05400
LCL=1,02650
UCL=1,08150
CQA =CTQ1 *CTQ2
Control ChartToo High/Low Reduce/Increase CPP1
0,270
0,275
0,280
0,285
C
B
A
C
B
A
65
5
2008
-01-
23T0
7:58
2008
-01-
23T0
9:19
2008
-01-
23T0
9:55
2008
-01-
23T1
0:42
2008
-01-
23T1
1:29
2008
-01-
23T1
2:16
2008
-01-
23T1
3:01
2008
-01-
23T1
3:48
2008
-01-
23T1
4:36
TIME
µ0=0,27943
LCL=0,27214
UCL=0,28672
CTQ1/CTQ3
Control ChartToo High/Low Reduce/Increase CPP3
-0,040
-0,030
-0,020-0,010
0,000
0,010
0,020
0,030
0,040
C
B
A
C
B
A
2008
-01-
23T0
7:58
2008
-01-
23T0
9:19
2008
-01-
23T0
9:55
2008
-01-
23T1
0:42
2008
-01-
23T1
1:29
2008
-01-
23T1
2:16
2008
-01-
23T1
3:01
2008
-01-
23T1
3:48
2008
-01-
23T1
4:36
TIME
µ0=0,00000
LCL=-0,03600
UCL=0,03600
CTQ1(M)-(CTQ1(A)+CTQ(B))/2
Control Chart
Too High/Low Increase/Reduce CPP4
2,0
3,0
4,0
5,0
6,0
CBA
CBA
1
6
6
2008
-01-
23T0
7:58
2008
-01-
23T0
9:19
2008
-01-
23T0
9:55
2008
-01-
23T1
0:42
2008
-01-
23T1
1:29
2008
-01-
23T1
2:16
2008
-01-
23T1
3:01
2008
-01-
23T1
3:48
2008
-01-
23T1
4:36
TIME
µ0=3,500
LCL=1,800
UCL=5,200
CTQ4
Control ChartToo High/Low Increase/Reduce CPP2
365
370
375
380
385
390
395
400
405
C
B
A
C
B
A
5 5 5
5 6 6
2008
-01-
23T0
7:58
2008
-01-
23T0
9:19
2008
-01-
23T0
9:55
2008
-01-
23T1
0:42
2008
-01-
23T1
1:29
2008
-01-
23T1
2:16
2008
-01-
23T1
3:01
2008
-01-
23T1
3:48
2008
-01-
23T1
4:36
TIME
µ0=385,00
LCL=370,00
UCL=400,00
CTQ3
Control Chart
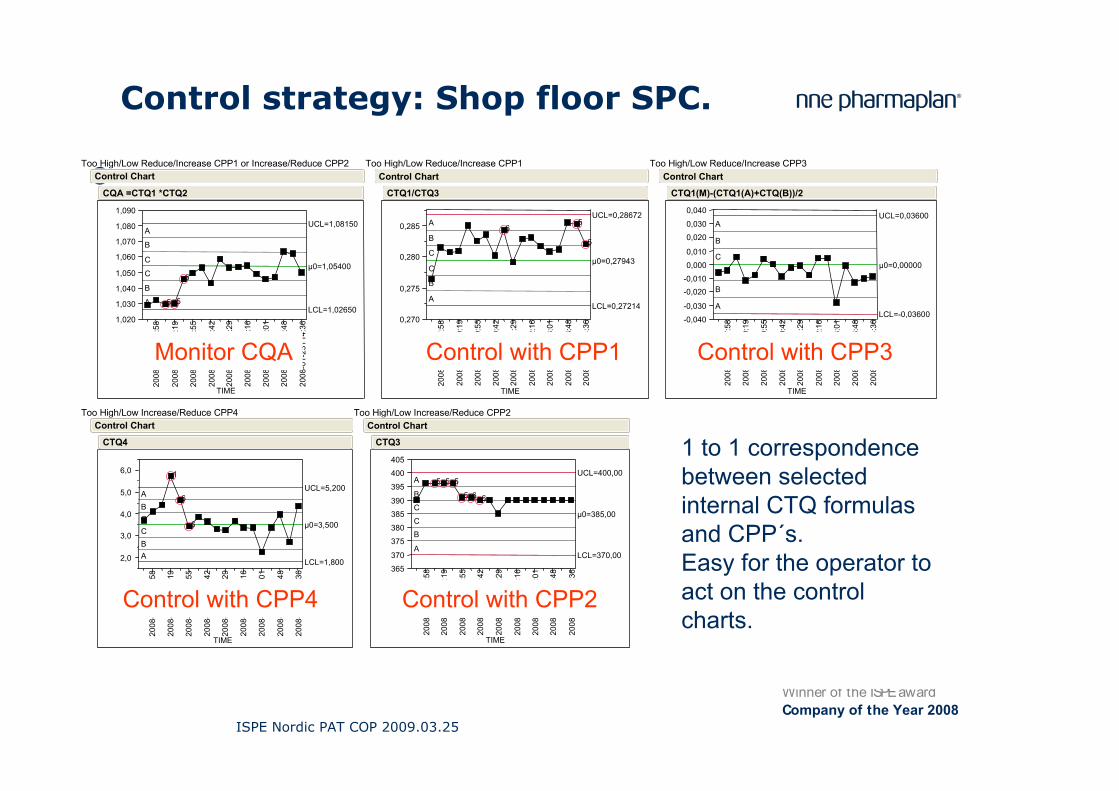
1 to 1 correspondence between selected internal CTQ formulas and CPP´s. Easy for the operator to act on the control charts.
Control strategy: Shop floor SPC.
Control with CPP1 Control with CPP3
Control with CPP4 Control with CPP2
Monitor CQA

ISPE Nordic PAT COP 2009.03.25
Winner of the ISPE awardCompany of the Year 2008
Agenda
••• Why DoE? Reduce Cost of Poor QualityWhy DoE? Reduce Cost of Poor QualityWhy DoE? Reduce Cost of Poor Quality
••• Health Authority viewHealth Authority viewHealth Authority view••• Case 1: Ultrasonic weldingCase 1: Ultrasonic weldingCase 1: Ultrasonic welding
••• Case 2: Foam coatingCase 2: Foam coatingCase 2: Foam coating• Case 3: Injection moulding• Conclusions
ISPE Nordic PAT COP 2009.03.25
Winner of the ISPE awardCompany of the Year 2008
Evolutionary Operations:keep Design Space updated
• Evolutionary Operation EVOP What is it? Introduced in the 1950s by George Box, EVOP is an ongoing mode of using an operating full-scale process, so that information on how to improve the process is generated from a simple experimental design while production is underway. To avoid appreciable changes in the characteristics of the product, only small changes are made in the levels of the process variables.
• Why is it important? Classic experimental design are methodologies which help us to establish an optimum combination of the design factors and their levels for the manufacturing process. They are very powerful tools; but they cost money, time, manpower. In most cases, they interrupt production.
• When to use it?The basic idea is to replace the static operation of a process by a continuous and systematic scheme of slight perturbations in the control variables. The effect of these perturbations is evaluated and the process is shifted in the direction of improvement.
ISPE Nordic PAT COP 2009.03.25
Winner of the ISPE awardCompany of the Year 2008
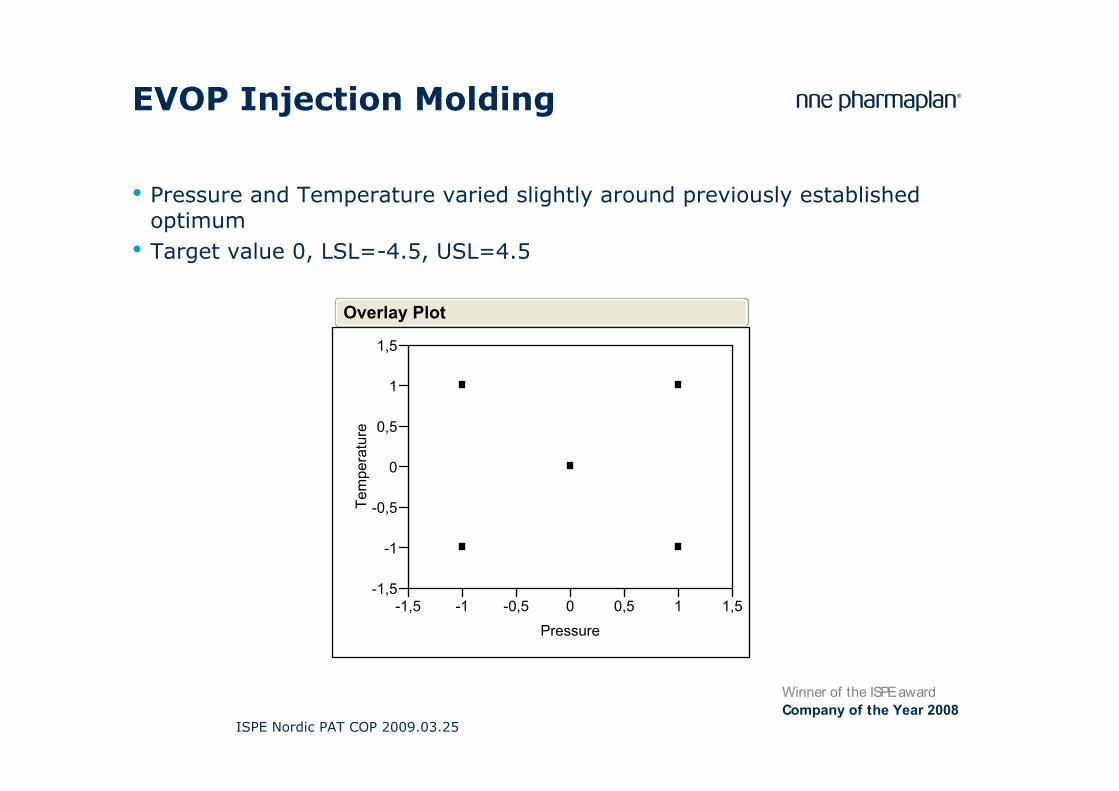
EVOP Injection Molding
• Pressure and Temperature varied slightly around previously established optimum
• Target value 0, LSL=-4.5, USL=4.5
-1,5
-1
-0,5
0
0,5
1
1,5Te
mpe
ratu
re
-1,5 -1 -0,5 0 0,5 1 1,5Pressure
Overlay Plot
ISPE Nordic PAT COP 2009.03.25
Winner of the ISPE awardCompany of the Year 2008
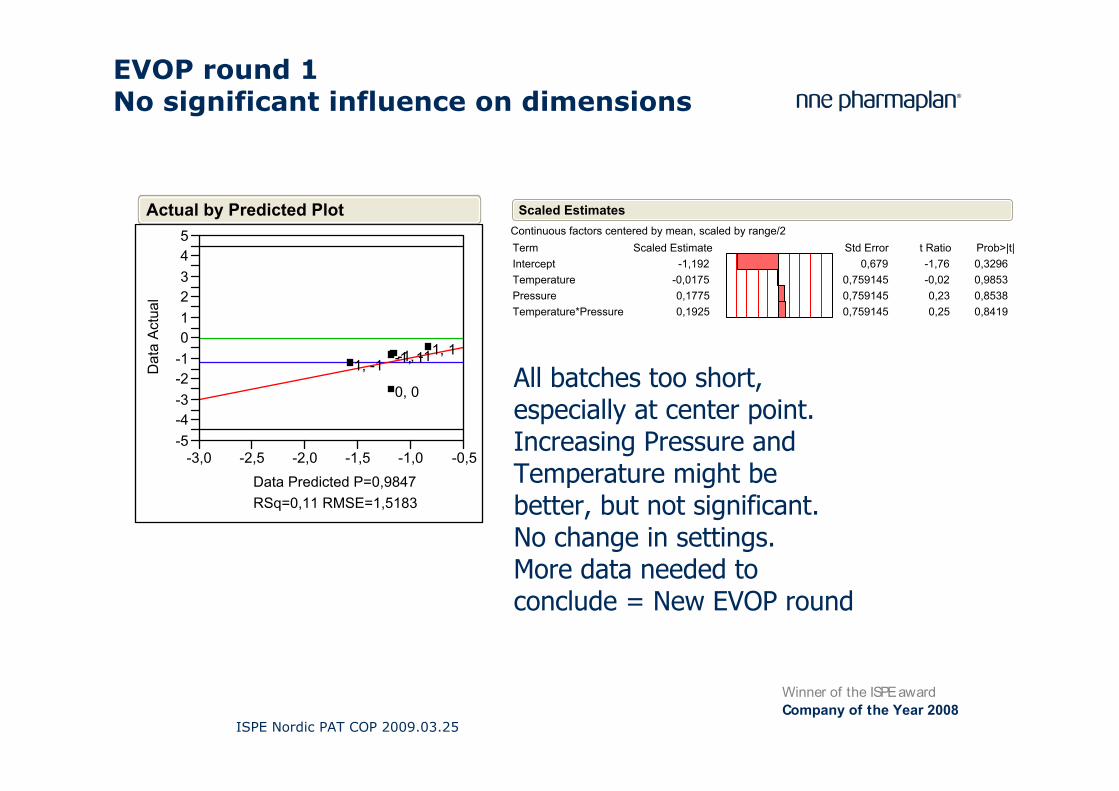
EVOP round 1No significant influence on dimensions
All batches too short, especially at center point.Increasing Pressure and Temperature might be better, but not significant.No change in settings.More data needed to conclude = New EVOP round
-5-4-3-2-1012345
Dat
a A
ctua
l
1, -1 -1, 1-1, -11, 1
0, 0
-3,0 -2,5 -2,0 -1,5 -1,0 -0,5Data Predicted P=0,9847RSq=0,11 RMSE=1,5183
Actual by Predicted PlotContinuous factors centered by mean, scaled by range/2
InterceptTemperaturePressureTemperature*Pressure
Term-1,192
-0,01750,17750,1925
Scaled Estimate0,679
0,7591450,7591450,759145
Std Error-1,76-0,020,230,25
t Ratio0,32960,98530,85380,8419
Prob>|t|
Scaled Estimates
ISPE Nordic PAT COP 2009.03.25
Winner of the ISPE awardCompany of the Year 2008
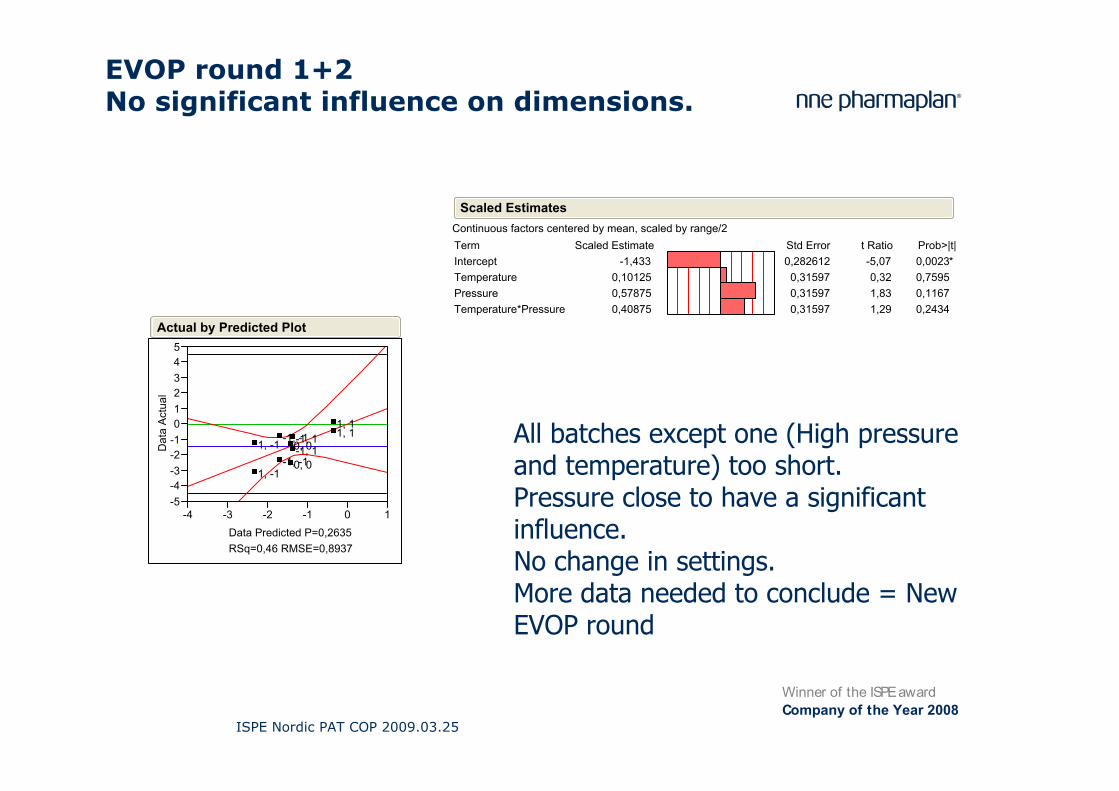
EVOP round 1+2No significant influence on dimensions.
All batches except one (High pressure and temperature) too short.Pressure close to have a significant influence.No change in settings.More data needed to conclude = New EVOP round
-5-4-3-2-1012345
Dat
a A
ctua
l
1, -1 -1, 1-1, -1 1, 1
0, 01, -1
-1, 1-1, -1
1, 1
0, 0
-4 -3 -2 -1 0 1Data Predicted P=0,2635RSq=0,46 RMSE=0,8937
Actual by Predicted Plot
Continuous factors centered by mean, scaled by range/2
InterceptTemperaturePressureTemperature*Pressure
Term-1,433
0,101250,578750,40875
Scaled Estimate0,2826120,315970,315970,31597
Std Error-5,070,321,831,29
t Ratio0,0023*0,75950,11670,2434
Prob>|t|
Scaled Estimates
ISPE Nordic PAT COP 2009.03.25
Winner of the ISPE awardCompany of the Year 2008
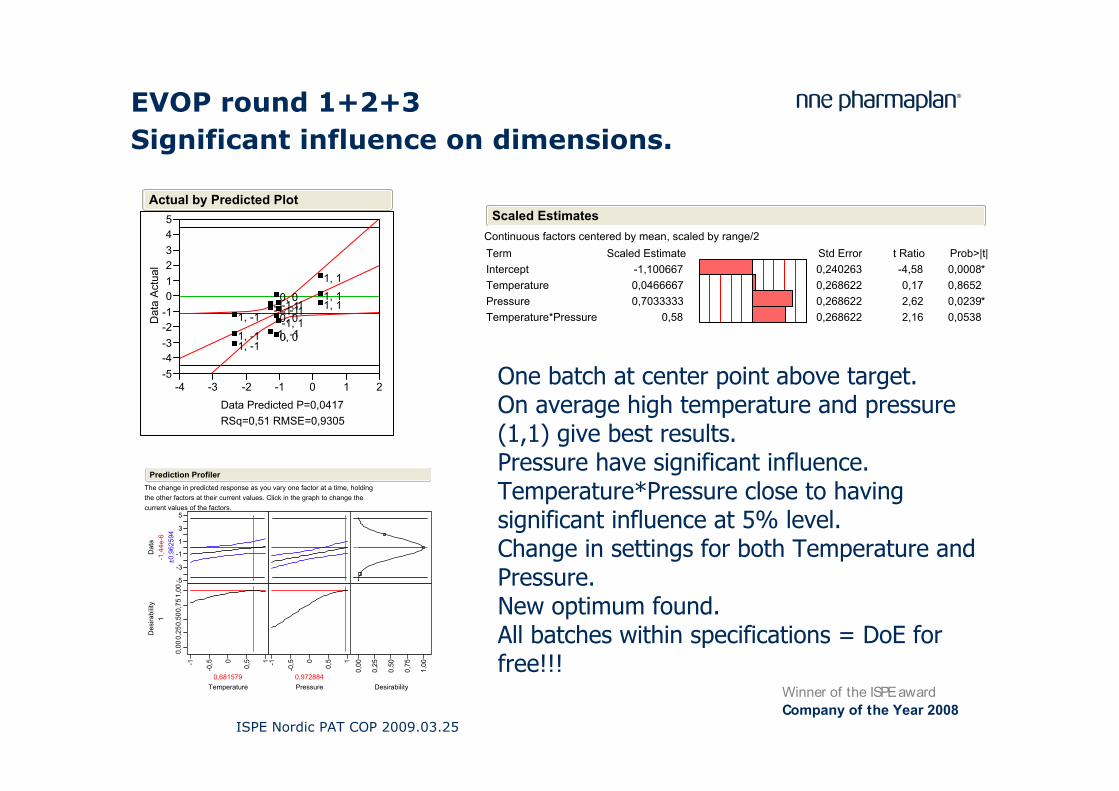
EVOP round 1+2+3 Significant influence on dimensions.
Continuous factors centered by mean, scaled by range/2
InterceptTemperaturePressureTemperature*Pressure
Term-1,1006670,04666670,7033333
0,58
Scaled Estimate0,2402630,2686220,2686220,268622
Std Error-4,580,172,622,16
t Ratio0,0008*0,86520,0239*0,0538
Prob>|t|
Scaled Estimates
The change in predicted response as you vary one factor at a time, holdingthe other factors at their current values. Click in the graph to change thecurrent values of the factors.
-5
-3
-1
1
3
5
Dat
a-1
,44e
-6±0
,962
594
0,00
0,25
0,50
0,75
1,00
Des
irabi
lity
1
-1
-0,5 0
0,5 1
0,681579Temperature
-1
-0,5 0
0,5 1
0,972884Pressure
0,00
0,25
0,50
0,75
1,00
Desirability
Prediction Profiler
One batch at center point above target.On average high temperature and pressure (1,1) give best results.Pressure have significant influence.Temperature*Pressure close to having significant influence at 5% level.Change in settings for both Temperature and Pressure.New optimum found.All batches within specifications = DoE for free!!!
-5-4-3-2-1012345
Dat
a A
ctua
l
1, -1 -1, 1-1, -1 1, 1
0, 01, -1
-1, 1-1, -1
1, 1
0, 01, -1
-1, 1-1, -1
1, 1
0, 0
-4 -3 -2 -1 0 1 2Data Predicted P=0,0417RSq=0,51 RMSE=0,9305
Actual by Predicted Plot
ISPE Nordic PAT COP 2009.03.25
Winner of the ISPE awardCompany of the Year 2008
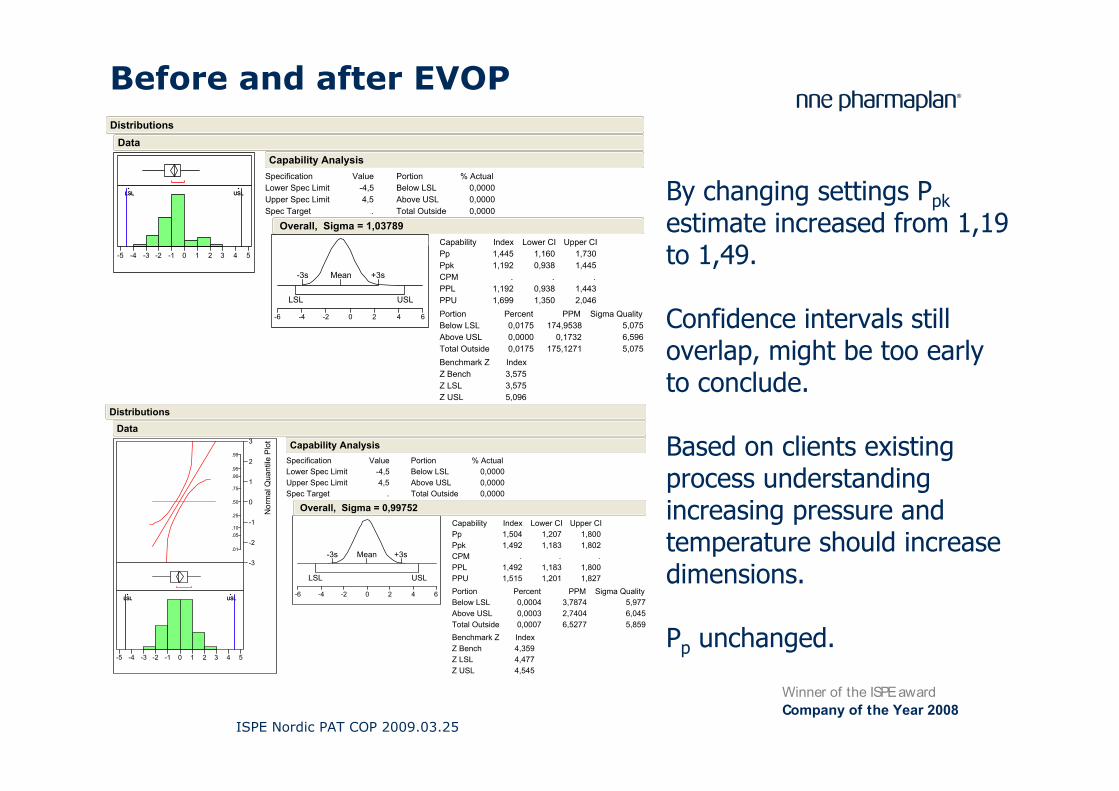
Before and after EVOP
By changing settings Ppkestimate increased from 1,19 to 1,49.
Confidence intervals still overlap, might be too early to conclude.
Based on clients existing process understanding increasing pressure and temperature should increase dimensions.
Pp unchanged.
.01
.05
.10
.25
.50
.75
.90
.95
.99
-3
-2
-1
0
1
2
3
Nor
mal
Qua
ntile
Plo
t
LSL USLLSL USL
-5 -4 -3 -2 -1 0 1 2 3 4 5
Lower Spec LimitUpper Spec LimitSpec Target
Specification-4,54,5
.
Value Below LSLAbove USLTotal Outside
Portion0,00000,00000,0000
% Actual
LSL USL
-3s +3sMean
-6 -4 -2 0 2 4 6
PpPpkCPMPPLPPU
Capability1,5041,492
.1,4921,515
Index1,2071,183
.1,1831,201
Lower CI1,8001,802
.1,8001,827
Upper CI
Below LSLAbove USLTotal Outside
Portion0,00040,00030,0007
Percent3,78742,74046,5277
PPM5,9776,0455,859
Sigma Quality
Z BenchZ LSLZ USL
Benchmark Z4,3594,4774,545
Index
Overall, Sigma = 0,99752
Capability AnalysisData
Distributions
LSL USLLSL USL
-5 -4 -3 -2 -1 0 1 2 3 4 5
Lower Spec LimitUpper Spec LimitSpec Target
Specification-4,54,5
.
Value Below LSLAbove USLTotal Outside
Portion0,00000,00000,0000
% Actual
LSL USL
-3s +3sMean
-6 -4 -2 0 2 4 6
PpPpkCPMPPLPPU
Capability1,4451,192
.1,1921,699
Index1,1600,938
.0,9381,350
Lower CI1,7301,445
.1,4432,046
Upper CI
Below LSLAbove USLTotal Outside
Portion0,01750,00000,0175
Percent174,9538
0,1732175,1271
PPM5,0756,5965,075
Sigma Quality
Z BenchZ LSLZ USL
Benchmark Z3,5753,5755,096
Index
Overall, Sigma = 1,03789
Capability AnalysisData
Distributions
ISPE Nordic PAT COP 2009.03.25
Winner of the ISPE awardCompany of the Year 2008
Agenda
••• Why DoE? Reduce Cost of Poor QualityWhy DoE? Reduce Cost of Poor QualityWhy DoE? Reduce Cost of Poor Quality
••• Health Authority viewHealth Authority viewHealth Authority view••• Case 1: Ultrasonic weldingCase 1: Ultrasonic weldingCase 1: Ultrasonic welding
••• Case 2: Foam coatingCase 2: Foam coatingCase 2: Foam coating••• Case 3: Injection mouldingCase 3: Injection mouldingCase 3: Injection moulding• Conclusions
ISPE Nordic PAT COP 2009.03.25
Winner of the ISPE awardCompany of the Year 2008
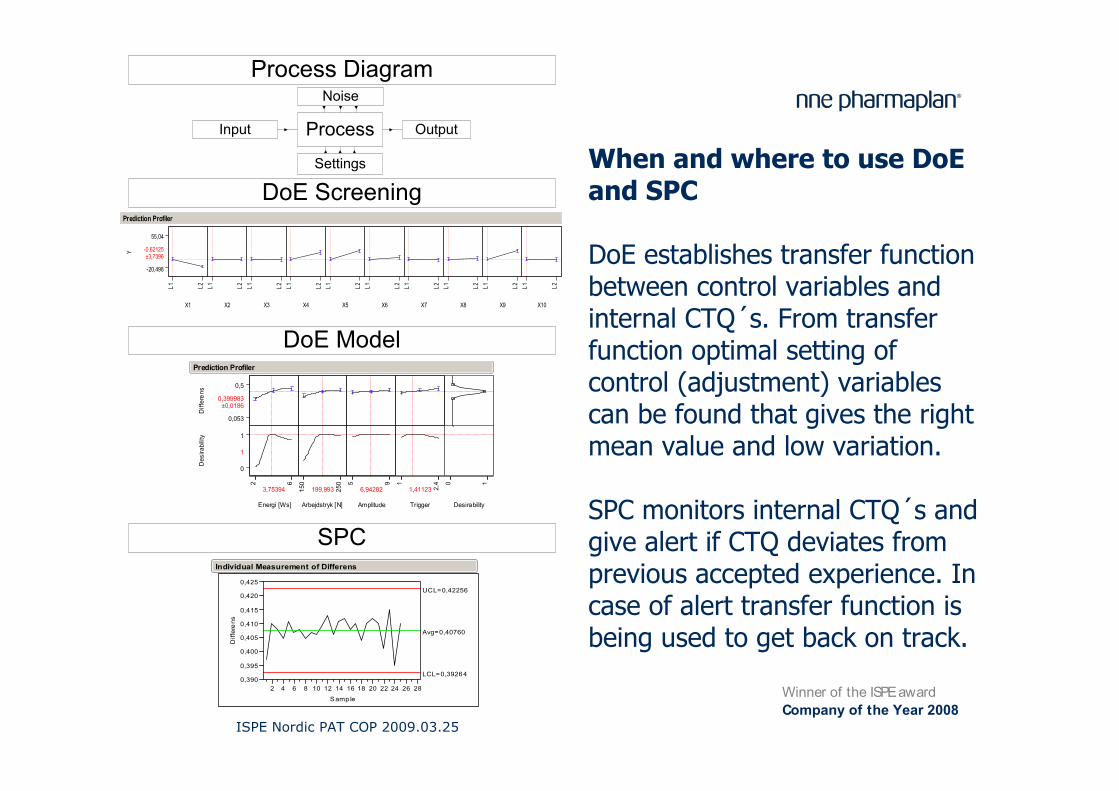
When and where to use DoE and SPC
DoE establishes transfer function between control variables and internal CTQ´s. From transfer function optimal setting of control (adjustment) variables can be found that gives the right mean value and low variation.
SPC monitors internal CTQ´s and give alert if CTQ deviates from previous accepted experience. In case of alert transfer function is being used to get back on track.
Input ProcessY
55,04
-20,498
-0,62125±3,7396
X1
L1 L2
X2
L1 L2
X3
L1 L2
X4
L1 L2
X5
L1 L2
X6
L1 L2
X7
L1 L2
X8
L1 L2
X9
L1 L2
X10
L1 L2
Prediction Profiler
Diff
eren
s 0,5
0,053
0,399983±0,0186
Des
irabi
lity 1
0
1
Energi [Ws]
2 6
3,75394
Arbejdstryk [N]
150
250
199,993
Amplitude
5 9
6,94282
Trigger
1
2,4
1,41123
Desirability
0 1
Prediction Profiler
0,390
0,395
0,400
0,405
0,410
0,415
0,420
0,425
Diff
ere
ns
2 4 6 8 10 12 14 16 18 20 22 24 26 28
Samp le
Avg=0,40760
LCL=0,39264
UCL=0,42256
Individual Measurement of Differens
Process Diagram
DoE Screening
DoE Model
SPC
Output
Settings
Noise
ISPE Nordic PAT COP 2009.03.25
Winner of the ISPE awardCompany of the Year 2008
Overview

![University of virginia HigHer edUcation capital oUtlay ... · 1.1.2 [Reserved] 1.1.3 Deviations from Manual: Deviations from the policy and procedures outlined within shall be requested](https://img.pdfslide.us/doc/110x75/5ecd1519381ce046273d8fb7/university-of-virginia-higher-education-capital-outlay-112-reserved-113.jpg)