Embed Size (px)
Citation preview
Examples of Respiratory Compromise
Conference on Respiratory Insufficiency February 26 / 27th, 2015
Peter S. Marshall, M.D. MPH Pulmonary, CriFcal Care & Sleep SecFon
Department of Medicine Yale School of medicine
Introduction
• Describe clinical presentaFon of common subsets of respiratory compromise • Discuss pathophysiology • Discuss epidemiology and risk factors for poor outcomes • Offer examples of predicFve models / tools • Propose gaps on knowledge

Control of breathing and airway protection • 33 yo male presents to the emergency department with severe lower back pain aRer an MVA. His evaluaFon includes normal vitals & basic blood work. His toxicology reveals only benzodiazepine which he is prescribed. There is no evidence of fracture on radiography or CT.
• He is given fentanyl in the ER and the trauma service is called • He is admiXed to the general medical ward for pain control and an MRI • He is prescribed ATC morphine and prn doses IV for severe / breakthrough pain in addiFon to NSAIDs.
• Four hours later he is found apneic and pulseless. • ACLS is performed and he is intubated. The CXR shows a new infiltrate.
Control of breathing and airway protection • Hallmarks
• Central depression of respiratory drive • Loss of tone in upper airway • BlunFng of airway clearance mechanisms
• Results • Impaired gas exchange (hypercapnia and hypoxemia) • AspiraFon of upper pharyngeal contents into lower airways • Inability to clear lower airways of debris
! Respiratory failure ! cardiopulmonary arrest ! death

Central respiratory depression – Opiates as paradigm • 1.3 % risk of developing criFcal respiratory event post-‐op • 1 % of those receiving fentanyl experienced adverse event including respiratory depression in ED
• Use of PCA with lock-‐outs lowers risks to 0.2 – 0.5 % • Fatal events occur in the sedng of inadequate and adequate monitoring

Overview of control of respiration

Mechanism of CNS opiate respiratory depression • MEDULLA: Neurokinin 1 receptors (NK-‐1 R) expressing neurons in pre-‐BoFnger complex mediate inspiraFon, inhibited by opiates
• CORTEX: Reduced sensiFvity of chemoreceptors to changes in pCO2 are well described among opiate addicted paFents
• PONS: Suppression of acetyl-‐choline release in medial ponFne reFcular formaFon ! “sleep-‐like” state

Mechanisms of central depression
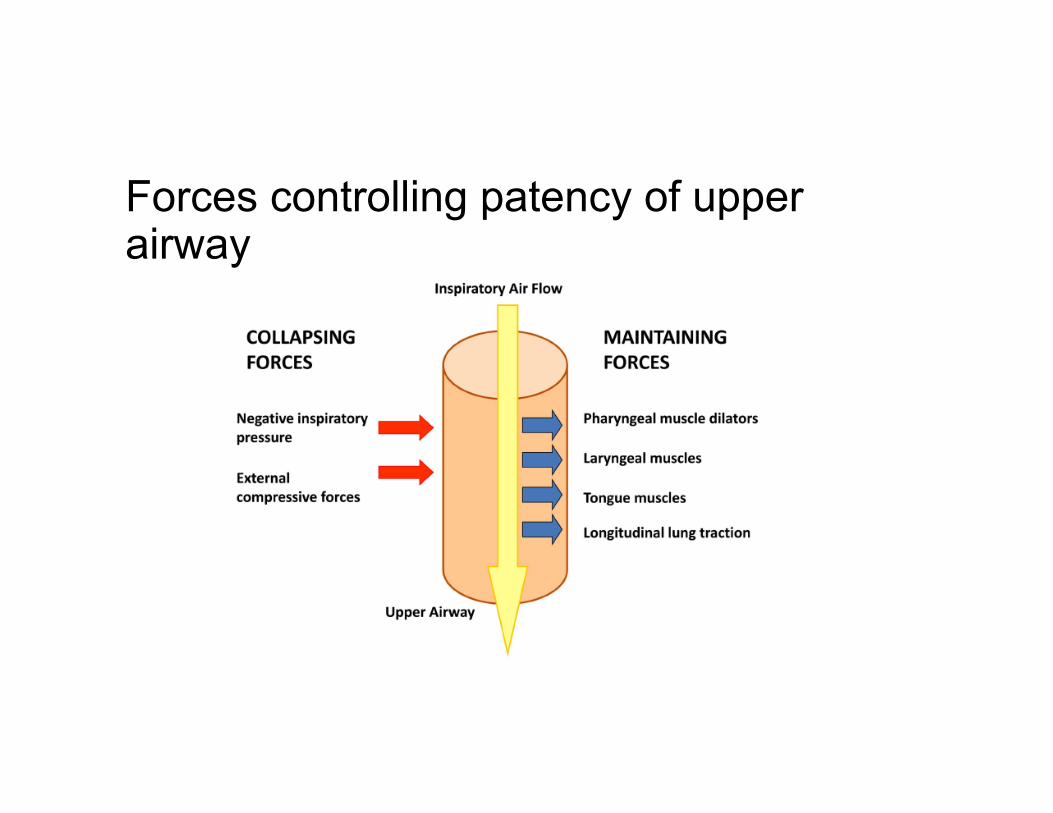
Forces controlling patency of upper airway
Other effects
• Opioid receptors on bronchioles • BronchoconstricFon ! increase in Raw
• Abdominal and chest wall rigidity • Especially at high doses (e.g. SFff chest in fentanyl boluses) • Reduced phrenic nerve and diaphragm acFvity ! Reduced Vt

Central depression by opiates: Biological factors • Age – lower rates of clearance • Gender – females -‐ up to 25 % higher levels of oxycodone
• Ethnicity – some groups have enhanced clearance (allelic variants in CYP2D6); rapid metabolizers run greater risk of respiratory depression than poor metabolizers
• Co-‐morbidiFes – Hepatorenal impairments affect clearance (fentanyl and methadone minimally effected by liver or renal impairment)
• Drug interacFons • PotenFaFon: Buprenorphine and opiates or benzos and opiates • Opiates and cardiac meds

Opiate induced resp failure: patient characteristics / profile
• Sleep disordered breathing • Morbid obesity • Snoring • Older age • Opioid naïve • Post-‐surgical (esp. upper abdominal, chest wall or upper airway) • Increased opioid dose need • Prolonged anesthesia • Use of addiFonal sedaFng drugs • Prior cardio-‐pulmonary disease, other major organ dysfuncFon (liver, renal) • Smoker
Risk factors for respiratory failure / death
• Upper airway obstrucFon • Chronic use of opioids (chronic blunFng of chemoreceptors) • Abnormal metabolism (e.g. mutaFon in CYP2D6 causing rapid metabolism of codeine to acFve metabolite)
• Joint Commission (SenFnel event alert, August 2012) • 11% Excessive dosing (esp. opioid naïve), drug-‐drug interacFons, adverse reacFons
• 47% medicaFon errors • 29% inadequate monitoring

Monitoring for central depression
• High frequency of nursing assessments at outset • Level of conscienFousness • Vitals • Pain scores
• Sudden death can occur despite monitoring • Can we idenFfy suscepFble individuals up front? • Is this more related to aspiraFon which is more difficult to detect and more common than we believe?
• How do we monitor outside of ICU / recovery room? • Do we need more objecFve methods of monitoring outside of ICU / PACU?

Acute lung injury / ARDS
• Berlin DefiniFon – JAMA 2012 • Onset with 1 week • Bilateral opaciFes • Not explained by cardiac failure (objecFve assessment – TTE for example)
• Poor oxygenaFon • Mild – P/F 200 – 300 on >= PEEP 5 • Moderate – P/F 100 -‐ 200 on > = PEEP 5 • Severe – P/F < 100 on > = PEEP 5

Causes of ARDS in the Medical ICU

Zilberberg, M.D. and Epstein, S.K. Am J Respir Crit Care Med; 1999; 157:1159
Risks Factors for Mortality in ARDS/ALI
Risk Coefficient
Age >65 1.98
Cirrhosis 1.75
HIV 2.75
Malignancy 1.76
Transplant 3.67
Sepsis 1.02
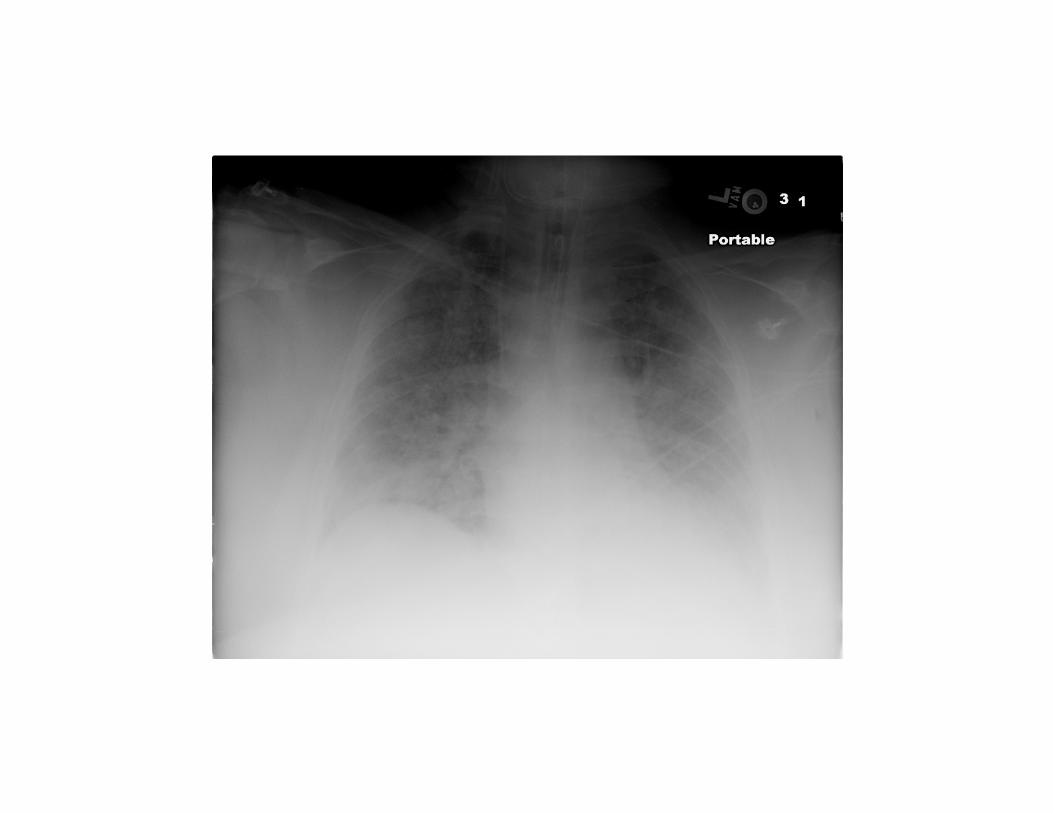
Pneumonia as model for Acute lung injury
• Comprise large fracFon of paFents with ARDS
• Some are admiXed and progress to insufficiency and failure
• Many tools to predict progression – not perfect

PNA - pathophysiology
• V/Q mismatch
• Airway obstrucFon – secreFons, bronchospasm • Increased resisFve W.O.B.
• RestricFve physiology – consolidaFon, effusion, atelectasis • Increased elasFc W.O.B.
• Diffusion impairment
• Severe mulF-‐lobar PNA –>ARDS • Physiological shunt (severe hypoxemia) • Severe restricFve physiology / reduced lung compliance (markedly increased WOB)
• Increased dead-‐space venFlaFon (hypercapnia)

Shunt Physiology in ARDS

Hydrostatic & Non-hydrostatic Pulmonary Edema
H π
π
H
π
π

Lung Compliance in ARDS Normal
ARDS
Pressure
Volu
me
CL = ΔV/ΔP

PNA – Progression / stages • Clinical signs and symptoms
• Cough • Dyspnea • PleuriFc chest pain • Fever / chills / sweats / hypothermia • Headache • Malaise
• Progression • Systemic Illness
• Sepsis • Severe sepsis / sepFc shock / ARDS
• Pulmonary • Respiratory insufficiency • Respiratory failure • ComplicaFons: ARDS, empyema, necroFzing pna, abscess, BP fistula, fibrosis, bronchiectasis

CRIT CARE 2012 PSI CURB 65 CRB-‐65 CURB CORB ATS/IDSA SMART-‐COP SCAP REA-‐ICU
MV X
Shock X X
Age X X X X X
Gender X X
Co-‐morbid X X
Mental status X X X X X X X X
HR X X X X
T X X
RR X X X X X X X X X
BP X X X X X X X X
P / F X X X X X X
pH X X X
infiltrate X X X X
Na X X
Gluc X
Urea / Albumin X (U) X (U) X (U) X (ALB) X (U) X (U)
WBC / PLT X X (WBC)
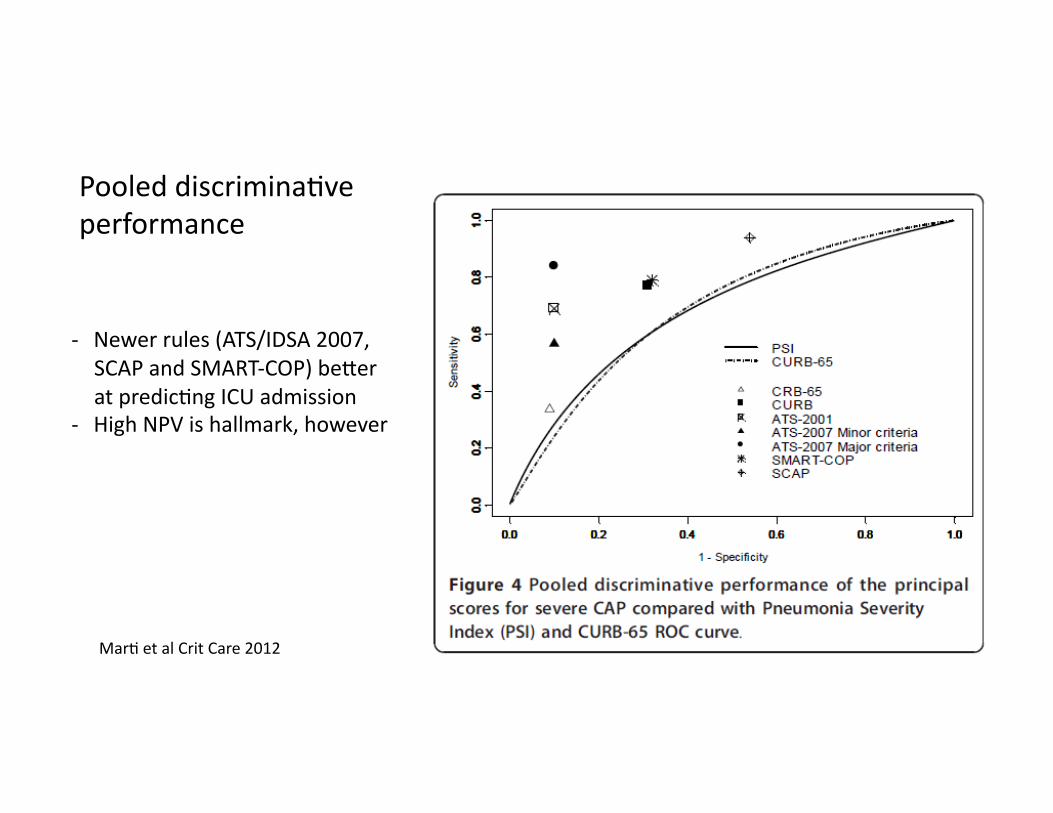
MarF et al Crit Care 2012
Pooled discriminaFve performance
-‐ Newer rules (ATS/IDSA 2007, SCAP and SMART-‐COP) beXer at predicFng ICU admission
-‐ High NPV is hallmark, however

PNA - Summary
• Many predicFon rules exist – likely under-‐uFlized? • ORen designed to predict 30 day mortality
• PredicFon of shorter term progression is more useful • Newer models focus on shorter term escalaFon of care as end-‐point
• Lack PPV needed to confidently idenFfy those for closer monitoring
• High NPV -‐ can idenFfy those with low risk of progression to respiratory insufficiency, respiratory failure, ARDS, severe sepsis, shock
• Helpful with triage • Do we need to incorporate biomarkers or more physiologic data? • Do these rules apply to non-‐bacterial forms of pna?

Bronchospasm – COPD and Asthma admissions
For Asthma admissions: • Approximately 500,000 admissions annually • 1.7 – 2.0 % of all ICU admissions
• Approximately 30 % require intubaFon • Mortality rate once intubated ranges between 6 and 42% • Mortality much higher in intubated paFents (to be avoided)
• 5000 deaths annually

Mortality risk factors for patients with SA
• Prior intubaFon • Frequent hospitalizaFons • Prior ICU admission
• PredicFng mortality • Less than 50 % of asthma mortaliFes possess these features ! Risk straFficaFon difficult ! Few formal tools exist that predict in-‐hospital deterioraFon

Pathophysiology of acute severe asthma • Three hallmarks
• InflammaFon • BronchoconstricFon • Mucus producFon
• Results in: • Increased airway resistance
! Increased resisFve WOB • Air trapping (unable to empty to baseline FRC)
! Dynamic hyperinflaFon ! Increased elasFc recoil ! Increased elasFc WOB Reduced Vt !Increased dead-‐space ! hypercapnia
• Mucus plugging of small airways ! V/Q mismatch ! hypoxemia

Dynamic hyperinflation
With each respiratory effort: -‐ More air is trapped and there is
increased end exp volume -‐ Vt is smaller ! increased dead-‐space
venFlaFon -‐ The elasFc recoil of the lung is
increased -‐ Also increase in intra-‐thoracic
pressures = Auto-‐PEEP

Extra-pulmonary consequences • LacFc acidosis
• Increased WOB (resisFve and elasFc) • Anaerobic metabolism in the sedng of hypoxemia • Side-‐effect of high doses of SABA
• Reduced Cardiac output, hypotension Dynamic hyperinflaFon ! auto-‐PEEP (increased intra-‐thoracic pressures) • Reduce venous return to RV • Rapid RV filling during exaggerated inspiratory efforts ! septal displacement into LV, impaired LV filling / reduced SV
• Increased RV aRerload due to auto-‐PEEP ! worsening of IV septal displacement • Clinical manifestaFon = Pulsus pardoxus
• Exaggerated reducFon in SBP during inspiraFon (> 12 – 15 mmHg)
• Myocardial ischemia • Increased WOB • Rapid HR due to SABA, reduced SV, anxiety • Hypotension

NHBLI, Guidelines for the diagnosis and management of asthma

NHBLI, Guidelines for the diagnosis and management of asthma

Evaluation • History • HR, RR, Pulse • Peak flow, FEV1 • Pulsus paradoxus • Oxygen saturaFon • ABG • Assessment of breathing paXern • Assessment of volume status • Assessment of mental status • Response to iniFal therapy

Asthma exacerbations - Summary
• Risk factors for poor outcomes exist but are inconsistently present in those who deteriorate / die
• Extra-‐pulmonary manifestaFons suggest poor outcomes
• DeterioraFon can be sudden / rapid • Mechanical venFlaFon of paFents with asthma adds to their risk • Should a formal tool for be developed to predict decline? • Could enhanced monitoring of these paFents impact mortality / outcomes?
Pulmonary embolus
• Cardiovascular and respiratory deterioraFon possible • In those without overt hemodynamic instability in can be difficult to know who is “sick”
• Management / monitoring of the hemodynamically stable paFent is not straighxorward

The PE story we all have heard • 70 yo male with a h/o HTN and COPD presents to the ED with pleuriFc chest pain and dyspnea for two days.
• P105, BP 110/65, RR 22 O2 sat 92% r/a, Afebrile • No advenFFous sounds on lung exam, heart exam tachy, extremiFes cool with no edema
• Trop-‐I 0.5 ! ?, EKG – sinus tach, inv T-‐waves across precordium • CTA – RUL lobar embolus; IV flaXening • He is admiXed to a monitored bed • TTE – mild RV HK with RA and RV enlargement; IV septal flaXening
• A second TTE on HD # 2 is unchanged • He is placed on LMWH immediately and given Coumadin on HD #2 • Discharged with 4 days of LMWH on HD #2 • Within 12 hours he is brought back to the hospital by EMS aRer a PEA arrest and expires in the ED
Epidemiology
• 600,000 PE’s per year in the US
• Accounts for 100,000 to 200,000 deaths
• Mortality rates: • 13.0 -‐ 17.5 % at 3 months across all severiFes
• Most deaths within 60-‐90 minutes
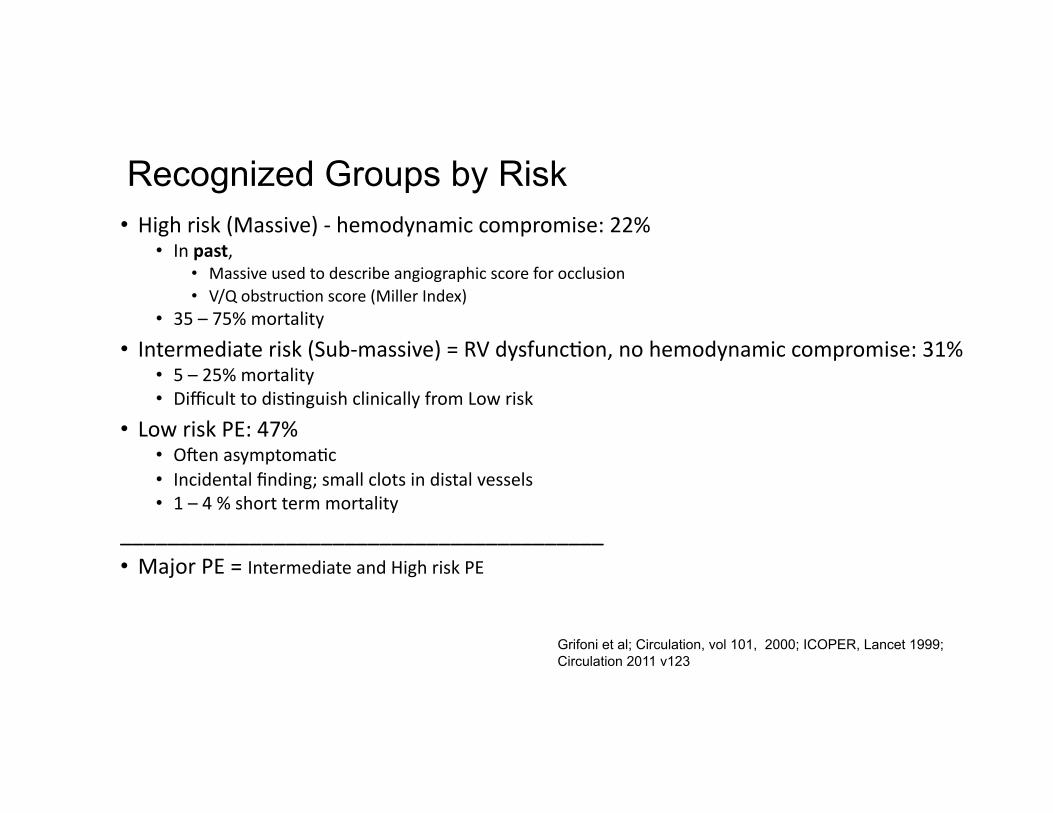
Recognized Groups by Risk • High risk (Massive) -‐ hemodynamic compromise: 22%
• In past, • Massive used to describe angiographic score for occlusion • V/Q obstrucFon score (Miller Index)
• 35 – 75% mortality
• Intermediate risk (Sub-‐massive) = RV dysfuncFon, no hemodynamic compromise: 31% • 5 – 25% mortality • Difficult to disFnguish clinically from Low risk
• Low risk PE: 47% • ORen asymptomaFc • Incidental finding; small clots in distal vessels • 1 – 4 % short term mortality
_________________________________________ • Major PE = Intermediate and High risk PE
Grifoni et al; Circulation, vol 101, 2000; ICOPER, Lancet 1999; Circulation 2011 v123
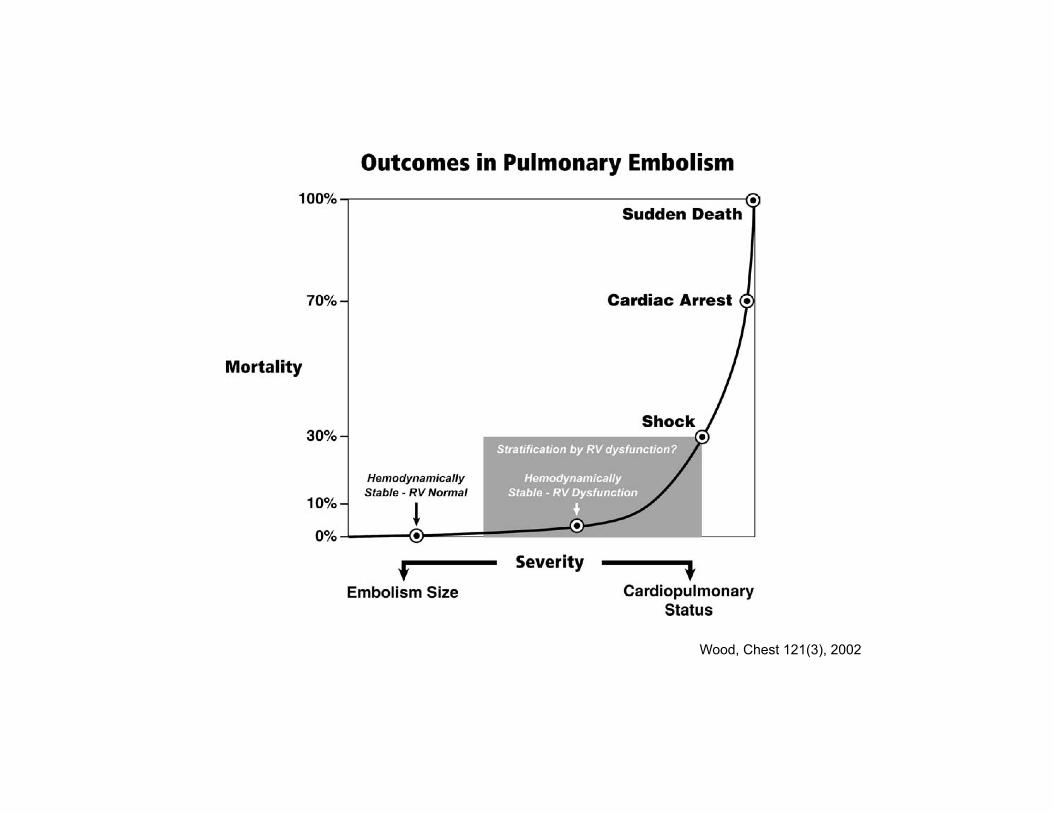
Wood KE. Intensive Care Med (2002) 28:1537–1546 Wood, Chest 121(3), 2002

Hemodynamics
Elevated PVR / Pressure Load
RV Decompensation
Increased RV Volume
Septal Shift Pericardial Restriction
Reduced LV Distensibility
Decreased LV Pre-load
Decreased RV Output
Ischemia
Decreased CO / MAP
Decreased RV CPP
OBSTRUCTION NEUROHORMONAL
Wood, Chest 121(3), 2002

IMPAIRED GAS EXCHANGE
• V / Q mismatch
• Reduced mixed-‐venous saturaJon
• Impaired diffusion
• Right – to – leR shunt
• Dead space venFlaFon ! hypercapnia? ______________________________________
-‐ Hypoxia adds to increases in PVR

Markers used to assess severity • Vital signs: BP, HR, (RR) • Troponin released in response to low CPP & myocardial injury
• CPP = MAP – RV intra-‐cavitary pressure • Others = HFABP
• Oxygen saturaJon • Co-‐morbidiJes
• Clot burden: Especially co-‐exisFng DVT • RV strain:
• BNP released in response to RV pressure load / dilaFon • TTE • EKG • CTA
-‐-‐> Ideally we want to detect deterioraJon prior to drop in BP
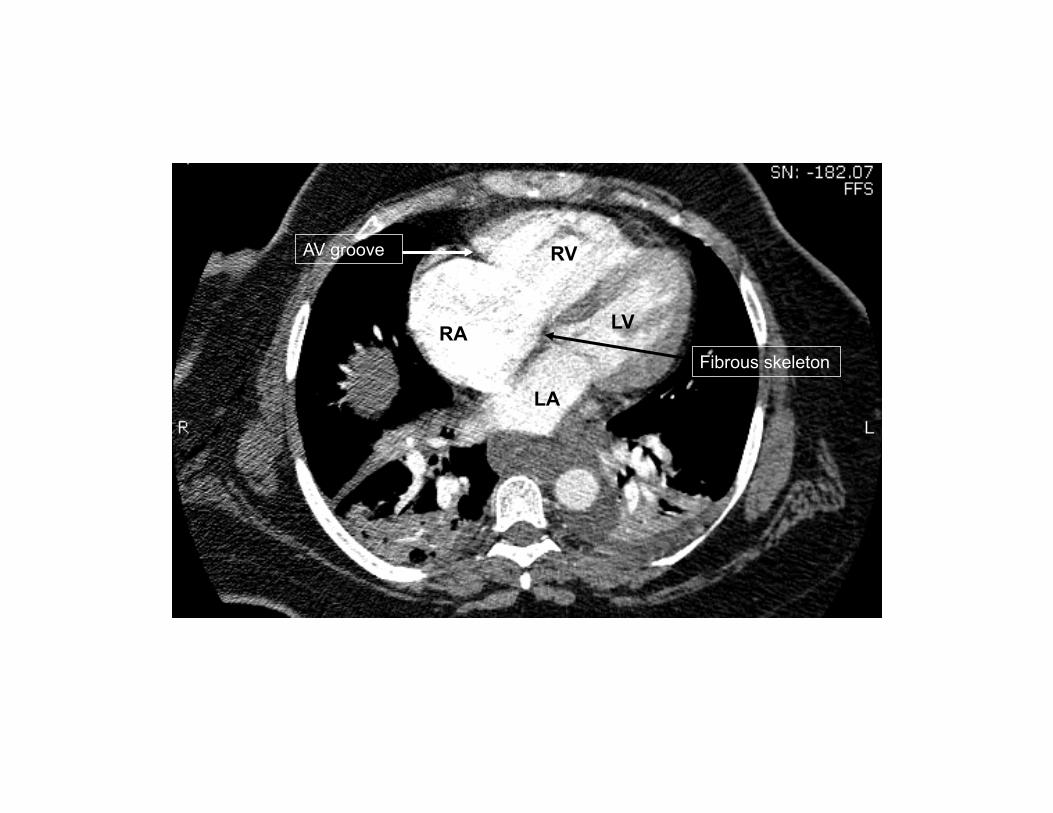
RA
RV
LV
LA
AV groove
Fibrous skeleton

PESI Classes & Mortality
Class Points Mortality (30 day)
I 0 - 65 0 – 1.6
II 66 - 85 1.7 – 3.5
III 86 - 105 3.2 – 7.1
IV 106 - 125 4.0 – 11.4
V > 125 10 – 24.5 ! Prospectively validated ! Elevated risk possible w/out hemodynamic compromise ! Most helpful for triage decisions (Low risk = I & II; High risk = III, IV and V)
PE Severity Index (PESI)
-‐ Weighted variables (11) -‐ Easy to obtain
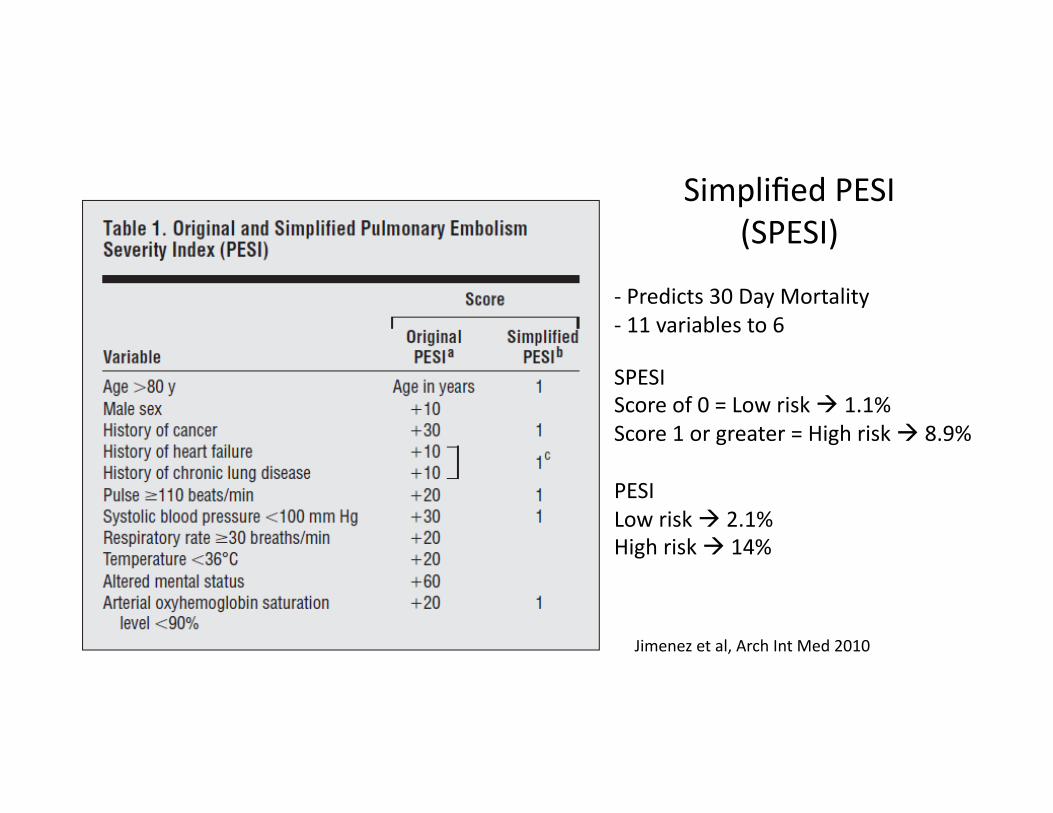
-‐ Predicts 30 Day Mortality -‐ 11 variables to 6
SPESI Score of 0 = Low risk ! 1.1% Score 1 or greater = High risk ! 8.9%
PESI Low risk ! 2.1% High risk ! 14%
Jimenez et al, Arch Int Med 2010
Simplified PESI (SPESI)

ROC curves of SPESI and PESI (30 day mortality)
-‐ SPESI has greater sensiFvity (96 v. 88) -‐ PESI and SPESI have similar NPV (97 v. 99) -‐ PESI and SPESI have similar PPV (10.9 v. 10.9)
-‐ SPESI has similar operaFng characterisFcs yet is easier to use
-‐ Does not tell us about in-‐hospital decline
Jimenez et al, Arch Int Med 2010

Predictor Points
SBP 90 – 100 2
Elevated Troponin 2
RVD (TTE or CTA*) 2
HR > 110 1
Stage Points 30 day**
I 0 -‐ 2 4.2 %
II 3 -‐ 4 10.8 %
III > 4 29.2 %
**CumulaFve incidence of 30 Day PE related complicaFons (PE related death, recurrent PE, hemodynamic collapse, mechanical venFlaFon)
PE Risk Score: IdenFficaFon of Intermediate-‐risk paFents with acute symptomaFc PE
*PROTECT criteria for CTA
Goal: IdenFfy normotensive paFents at higher risk for complicaFons (consideraFon of aggressive therapy?)
Bova et al Eur Resp J v44 2014
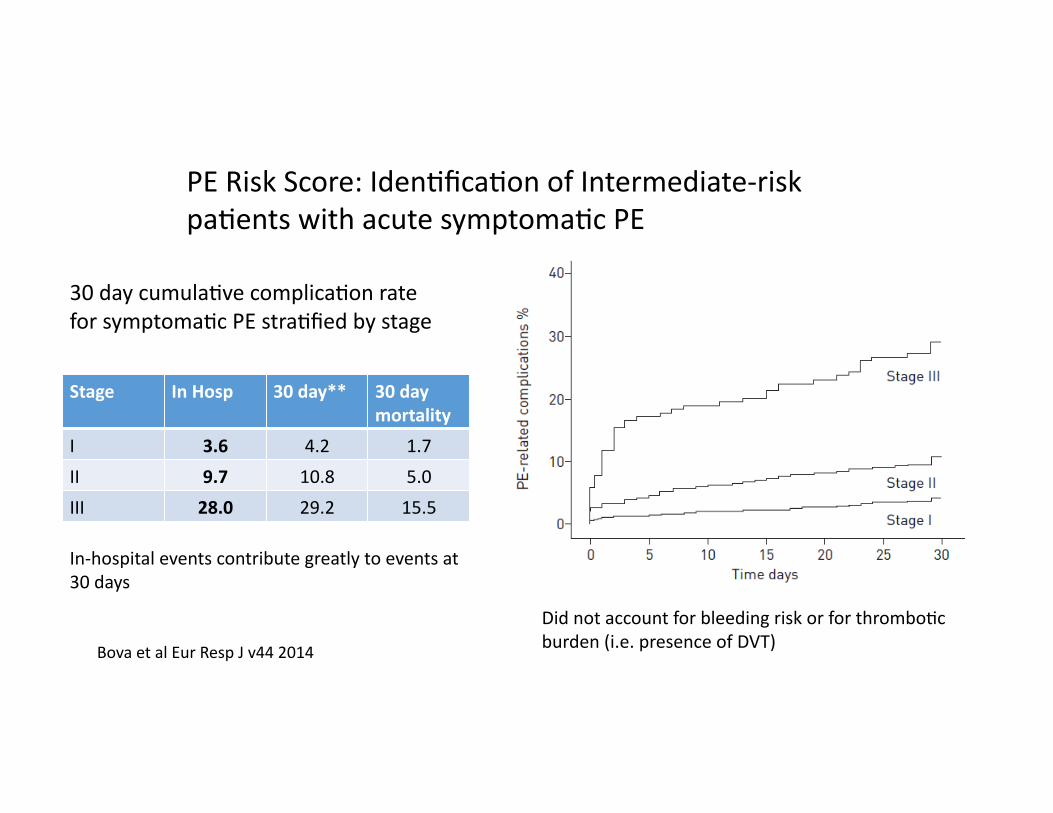
30 day cumulaFve complicaFon rate for symptomaFc PE straFfied by stage
Stage In Hosp 30 day** 30 day mortality
I 3.6 4.2 1.7
II 9.7 10.8 5.0
III 28.0 29.2 15.5
Bova et al Eur Resp J v44 2014
Did not account for bleeding risk or for thromboFc burden (i.e. presence of DVT)
PE Risk Score: IdenFficaFon of Intermediate-‐risk paFents with acute symptomaFc PE
In-‐hospital events contribute greatly to events at 30 days
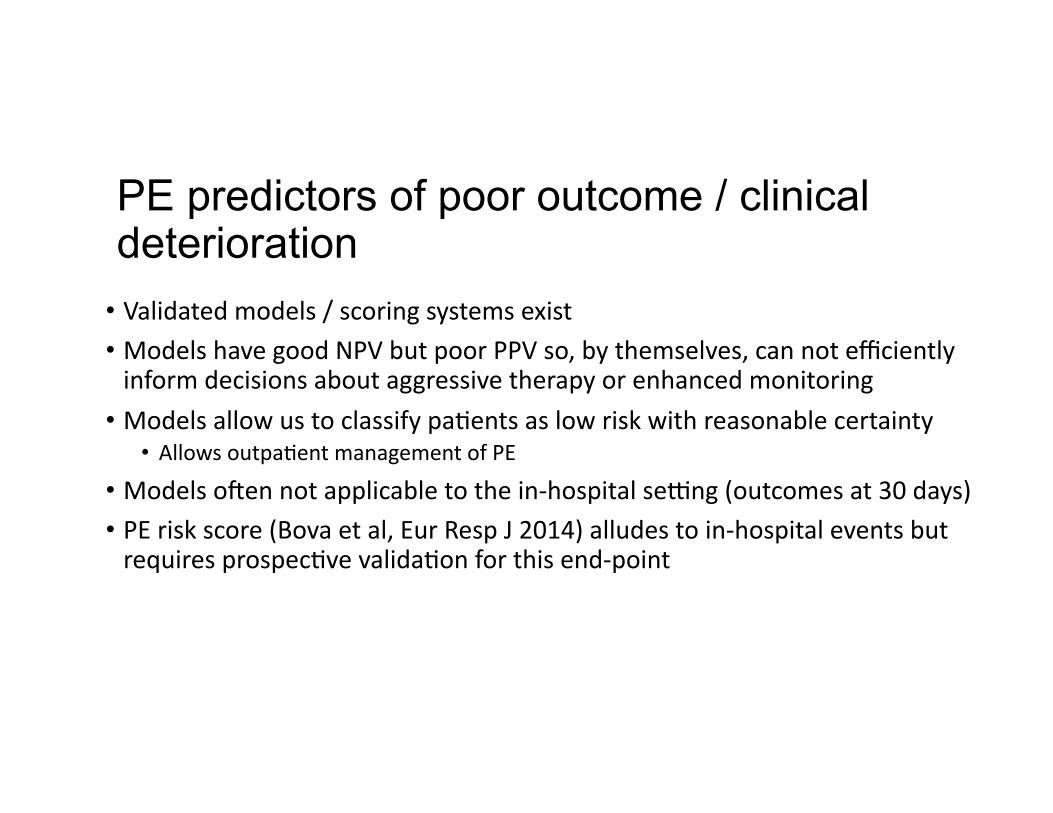
PE predictors of poor outcome / clinical deterioration
• Validated models / scoring systems exist • Models have good NPV but poor PPV so, by themselves, can not efficiently inform decisions about aggressive therapy or enhanced monitoring
• Models allow us to classify paFents as low risk with reasonable certainty • Allows outpaFent management of PE
• Models oRen not applicable to the in-‐hospital sedng (outcomes at 30 days) • PE risk score (Bova et al, Eur Resp J 2014) alludes to in-‐hospital events but requires prospecFve validaFon for this end-‐point

Afferent inputs from chemo receptors, stretch receptors and baroreceptors
NTS – nucleus tractus solitarus – relays info on pO2 from caroFd sinus RTN – retrotrapezoid nucleus – main site of cerebral chemorecepFon MRN – Medullary raphe nucleus – senses changes in pH and pCO2