Embed Size (px)
Citation preview

Headquarters US Air Force I n t e g r i t y - S e r v i c e - E x c e l l e n c e
Examples of Air Force Data Management and Information Systems
GTS and EDITT
AFCEETDV Philip Hunter PG
2009 May
Overview
Focus GTS amp EDITT
Application highlights
Data management fly-over
Electronic data resources
Benefits amp payoffs
2I n t e g r i t y - S e r v i c e - E x c e l l e n c e
Products and Services AFCEE Restoration Branch
Products and Services
Mission
Goals
Funding
Staff
Organization
Issues
I n t e g r i t y - S e r v i c e - E x c e l l e n c e 3
Remedial Process Optimization Peer Review Support Decision Support amp Analysis Rapid Site Characterization Innovative Technologies Performance Based Contracting Consulting Services Exit Strategy Development ROD Reviews 5-Year Review Support LTM Optimization Emerging Issues
Partnerships and Working Groups Restoration Branch
Technology Transfer
Technology ldquoNeedsrdquo
Training Education
BAA
Partnerships
Tri-Service Environmental Risk Assessment Workgroup OSD Materials of Emerging Regulatory Interest Team
(MERIT) EPA Federal Remediation Technologies Roundtable (FRTR) Environmental Data Quality Workgroup (EDQW) Sustainable Remediation Forum (SuRF) Strategic Environmental Research amp Development Program
(SERDP) Environmental Security Technology Certification Program
(ESTCP) Interstate Technology Regulatory Council (ITRC)
4I n t e g r i t y - S e r v i c e - E x c e l l e n c e
Key DatabasesData Management is lt 05 of Environmental Budget
ERPIMS
- Sampling Points - Analytical Results - Events
EDITT
- Remedial Systems - Inventory - Lifecycle Costs
AFRIMS
- Program Mgt $$ - Schedule - Cleanup Phase
I n t e g r i t y - S e r v i c e - E x c e l l e n c e 5
Environmental Resources Program Information Management System (ERPIMS)
165
6500
58000
95000
60MAnalytical Records
Soil Borings
Monitor Wells
Waste Sites
Installations Military
Hazardous
AFCEE
I n t e g r i t y - S e r v i c e - E x c e l l e n c e 6
I n t e g r i t y - S e r v i c e - E x c e l l e n c e 7
Types of Constituents Detected in GW Air-Force Wide Analysis
23
16 732
3 8 8
3
SolventsVOCs Semi-volatiles ExplosivesEnergetics Metals PAHs PCBs Pesticides Radionuclides
Detect Rates in Groundwater Air-Force Wide Analysis
06 05 TCE 04
Perchlorate PB03
1000 10000 100000 SAMPLES
01
02
Det
ect R
ate
CR6
DIOXANE
NDMA
BE
DCBZ14
PCE NAPH
TCP123
MTBE
RDX
DNT24
I n t e g r i t y - S e r v i c e - E x c e l l e n c e 8
Detect Rates in Soil Air-Force Wide Analysis
TCE
I n t e g r i t y - S e r v i c e - E x c e l l e n c e 9
GW Analytes Detected Above PRGs Air-Force Wide Analysis
Constituent Bases
w Detects Wells
w Detects Median Detect
Sample Size (n)
Detect Rate Units
TCE 124 19909 19 227374 52 ugL MANGANESE 118 17044 101 68821 86 ugL LEAD 128 13453 5 97739 31 ugL ARSENIC 128 12127 7 88447 38 ugL NICKEL 118 10247 184 78517 44 ugL PCE (TETRACHLOROETHYLENE) 110 9785 27 212357 21 ugL VANADIUM 103 9351 74 54713 43 ugL NAPHTHALENE 116 7423 10 162706 17 ugL COBALT 100 6507 52 55129 28 ugL CADMIUM 114 6032 11 86284 14 ugL 11 - DICHLOROETHANE 108 5521 2 205257 13 ugL BERYLLIUM 100 4690 06 59662 15 ugL CHLOROMETHANE 100 4593 2 201375 6 ugL MOLYBDEMUM 73 3555 67 30562 31 ugL n-PROPYLBENZENE 83 3495 58 92769 16 ugL MTBE (tert-Butyl Methyl Ether) 70 2888 50 100771 13 ugL PCA (1122-Tetrachloroethane) 69 1735 1 198601 4 ugL 123-TRICHLOROPROPANE 36 1015 1 111189 6 ugL NITROBENZENE 31 474 10 57977 3 ugL 24 - DINITROTOLUENE 26 472 10 58765 3 ugL CHROMIUM HEXAVALENT 23 463 129 3728 26 ugL 26 - DINITROTOLUENE 24 413 10 57802 3 ugL NDMA (N-NITROSODIMETHYLAMINE) 10 358 12 12379 7 ugL 14-Dioxane 10 229 10 7439 12 ugL ANILINE 6 178 23 8442 3 ugL PERCHLORATE 10 140 62 1992 43 ugL RDX 11 97 25 3281 5 ugL
I n t e g r i t y - S e r v i c e - E x c e l l e n c e 10
Groundwater SoilPFOA and PFOS
SoilTERBUFOSSoilTERBACILSoilRADIUM-224SoilMOLINATESoilMETRIBUZINSoilMETOLACHLORSoilHEXAZINONESoilFONOPHOSSoilDIPHENYL ETHER (PHENYLETHER)SoilCYANAZINEGroundwaterPHTHALIC ANHYDRIDEGroundwaterDCPA ACID METABOLITES (a)
Groundwater SoilPBDEsGroundwater Soil4-NONYL PHENOL
MediaConstituent
Groundwater SoilPFOA and PFOS
Soil FENAMIPHOSSoilACETOCHLORSoil3-HYDROOXYCARBOFURANGroundwaterZIRAMGroundwaterETHYLENE THIOUREAGroundwaterACETALDEHYDEGroundwater SoilPERMETHRINGroundwater SoilNITROFENGroundwater SoilMETHAMIDOPHOSGroundwater SoilDICROTOPHOSGroundwater SoilACEPHATEGroundwater Soil2-PROPEN-1-OL
Groundwater SoilPBDEsGroundwater Soil
MediaConstituent2-METHOXYETHANOL
Groundwater SoilPFOA and PFOS
SoilTERBUFOSSoilTERBACILSoilRADIUM-224SoilMOLINATESoilMETRIBUZINSoilMETOLACHLORSoilHEXAZINONESoilFONOPHOSSoilDIPHENYL ETHER (PHENYLETHER)SoilCYANAZINEGroundwaterPHTHALIC ANHYDRIDEGroundwaterDCPA ACID METABOLITES (a)
Groundwater SoilPBDEsGroundwater Soil4-NONYL PHENOL
MediaConstituent
Constituents Not SampledAir-Force Wide Analysis
Constituent Media 2-METHOXYETHANOL Groundwater Soil PBDEs Groundwater Soil PFOA and PFOS Groundwater Soil 2-PROPEN-1-OL Groundwater Soil ACEPHATE Groundwater Soil DICROTOPHOS Groundwater Soil METHAMIDOPHOS Groundwater Soil NITROFEN Groundwater Soil PERMETHRIN Groundwater Soil SULFUR HEXAFLUORIDE Groundwater Soil ETHYLENE THIOUREA Groundwater ZIRAM Groundwater 3-HYDROOXYCARBOFURAN Soil ACETOCHLOR Soil FENAMIPHOS Soil
I n t e g r i t y - S e r v i c e - E x c e l l e n c e 11
Time Series AnalysisTreatment System Analysis
Example Influent TCE Mission St Treatment Facility
300
200
100
0
New System Turned On
93 95 97 99 01 03 YEAR
TCE
(ug
L)
I n t e g r i t y - S e r v i c e - E x c e l l e n c e 12
Statistical Analysis of Individual COCs Air-Force Wide and Installation Level
I n t e g r i t y - S e r v i c e - E x c e l l e n c e 13
GIS amp Anthropogenic Background Analysis of PAHs in Soil
Site and Installation Level
I n t e g r i t y - S e r v i c e - E x c e l l e n c e 14
Elmendorf AFB (3)
Fairchild AFB (4)
Hickam AFB (28)
Malmstrom AFB (1)
Mountain Home AFB (1)
FE Warren AFB (4)
Offutt AFB (1)
Beale AFB (11)
Travis AFB (26)
Vandenberg AFB (24) Edwards AFB (59)
Nellis AFB (1)
Davis-Monthan AFB (2)
Kirtland AFB (3)
Hill AFB (12)
Buckley AFB (2)AFP PJKS (5)
Peterson AFB (1)
Cannon AFB (1)
Holloman AFB (24)
Laughlin AFB (12)
Goodfellow AFB (2)
Randolph AFB (2) Lackland AFB (34)
Sheppard AFB (7) Altus AFB (23)
Barksdale AFB (13)
Little Rock AFB (4)Tinker AFB (1)
Vance AFB (1) McConnell AFB (6)
Whiteman AFB (1)Scott AFB (23)
Columbus AFB (4)Maxwell AFB (1)
Moody AFB (1)
Charleston AFB (4)
Shaw AFB (1)
MacDill AFB (17)
Arnold AFB (5)
Tyndall AFB (8)
Pope AFB (13)
Seymour Johnson AFB (1)
AFP 85 (2)
Langley AFB (7)
Andrews AFB (13)Andrews AFB (13)
McGuire AFB (39)
Massachusetts Military Reservation (MMR) (4)
Andersen AFB (50)
AFP 42 (29)
AFP 44 (1) AFP 06 (3)
AFP 36 (1)
Avon Park AFR (15)
1 2
3 4
6
5
7
8
9
10
Restoration PMO Regions
West East
132
116
98 84
81
32
13 4
AMC AFMC AETC ACC PACAF AFSPC AFDW AFCEEM
Air Force Transformation Initiativeshellip
Sites That Have Not Achieved RIP Regional Analysis
I n t e g r i t y - S e r v i c e - E x c e l l e n c e 15
Cleanup Phase amp Timeline Installation Analysis
I n t e g r i t y - S e r v i c e - E x c e l l e n c e
GTS Discussion
I n t e g r i t y - S e r v i c e - E x c e l l e n c e 17
Why OptimizeData Redundancy Over Time amp Space
I n t e g r i t y - S e r v i c e - E x c e l l e n c e 18
LTM OptimizationRequires Electronic Data
Qualitative Analysis
Optimized Network
Data Mgmt bullLegacy Data bullCurrent Data
Decision Framework
Regulatory Buy-in
Cost Analysis
Network Reduction
Network Expansion
Tool InventoryReporting
Spatial Analysis
Temporal Analysis
Validation amp 3 Yr Review
I n t e g r i t y - S e r v i c e - E x c e l l e n c e 19
Technology Description GTS
Determines optimum number placement of wells Optimal sampling frequency Analyzes amp reduces statistical redundancy Typical LTM cost savings 25-50 per site up to $1M
per installation savings are cumulative
-Costs to perform optimization is about 10 of OampM budget -Return on Investment = 1-2 yrs
I n t e g r i t y - S e r v i c e - E x c e l l e n c e 20
Characterization Remediation
LTMInitial
LTMOptimized
LTMlete
Key FeaturesGTS
Characterization MW SamMW Sampplilinngg
NetwNetwororkk Algorithm-based Remediation
DesignLTM
Initial Design
Comp
Review3ndash5 Yr
Exit Strategy-DQOs Met-Goals Achieved
Site Closure
AdjustValidate
LTM Optimized
LTM Complete
Review 3ndash5 Yr
Exit Strategy -DQOs Met -Goals Achieved
Site Closure
AdjustValidate
Unique Features Free public-domain open-source software Wizard-type interface Balance between full-scale expert system amp heuristic model Designed to be run by midlevel analysts
I n t e g r i t y - S e r v i c e - E x c e l l e n c e 21
Other Key Features GTS
Modular design Five modules Prepare Explore Baseline Optimize
Predict Intermediate lsquostoppingrsquo points
Visually focused statistical graphics tables maps Numerous report summaries printed saved or exported
Imports GIS shape files facilitysite boundary flight line roads buildings etc
Geospatial analysis uses Quasi-genetic search algorithm Cost-accuracy tradeoff curves
I n t e g r i t y - S e r v i c e - E x c e l l e n c e 22
Optimization and Prediction Features
Flexible Temporal Optimization Two methods Temporal variograms or iterative thinning Iterative thinning how much data can be removed yet
still reconstruct baseline trends Smart Spatial Optimization Baseline maps are constructed (all data from all wells) Optimized maps (reduced well set) compared to baseline
maps to assess information loss Prediction of new rounds of data Trend and plume anomalies identified
I n t e g r i t y - S e r v i c e - E x c e l l e n c e 23
Software Installation GTS
Installation components - R Statistical suite - Qt GUI tool kit - MatLab Compiler Runtime - MS Visual C++2008 Runtime - SQLite database amp test data set
I n t e g r i t y - S e r v i c e - E x c e l l e n c e
Opening ScreenGTS
I n t e g r i t y - S e r v i c e - E x c e l l e n c e
Algorithm Call-up GTS
I n t e g r i t y - S e r v i c e - E x c e l l e n c e
Water Table Elevation Maps
I n t e g r i t y - S e r v i c e - E x c e l l e n c e 27
Time Series Analysis Outlier Plots
I n t e g r i t y - S e r v i c e - E x c e l l e n c e 28
Non-Linear Baseline Trends Using Locally-Weighted Regression
I n t e g r i t y - S e r v i c e - E x c e l l e n c e 29
Time Series AnalysisFormal Test for Trend
Upper GTS Well Slope Slope Lower Confidence Regulatory Trend Regulatory
Loc ID Trend Type COC Easting Northing Confidence ID (ppbday) Significant Bound (ppb) Limit (ppb) Direction Exceedance
Bound (ppb)
1 1-11A LWQR BA 21548916 15615615 -001212 Yes 67117 99706 2000 DECR NO
3 1-12AR LWQR BA 215291245 15592063 000389 No 310174 370027 2000 FLAT NO
4 1-14AR LWQR BA 2152910235 1544228 -009008 Yes 567928 713658 2000 DECR NO
6 1-1A LWQR BA 21544149 15599095 -005047 Yes 352016 546276 2000 DECR NO
8 1-2A LWQR BA 215420155 15408662 -008807 No 85672 227996 2000 FLAT NO
10 1-3AR LWQR BA 2154225075 153254505 018038 No 685666 98153 2000 FLAT NO
11 1-45AR LWQR BA 2152931795 153158665 000252 No 637983 71293 2000 FLAT NO
14 1-60A LWQR BA 215456777 15634093 -00058 Yes 89459 110438 2000 DECR NO
15 1-62A LWQR BA 215101925 15638267 007904 No 739517 857306 2000 FLAT NO
17 1-62C LWQR BA 215100293 15637841 003207 Yes 457197 525723 2000 INCR NO
18 1-66A LWQR BA 215040163 15334738 -010688 Yes 609988 92866 2000 DECR NO
I n t e g r i t y - S e r v i c e - E x c e l l e n c e 30
Historical Trend Map All Data
I n t e g r i t y - S e r v i c e - E x c e l l e n c e 31
Recent Trend Map Last 4 Years
I n t e g r i t y - S e r v i c e - E x c e l l e n c e 32
Temporal VariogramsHelp Determine Optimal Sampling Interval
I n t e g r i t y - S e r v i c e - E x c e l l e n c e 33
Iterative Thinning SummaryHistogram of Well-Counts vs Optimal Sampling Interval
I n t e g r i t y - S e r v i c e - E x c e l l e n c e 34
Cost-Accuracy Tradeoff CurvesBias Measures Divergence from Baseline Concentrations
Higher Cost = Fewer Wells Removed
I n t e g r i t y - S e r v i c e - E x c e l l e n c e 35
Optimized Network Postplot Essential and Redundant Wells
I n t e g r i t y - S e r v i c e - E x c e l l e n c e 36
Optimized Map Comparison
Baseline (all data) Optimized (reduced wells)
Difference
Map Construction -Uses quantile local regression (QLR) -Smoothing technique developed exclusively for GTS
I n t e g r i t y - S e r v i c e - E x c e l l e n c e 37
Baseline Well Network Adequacy Risk Envelope amp Areas of Uncertainty
I n t e g r i t y - S e r v i c e - E x c e l l e n c e 38
Proposed New Well Locations ldquoGot-to-Haverdquo Wells Retained
I n t e g r i t y - S e r v i c e - E x c e l l e n c e 39
Environmental Decision Information Tracking Tool - EDITT
EDITT Discussion
I n t e g r i t y - S e r v i c e - E x c e l l e n c e 40
EDITT Modules
R2TM ERP-O Recommendations Implementation Status Return on Investment
41I n t e g r i t y - S e r v i c e - E x c e l l e n c e
tr
Environmental Decision Information Tracking Tool (EDITT)
Purpose
Components
Analysis Impact
Mission
Definition
Tools Products
FY07 Number of Systems by Technology
Why EDITT Business Processes WallBarrier System
OxidationReduction 12 2 Enhanced 26 5 AF enterprise database that
Bioremediation 101 20Other 40 8 captures remedial system type
cost and performance Monitored Natural Soil-Vapor Ex action (SVE) 60 12
102
yrs
$12
086
58
$15
480
83
132
yrs
$16
080
30
$16
876
81
27 y
rs
$78
142
24
$75
223
58
248
yrs
$20
991
76
$17
582
24
Attenuation 105 22
LNAPL Recovery 16 Pump amp Treat 133 What Data 283
System amp Technology Inventory and Performance Data
20 y
rs
$15
110
23
$12
805
58
235
yrs
$14
584
62
$20
994
78
System capital construction data System OampM cost life-cycle legal drivers Decision document inventory 1
22
yrs
$17
621
77
$20
340
98
$6195
80
$4173
40
Oxid
ati
on
Re
du
cti
on
yrs
25
Results Better understanding of the number and type of
remediation systems when installed and theOampM cost for each system
Technology trend towards more energy efficient technologies away from the moreactive and longer life-cycle technologies
Pe
rme
ab
le B
arr
ier
Walls
Mo
nit
ore
d N
atu
ral
Att
en
uati
on
LN
AP
L R
eco
ve
ry
Oth
er
Sys
tem
Typ
es
Pu
mp
an
d T
reat
(Pamp
T)
So
il V
ap
or
Extr
acti
on
(S
VE)
En
han
ce
d B
iore
me
dia
tio
n
I n t e g r i t y - S e r v i c e - E x c e l l e n c e 42
Decision Support EDITT
EDITT provides decision-making information on Which systemssites are the risk drivers RODsTI Waivers ndash evaluation for potential revision of RODs
or application for TI Waiver EmergingEvolving Contaminants ndash distribution amp
frequency across the AF
Exit Strategies ndash focus on the process to reach site closure
43
This capability will improve future decision making
I n t e g r i t y - S e r v i c e - E x c e l l e n c e
EDITT ndash System Inventory (SI)
Formerly Remedial Process Optimization (RPO) Inventory and Performance System (RIPS)
Provides an AF-wide inventory of remediation systems and Long-term Monitoring programs
Cost accounting of the OampM of systemsmonitoring and details of system performance are tracked
Assists in prioritization of systems in terms of optimizationpotential
System Inventory must be updated annually Data cut-off is end of FY complete entry by end of CY
44I n t e g r i t y - S e r v i c e - E x c e l l e n c e
Analysis of SI Data
Results of System Inventory (SI) analysis Better understanding of the number and type of remediation
systems and when they were installed Better understanding of OampM cost for each system Technology trend towards more energy efficient technologies Costs for active treatment systems have been reduced Funds better spent on more energy efficient technologies (eg
oxidationreduction and enhanced bioremediation)
Pump ampT
reat
MNA Enhan
ced B
io SVE
Other
LNAPL Recove
ry WallB
arrier
Oxidati
onRed
uction
2005-2007 2000-2004
before 20000 10 20
30 40
50 60
70
80
S
yste
ms
Inst
alle
d
102 yrs $1208658 $1548083
132 yrs $1608030 $1687681
27 yrs $7814224 $7522358
248 yrs $2099176 $1758224
25 yrs $417340
$619580
122 yrs $1762177 $2034098
20 yrs $1511023 $1280558
235 yrs $1458462 $2099478
Permeable Barrier Walls
Monitored Natural Attenuation
LNAPL Recovery
OxidationReduction
Other System Types
Pum p and Treat (PampT)
Soil Vapor Extraction (SVE)
Enhanced Bioremediation
I n t e g r i t y - S e r v i c e - E x c e l l e n c e 45
Performance Tracking Tool (PTT) Cost amp Mass Removed
I n t e g r i t y - S e r v i c e - E x c e l l e n c e
RPO Recommendations Tracking Tool (R2TM)
Track Recommendations (ERP-O Phase IV) Phase II III Track Implementation Risk reduction RC Acceleration Total Investment Cost avoidance ROI
I n t e g r i t y - S e r v i c e - E x c e l l e n c e
Notional (Module by June 2009)
EDITT Land Use Control Institutional Control (LUCIC) Inventory
Includes annual reminder of LUCIC requirements Meets required reporting and OampM requirements The LUCIC Inventory is available in EDITT as a
single web page with the following input Purpose
Components
Analysis Impact
Mission
Definition
Tools Products
LUCIC Module Includes Inventory Graphics
I n t e g r i t y - S e r v i c e - E x c e l l e n c e 48
Analysis of Sustainable Technologies amp Costs EDITT
ERP-O
Challenge
Technology Transfer
Mission
Organization
Emerging Issues
Air Force Restoration Program
Long-Term Monitoring
56 of Total Treat
30 Pump amp Costs
22 of Total Remediation 43 Green
Costs
Enhanced Bioremediation - 58
17 Other- 21
6
OxidationReduction 18 5
Monitored Natural Attenuation - 80
23
LNAPL Recovery - 12 3
Pum p amp Treat - 103 30
Soil-Vapor Extraction (SVE) - 43
13
WallBarrier System 9 3
Soil-Vapor Extraction (SVE) 11
Enhanced Bioremediation
12
WallBarrier System 1
OxidationReduction 6
Monitored Natural Attenuation
9
Other 3
LNAPL Recovery 2
Pump amp Treat 56
System Number by Technology
Percent of Cost by Technology
34
Remediation Systems 66
I n t e g r i t y - S e r v i c e - E x c e l l e n c e 49
Impact of Sustainable Technologies on CTC EDITT
ERP-O
Challenge
Technology Transfer
Mission
Organization
Emerging Issues
235 yrs $1458462
Permeable Barrier Walls
= Average Lifetime OampM Cost
= Average Lifetime Operation
122 yrs $1762177
20 yrs $1511023
$417340
25 yrs
248 yrs $2099176
Monitored Natural Attenuation
LNAPL Recovery
Oxidation Reduction
Other System Types
27 yrs $7814224
Pump and Treat (PampT)
102 yrs $1208658
132 yrs $1608030
Enhanced Bioremediation
Soil Vapor Extraction (SVE)
Based on EDITT Inventory
I n t e g r i t y - S e r v i c e - E x c e l l e n c e 50
Thanks
Discussion
I n t e g r i t y - S e r v i c e - E x c e l l e n c e 51

Groundwater SoilPFOA and PFOS
SoilTERBUFOSSoilTERBACILSoilRADIUM-224SoilMOLINATESoilMETRIBUZINSoilMETOLACHLORSoilHEXAZINONESoilFONOPHOSSoilDIPHENYL ETHER (PHENYLETHER)SoilCYANAZINEGroundwaterPHTHALIC ANHYDRIDEGroundwaterDCPA ACID METABOLITES (a)
Groundwater SoilPBDEsGroundwater Soil4-NONYL PHENOL
MediaConstituent
Groundwater SoilPFOA and PFOS
Soil FENAMIPHOSSoilACETOCHLORSoil3-HYDROOXYCARBOFURANGroundwaterZIRAMGroundwaterETHYLENE THIOUREAGroundwaterACETALDEHYDEGroundwater SoilPERMETHRINGroundwater SoilNITROFENGroundwater SoilMETHAMIDOPHOSGroundwater SoilDICROTOPHOSGroundwater SoilACEPHATEGroundwater Soil2-PROPEN-1-OL
Groundwater SoilPBDEsGroundwater Soil
MediaConstituent2-METHOXYETHANOL
Groundwater SoilPFOA and PFOS
SoilTERBUFOSSoilTERBACILSoilRADIUM-224SoilMOLINATESoilMETRIBUZINSoilMETOLACHLORSoilHEXAZINONESoilFONOPHOSSoilDIPHENYL ETHER (PHENYLETHER)SoilCYANAZINEGroundwaterPHTHALIC ANHYDRIDEGroundwaterDCPA ACID METABOLITES (a)
Groundwater SoilPBDEsGroundwater Soil4-NONYL PHENOL
MediaConstituent
Constituents Not SampledAir-Force Wide Analysis
Constituent Media 2-METHOXYETHANOL Groundwater Soil PBDEs Groundwater Soil PFOA and PFOS Groundwater Soil 2-PROPEN-1-OL Groundwater Soil ACEPHATE Groundwater Soil DICROTOPHOS Groundwater Soil METHAMIDOPHOS Groundwater Soil NITROFEN Groundwater Soil PERMETHRIN Groundwater Soil SULFUR HEXAFLUORIDE Groundwater Soil ETHYLENE THIOUREA Groundwater ZIRAM Groundwater 3-HYDROOXYCARBOFURAN Soil ACETOCHLOR Soil FENAMIPHOS Soil
I n t e g r i t y - S e r v i c e - E x c e l l e n c e 11
Time Series AnalysisTreatment System Analysis
Example Influent TCE Mission St Treatment Facility
300
200
100
0
New System Turned On
93 95 97 99 01 03 YEAR
TCE
(ug
L)
I n t e g r i t y - S e r v i c e - E x c e l l e n c e 12
Statistical Analysis of Individual COCs Air-Force Wide and Installation Level
I n t e g r i t y - S e r v i c e - E x c e l l e n c e 13
GIS amp Anthropogenic Background Analysis of PAHs in Soil
Site and Installation Level
I n t e g r i t y - S e r v i c e - E x c e l l e n c e 14
Elmendorf AFB (3)
Fairchild AFB (4)
Hickam AFB (28)
Malmstrom AFB (1)
Mountain Home AFB (1)
FE Warren AFB (4)
Offutt AFB (1)
Beale AFB (11)
Travis AFB (26)
Vandenberg AFB (24) Edwards AFB (59)
Nellis AFB (1)
Davis-Monthan AFB (2)
Kirtland AFB (3)
Hill AFB (12)
Buckley AFB (2)AFP PJKS (5)
Peterson AFB (1)
Cannon AFB (1)
Holloman AFB (24)
Laughlin AFB (12)
Goodfellow AFB (2)
Randolph AFB (2) Lackland AFB (34)
Sheppard AFB (7) Altus AFB (23)
Barksdale AFB (13)
Little Rock AFB (4)Tinker AFB (1)
Vance AFB (1) McConnell AFB (6)
Whiteman AFB (1)Scott AFB (23)
Columbus AFB (4)Maxwell AFB (1)
Moody AFB (1)
Charleston AFB (4)
Shaw AFB (1)
MacDill AFB (17)
Arnold AFB (5)
Tyndall AFB (8)
Pope AFB (13)
Seymour Johnson AFB (1)
AFP 85 (2)
Langley AFB (7)
Andrews AFB (13)Andrews AFB (13)
McGuire AFB (39)
Massachusetts Military Reservation (MMR) (4)
Andersen AFB (50)
AFP 42 (29)
AFP 44 (1) AFP 06 (3)
AFP 36 (1)
Avon Park AFR (15)
1 2
3 4
6
5
7
8
9
10
Restoration PMO Regions
West East
132
116
98 84
81
32
13 4
AMC AFMC AETC ACC PACAF AFSPC AFDW AFCEEM
Air Force Transformation Initiativeshellip
Sites That Have Not Achieved RIP Regional Analysis
I n t e g r i t y - S e r v i c e - E x c e l l e n c e 15
Cleanup Phase amp Timeline Installation Analysis
I n t e g r i t y - S e r v i c e - E x c e l l e n c e
GTS Discussion
I n t e g r i t y - S e r v i c e - E x c e l l e n c e 17
Why OptimizeData Redundancy Over Time amp Space
I n t e g r i t y - S e r v i c e - E x c e l l e n c e 18
LTM OptimizationRequires Electronic Data
Qualitative Analysis
Optimized Network
Data Mgmt bullLegacy Data bullCurrent Data
Decision Framework
Regulatory Buy-in
Cost Analysis
Network Reduction
Network Expansion
Tool InventoryReporting
Spatial Analysis
Temporal Analysis
Validation amp 3 Yr Review
I n t e g r i t y - S e r v i c e - E x c e l l e n c e 19
Technology Description GTS
Determines optimum number placement of wells Optimal sampling frequency Analyzes amp reduces statistical redundancy Typical LTM cost savings 25-50 per site up to $1M
per installation savings are cumulative
-Costs to perform optimization is about 10 of OampM budget -Return on Investment = 1-2 yrs
I n t e g r i t y - S e r v i c e - E x c e l l e n c e 20
Characterization Remediation
LTMInitial
LTMOptimized
LTMlete
Key FeaturesGTS
Characterization MW SamMW Sampplilinngg
NetwNetwororkk Algorithm-based Remediation
DesignLTM
Initial Design
Comp
Review3ndash5 Yr
Exit Strategy-DQOs Met-Goals Achieved
Site Closure
AdjustValidate
LTM Optimized
LTM Complete
Review 3ndash5 Yr
Exit Strategy -DQOs Met -Goals Achieved
Site Closure
AdjustValidate
Unique Features Free public-domain open-source software Wizard-type interface Balance between full-scale expert system amp heuristic model Designed to be run by midlevel analysts
I n t e g r i t y - S e r v i c e - E x c e l l e n c e 21
Other Key Features GTS
Modular design Five modules Prepare Explore Baseline Optimize
Predict Intermediate lsquostoppingrsquo points
Visually focused statistical graphics tables maps Numerous report summaries printed saved or exported
Imports GIS shape files facilitysite boundary flight line roads buildings etc
Geospatial analysis uses Quasi-genetic search algorithm Cost-accuracy tradeoff curves
I n t e g r i t y - S e r v i c e - E x c e l l e n c e 22
Optimization and Prediction Features
Flexible Temporal Optimization Two methods Temporal variograms or iterative thinning Iterative thinning how much data can be removed yet
still reconstruct baseline trends Smart Spatial Optimization Baseline maps are constructed (all data from all wells) Optimized maps (reduced well set) compared to baseline
maps to assess information loss Prediction of new rounds of data Trend and plume anomalies identified
I n t e g r i t y - S e r v i c e - E x c e l l e n c e 23
Software Installation GTS
Installation components - R Statistical suite - Qt GUI tool kit - MatLab Compiler Runtime - MS Visual C++2008 Runtime - SQLite database amp test data set
I n t e g r i t y - S e r v i c e - E x c e l l e n c e
Opening ScreenGTS
I n t e g r i t y - S e r v i c e - E x c e l l e n c e
Algorithm Call-up GTS
I n t e g r i t y - S e r v i c e - E x c e l l e n c e
Water Table Elevation Maps
I n t e g r i t y - S e r v i c e - E x c e l l e n c e 27
Time Series Analysis Outlier Plots
I n t e g r i t y - S e r v i c e - E x c e l l e n c e 28
Non-Linear Baseline Trends Using Locally-Weighted Regression
I n t e g r i t y - S e r v i c e - E x c e l l e n c e 29
Time Series AnalysisFormal Test for Trend
Upper GTS Well Slope Slope Lower Confidence Regulatory Trend Regulatory
Loc ID Trend Type COC Easting Northing Confidence ID (ppbday) Significant Bound (ppb) Limit (ppb) Direction Exceedance
Bound (ppb)
1 1-11A LWQR BA 21548916 15615615 -001212 Yes 67117 99706 2000 DECR NO
3 1-12AR LWQR BA 215291245 15592063 000389 No 310174 370027 2000 FLAT NO
4 1-14AR LWQR BA 2152910235 1544228 -009008 Yes 567928 713658 2000 DECR NO
6 1-1A LWQR BA 21544149 15599095 -005047 Yes 352016 546276 2000 DECR NO
8 1-2A LWQR BA 215420155 15408662 -008807 No 85672 227996 2000 FLAT NO
10 1-3AR LWQR BA 2154225075 153254505 018038 No 685666 98153 2000 FLAT NO
11 1-45AR LWQR BA 2152931795 153158665 000252 No 637983 71293 2000 FLAT NO
14 1-60A LWQR BA 215456777 15634093 -00058 Yes 89459 110438 2000 DECR NO
15 1-62A LWQR BA 215101925 15638267 007904 No 739517 857306 2000 FLAT NO
17 1-62C LWQR BA 215100293 15637841 003207 Yes 457197 525723 2000 INCR NO
18 1-66A LWQR BA 215040163 15334738 -010688 Yes 609988 92866 2000 DECR NO
I n t e g r i t y - S e r v i c e - E x c e l l e n c e 30
Historical Trend Map All Data
I n t e g r i t y - S e r v i c e - E x c e l l e n c e 31
Recent Trend Map Last 4 Years
I n t e g r i t y - S e r v i c e - E x c e l l e n c e 32
Temporal VariogramsHelp Determine Optimal Sampling Interval
I n t e g r i t y - S e r v i c e - E x c e l l e n c e 33
Iterative Thinning SummaryHistogram of Well-Counts vs Optimal Sampling Interval
I n t e g r i t y - S e r v i c e - E x c e l l e n c e 34
Cost-Accuracy Tradeoff CurvesBias Measures Divergence from Baseline Concentrations
Higher Cost = Fewer Wells Removed
I n t e g r i t y - S e r v i c e - E x c e l l e n c e 35
Optimized Network Postplot Essential and Redundant Wells
I n t e g r i t y - S e r v i c e - E x c e l l e n c e 36
Optimized Map Comparison
Baseline (all data) Optimized (reduced wells)
Difference
Map Construction -Uses quantile local regression (QLR) -Smoothing technique developed exclusively for GTS
I n t e g r i t y - S e r v i c e - E x c e l l e n c e 37
Baseline Well Network Adequacy Risk Envelope amp Areas of Uncertainty
I n t e g r i t y - S e r v i c e - E x c e l l e n c e 38
Proposed New Well Locations ldquoGot-to-Haverdquo Wells Retained
I n t e g r i t y - S e r v i c e - E x c e l l e n c e 39
Environmental Decision Information Tracking Tool - EDITT
EDITT Discussion
I n t e g r i t y - S e r v i c e - E x c e l l e n c e 40
EDITT Modules
R2TM ERP-O Recommendations Implementation Status Return on Investment
41I n t e g r i t y - S e r v i c e - E x c e l l e n c e
tr
Environmental Decision Information Tracking Tool (EDITT)
Purpose
Components
Analysis Impact
Mission
Definition
Tools Products
FY07 Number of Systems by Technology
Why EDITT Business Processes WallBarrier System
OxidationReduction 12 2 Enhanced 26 5 AF enterprise database that
Bioremediation 101 20Other 40 8 captures remedial system type
cost and performance Monitored Natural Soil-Vapor Ex action (SVE) 60 12
102
yrs
$12
086
58
$15
480
83
132
yrs
$16
080
30
$16
876
81
27 y
rs
$78
142
24
$75
223
58
248
yrs
$20
991
76
$17
582
24
Attenuation 105 22
LNAPL Recovery 16 Pump amp Treat 133 What Data 283
System amp Technology Inventory and Performance Data
20 y
rs
$15
110
23
$12
805
58
235
yrs
$14
584
62
$20
994
78
System capital construction data System OampM cost life-cycle legal drivers Decision document inventory 1
22
yrs
$17
621
77
$20
340
98
$6195
80
$4173
40
Oxid
ati
on
Re
du
cti
on
yrs
25
Results Better understanding of the number and type of
remediation systems when installed and theOampM cost for each system
Technology trend towards more energy efficient technologies away from the moreactive and longer life-cycle technologies
Pe
rme
ab
le B
arr
ier
Walls
Mo
nit
ore
d N
atu
ral
Att
en
uati
on
LN
AP
L R
eco
ve
ry
Oth
er
Sys
tem
Typ
es
Pu
mp
an
d T
reat
(Pamp
T)
So
il V
ap
or
Extr
acti
on
(S
VE)
En
han
ce
d B
iore
me
dia
tio
n
I n t e g r i t y - S e r v i c e - E x c e l l e n c e 42
Decision Support EDITT
EDITT provides decision-making information on Which systemssites are the risk drivers RODsTI Waivers ndash evaluation for potential revision of RODs
or application for TI Waiver EmergingEvolving Contaminants ndash distribution amp
frequency across the AF
Exit Strategies ndash focus on the process to reach site closure
43
This capability will improve future decision making
I n t e g r i t y - S e r v i c e - E x c e l l e n c e
EDITT ndash System Inventory (SI)
Formerly Remedial Process Optimization (RPO) Inventory and Performance System (RIPS)
Provides an AF-wide inventory of remediation systems and Long-term Monitoring programs
Cost accounting of the OampM of systemsmonitoring and details of system performance are tracked
Assists in prioritization of systems in terms of optimizationpotential
System Inventory must be updated annually Data cut-off is end of FY complete entry by end of CY
44I n t e g r i t y - S e r v i c e - E x c e l l e n c e
Analysis of SI Data
Results of System Inventory (SI) analysis Better understanding of the number and type of remediation
systems and when they were installed Better understanding of OampM cost for each system Technology trend towards more energy efficient technologies Costs for active treatment systems have been reduced Funds better spent on more energy efficient technologies (eg
oxidationreduction and enhanced bioremediation)
Pump ampT
reat
MNA Enhan
ced B
io SVE
Other
LNAPL Recove
ry WallB
arrier
Oxidati
onRed
uction
2005-2007 2000-2004
before 20000 10 20
30 40
50 60
70
80
S
yste
ms
Inst
alle
d
102 yrs $1208658 $1548083
132 yrs $1608030 $1687681
27 yrs $7814224 $7522358
248 yrs $2099176 $1758224
25 yrs $417340
$619580
122 yrs $1762177 $2034098
20 yrs $1511023 $1280558
235 yrs $1458462 $2099478
Permeable Barrier Walls
Monitored Natural Attenuation
LNAPL Recovery
OxidationReduction
Other System Types
Pum p and Treat (PampT)
Soil Vapor Extraction (SVE)
Enhanced Bioremediation
I n t e g r i t y - S e r v i c e - E x c e l l e n c e 45
Performance Tracking Tool (PTT) Cost amp Mass Removed
I n t e g r i t y - S e r v i c e - E x c e l l e n c e
RPO Recommendations Tracking Tool (R2TM)
Track Recommendations (ERP-O Phase IV) Phase II III Track Implementation Risk reduction RC Acceleration Total Investment Cost avoidance ROI
I n t e g r i t y - S e r v i c e - E x c e l l e n c e
Notional (Module by June 2009)
EDITT Land Use Control Institutional Control (LUCIC) Inventory
Includes annual reminder of LUCIC requirements Meets required reporting and OampM requirements The LUCIC Inventory is available in EDITT as a
single web page with the following input Purpose
Components
Analysis Impact
Mission
Definition
Tools Products
LUCIC Module Includes Inventory Graphics
I n t e g r i t y - S e r v i c e - E x c e l l e n c e 48
Analysis of Sustainable Technologies amp Costs EDITT
ERP-O
Challenge
Technology Transfer
Mission
Organization
Emerging Issues
Air Force Restoration Program
Long-Term Monitoring
56 of Total Treat
30 Pump amp Costs
22 of Total Remediation 43 Green
Costs
Enhanced Bioremediation - 58
17 Other- 21
6
OxidationReduction 18 5
Monitored Natural Attenuation - 80
23
LNAPL Recovery - 12 3
Pum p amp Treat - 103 30
Soil-Vapor Extraction (SVE) - 43
13
WallBarrier System 9 3
Soil-Vapor Extraction (SVE) 11
Enhanced Bioremediation
12
WallBarrier System 1
OxidationReduction 6
Monitored Natural Attenuation
9
Other 3
LNAPL Recovery 2
Pump amp Treat 56
System Number by Technology
Percent of Cost by Technology
34
Remediation Systems 66
I n t e g r i t y - S e r v i c e - E x c e l l e n c e 49
Impact of Sustainable Technologies on CTC EDITT
ERP-O
Challenge
Technology Transfer
Mission
Organization
Emerging Issues
235 yrs $1458462
Permeable Barrier Walls
= Average Lifetime OampM Cost
= Average Lifetime Operation
122 yrs $1762177
20 yrs $1511023
$417340
25 yrs
248 yrs $2099176
Monitored Natural Attenuation
LNAPL Recovery
Oxidation Reduction
Other System Types
27 yrs $7814224
Pump and Treat (PampT)
102 yrs $1208658
132 yrs $1608030
Enhanced Bioremediation
Soil Vapor Extraction (SVE)
Based on EDITT Inventory
I n t e g r i t y - S e r v i c e - E x c e l l e n c e 50
Thanks
Discussion
I n t e g r i t y - S e r v i c e - E x c e l l e n c e 51
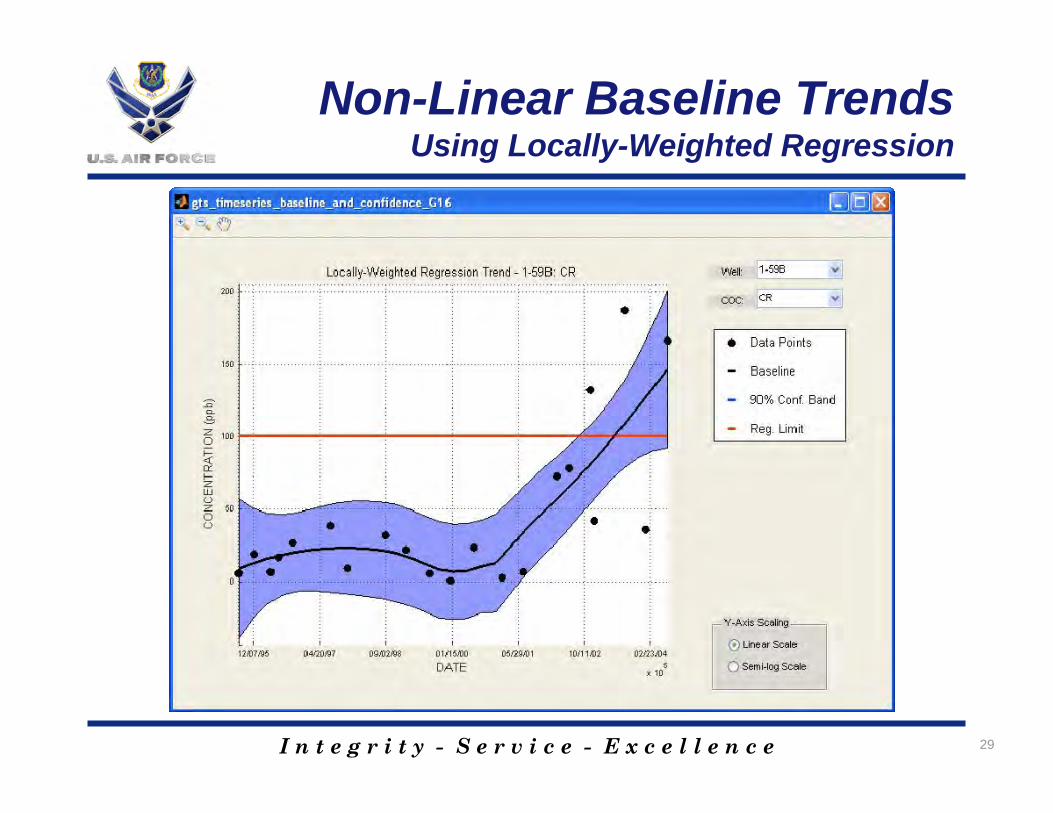

Thanks
Discussion
I n t e g r i t y - S e r v i c e - E x c e l l e n c e 51