Embed Size (px)
Citation preview
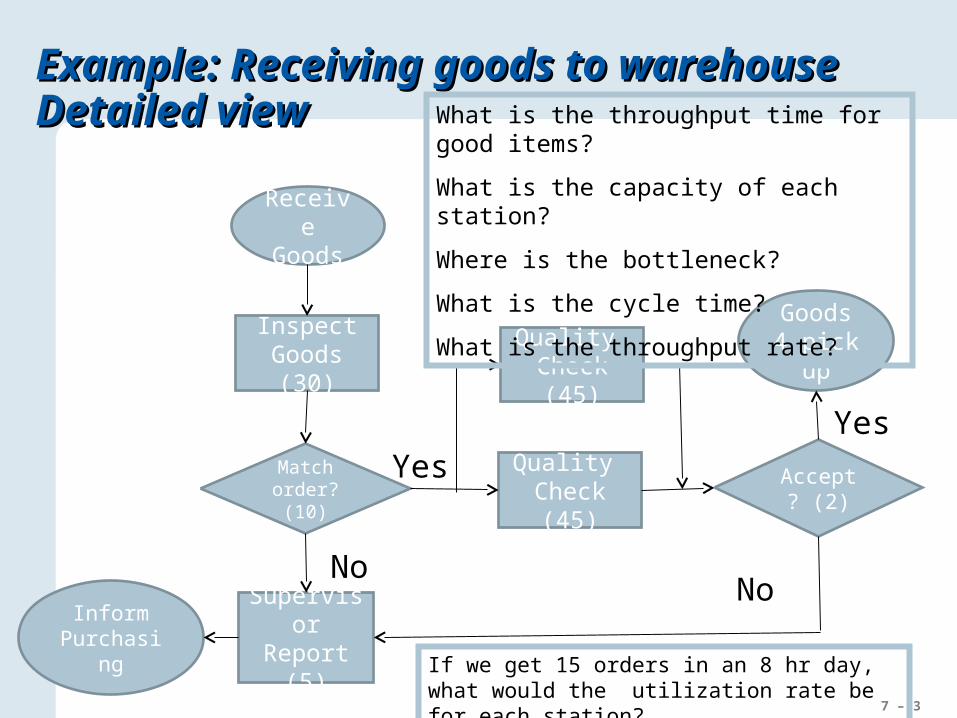
Example: Receiving goods to warehouseExample: Receiving goods to warehouseDetailed viewDetailed view
Receive Goods
Inspect Goods (30)
Match order?
(10)
Supervisor Report (5)
Quality Check (45)
Accept? (2)
Goods 4 pick up
Inform Purchasing
Yes
No
YesNo
What is the throughput time for good items?
What is the capacity of each station?
Where is the bottleneck?
What is the cycle time?
What is the throughput rate?
If there are 15 orders coming in an 8 hr day, what would each stations utilization rate be?
7 – 2
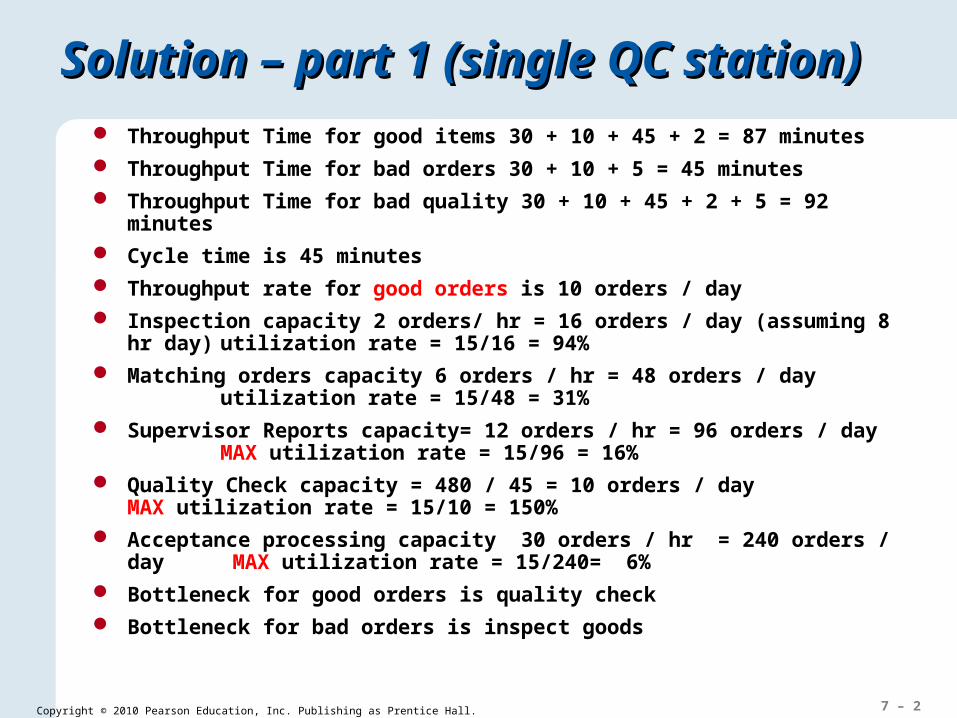
Solution – part 1 (single QC station)Solution – part 1 (single QC station) Throughput Time for good items 30 + 10 + 45 + 2 = 87 minutes
Throughput Time for bad orders 30 + 10 + 5 = 45 minutes
Throughput Time for bad quality 30 + 10 + 45 + 2 + 5 = 92 minutes
Cycle time is 45 minutes
Throughput rate for good orders is 10 orders / day
Inspection capacity 2 orders/ hr = 16 orders / day (assuming 8 hr day)utilization rate = 15/16 = 94%
Matching orders capacity 6 orders / hr = 48 orders / day utilization rate = 15/48 = 31%
Supervisor Reports capacity= 12 orders / hr = 96 orders / dayMAX utilization rate = 15/96 = 16%
Quality Check capacity = 480 / 45 = 10 orders / day MAX utilization rate = 15/10 = 150%
Acceptance processing capacity 30 orders / hr = 240 orders / day MAX utilization rate = 15/240= 6%
Bottleneck for good orders is quality check
Bottleneck for bad orders is inspect goods
Copyright © 2010 Pearson Education, Inc. Publishing as Prentice Hall.
7 – 3
Example: Receiving goods to warehouseExample: Receiving goods to warehouseDetailed viewDetailed view
Receive Goods
Inspect Goods (30)
Match order?
(10)
Supervisor Report (5)
Quality Check (45)
Accept? (2)
Goods 4 pick up
Inform Purchasing
Yes
No
Yes
No
If we get 15 orders in an 8 hr day, what would the utilization rate be for each station?
Quality Check (45)
What is the throughput time for good items?
What is the capacity of each station?
Where is the bottleneck?
What is the cycle time?
What is the throughput rate?
7 – 4
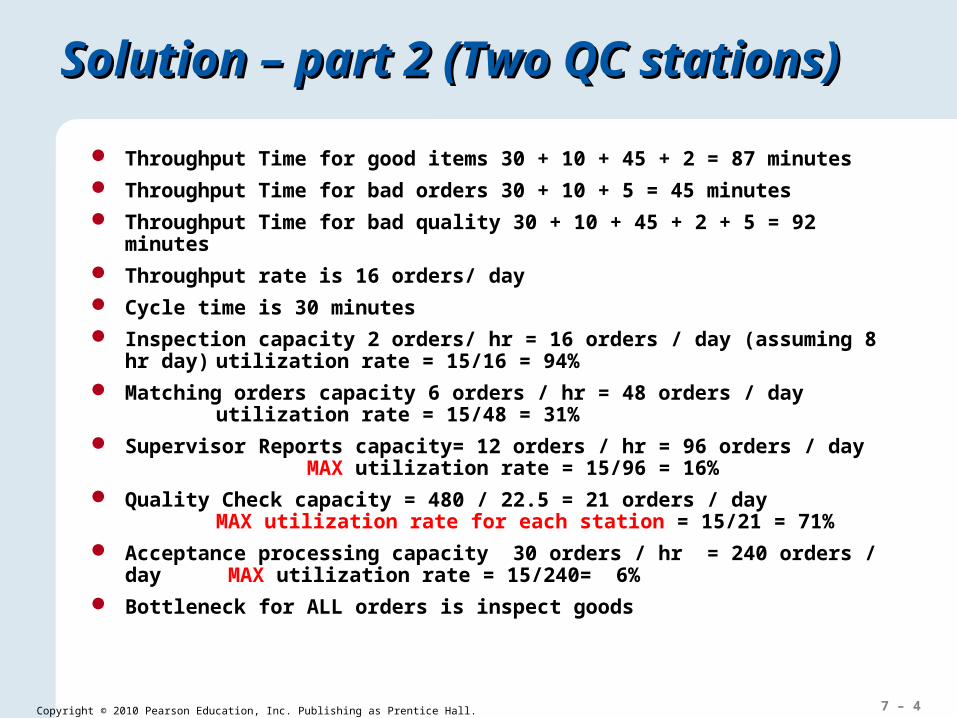
Solution – part 2 (Two QC stations)Solution – part 2 (Two QC stations)
Throughput Time for good items 30 + 10 + 45 + 2 = 87 minutes
Throughput Time for bad orders 30 + 10 + 5 = 45 minutes
Throughput Time for bad quality 30 + 10 + 45 + 2 + 5 = 92 minutes
Throughput rate is 16 orders/ day
Cycle time is 30 minutes
Inspection capacity 2 orders/ hr = 16 orders / day (assuming 8 hr day)utilization rate = 15/16 = 94%
Matching orders capacity 6 orders / hr = 48 orders / day utilization rate = 15/48 = 31%
Supervisor Reports capacity= 12 orders / hr = 96 orders / day MAX utilization rate = 15/96 = 16%
Quality Check capacity = 480 / 22.5 = 21 orders / day MAX utilization rate for each station = 15/21 = 71%
Acceptance processing capacity 30 orders / hr = 240 orders / day MAX utilization rate = 15/240= 6%
Bottleneck for ALL orders is inspect goods
Copyright © 2010 Pearson Education, Inc. Publishing as Prentice Hall.
7 – 5
Chapter 3: Problem 2Chapter 3: Problem 2
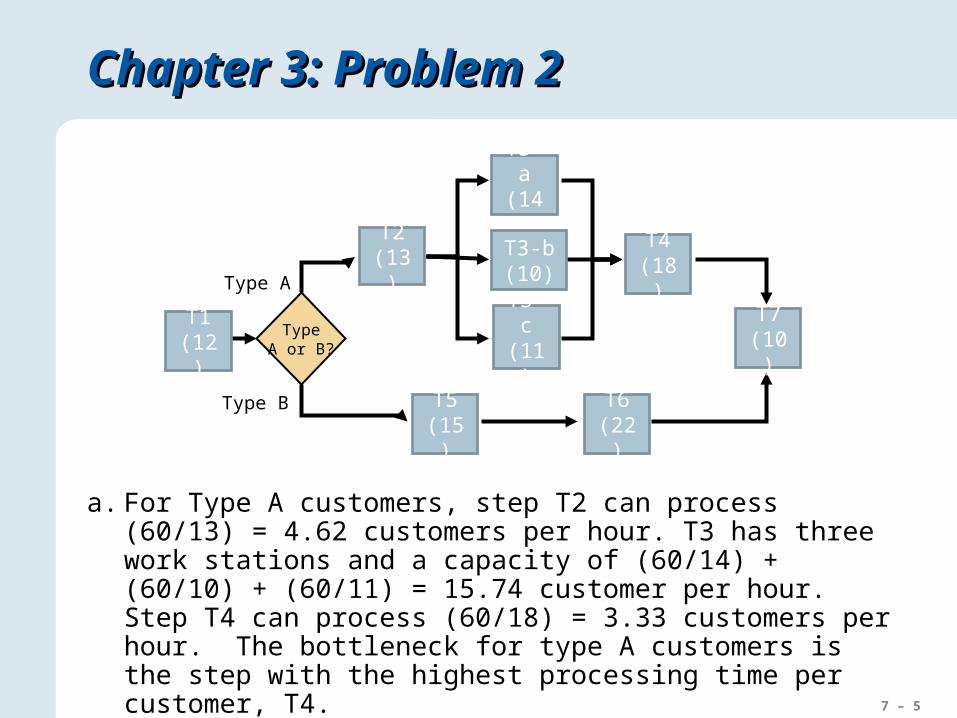
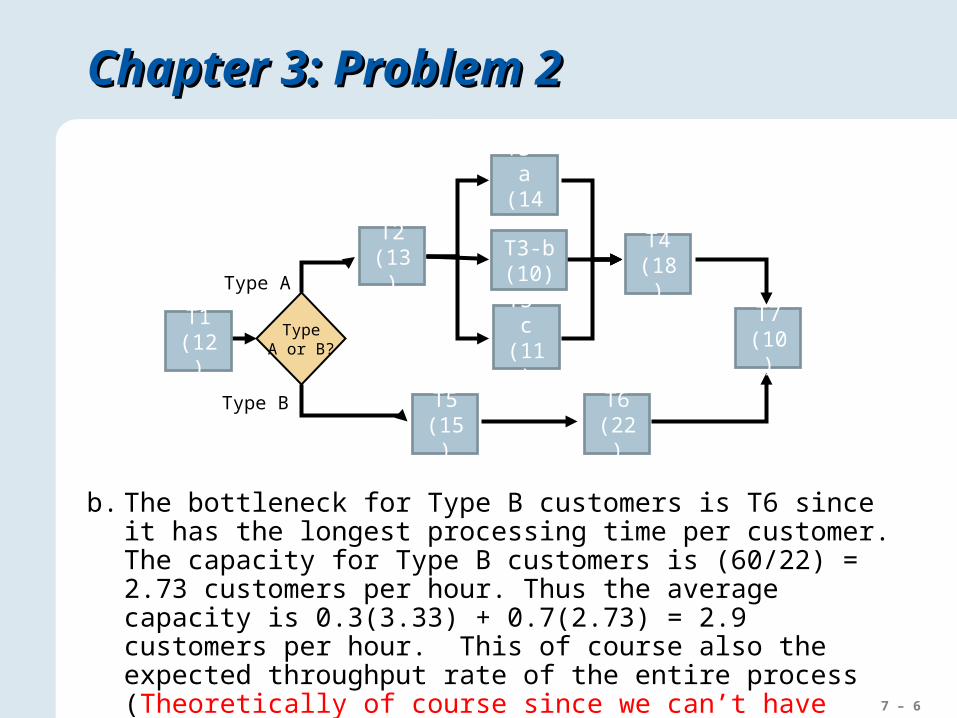
a. For Type A customers, step T2 can process (60/13) = 4.62 customers per hour. T3 has three work stations and a capacity of (60/14) + (60/10) + (60/11) = 15.74 customer per hour. Step T4 can process (60/18) = 3.33 customers per hour. The bottleneck for type A customers is the step with the highest processing time per customer, T4.
TypeA or B?
Type A
Type B
T1(12)
T2(13)
T3-a(14)
T3-b(10)
T3-c(11)
T4(18)
T7(10)
T6(22)
T5(15)
7 – 6
Chapter 3: Problem 2Chapter 3: Problem 2
b. The bottleneck for Type B customers is T6 since it has the longest processing time per customer. The capacity for Type B customers is (60/22) = 2.73 customers per hour. Thus the average capacity is 0.3(3.33) + 0.7(2.73) = 2.9 customers per hour. This of course also the expected throughput rate of the entire process (Theoretically of course since we can’t have partial customers)..
TypeA or B?
Type A
Type B
T1(12)
T2(13)
T3-a(14)
T3-b(10)
T3-c(11)
T4(18)
T7(10)
T6(22)
T5(15)
7 – 7
Chapter 3: Problem 2Chapter 3: Problem 2
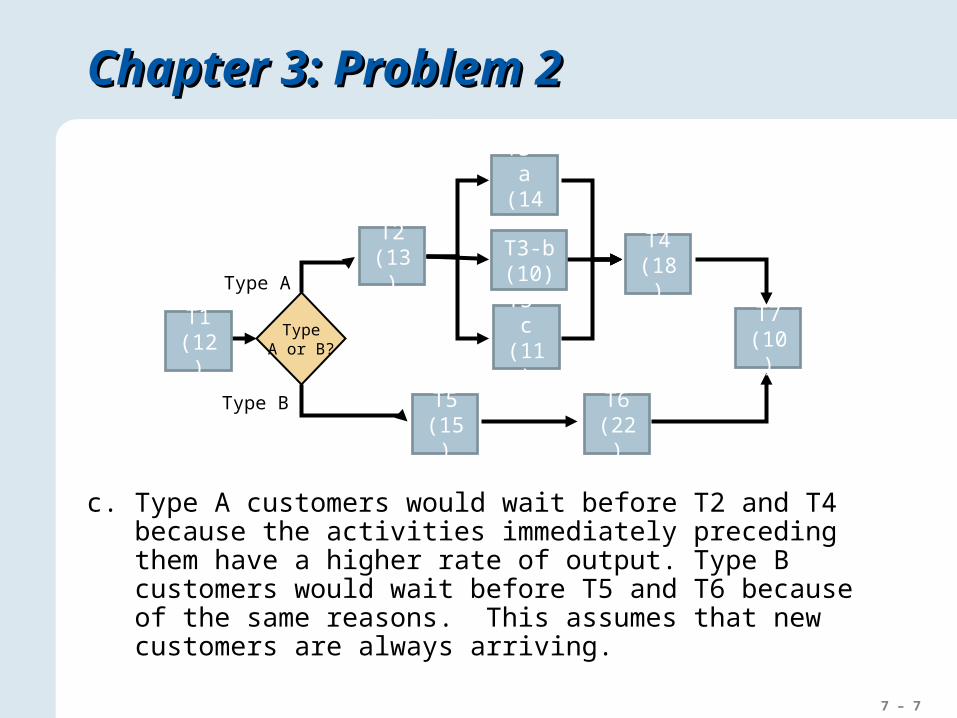
c. Type A customers would wait before T2 and T4 because the activities immediately preceding them have a higher rate of output. Type B customers would wait before T5 and T6 because of the same reasons. This assumes that new customers are always arriving.
TypeA or B?
Type A
Type B
T1(12)
T2(13)
T3-a(14)
T3-b(10)
T3-c(11)
T4(18)
T7(10)
T6(22)
T5(15)
7 – 8Copyright © 2010 Pearson Education, Inc. Publishing as Prentice Hall.
Another type of problem involving Another type of problem involving Parallel Processes Parallel Processes
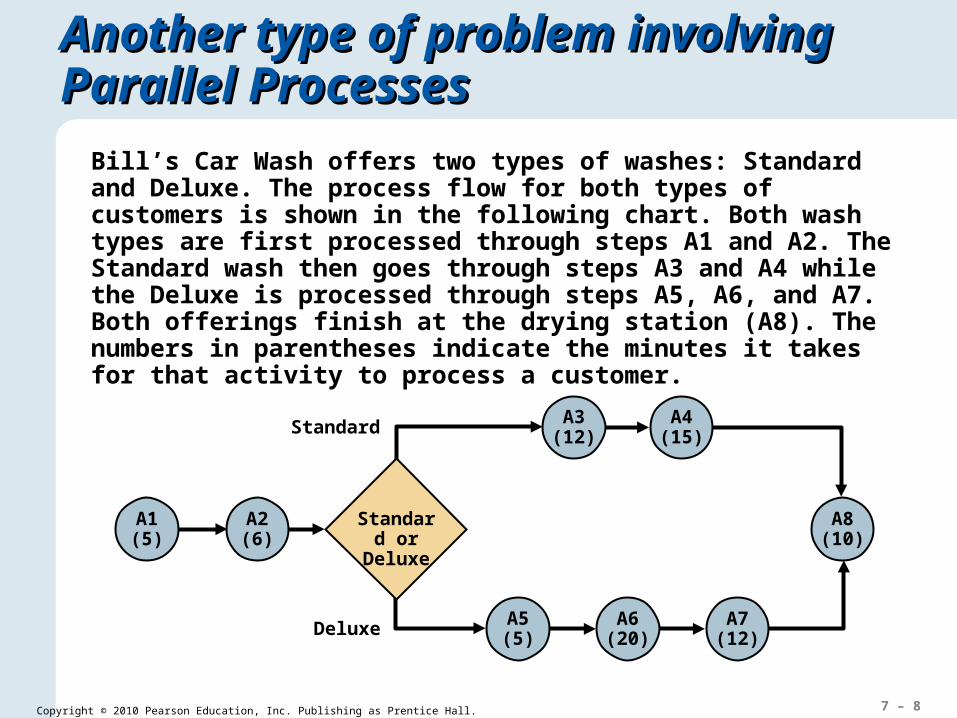
Bill’s Car Wash offers two types of washes: Standard and Deluxe. The process flow for both types of customers is shown in the following chart. Both wash types are first processed through steps A1 and A2. The Standard wash then goes through steps A3 and A4 while the Deluxe is processed through steps A5, A6, and A7. Both offerings finish at the drying station (A8). The numbers in parentheses indicate the minutes it takes for that activity to process a customer.
A8(10)
A7(12)
A6(20)
A5(5)Deluxe
A4(15)
A3(12)Standard
Standard or Deluxe
A2(6)
A1(5)
7 – 9Copyright © 2010 Pearson Education, Inc. Publishing as Prentice Hall.
Another type of problem involving Another type of problem involving Parallel Processes Parallel Processes
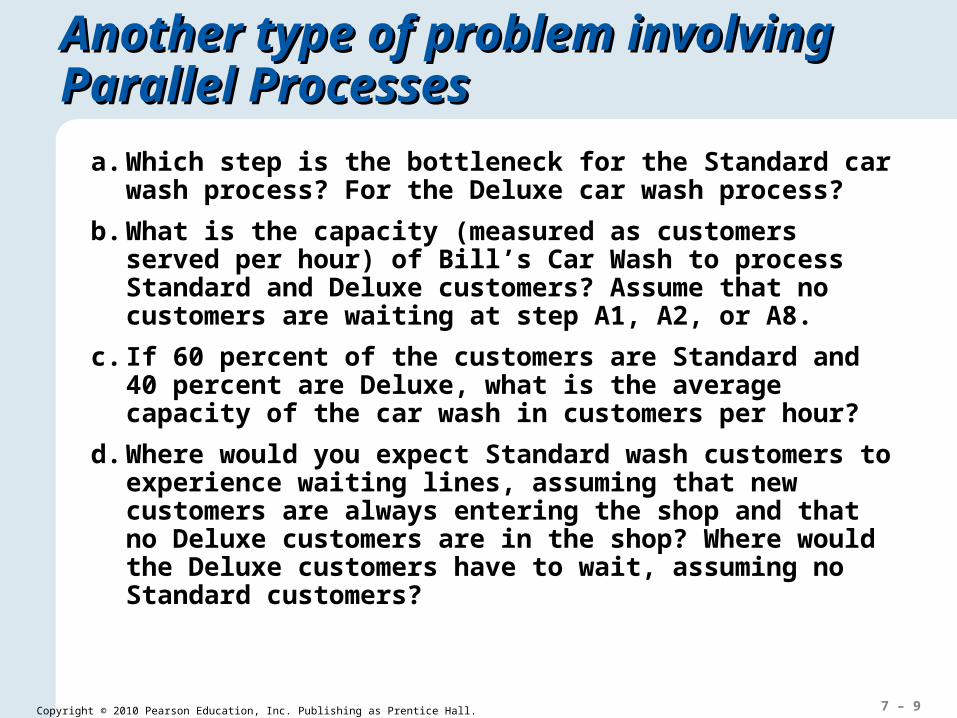
a. Which step is the bottleneck for the Standard car wash process? For the Deluxe car wash process?
b. What is the capacity (measured as customers served per hour) of Bill’s Car Wash to process Standard and Deluxe customers? Assume that no customers are waiting at step A1, A2, or A8.
c. If 60 percent of the customers are Standard and 40 percent are Deluxe, what is the average capacity of the car wash in customers per hour?
d. Where would you expect Standard wash customers to experience waiting lines, assuming that new customers are always entering the shop and that no Deluxe customers are in the shop? Where would the Deluxe customers have to wait, assuming no Standard customers?
7 – 10Copyright © 2010 Pearson Education, Inc. Publishing as Prentice Hall.
Another type of problem involving Another type of problem involving Parallel Processes Parallel Processes
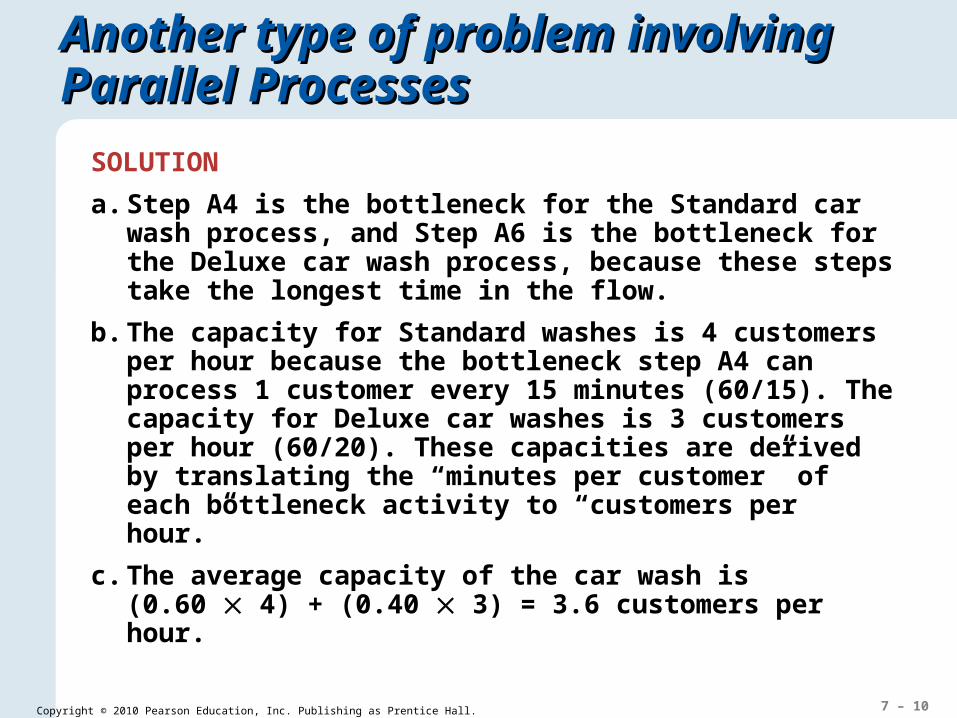
SOLUTION
a. Step A4 is the bottleneck for the Standard car wash process, and Step A6 is the bottleneck for the Deluxe car wash process, because these steps take the longest time in the flow.
b. The capacity for Standard washes is 4 customers per hour because the bottleneck step A4 can process 1 customer every 15 minutes (60/15). The capacity for Deluxe car washes is 3 customers per hour (60/20). These capacities are derived by translating the “minutes per customer” of each bottleneck activity to “customers per hour.”
c. The average capacity of the car wash is (0.60 4) + (0.40 3) = 3.6 customers per hour.
7 – 11Copyright © 2010 Pearson Education, Inc. Publishing as Prentice Hall.
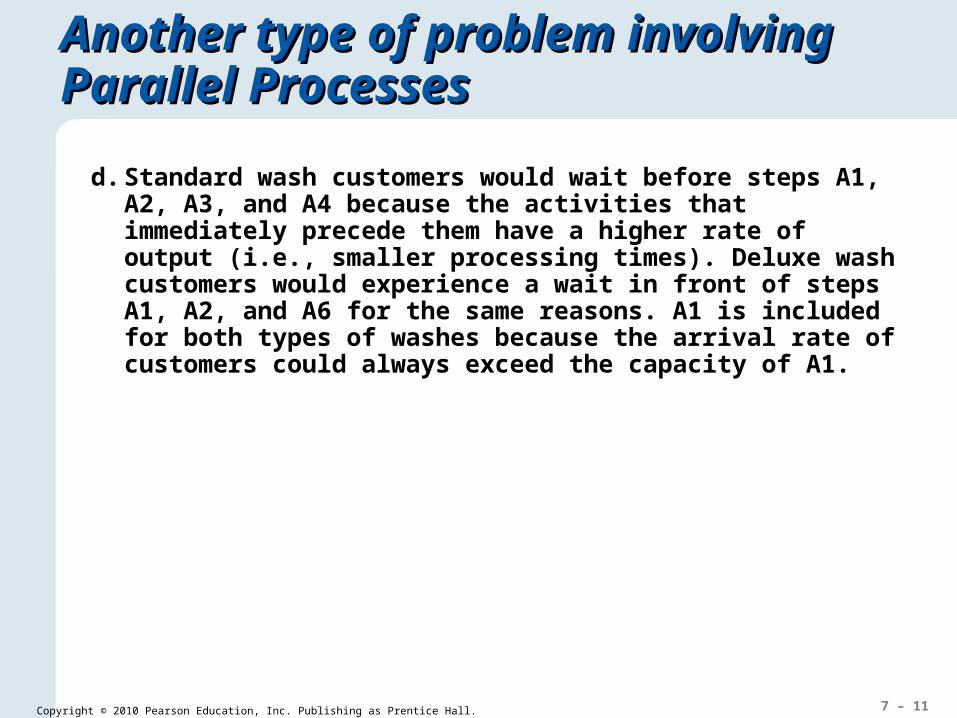
Another type of problem involving Another type of problem involving Parallel Processes Parallel Processes
d. Standard wash customers would wait before steps A1, A2, A3, and A4 because the activities that immediately precede them have a higher rate of output (i.e., smaller processing times). Deluxe wash customers would experience a wait in front of steps A1, A2, and A6 for the same reasons. A1 is included for both types of washes because the arrival rate of customers could always exceed the capacity of A1.

7 – 12
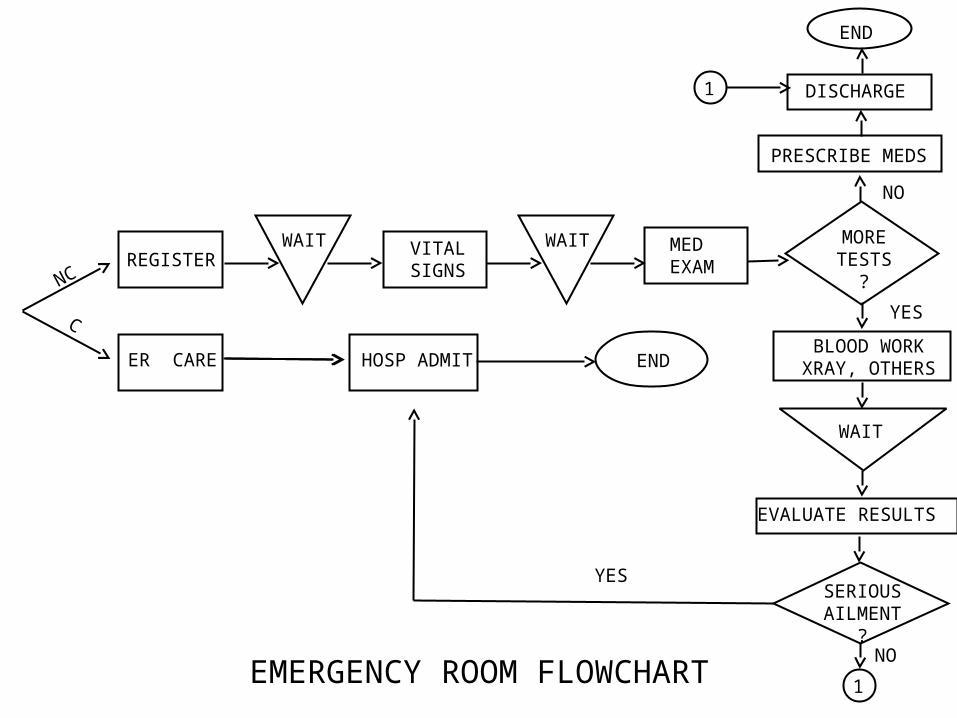
In class Exercise: Emergency Room In class Exercise: Emergency Room CaseCase
The first thing patients do when they arrive into an emergency room is register with the front desk unless it is a life threatening condition that requires immediate attention. Those are taken immediately inside to one of the exam rooms where they receive care from the ER doctor and nurses to stabilize them. Almost all of these patients will be admitted to the hospital for further tests, observation, or surgery. The non-critical patients have to wait in a lounge until one of the exam rooms empties at which time a nurse invites them in, takes down their vital signs (blood pressure, temperature, heart rate) and then she documents their ailment. At their leisure the ER doctor comes in examines the patient and either orders more tests or prescribes medication and releases the patient. Those requiring more tests have to wait for the test results from the lab or radiology before receiving further treatment. Some of those patients are released while others are admitted to the hospital. Patients released have to settle their bills before heading home.
REGISTER
ER CARE
NC
C
WAIT WAITVITALSIGNS
MEDEXAM
MORETESTS
?
HOSP ADMIT END
DISCHARGE
END
YES
1
1
BLOOD WORKXRAY, OTHERS
WAIT
SERIOUSAILMENT
?
EMERGENCY ROOM FLOWCHARTNO
YES
EVALUATE RESULTS
PRESCRIBE MEDS
NO
REG
MEDEXAM
MORETESTS
END
NO
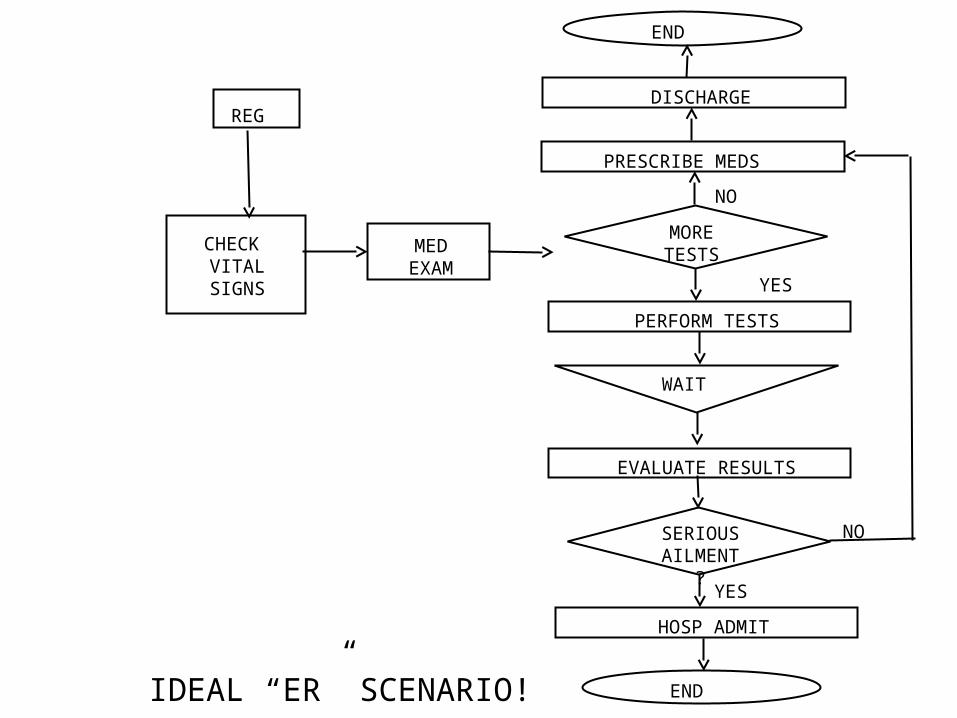
IDEAL “ER” SCENARIO!
DISCHARGE
PERFORM TESTS
PRESCRIBE MEDS
WAIT
EVALUATE RESULTS
SERIOUSAILMENT
?
HOSP ADMIT
END
YES
CHECK VITALSIGNS YES
NO
Process Throughput Time ReductionProcess Throughput Time Reduction
Perform activities in parallel
Change the sequence of activities
Reduce interruptions
7 – 16
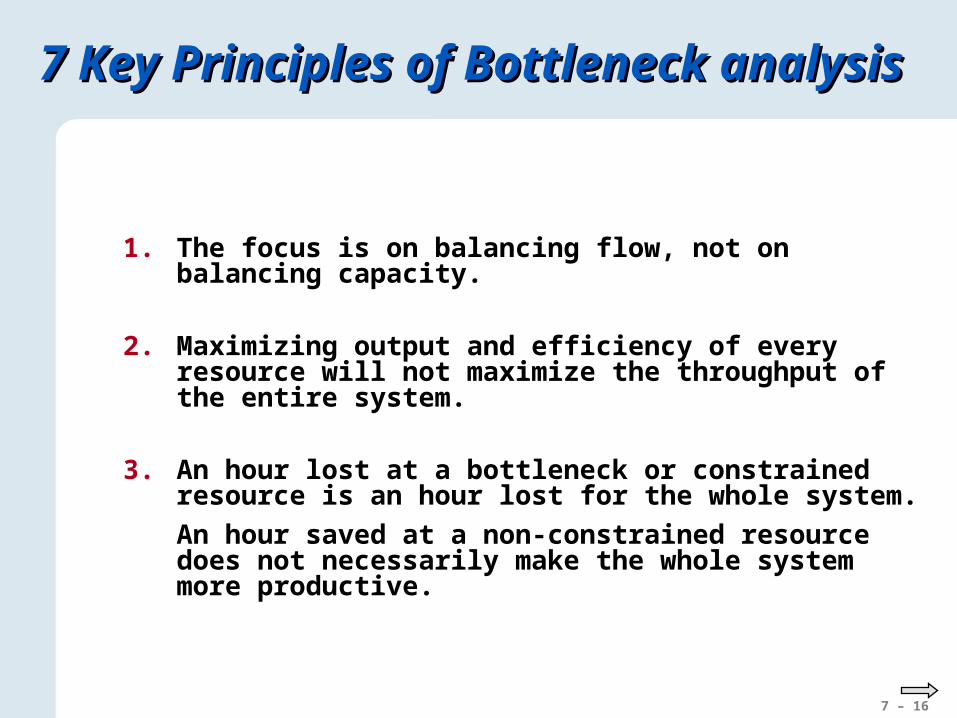
7 Key Principles of Bottleneck analysis7 Key Principles of Bottleneck analysis
1. The focus is on balancing flow, not on balancing capacity.
2. Maximizing output and efficiency of every resource will not maximize the throughput of the entire system.
3. An hour lost at a bottleneck or constrained resource is an hour lost for the whole system.
An hour saved at a non-constrained resource does not necessarily make the whole system more productive.
7 – 17
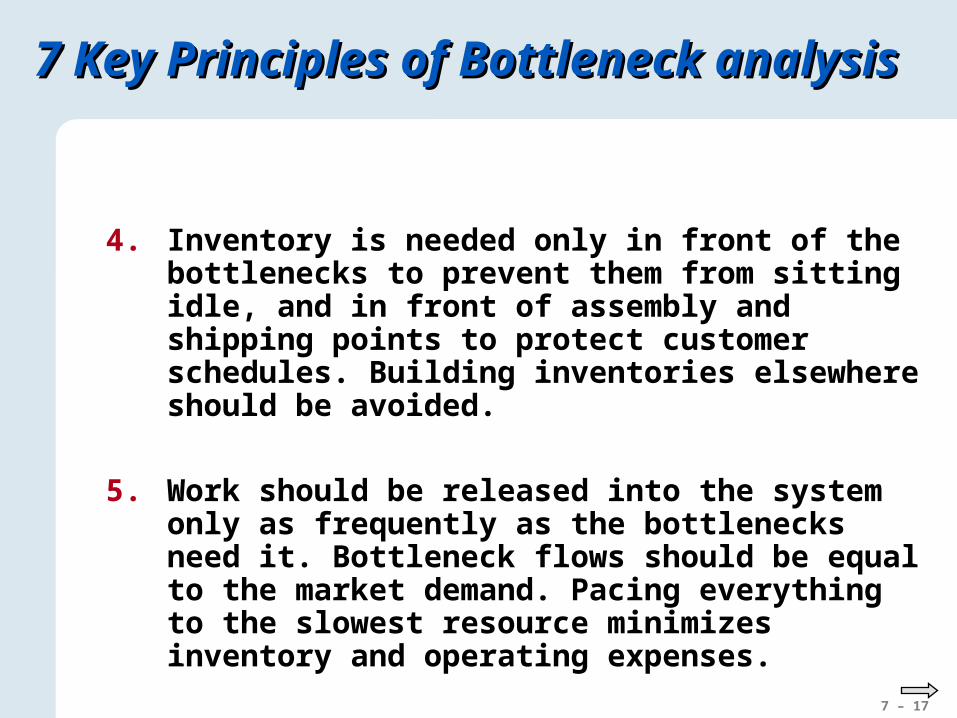
7 Key Principles of Bottleneck analysis7 Key Principles of Bottleneck analysis
4. Inventory is needed only in front of the bottlenecks to prevent them from sitting idle, and in front of assembly and shipping points to protect customer schedules. Building inventories elsewhere should be avoided.
5. Work should be released into the system only as frequently as the bottlenecks need it. Bottleneck flows should be equal to the market demand. Pacing everything to the slowest resource minimizes inventory and operating expenses.
7 – 18
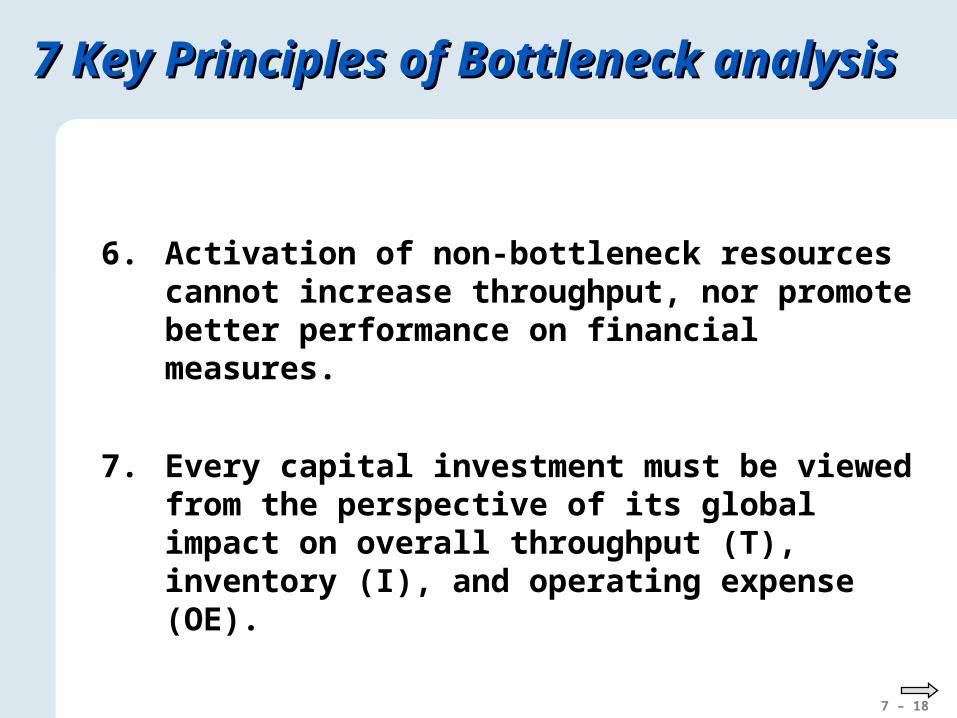
7 Key Principles of Bottleneck analysis7 Key Principles of Bottleneck analysis
6. Activation of non-bottleneck resources cannot increase throughput, nor promote better performance on financial measures.
7. Every capital investment must be viewed from the perspective of its global impact on overall throughput (T), inventory (I), and operating expense (OE).
7 – 19
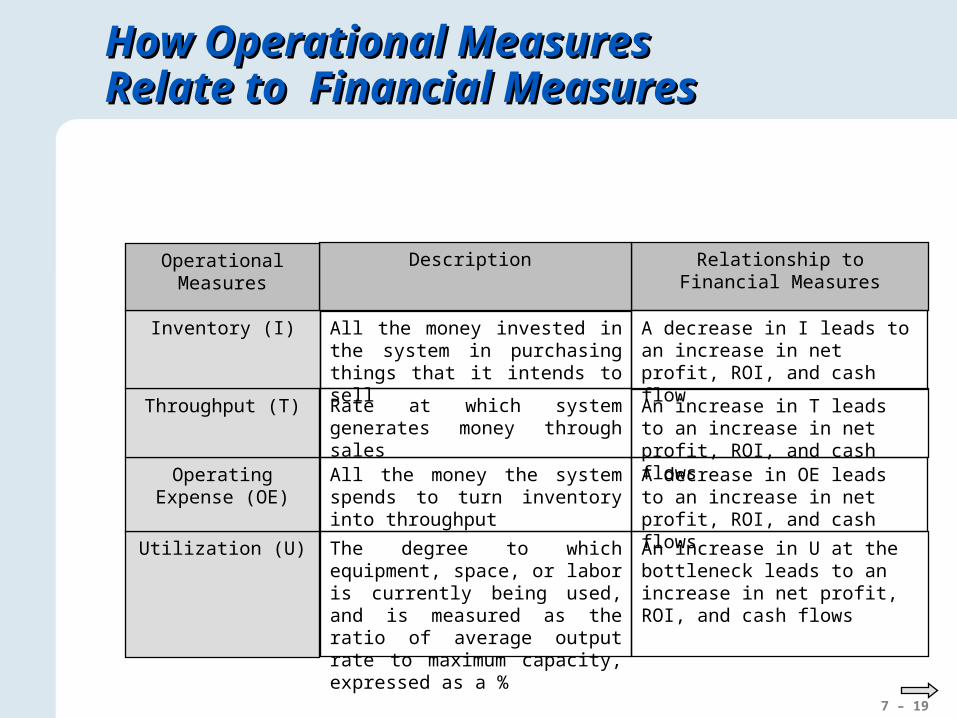
How Operational Measures How Operational Measures Relate to Financial MeasuresRelate to Financial Measures
Relationship to Financial Measures
Description
Utilization (U)
Operating Expense (OE)
Throughput (T)
Inventory (I)
Operational Measures
A decrease in OE leads to an increase in net profit, ROI, and cash flows
An increase in U at the bottleneck leads to an increase in net profit, ROI, and cash flows
An increase in T leads to an increase in net profit, ROI, and cash flows
A decrease in I leads to an increase in net profit, ROI, and cash flow
The degree to which equipment, space, or labor is currently being used, and is measured as the ratio of average output rate to maximum capacity, expressed as a %
All the money the system spends to turn inventory into throughput
Rate at which system generates money through sales
All the money invested in the system in purchasing things that it intends to sell

Constraint Management – Making Constraint Management – Making product choices using bottleneck product choices using bottleneck analysisanalysis
Copyright © 2010 Pearson Education, Inc. Publishing as Prentice Hall.
Copyright © 2010 Pearson Education, Inc. Publishing as Prentice Hall.
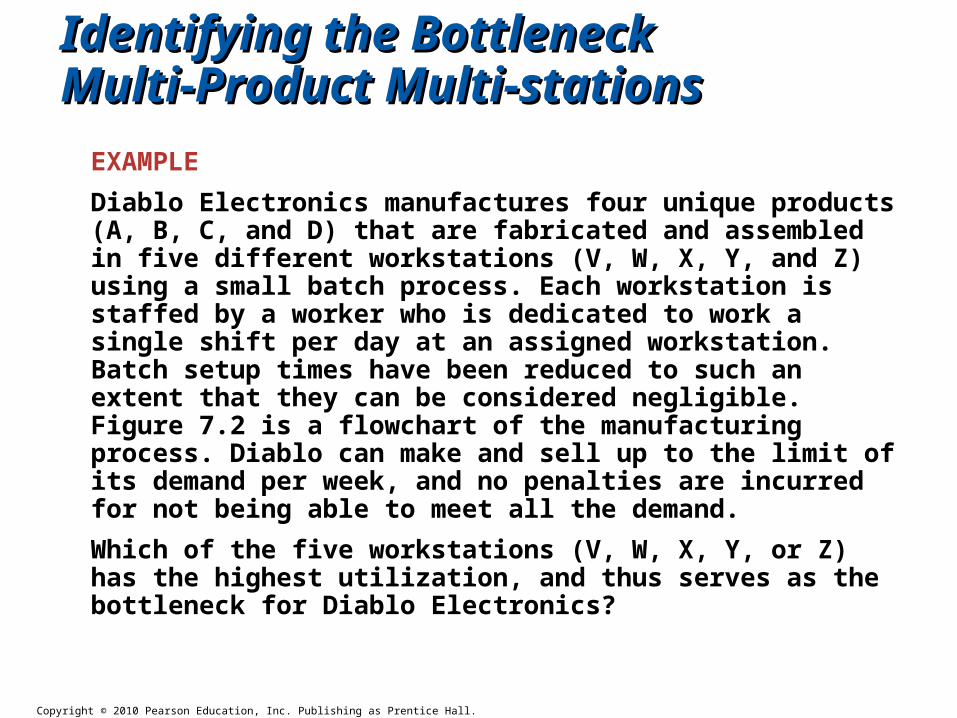
Identifying the BottleneckIdentifying the BottleneckMulti-Product Multi-stationsMulti-Product Multi-stations
EXAMPLE
Diablo Electronics manufactures four unique products (A, B, C, and D) that are fabricated and assembled in five different workstations (V, W, X, Y, and Z) using a small batch process. Each workstation is staffed by a worker who is dedicated to work a single shift per day at an assigned workstation. Batch setup times have been reduced to such an extent that they can be considered negligible. Figure 7.2 is a flowchart of the manufacturing process. Diablo can make and sell up to the limit of its demand per week, and no penalties are incurred for not being able to meet all the demand.
Which of the five workstations (V, W, X, Y, or Z) has the highest utilization, and thus serves as the bottleneck for Diablo Electronics?
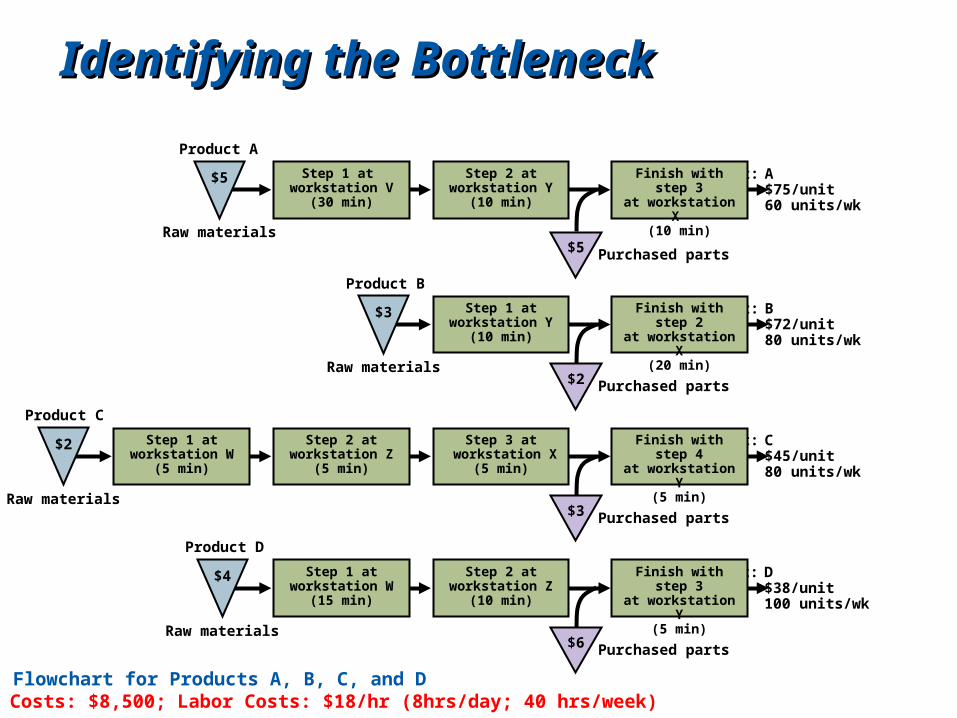
Identifying the BottleneckIdentifying the Bottleneck
Product A
$5Raw materials
Purchased parts
Product: APrice: $75/unitDemand: 60 units/wk
Step 1 at workstation V
(30 min)
Finish with step 3at workstation X
(10 min)
Step 2 atworkstation Y
(10 min)
$5
Product C
Raw materialsPurchased parts
Product: CPrice: $45/unitDemand: 80 units/wk
Finish with step 4at workstation Y
(5 min)
Step 2 atworkstation Z
(5 min)
Step 3 at workstation X
(5 min)
Step 1 atworkstation W
(5 min)
$2
$3
Product B
Raw materialsPurchased parts
Product: BPrice: $72/unitDemand: 80 units/wk
Finish with step 2at workstation X
(20 min)
Step 1 atworkstation Y
(10 min)
$3
$2
Product D
Raw materialsPurchased parts
Product: DPrice: $38/unitDemand: 100 units/wk
$4 Step 2 atworkstation Z
(10 min)
Finish with step 3at workstation Y
(5 min)
Step 1 atworkstation W
(15 min)
$6
Flowchart for Products A, B, C, and DOverhead Costs: $8,500; Labor Costs: $18/hr (8hrs/day; 40 hrs/week)
Copyright © 2010 Pearson Education, Inc. Publishing as Prentice Hall.
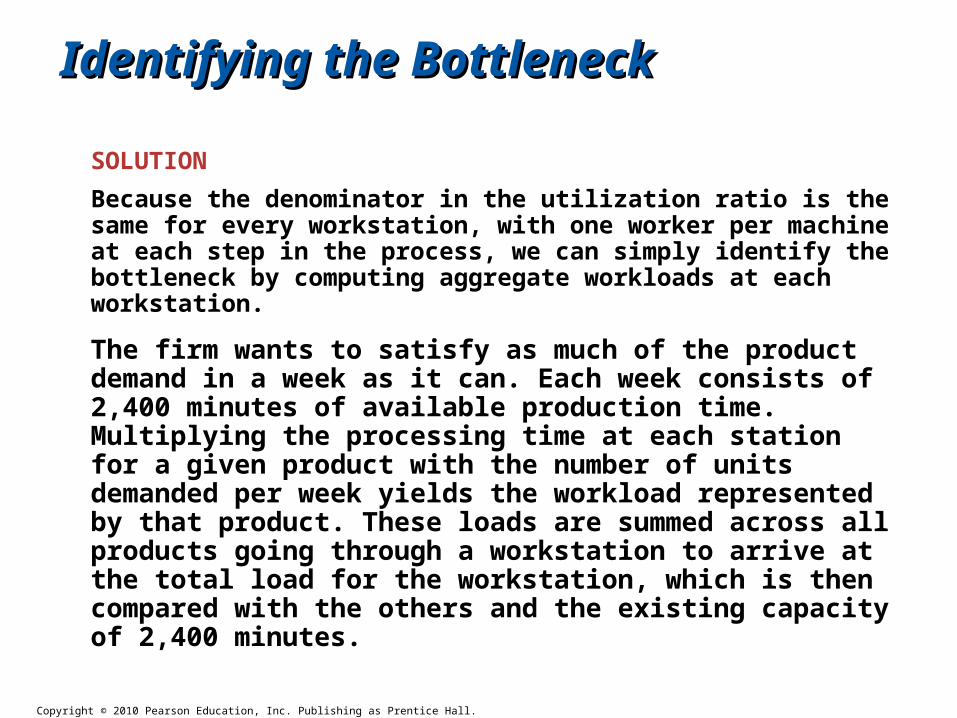
Identifying the BottleneckIdentifying the Bottleneck
SOLUTION
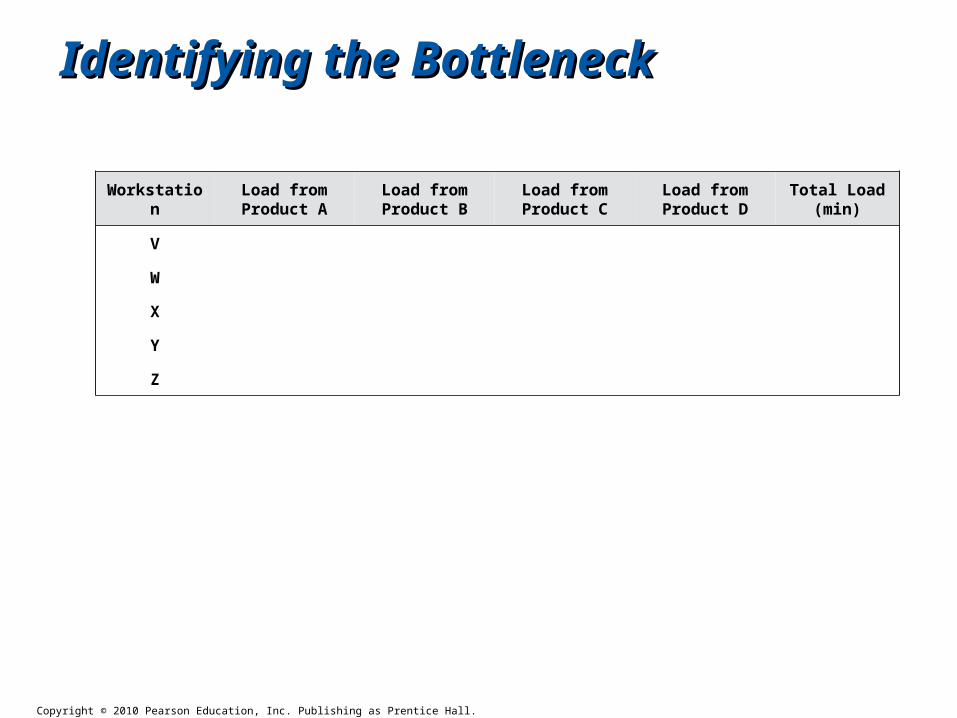
Because the denominator in the utilization ratio is the same for every workstation, with one worker per machine at each step in the process, we can simply identify the bottleneck by computing aggregate workloads at each workstation.
The firm wants to satisfy as much of the product demand in a week as it can. Each week consists of 2,400 minutes of available production time. Multiplying the processing time at each station for a given product with the number of units demanded per week yields the workload represented by that product. These loads are summed across all products going through a workstation to arrive at the total load for the workstation, which is then compared with the others and the existing capacity of 2,400 minutes.
Copyright © 2010 Pearson Education, Inc. Publishing as Prentice Hall.
WorkstationLoad from Product A
Load from Product B
Load from Product C
Load from Product D
Total Load (min)
V
W
X
Y
Z
Identifying the BottleneckIdentifying the Bottleneck
Copyright © 2010 Pearson Education, Inc. Publishing as Prentice Hall.
Identifying the BottleneckIdentifying the Bottleneck
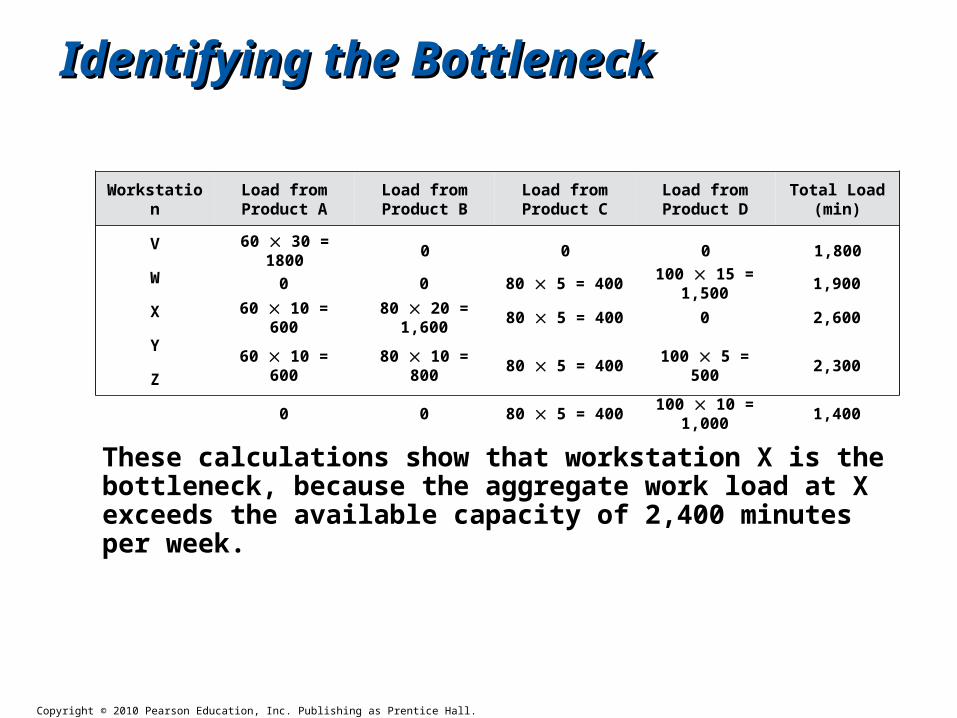
These calculations show that workstation X is the bottleneck, because the aggregate work load at X exceeds the available capacity of 2,400 minutes per week.
60 30 = 1800 0 0 0 1,800
0 0 80 5 = 400100 15 =
1,5001,900
60 10 = 600 80 20 = 1,600 80 5 = 400 0 2,600
60 10 = 600 80 10 = 800 80 5 = 400 100 5 = 500 2,300
0 0 80 5 = 400100 10 =
1,0001,400
WorkstationLoad from Product A
Load from Product B
Load from Product C
Load from Product D
Total Load (min)
V
W
X
Y
Z
Copyright © 2010 Pearson Education, Inc. Publishing as Prentice Hall.
Determining the Product MixDetermining the Product Mix
Pedro Rodriguez, the newly hired production supervisor, is knowledgeable about the theory of constraints and bottleneck-based scheduling. He believes that profitability can indeed be improved if bottleneck resources were exploited to determine the product mix. What is the change in profits if, instead of the traditional method used by Diablo Electronics, the bottleneck method advocated by Pedro is used to select the product mix?
SOLUTION
Decision Rule 1: Traditional Method
Select the best product mix according to the highest overall contribution margin of each product.
Copyright © 2010 Pearson Education, Inc. Publishing as Prentice Hall.
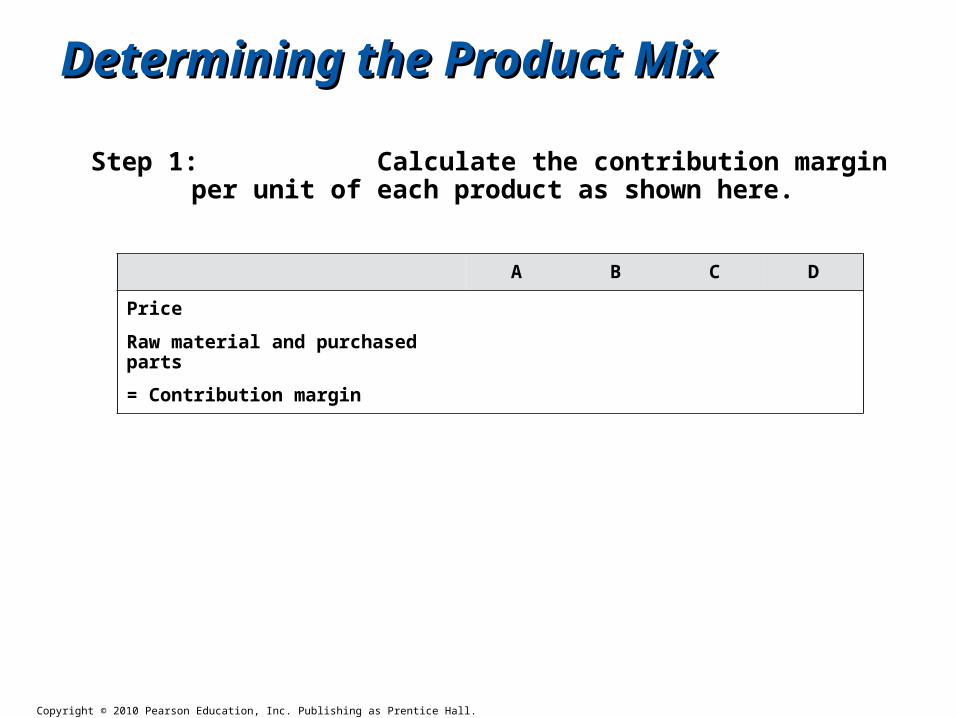
Determining the Product MixDetermining the Product Mix
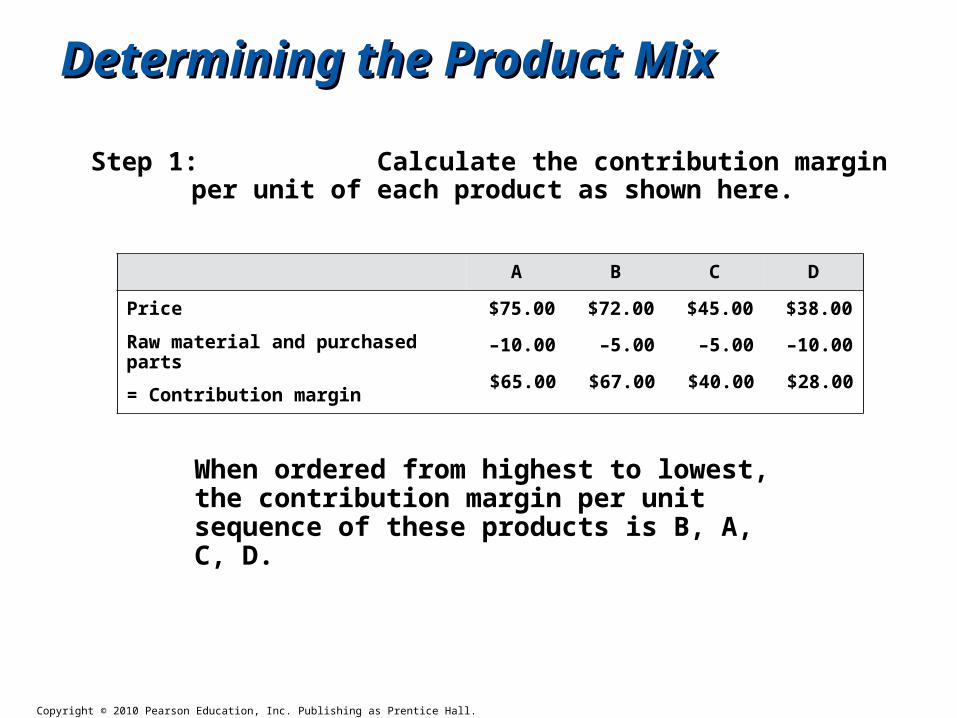
Step 1: Calculate the contribution margin per unit of each product as shown here.
A B C D
Price
Raw material and purchased parts
= Contribution margin
Copyright © 2010 Pearson Education, Inc. Publishing as Prentice Hall.
Determining the Product MixDetermining the Product Mix
Step 1: Calculate the contribution margin per unit of each product as shown here.
When ordered from highest to lowest, the contribution margin per unit sequence of these products is B, A, C, D.
$75.00 $72.00 $45.00 $38.00
–10.00 –5.00 –5.00 –10.00
$65.00 $67.00 $40.00 $28.00
A B C D
Price
Raw material and purchased parts
= Contribution margin
Copyright © 2010 Pearson Education, Inc. Publishing as Prentice Hall.
Determining the Product MixDetermining the Product Mix
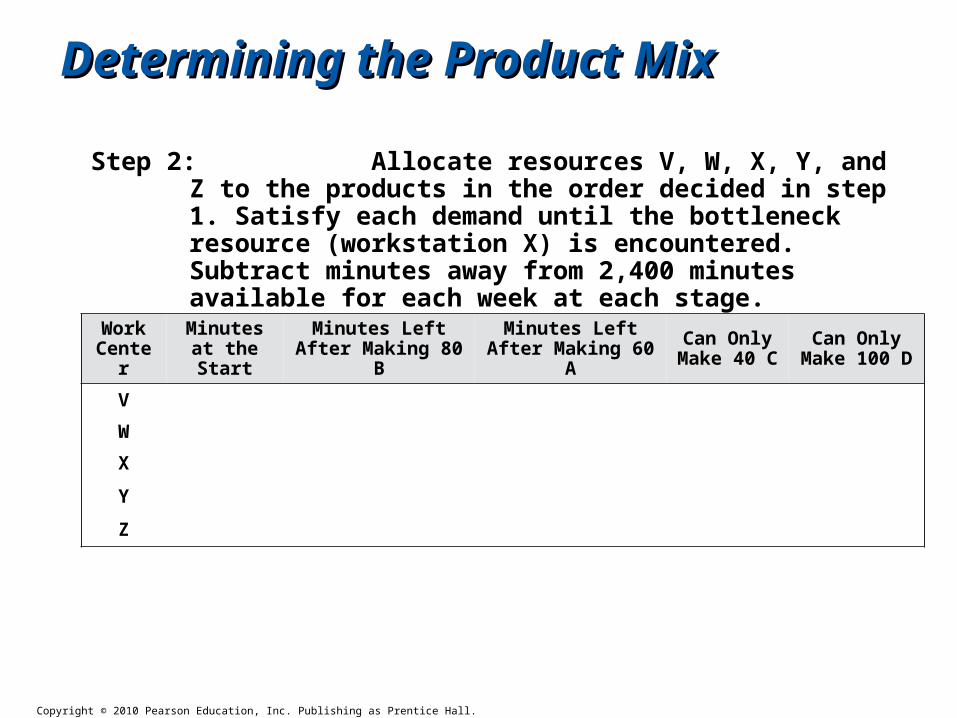
Step 2: Allocate resources V, W, X, Y, and Z to the products in the order decided in step 1. Satisfy each demand until the bottleneck resource (workstation X) is encountered. Subtract minutes away from 2,400 minutes available for each week at each stage.
Work Center
Minutes at the Start
Minutes Left After Making 80 B
Minutes Left After Making 60 A
Can Only Make 40 C
Can Only Make 100 D
V
W
X
Y
Z
Copyright © 2010 Pearson Education, Inc. Publishing as Prentice Hall.
Determining the Product MixDetermining the Product Mix
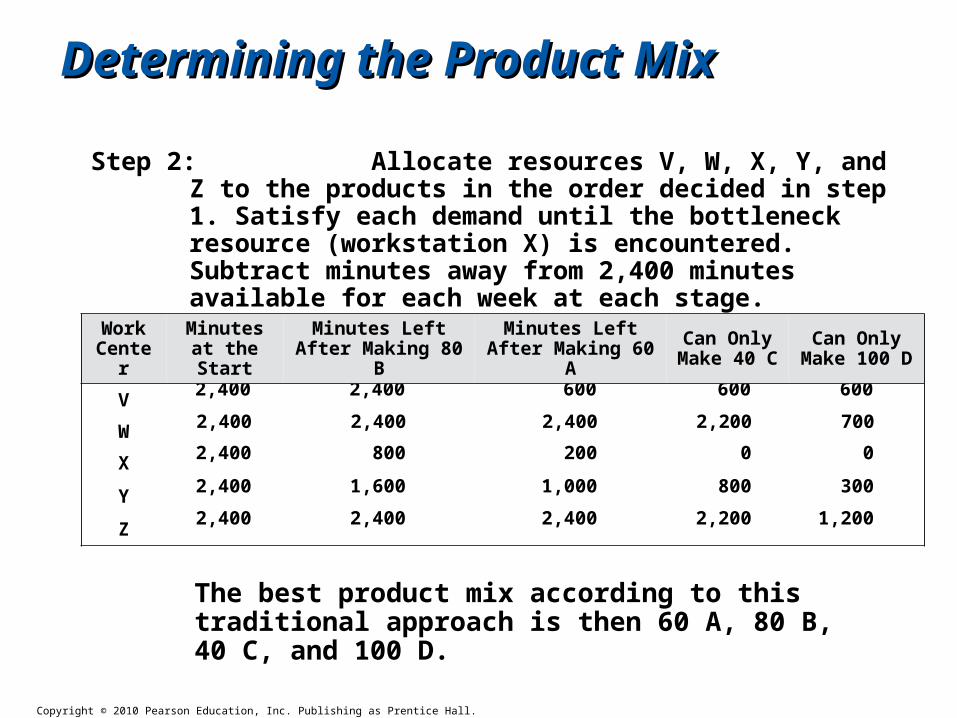
Step 2: Allocate resources V, W, X, Y, and Z to the products in the order decided in step 1. Satisfy each demand until the bottleneck resource (workstation X) is encountered. Subtract minutes away from 2,400 minutes available for each week at each stage.
The best product mix according to this traditional approach is then 60 A, 80 B, 40 C, and 100 D.
2,400 2,400 600 600 600
2,400 2,400 2,400 2,200 700
2,400 800 200 0 0
2,400 1,600 1,000 800 300
2,400 2,400 2,400 2,200 1,200
Work Center
Minutes at the Start
Minutes Left After Making 80 B
Minutes Left After Making 60 A
Can Only Make 40 C
Can Only Make 100 D
V
W
X
Y
Z
Copyright © 2010 Pearson Education, Inc. Publishing as Prentice Hall.
Determining the Product MixDetermining the Product Mix
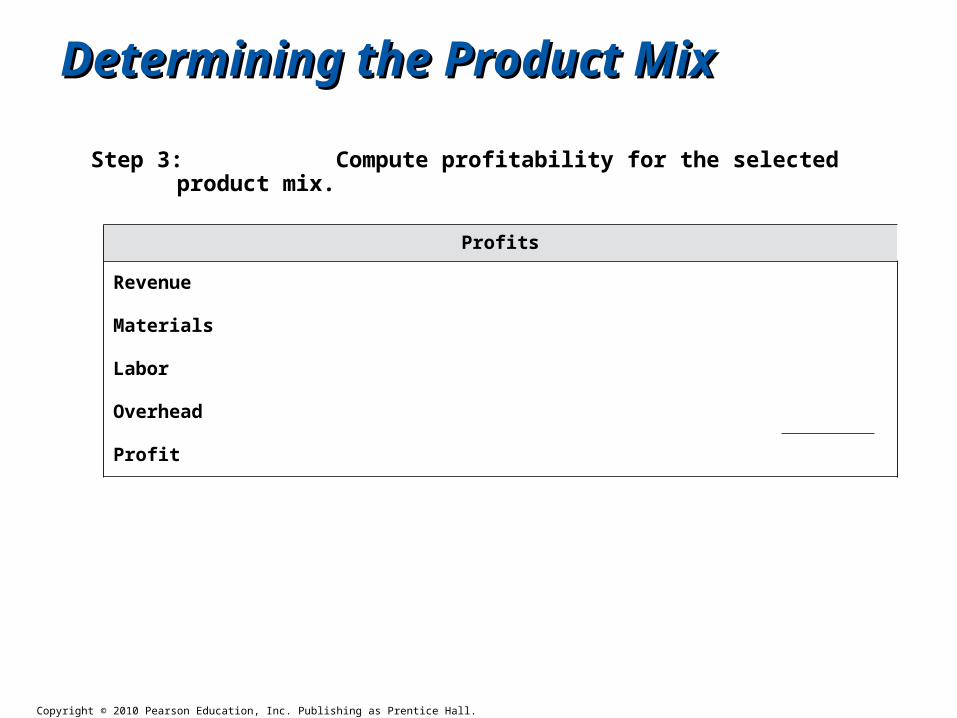
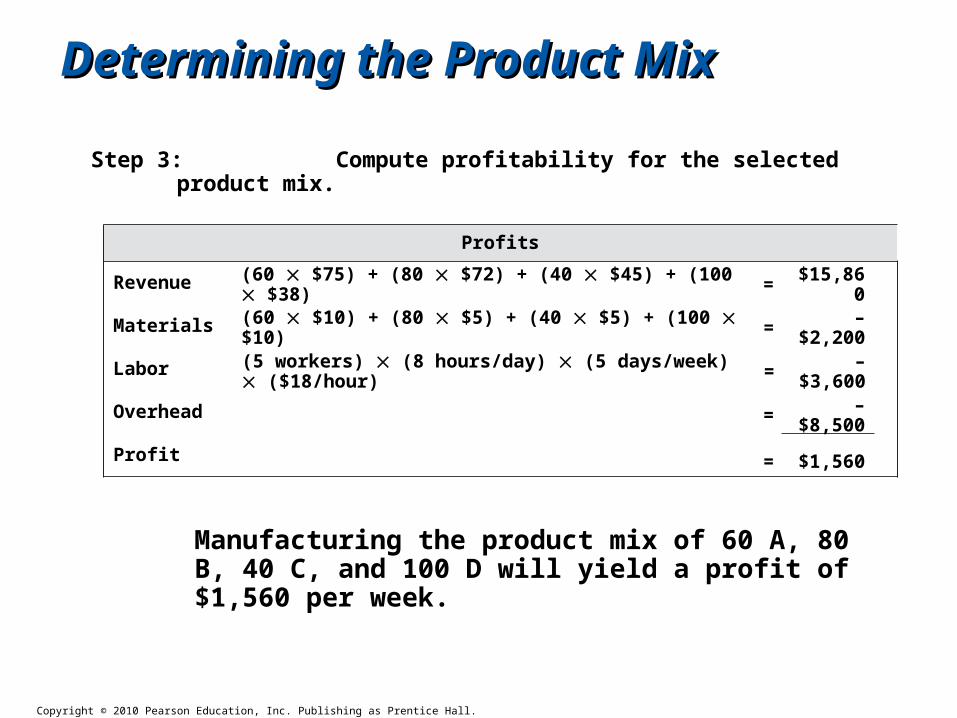
Step 3: Compute profitability for the selected product mix.
Profits
Revenue
Materials
Labor
Overhead
Profit
Copyright © 2010 Pearson Education, Inc. Publishing as Prentice Hall.
Determining the Product MixDetermining the Product Mix
Step 3: Compute profitability for the selected product mix.
Manufacturing the product mix of 60 A, 80 B, 40 C, and 100 D will yield a profit of $1,560 per week.
(60 $75) + (80 $72) + (40 $45) + (100 $38) = $15,860
Profits
Revenue
Materials
Labor
Overhead
Profit
(60 $10) + (80 $5) + (40 $5) + (100 $10) = –$2,200
(5 workers) (8 hours/day) (5 days/week) ($18/hour) = –$3,600
= –$8,500
= $1,560
Copyright © 2010 Pearson Education, Inc. Publishing as Prentice Hall.
Determining the Product MixDetermining the Product Mix
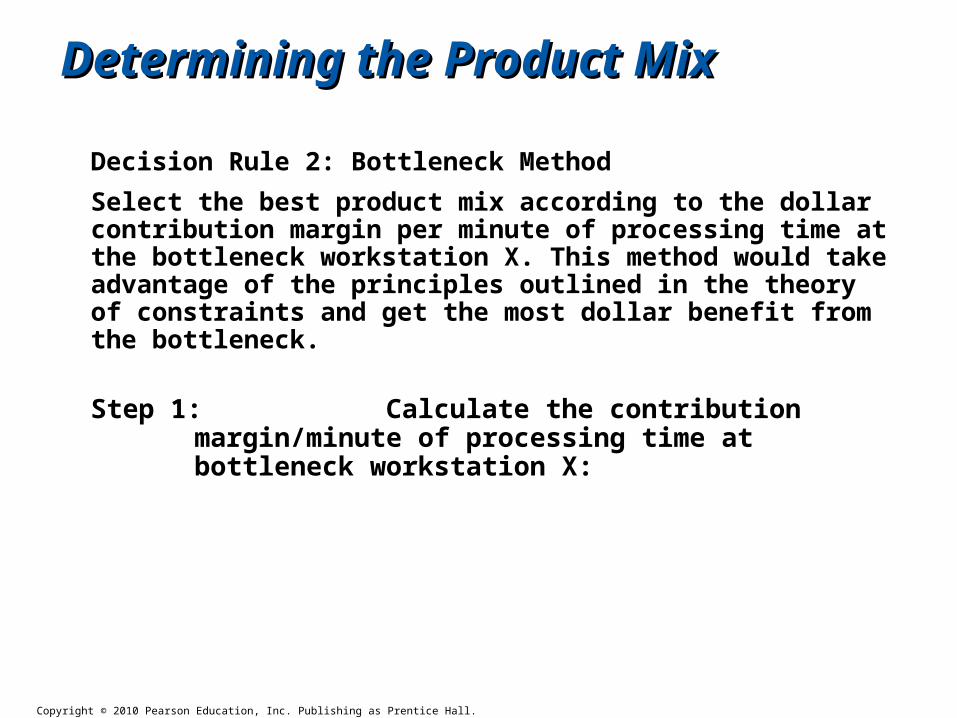
Decision Rule 2: Bottleneck Method
Select the best product mix according to the dollar contribution margin per minute of processing time at the bottleneck workstation X. This method would take advantage of the principles outlined in the theory of constraints and get the most dollar benefit from the bottleneck.
Step 1: Calculate the contribution margin/minute of processing time at bottleneck workstation X:
Copyright © 2010 Pearson Education, Inc. Publishing as Prentice Hall.
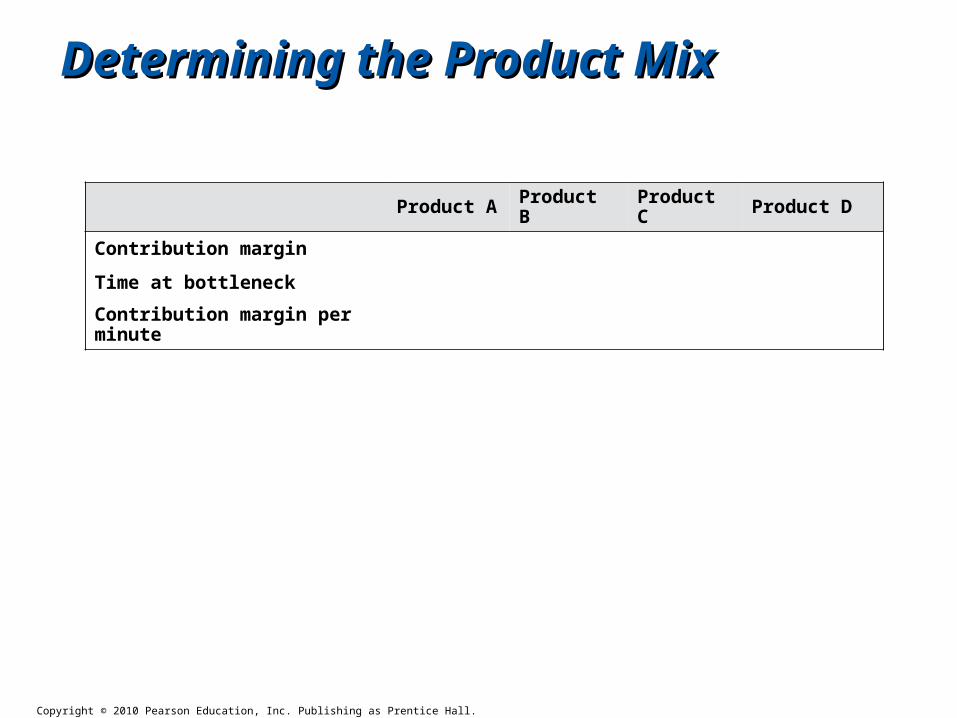
Determining the Product MixDetermining the Product Mix
Product A Product B Product C Product D
Contribution margin
Time at bottleneck
Contribution margin per minute
Copyright © 2010 Pearson Education, Inc. Publishing as Prentice Hall.
Determining the Product MixDetermining the Product Mix
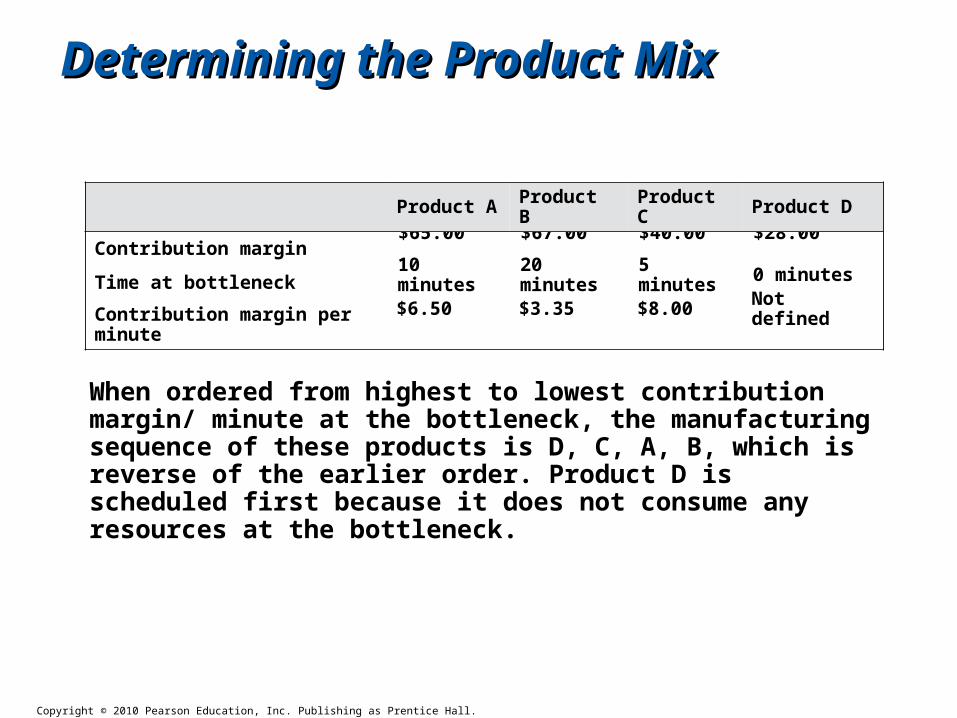
When ordered from highest to lowest contribution margin/ minute at the bottleneck, the manufacturing sequence of these products is D, C, A, B, which is reverse of the earlier order. Product D is scheduled first because it does not consume any resources at the bottleneck.
$65.00 $67.00 $40.00 $28.00
10 minutes 20 minutes 5 minutes 0 minutes
$6.50 $3.35 $8.00 Not defined
Product A Product B Product C Product D
Contribution margin
Time at bottleneck
Contribution margin per minute
Copyright © 2010 Pearson Education, Inc. Publishing as Prentice Hall.
Determining the Product MixDetermining the Product Mix
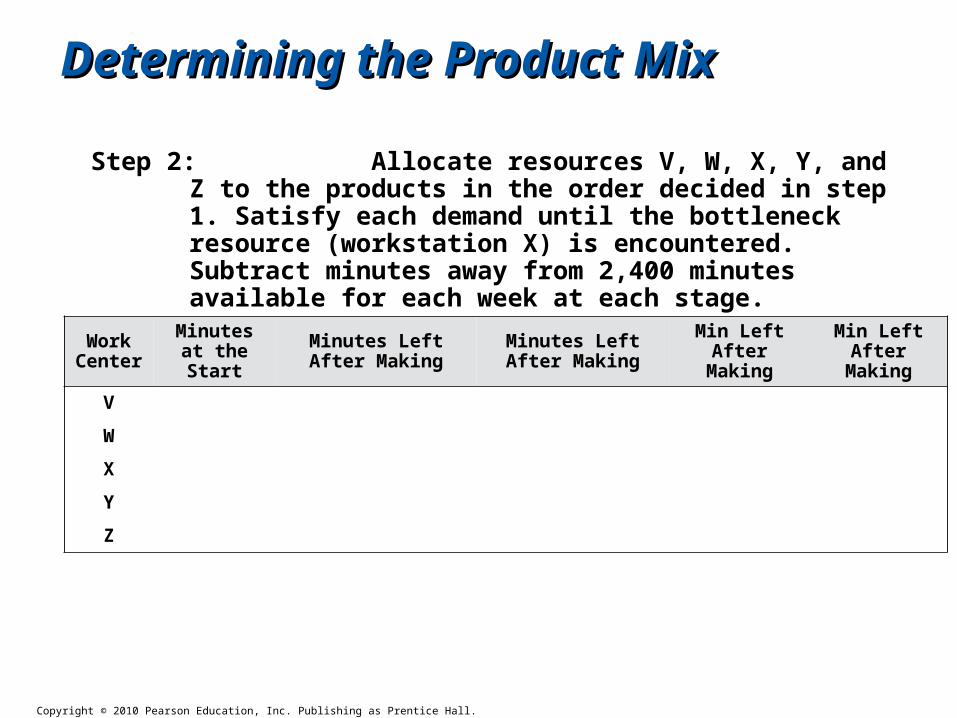
Step 2: Allocate resources V, W, X, Y, and Z to the products in the order decided in step 1. Satisfy each demand until the bottleneck resource (workstation X) is encountered. Subtract minutes away from 2,400 minutes available for each week at each stage.
Work Center
Minutes at the Start
Minutes Left After Making
Minutes Left After Making
Min Left After Making
Min Left After Making
V
W
X
Y
Z
Copyright © 2010 Pearson Education, Inc. Publishing as Prentice Hall.
Determining the Product MixDetermining the Product Mix
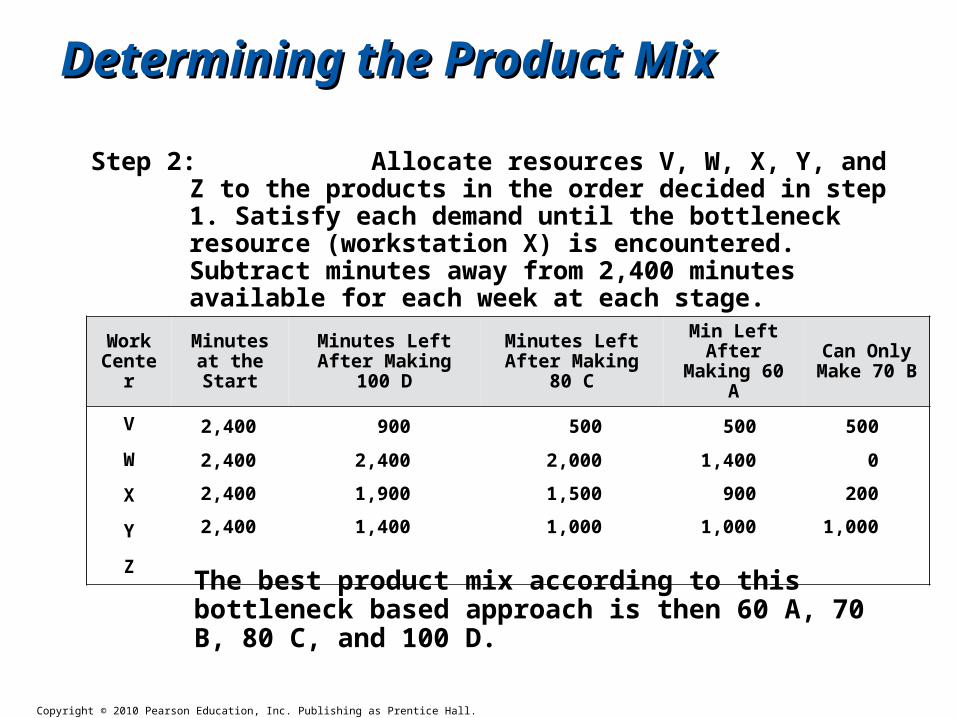
Step 2: Allocate resources V, W, X, Y, and Z to the products in the order decided in step 1. Satisfy each demand until the bottleneck resource (workstation X) is encountered. Subtract minutes away from 2,400 minutes available for each week at each stage.
The best product mix according to this bottleneck based approach is then 60 A, 70 B, 80 C, and 100 D.
2,400 2,400 2,400 600 600
2,400 900 500 500 500
2,400 2,400 2,000 1,400 0
2,400 1,900 1,500 900 200
2,400 1,400 1,000 1,000 1,000
Work Center
Minutes at the Start
Minutes Left After Making 100 D
Minutes Left After Making 80 C
Min Left After Making 60 A
Can Only Make 70 B
V
W
X
Y
Z
Copyright © 2010 Pearson Education, Inc. Publishing as Prentice Hall.
Determining the Product MixDetermining the Product Mix
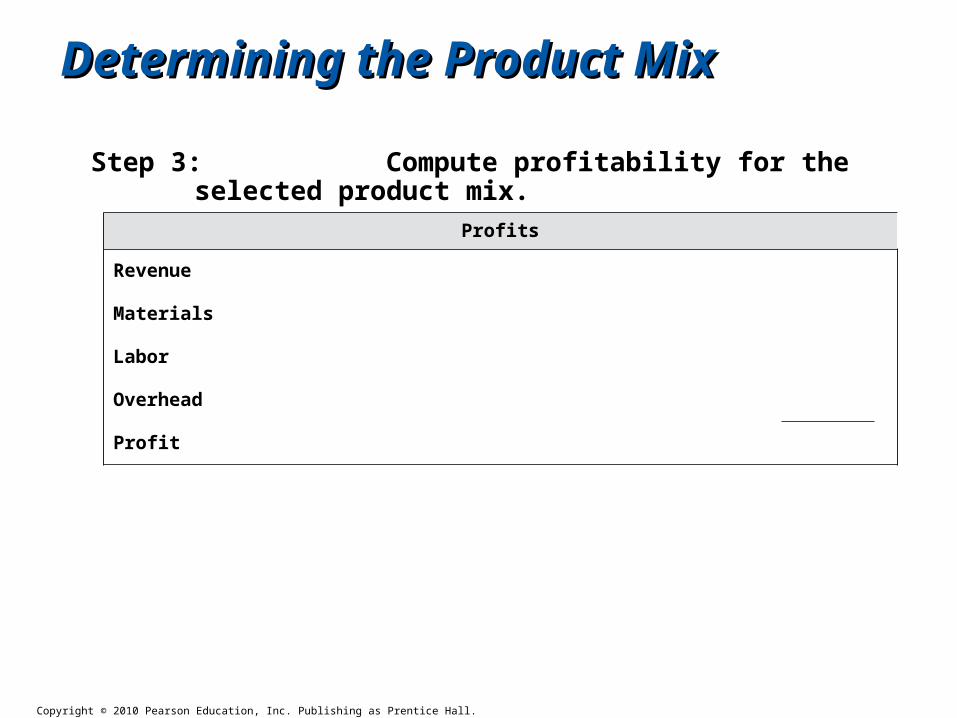
Step 3: Compute profitability for the selected product mix.
Profits
Revenue
Materials
Labor
Overhead
Profit
Copyright © 2010 Pearson Education, Inc. Publishing as Prentice Hall.
Determining the Product MixDetermining the Product Mix
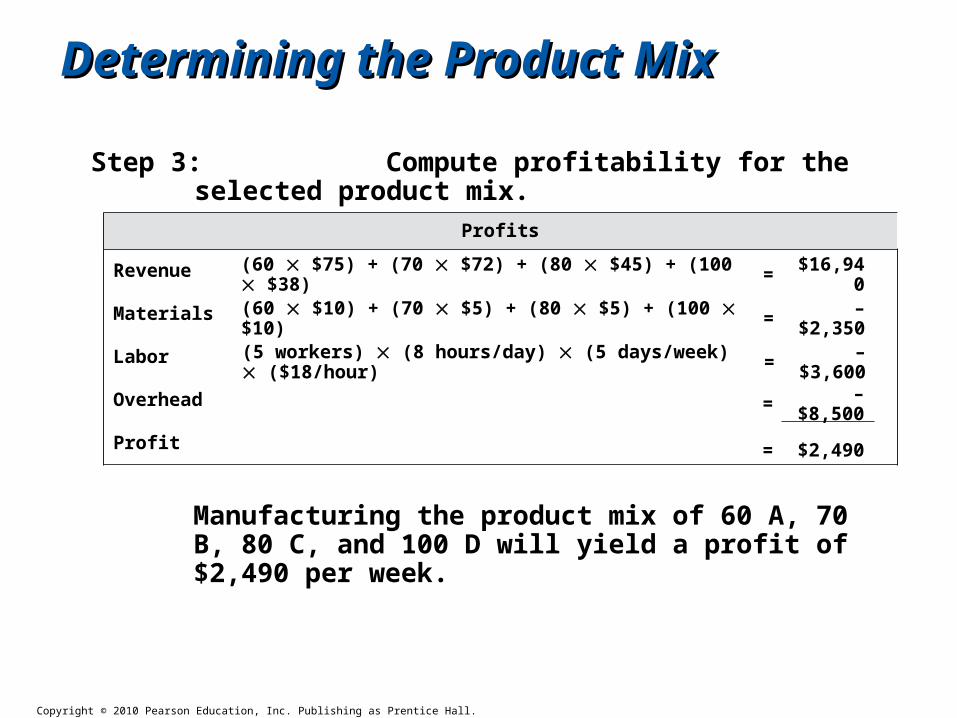
Step 3: Compute profitability for the selected product mix.
Manufacturing the product mix of 60 A, 70 B, 80 C, and 100 D will yield a profit of $2,490 per week.
(60 $75) + (70 $72) + (80 $45) + (100 $38) = $16,940
(60 $10) + (70 $5) + (80 $5) + (100 $10) = –$2,350
(5 workers) (8 hours/day) (5 days/week) ($18/hour) = –$3,600
Profits
Revenue
Materials
Labor
Overhead
Profit
= –$8,500
= $2,490
Copyright © 2010 Pearson Education, Inc. Publishing as Prentice Hall.
In classIn class - Example - Example
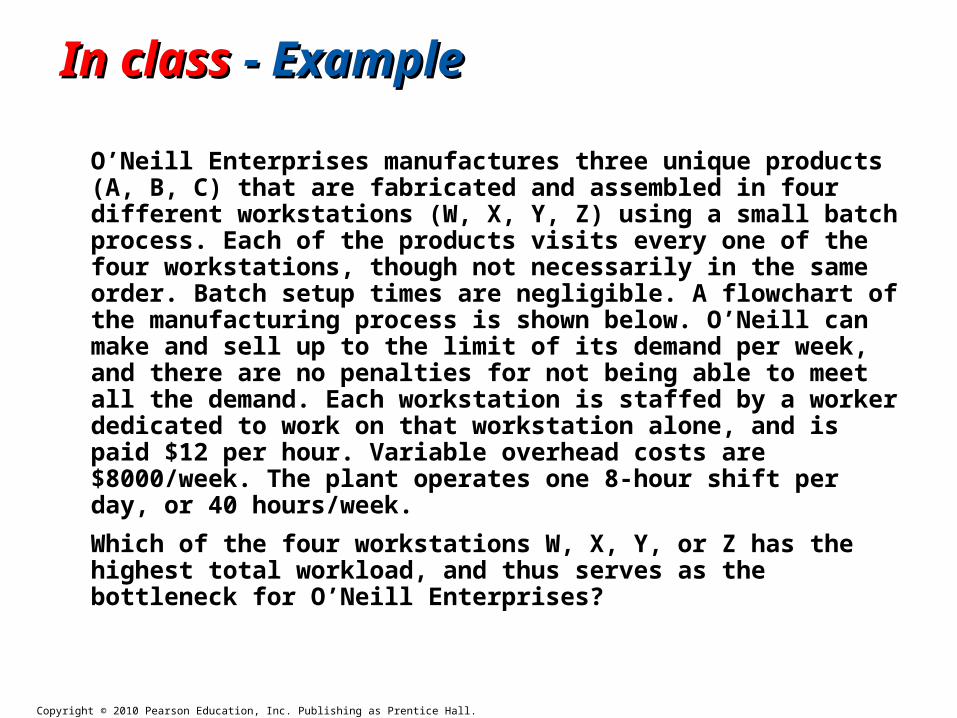
O’Neill Enterprises manufactures three unique products (A, B, C) that are fabricated and assembled in four different workstations (W, X, Y, Z) using a small batch process. Each of the products visits every one of the four workstations, though not necessarily in the same order. Batch setup times are negligible. A flowchart of the manufacturing process is shown below. O’Neill can make and sell up to the limit of its demand per week, and there are no penalties for not being able to meet all the demand. Each workstation is staffed by a worker dedicated to work on that workstation alone, and is paid $12 per hour. Variable overhead costs are $8000/week. The plant operates one 8-hour shift per day, or 40 hours/week.
Which of the four workstations W, X, Y, or Z has the highest total workload, and thus serves as the bottleneck for O’Neill Enterprises?
Copyright © 2010 Pearson Education, Inc. Publishing as Prentice Hall.
In classIn class - Example - Example
Product B
Raw materials
Purchased part
Product: BPrice: $85/unitDemand: 70 units/wk
Finish with step 4at workstation Z
(13 min)
Step 2 atworkstation W
(10 min)
Step 3 at workstation Y
(10 min)
Step 1 atworkstation X
(12 min)
$9
$5
Product A
Raw materials
Purchased part
Product: APrice: $90/unitDemand: 65 units/wk
Finish with step 4at workstation Z
(16 min)
Step 2 atworkstation Y
(15 min)
Step 3 at workstation X
(9 min)
Step 1 atworkstation W
(10 min)
$7
$6
Product C
Raw materials
Purchased part
Product: CPrice: $80/unitDemand: 80 units/wk
Finish with step 4at workstation Z
(10 min)
Step 2 atworkstation X
(10 min)
Step 3 at workstation W
(12 min)
Step 1 atworkstation Y
(5 min)
$10
$5
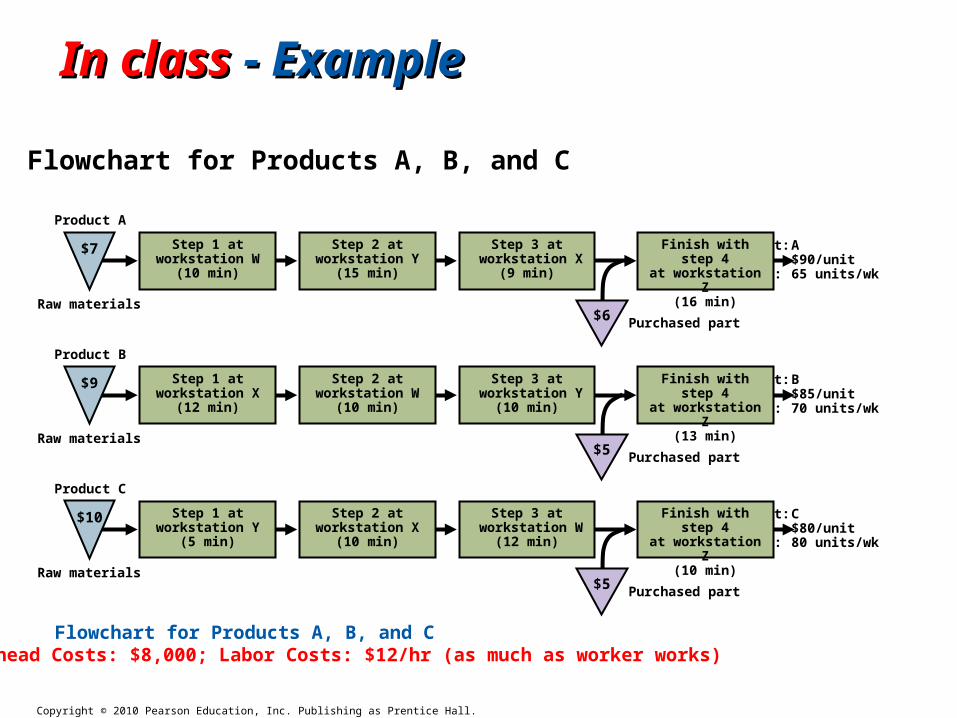
Flowchart for Products A, B, and C
Flowchart for Products A, B, and COverhead Costs: $8,000; Labor Costs: $12/hr (as much as worker works)
Copyright © 2010 Pearson Education, Inc. Publishing as Prentice Hall.
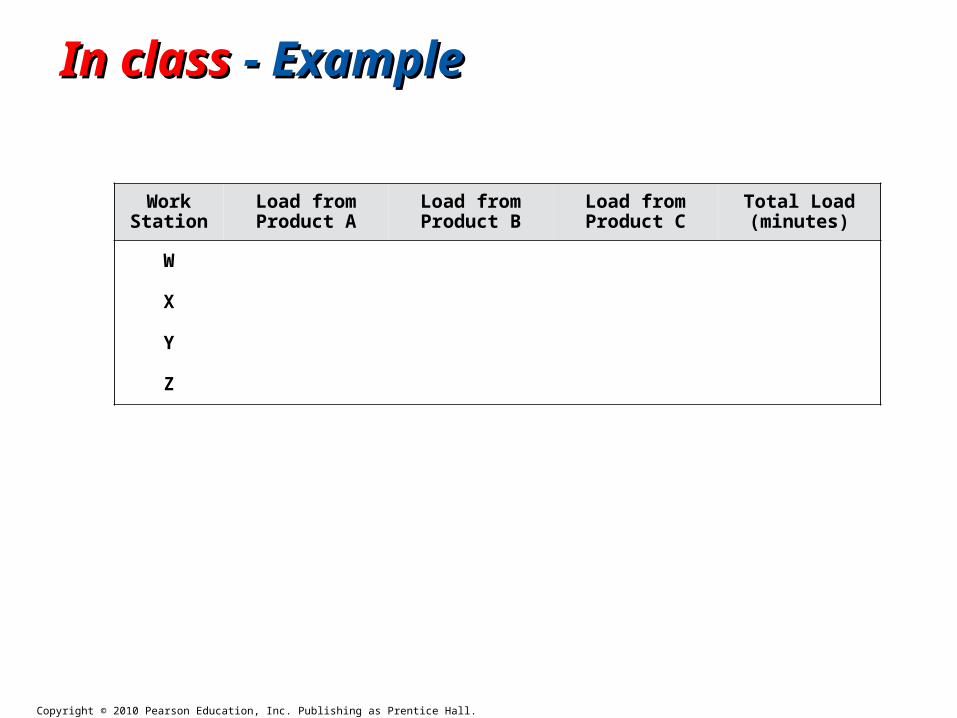
Work Station
Load from Product A
Load from Product B
Load from Product C
Total Load (minutes)
W
X
Y
Z
In classIn class - Example - Example
Copyright © 2010 Pearson Education, Inc. Publishing as Prentice Hall.
In classIn class - Example - Example
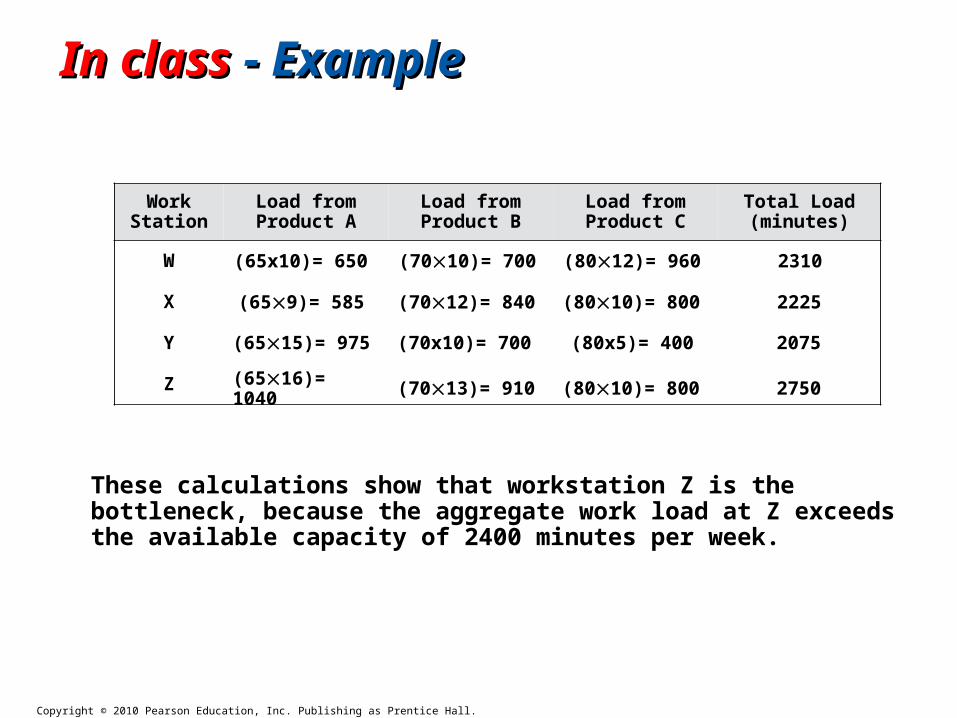
These calculations show that workstation Z is the bottleneck, because the aggregate work load at Z exceeds the available capacity of 2400 minutes per week.
(65x10)= 650 (7010)= 700 (8012)= 960 2310
(659)= 585 (7012)= 840 (8010)= 800 2225
(6515)= 975 (70x10)= 700 (80x5)= 400 2075
(6516)= 1040 (7013)= 910 (8010)= 800 2750
Work Station
Load from Product A
Load from Product B
Load from Product C
Total Load (minutes)
W
X
Y
Z
Copyright © 2010 Pearson Education, Inc. Publishing as Prentice Hall.
In classIn class - Example - Example
The senior management at O’Neill Enterprises wants to improve the profitability of the firm by accepting the right set of orders. Currently, decisions are made to accept as much of the highest contribution margin product as possible (up to the limit of its demand), followed by the next highest contribution margin product, and so on until no more capacity is available. Since the firm cannot satisfy all the demand, the product mix must be chosen carefully. Jane Hathaway, the newly hired production supervisor, is knowledgeable about the theory of constraints and bottleneck based scheduling. She believes that profitability can indeed be approved if bottleneck resources were exploited to determine the product mix. What is the change in profits if instead of the traditional method that O’Neill has used thus far; a bottleneck based approach advocated by Jane is used instead for selecting the product mix?
Copyright © 2010 Pearson Education, Inc. Publishing as Prentice Hall.
In classIn class - Example - Example
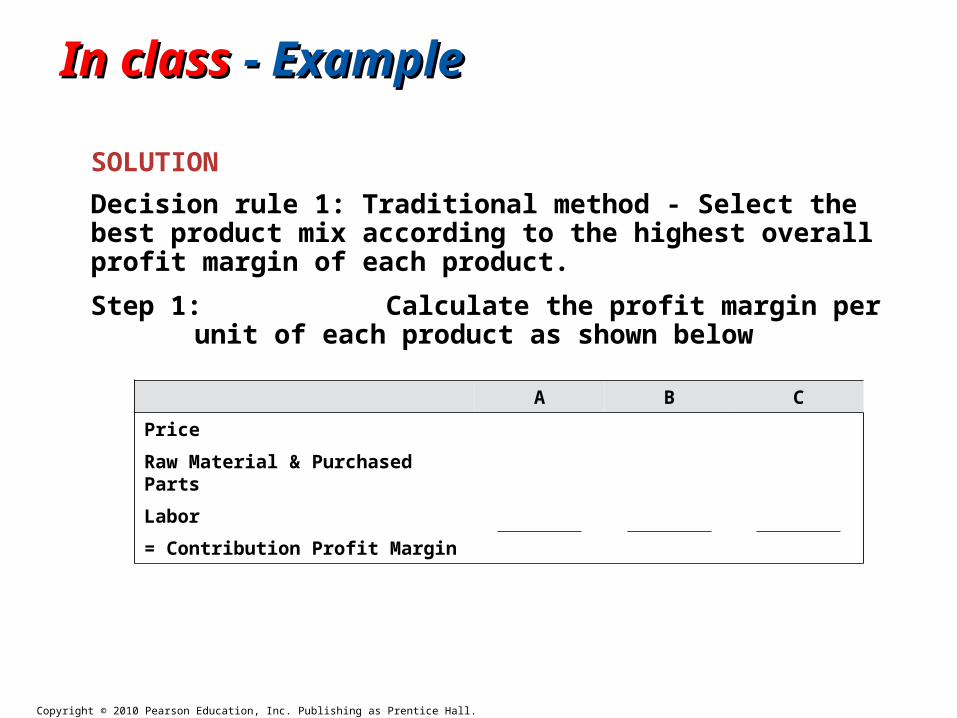
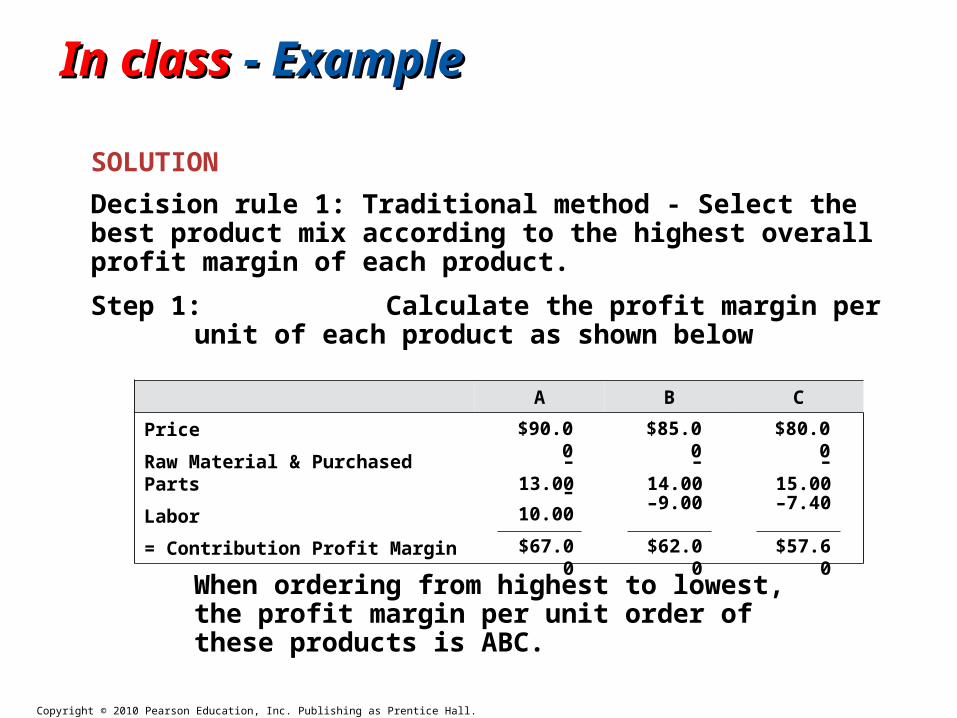
SOLUTION
Decision rule 1: Traditional method - Select the best product mix according to the highest overall profit margin of each product.
Step 1: Calculate the profit margin per unit of each product as shown below
A B C
Price
Raw Material & Purchased Parts
Labor
= Contribution Profit Margin
Copyright © 2010 Pearson Education, Inc. Publishing as Prentice Hall.
In classIn class - Example - Example
SOLUTION
Decision rule 1: Traditional method - Select the best product mix according to the highest overall profit margin of each product.
Step 1: Calculate the profit margin per unit of each product as shown below
When ordering from highest to lowest, the profit margin per unit order of these products is ABC.
$90.00 $85.00 $80.00
–13.00 –14.00 –15.00
A B C
Price
Raw Material & Purchased Parts
Labor
= Contribution Profit Margin
–10.00 –9.00 –7.40
$67.00 $62.00 $57.60
Copyright © 2010 Pearson Education, Inc. Publishing as Prentice Hall.
In classIn class - Example - Example
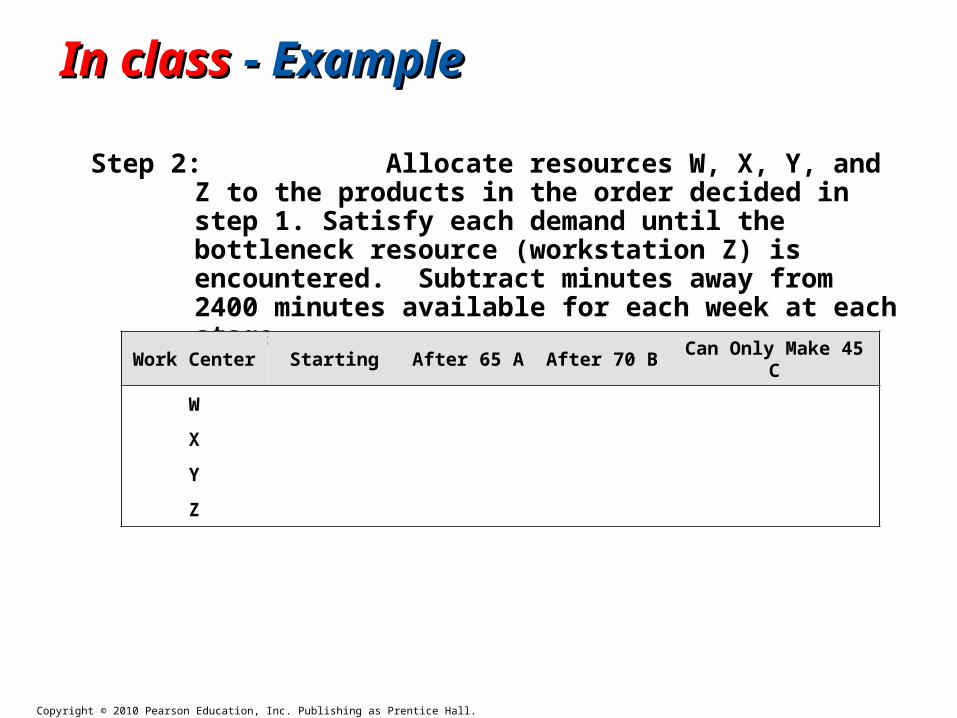
Step 2: Allocate resources W, X, Y, and Z to the products in the order decided in step 1. Satisfy each demand until the bottleneck resource (workstation Z) is encountered. Subtract minutes away from 2400 minutes available for each week at each stage.
Work Center Starting After 65 A After 70 B Can Only Make 45 C
W
X
Y
Z
Copyright © 2010 Pearson Education, Inc. Publishing as Prentice Hall.
In classIn class - Example - Example
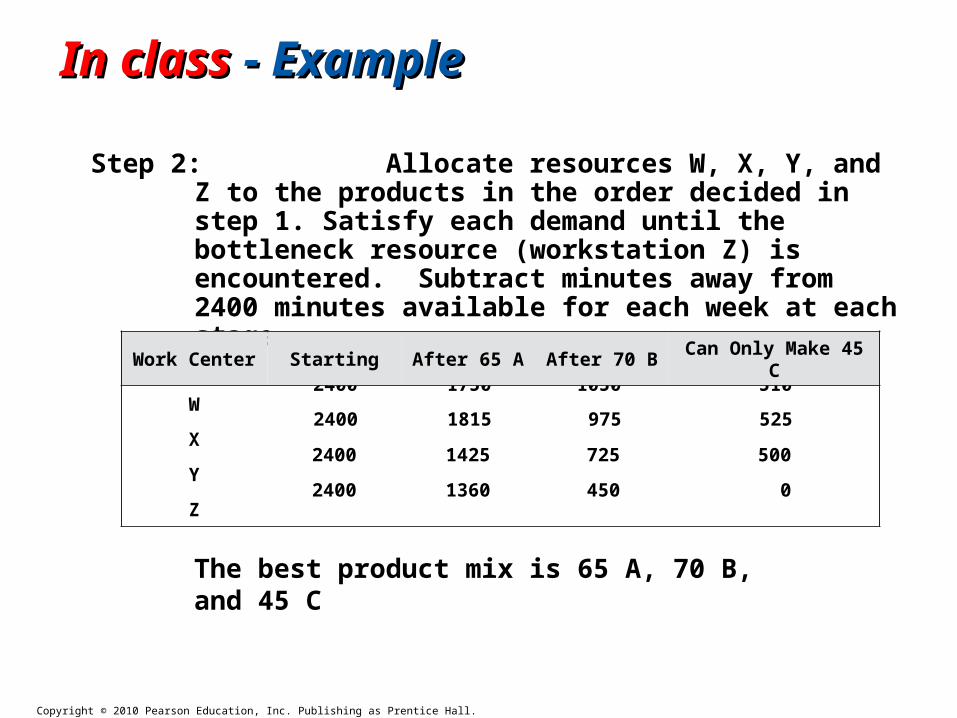
Step 2: Allocate resources W, X, Y, and Z to the products in the order decided in step 1. Satisfy each demand until the bottleneck resource (workstation Z) is encountered. Subtract minutes away from 2400 minutes available for each week at each stage.
The best product mix is 65 A, 70 B, and 45 C
2400 1750 1050 510
2400 1815 975 525
2400 1425 725 500
2400 1360 450 0
Work Center Starting After 65 A After 70 B Can Only Make 45 C
W
X
Y
Z
Copyright © 2010 Pearson Education, Inc. Publishing as Prentice Hall.
In classIn class - Example - Example
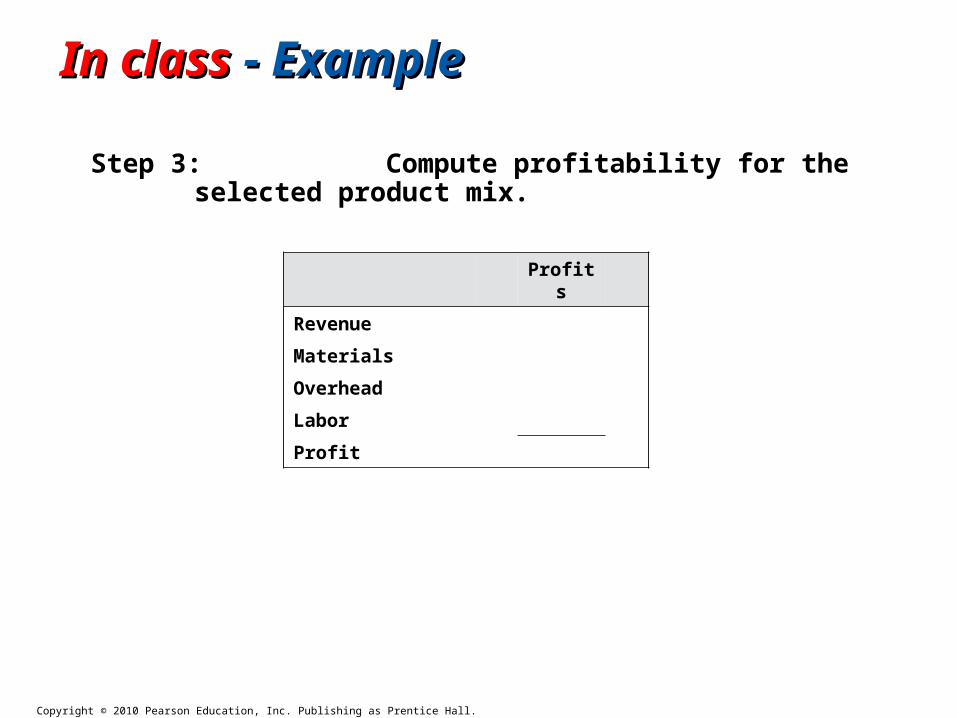
Step 3: Compute profitability for the selected product mix.
Profits
Revenue
Materials
Overhead
Labor
Profit
Copyright © 2010 Pearson Education, Inc. Publishing as Prentice Hall.
Profits
Revenue
Materials
Overhead
Labor
Profit
In classIn class - Example - Example
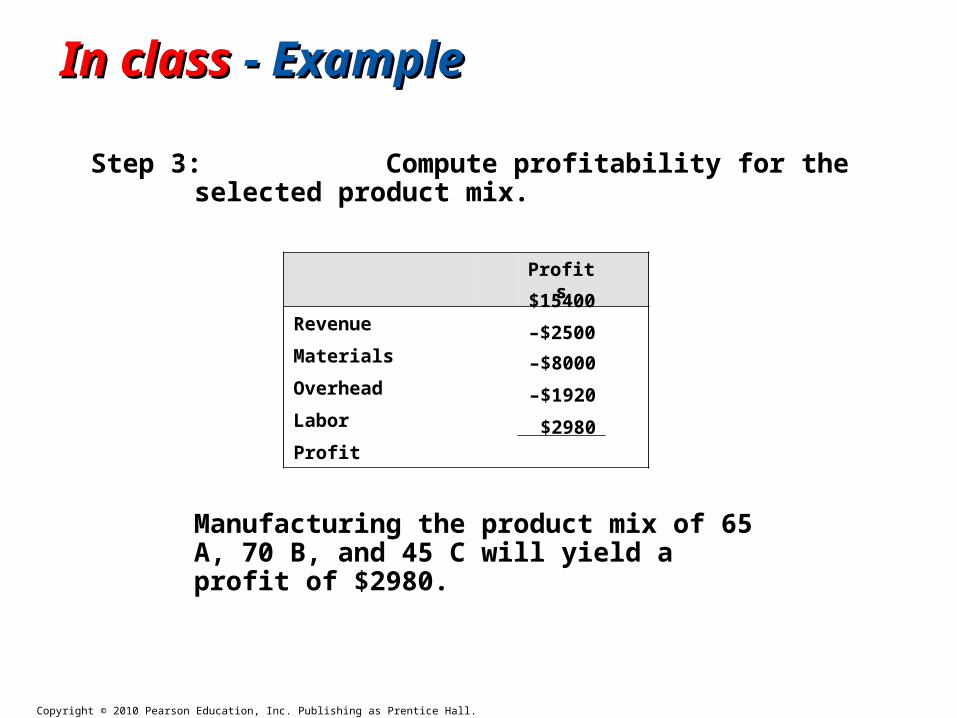
Step 3: Compute profitability for the selected product mix.
Manufacturing the product mix of 65 A, 70 B, and 45 C will yield a profit of $2980.
$15400
–$2500
–$8000
–$1920
$2980
Copyright © 2010 Pearson Education, Inc. Publishing as Prentice Hall.
In classIn class - Example - Example
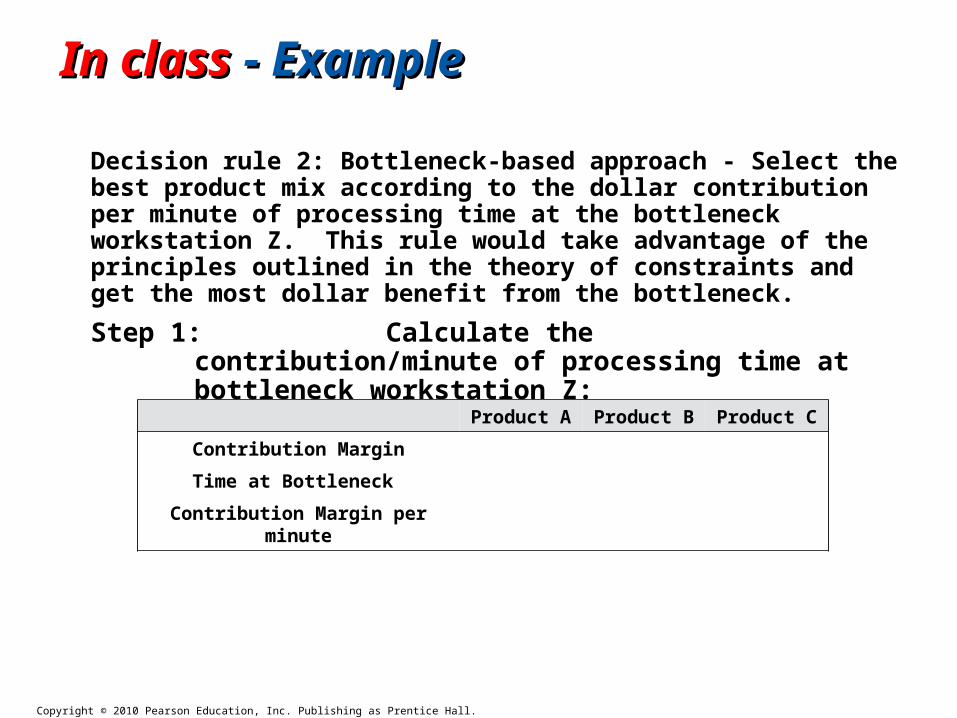
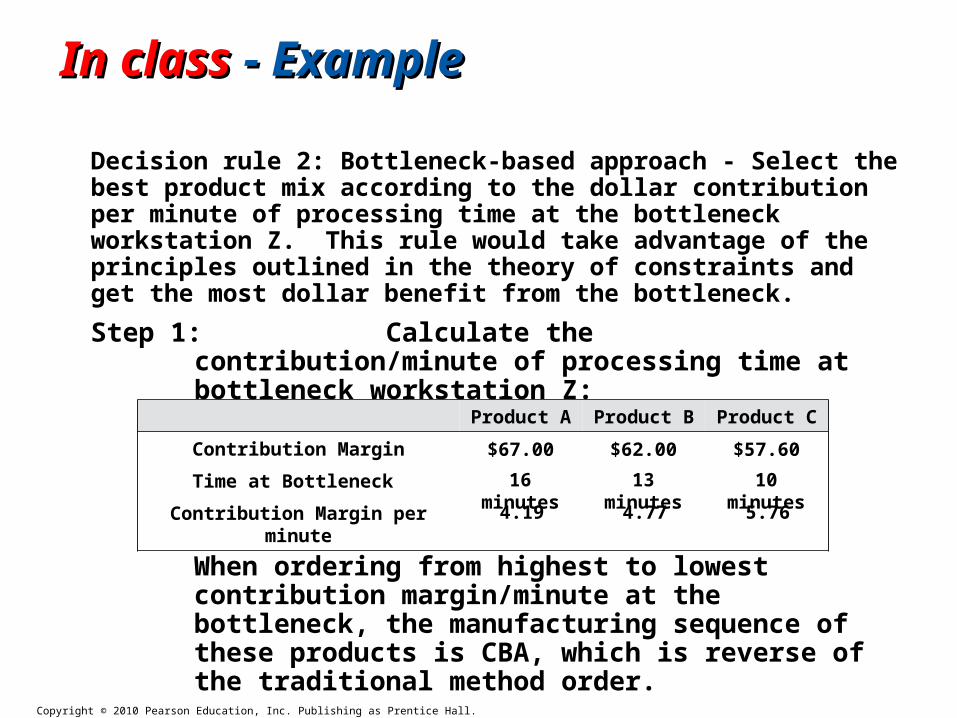
Decision rule 2: Bottleneck-based approach - Select the best product mix according to the dollar contribution per minute of processing time at the bottleneck workstation Z. This rule would take advantage of the principles outlined in the theory of constraints and get the most dollar benefit from the bottleneck.
Step 1: Calculate the contribution/minute of processing time at bottleneck workstation Z:
Product A Product B Product C
Contribution Margin
Time at Bottleneck
Contribution Margin per minute
Copyright © 2010 Pearson Education, Inc. Publishing as Prentice Hall.
In classIn class - Example - Example
Decision rule 2: Bottleneck-based approach - Select the best product mix according to the dollar contribution per minute of processing time at the bottleneck workstation Z. This rule would take advantage of the principles outlined in the theory of constraints and get the most dollar benefit from the bottleneck.
Step 1: Calculate the contribution/minute of processing time at bottleneck workstation Z:
When ordering from highest to lowest contribution margin/minute at the bottleneck, the manufacturing sequence of these products is CBA, which is reverse of the traditional method order.
$67.00 $62.00 $57.60
16 minutes 13 minutes 10 minutes
4.19 4.77 5.76
Product A Product B Product C
Contribution Margin
Time at Bottleneck
Contribution Margin per minute
Copyright © 2010 Pearson Education, Inc. Publishing as Prentice Hall.
In classIn class - Example - Example
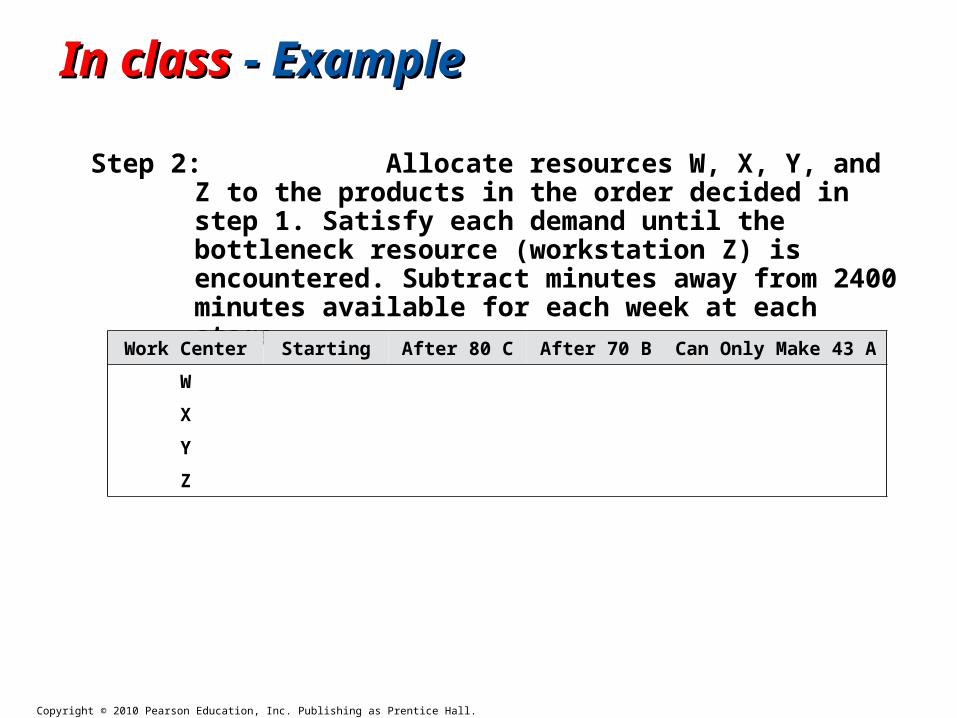
Step 2: Allocate resources W, X, Y, and Z to the products in the order decided in step 1. Satisfy each demand until the bottleneck resource (workstation Z) is encountered. Subtract minutes away from 2400 minutes available for each week at each stage.
Work Center Starting After 80 C After 70 B Can Only Make 43 A
W
X
Y
Z
Copyright © 2010 Pearson Education, Inc. Publishing as Prentice Hall.
In classIn class - Example - Example
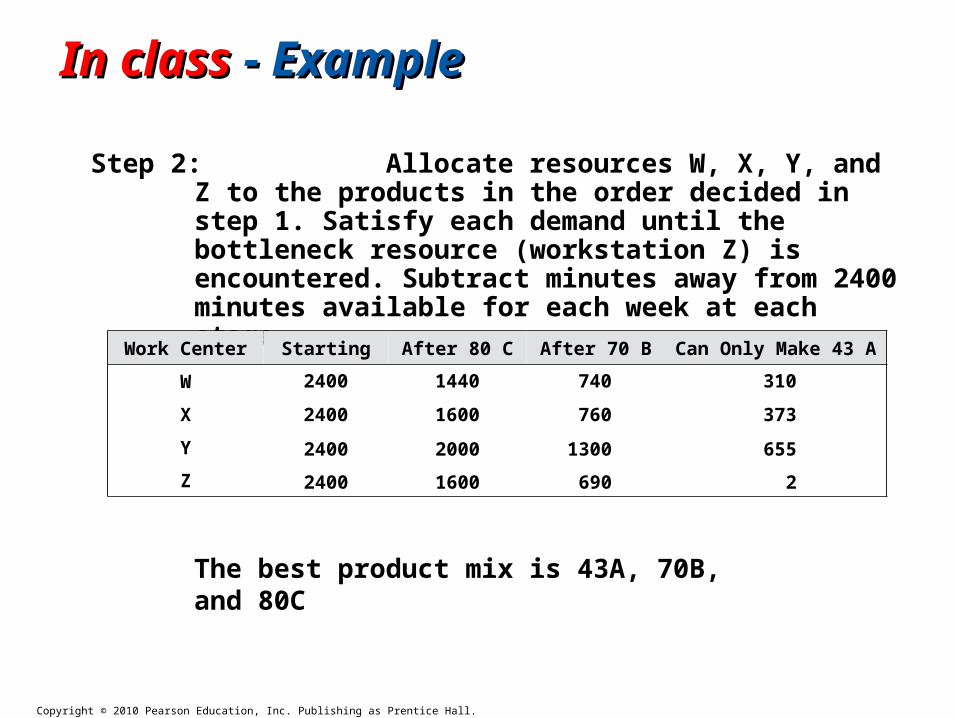
Step 2: Allocate resources W, X, Y, and Z to the products in the order decided in step 1. Satisfy each demand until the bottleneck resource (workstation Z) is encountered. Subtract minutes away from 2400 minutes available for each week at each stage.
The best product mix is 43A, 70B, and 80C
2400 1440 740 310
2400 1600 760 373
2400 2000 1300 655
2400 1600 690 2
Work Center Starting After 80 C After 70 B Can Only Make 43 A
W
X
Y
Z
Copyright © 2010 Pearson Education, Inc. Publishing as Prentice Hall.
In classIn class - Example - Example
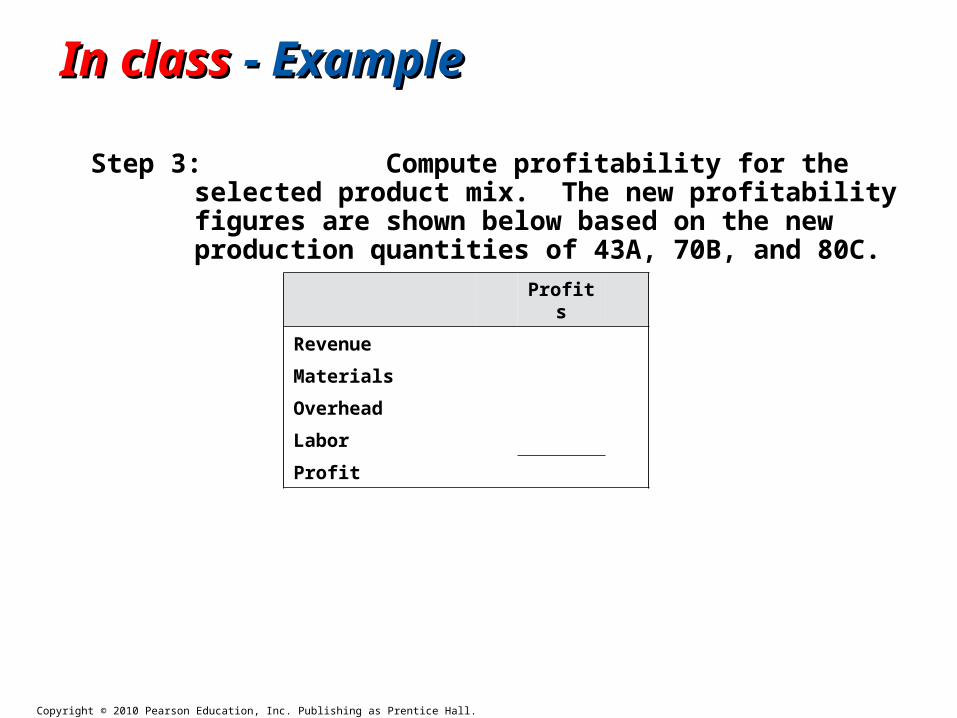
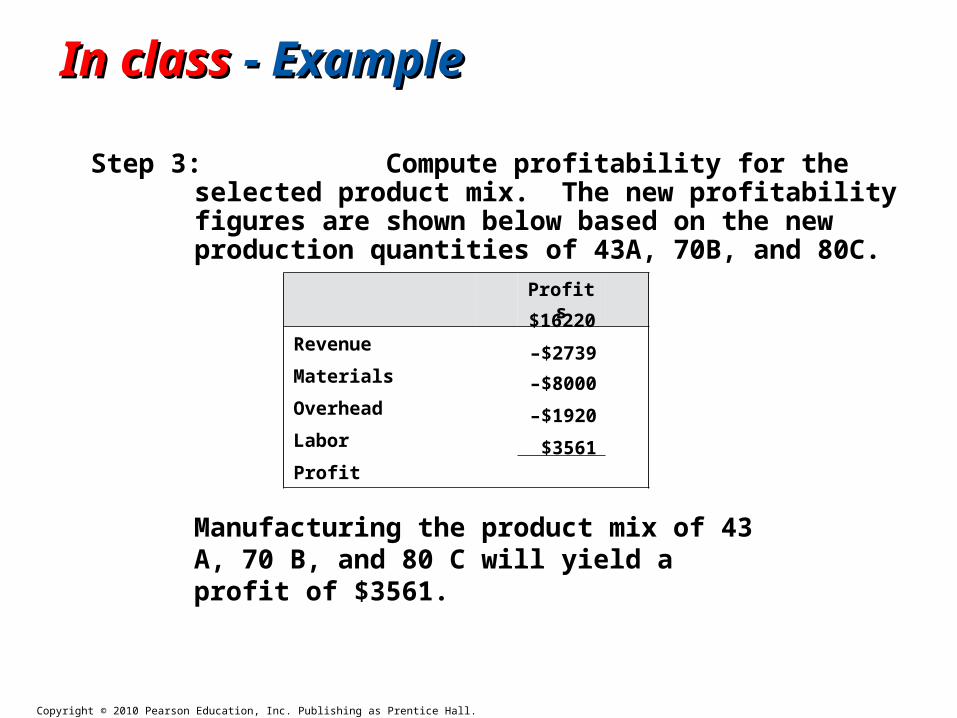
Step 3: Compute profitability for the selected product mix. The new profitability figures are shown below based on the new production quantities of 43A, 70B, and 80C.
Profits
Revenue
Materials
Overhead
Labor
Profit
Copyright © 2010 Pearson Education, Inc. Publishing as Prentice Hall.
Profits
Revenue
Materials
Overhead
Labor
Profit
In classIn class - Example - Example
Step 3: Compute profitability for the selected product mix. The new profitability figures are shown below based on the new production quantities of 43A, 70B, and 80C.
Manufacturing the product mix of 43 A, 70 B, and 80 C will yield a profit of $3561.
$16220
–$2739
–$8000
–$1920
$3561
Copyright © 2010 Pearson Education, Inc. Publishing as Prentice Hall.
A Line ProcessA Line Process
Line Balancing Assignment of work to stations in a line so as
to achieve the desired output rate with the smallest number of workstations
Achieving the goal is similar to the theory of constraints but it differs in how it addresses bottlenecks
Precedence diagram – AON network
Copyright © 2010 Pearson Education, Inc. Publishing as Prentice Hall.
A Line ProcessA Line Process
The desired output rate is matched to the staffing or production plan
Cycle time is the maximum time allowed for work at each station is
c =1
r
wherec = cycle time in hoursr = desired output rate
Copyright © 2010 Pearson Education, Inc. Publishing as Prentice Hall.
A Line ProcessA Line Process
The theoretical minimum number of stations is
TM =tc
where
t =total time required to assemble each unit
Copyright © 2010 Pearson Education, Inc. Publishing as Prentice Hall.
A Line ProcessA Line Process
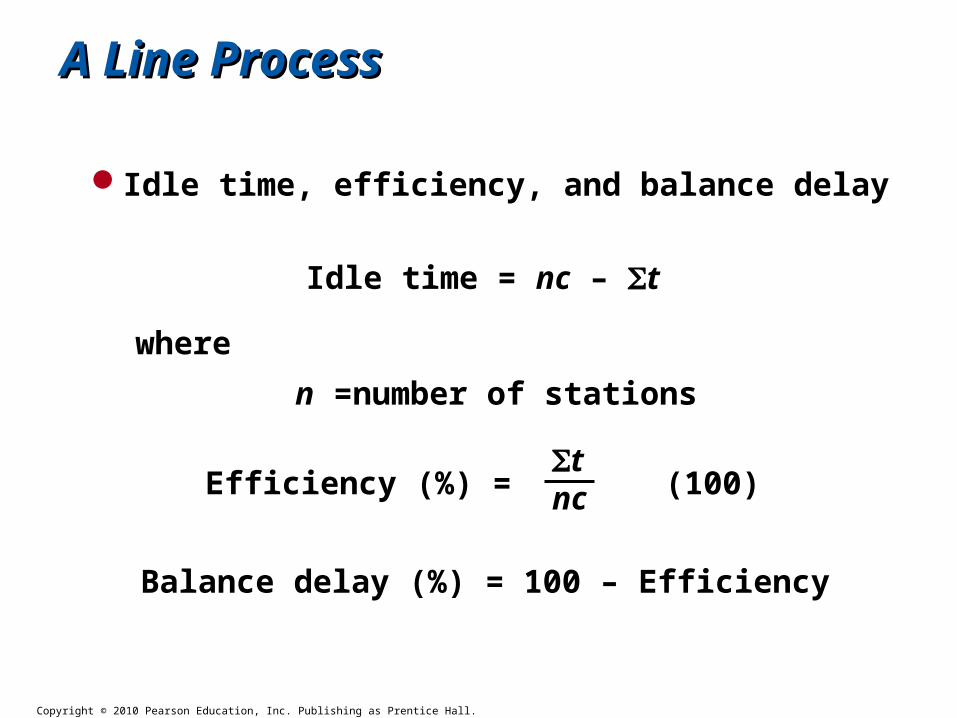
Idle time, efficiency, and balance delay
Idle time = nc – t
where
n =number of stations
Efficiency (%) = (100)tnc
Balance delay (%) = 100 – Efficiency
Copyright © 2010 Pearson Education, Inc. Publishing as Prentice Hall.
Precedence DiagramPrecedence Diagram
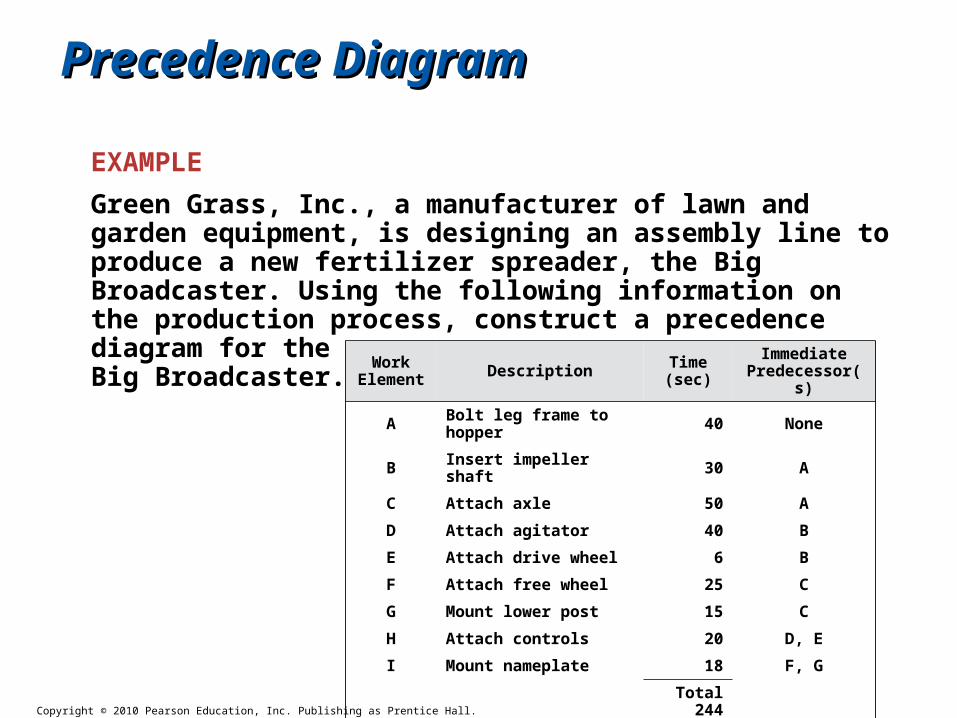
EXAMPLE
Green Grass, Inc., a manufacturer of lawn and garden equipment, is designing an assembly line to produce a new fertilizer spreader, the Big Broadcaster. Using the following information on the production process, construct a precedence
diagram for the Big Broadcaster.
Work Element Description Time
(sec)Immediate
Predecessor(s)
A Bolt leg frame to hopper 40 None
B Insert impeller shaft 30 A
C Attach axle 50 A
D Attach agitator 40 B
E Attach drive wheel 6 B
F Attach free wheel 25 C
G Mount lower post 15 C
H Attach controls 20 D, E
I Mount nameplate 18 F, G
Total 244
Copyright © 2010 Pearson Education, Inc. Publishing as Prentice Hall.
Precedence DiagramPrecedence Diagram
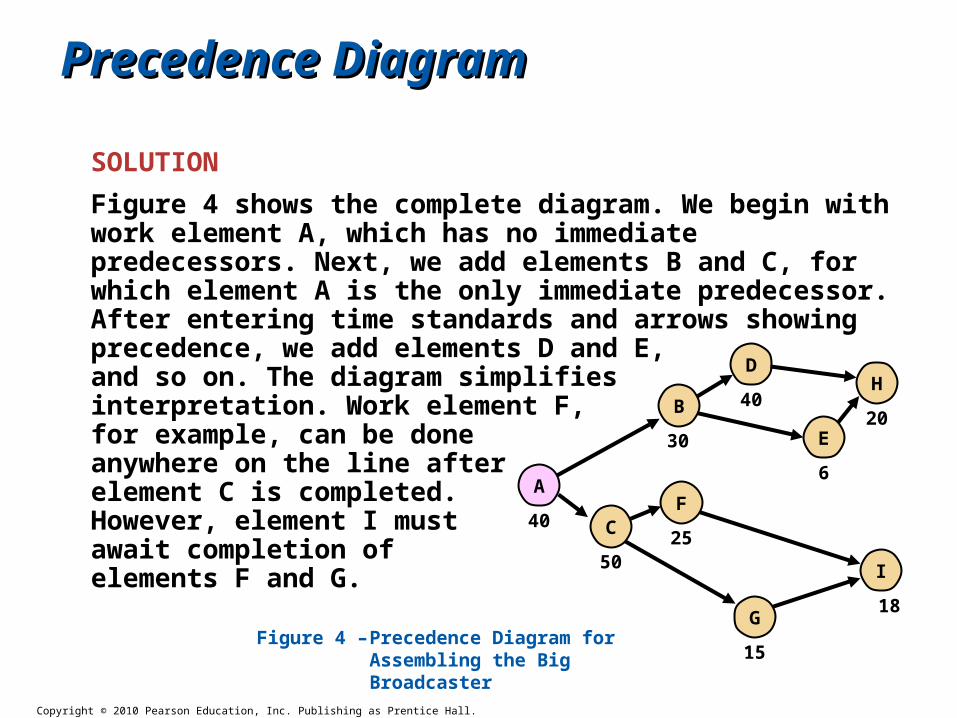
SOLUTION
Figure 4 shows the complete diagram. We begin with work element A, which has no immediate predecessors. Next, we add elements B and C, for which element A is the only immediate predecessor. After entering time standards and arrows showing precedence, we add elements D and E, and so on. The diagram simplifies interpretation. Work element F, for example, can be done anywhere on the line after element C is completed. However, element I must await completion of elements F and G.
D
40
I
18
H
20
F
25
G
15
C
50
E
6
B
30
A
40
Figure 4 – Precedence Diagram for Assembling the Big Broadcaster
Copyright © 2010 Pearson Education, Inc. Publishing as Prentice Hall.
Calculating Cycle Time, TM, EfficiencyCalculating Cycle Time, TM, Efficiency
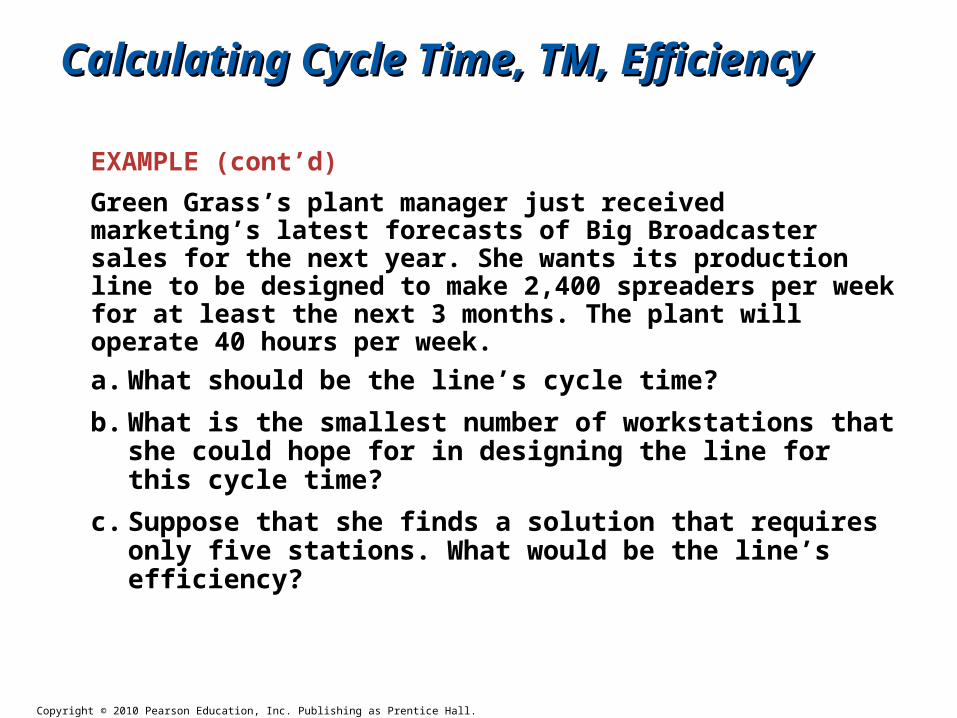
EXAMPLE (cont’d)
Green Grass’s plant manager just received marketing’s latest forecasts of Big Broadcaster sales for the next year. She wants its production line to be designed to make 2,400 spreaders per week for at least the next 3 months. The plant will operate 40 hours per week.
a. What should be the line’s cycle time?
b. What is the smallest number of workstations that she could hope for in designing the line for this cycle time?
c. Suppose that she finds a solution that requires only five stations. What would be the line’s efficiency?
Copyright © 2010 Pearson Education, Inc. Publishing as Prentice Hall.
Calculating Cycle Time, TM, EfficiencyCalculating Cycle Time, TM, Efficiency
SOLUTION
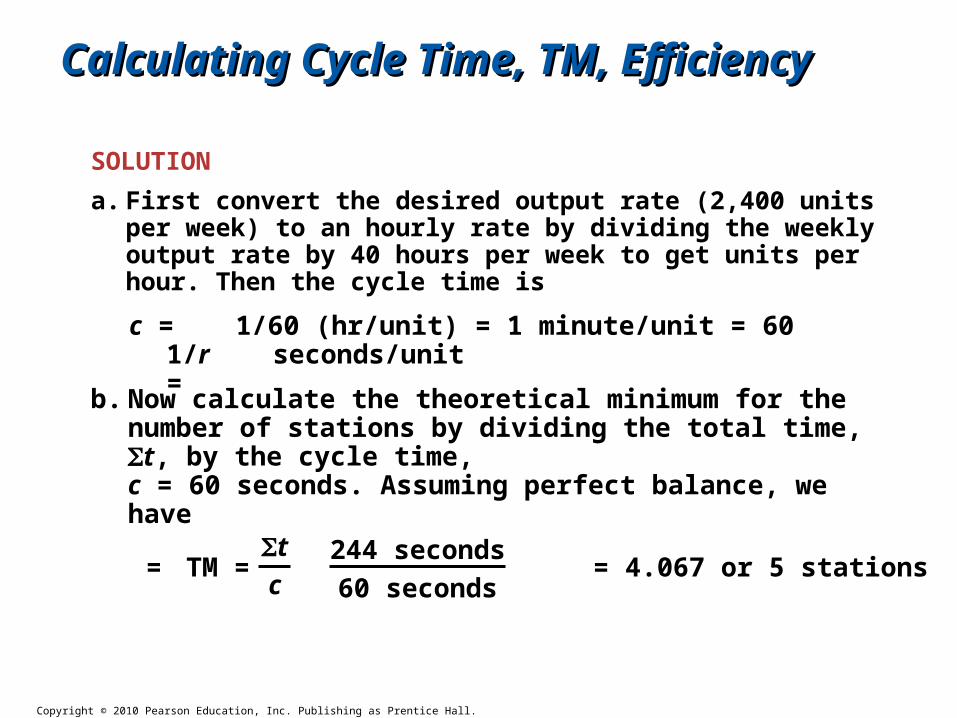
a. First convert the desired output rate (2,400 units per week) to an hourly rate by dividing the weekly output rate by 40 hours per week to get units per hour. Then the cycle time is
c = 1/r =
b. Now calculate the theoretical minimum for the number of stations by dividing the total time, t, by the cycle time, c = 60 seconds. Assuming perfect balance, we have
TM =tc
244 seconds
60 seconds= = 4.067 or 5 stations
1/60 (hr/unit) = 1 minute/unit = 60 seconds/unit
Copyright © 2010 Pearson Education, Inc. Publishing as Prentice Hall.
Calculating Cycle Time, TM, EfficiencyCalculating Cycle Time, TM, Efficiency
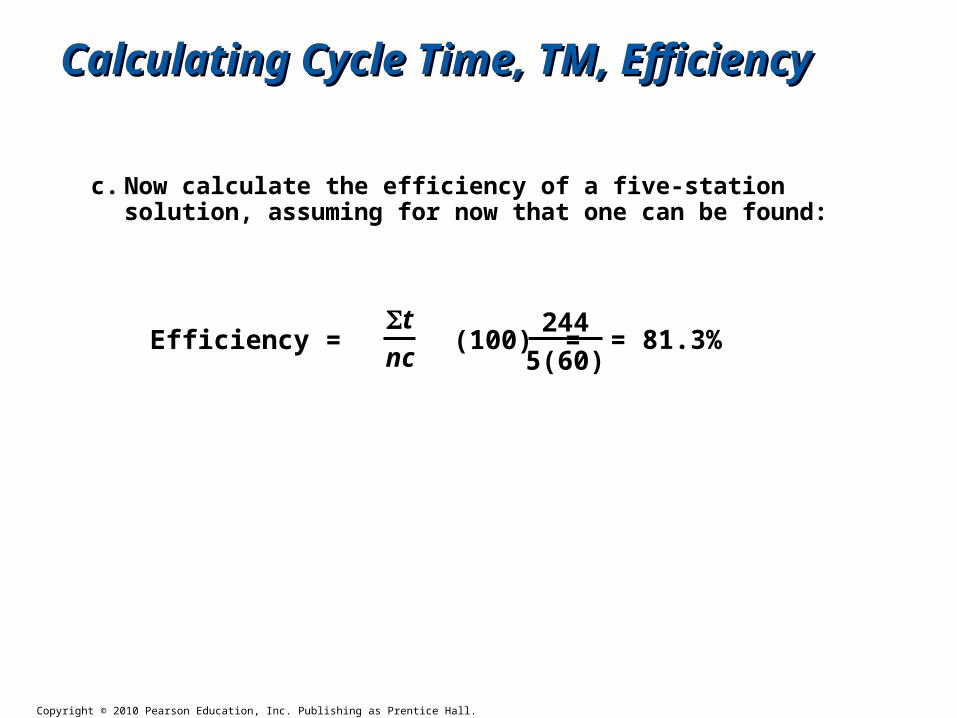
c. Now calculate the efficiency of a five-station solution, assuming for now that one can be found:
Efficiency = (100) =tnc
244
5(60)= 81.3%
Copyright © 2010 Pearson Education, Inc. Publishing as Prentice Hall.
Finding a SolutionFinding a Solution
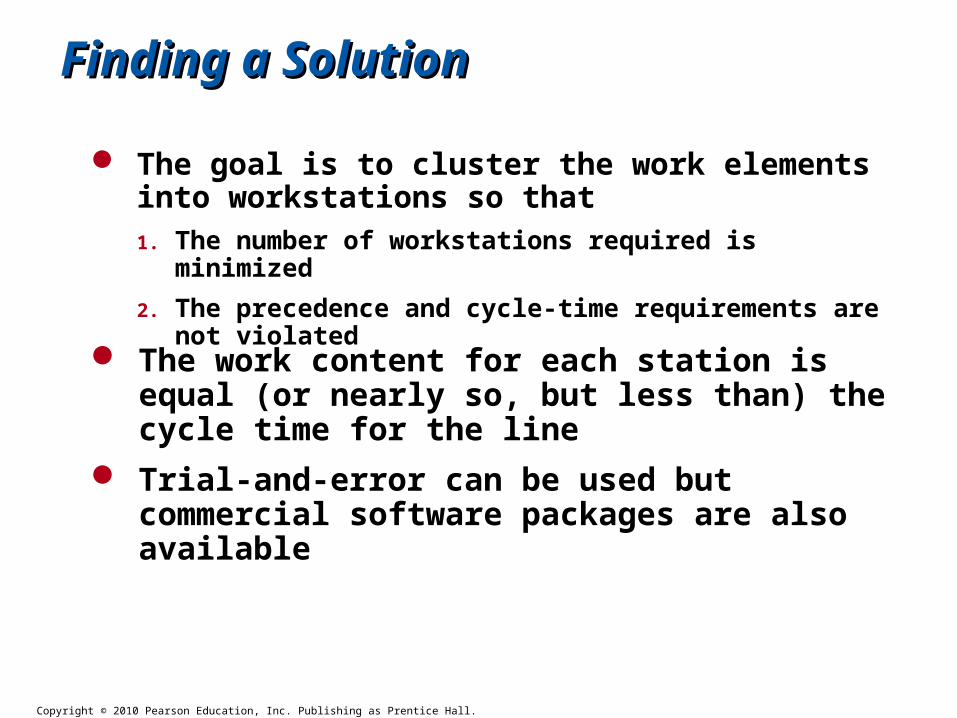
The goal is to cluster the work elements into workstations so that 1. The number of workstations required is minimized
2. The precedence and cycle-time requirements are not violated
The work content for each station is equal (or nearly so, but less than) the cycle time for the line
Trial-and-error can be used but commercial software packages are also available
Copyright © 2010 Pearson Education, Inc. Publishing as Prentice Hall.
Finding a SolutionFinding a Solution
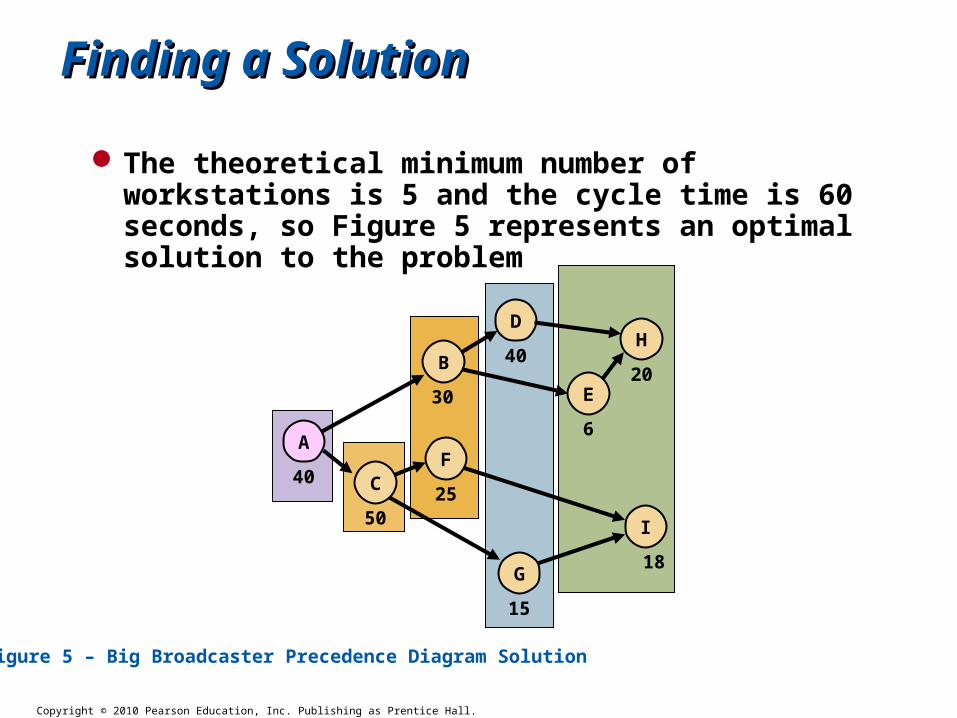
The theoretical minimum number of workstations is 5 and the cycle time is 60 seconds, so Figure 5 represents an optimal solution to the problem
Figure 5 – Big Broadcaster Precedence Diagram Solution
D
40
I
18
H
20
F
25C
50
E
6
B
30
A
40
G
15
Copyright © 2010 Pearson Education, Inc. Publishing as Prentice Hall.
In classIn class - Example - Example
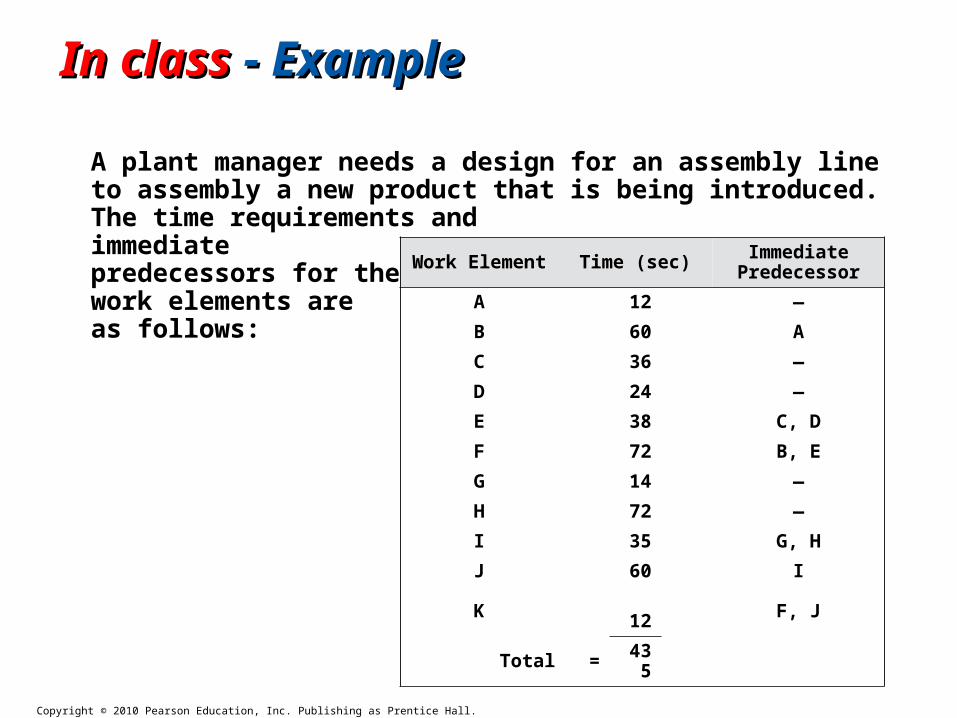
A plant manager needs a design for an assembly line to assembly a new product that is being introduced. The time requirements and immediate predecessors for the work elements are as follows:
Work Element Time (sec) Immediate Predecessor
A 12 ―
B 60 A
C 36 ―
D 24 ―
E 38 C, D
F 72 B, E
G 14 ―
H 72 ―
I 35 G, H
J 60 I
K 12 F, J
Total = 435
Copyright © 2010 Pearson Education, Inc. Publishing as Prentice Hall.
K
In classIn class - Example - Example
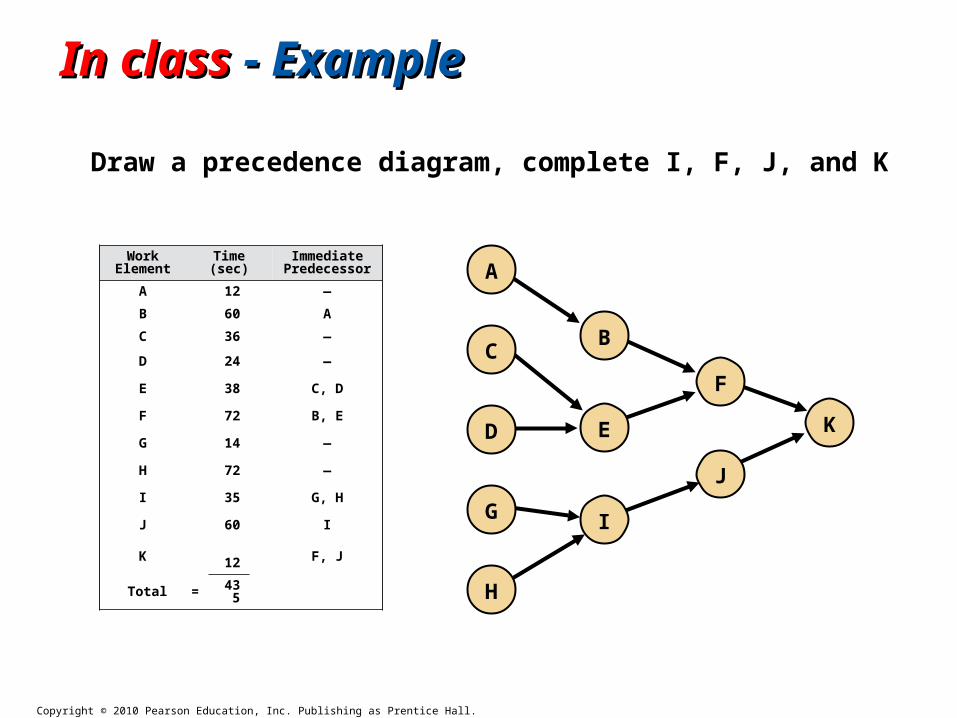
Draw a precedence diagram, complete I, F, J, and K
Work Element Time (sec) Immediate
Predecessor
A 12 ―
B 60 A
C 36 ―
D 24 ―
E 38 C, D
F 72 B, E
G 14 ―
H 72 ―
I 35 G, H
J 60 I
K 12 F, J
Total = 435
F
J
B
E
I
A
C
G
H
D
Copyright © 2010 Pearson Education, Inc. Publishing as Prentice Hall.
In classIn class - Example - Example
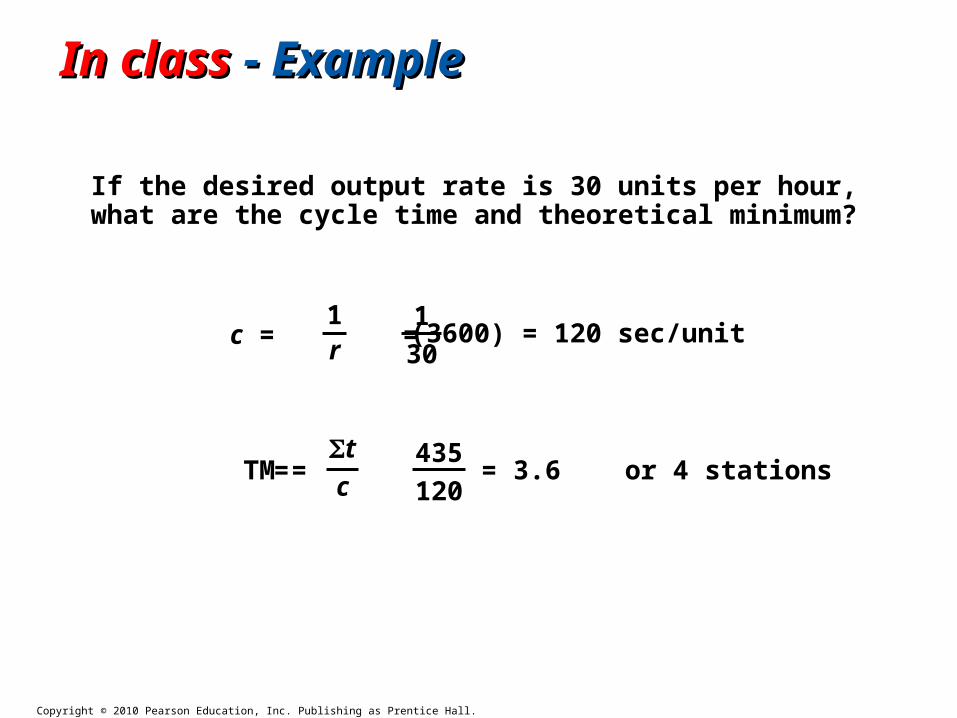
If the desired output rate is 30 units per hour, what are the cycle time and theoretical minimum?
c = =1r
1
30(3600) = 120 sec/unit
TM =tc
= = 3.6 or 4 stations435
120
Copyright © 2010 Pearson Education, Inc. Publishing as Prentice Hall.
In classIn class - Example - Example
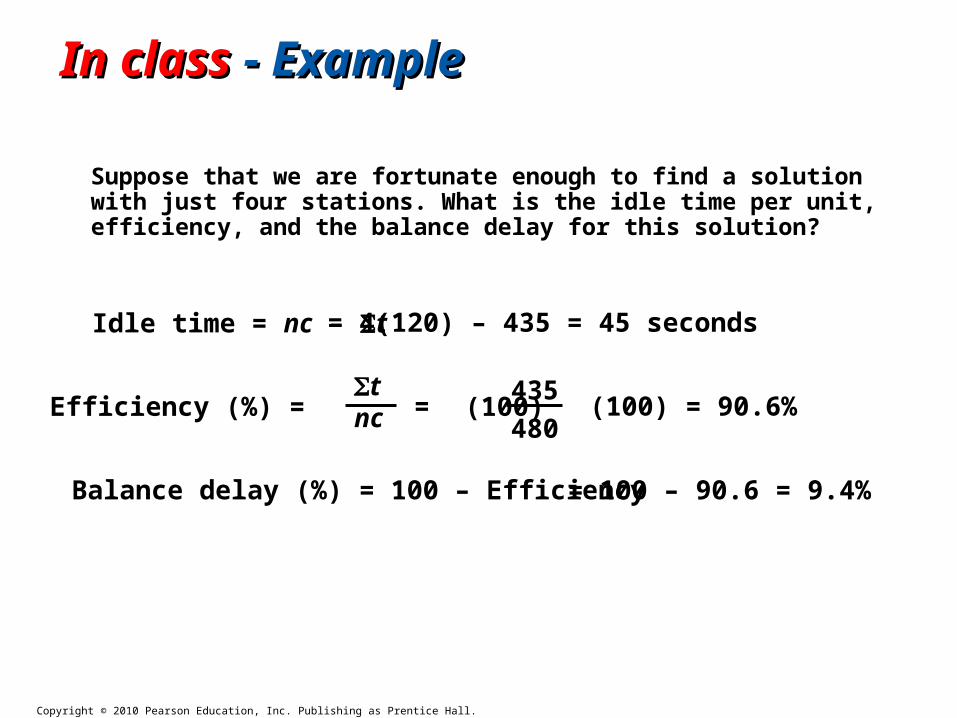
Suppose that we are fortunate enough to find a solution with just four stations. What is the idle time per unit, efficiency, and the balance delay for this solution?
Idle time = nc – t
Efficiency (%) = (100)tnc
Balance delay (%) = 100 – Efficiency
= 4(120) – 435 = 45 seconds
= 100 – 90.6 = 9.4%
= (100) = 90.6%435
480
Copyright © 2010 Pearson Education, Inc. Publishing as Prentice Hall.
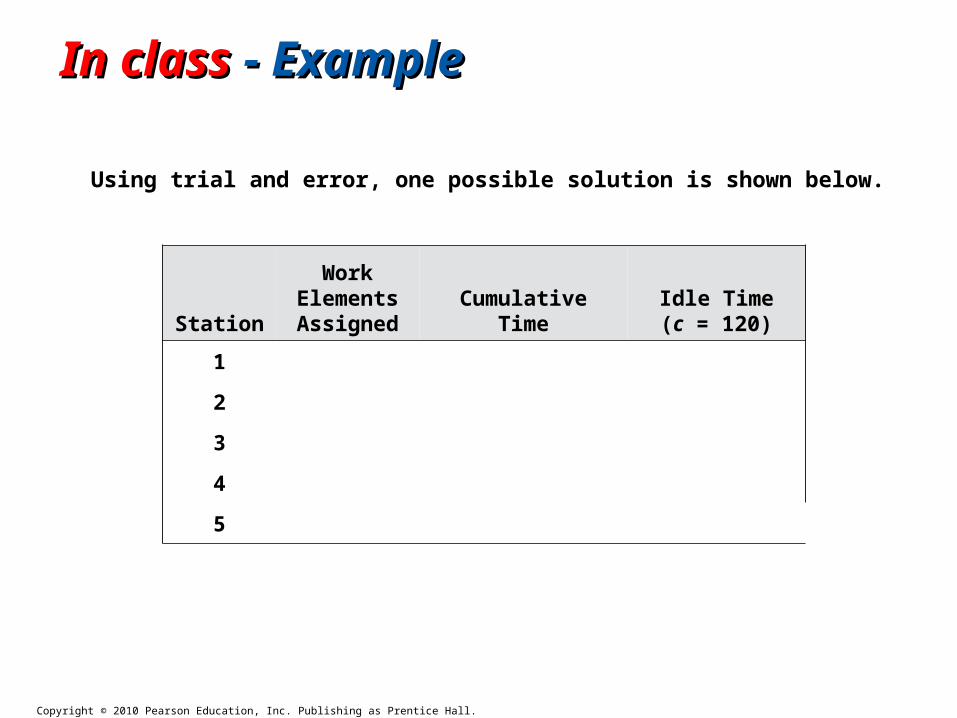
Station
Work Elements Assigned Cumulative Time
Idle Time(c = 120)
1
2
3
4
5
In classIn class - Example - Example
Using trial and error, one possible solution is shown below.
Copyright © 2010 Pearson Education, Inc. Publishing as Prentice Hall.
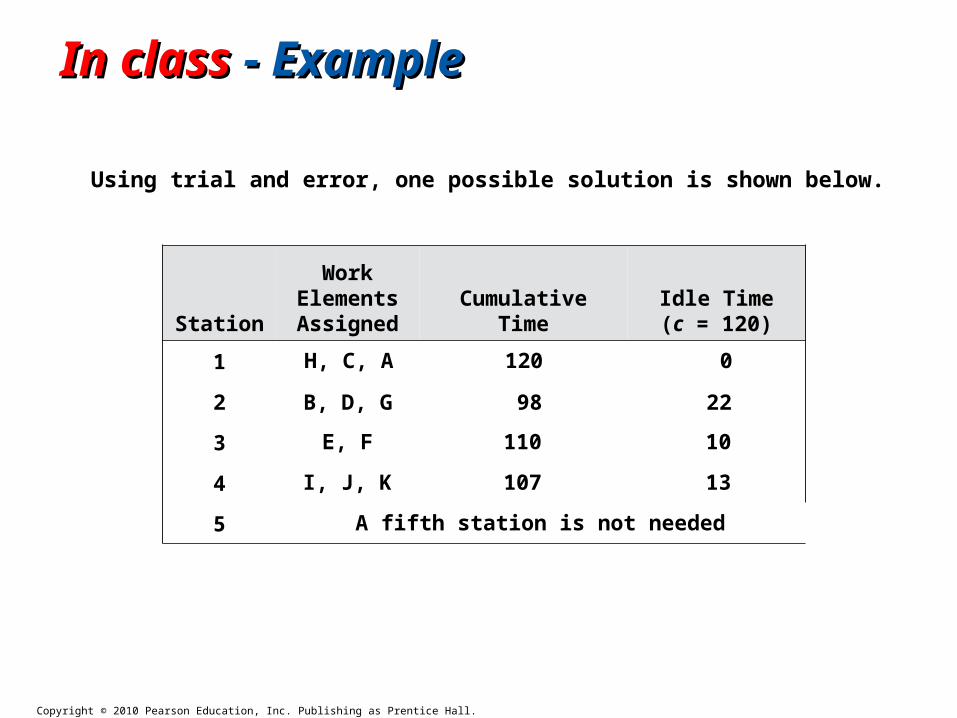
In classIn class - Example - Example
Using trial and error, one possible solution is shown below.
H, C, A 120 0
B, D, G 98 22
E, F 110 10
I, J, K 107 13
A fifth station is not needed
Station
Work Elements Assigned Cumulative Time
Idle Time(c = 120)
1
2
3
4
5
Copyright © 2010 Pearson Education, Inc. Publishing as Prentice Hall.
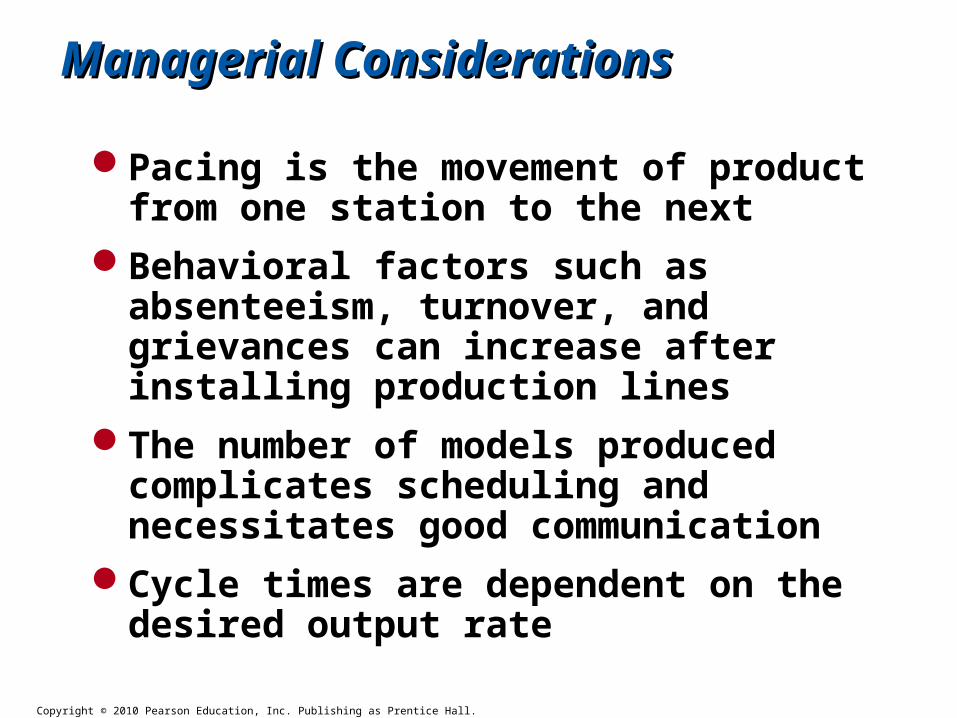
Managerial ConsiderationsManagerial Considerations
Pacing is the movement of product from one station to the next
Behavioral factors such as absenteeism, turnover, and grievances can increase after installing production lines
The number of models produced complicates scheduling and necessitates good communication
Cycle times are dependent on the desired output rate
Copyright © 2010 Pearson Education, Inc. Publishing as Prentice Hall.
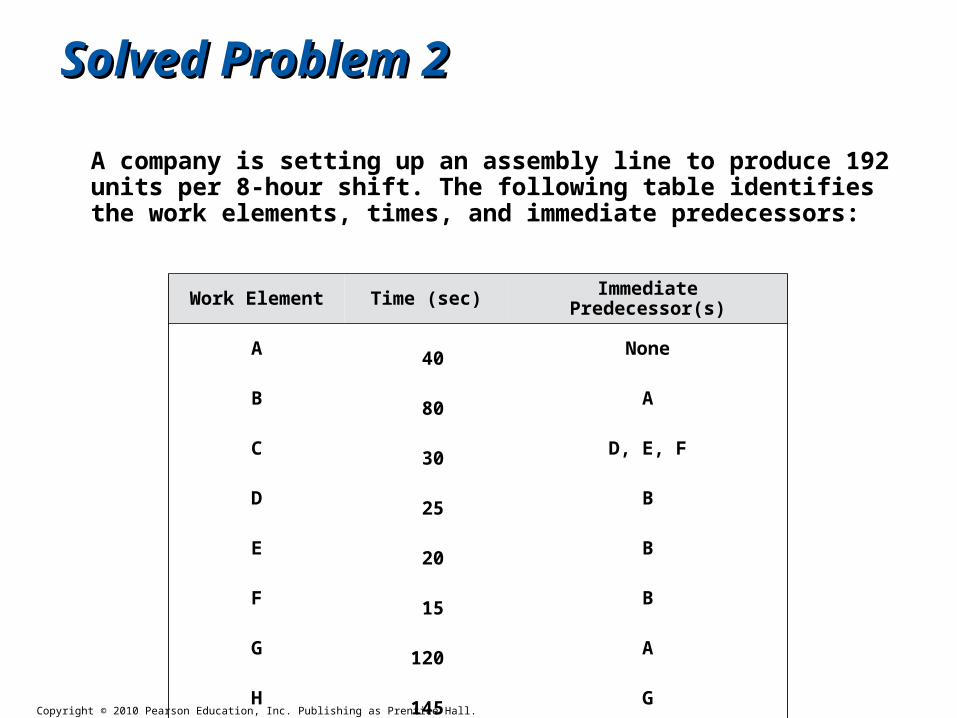
Solved Problem 2Solved Problem 2
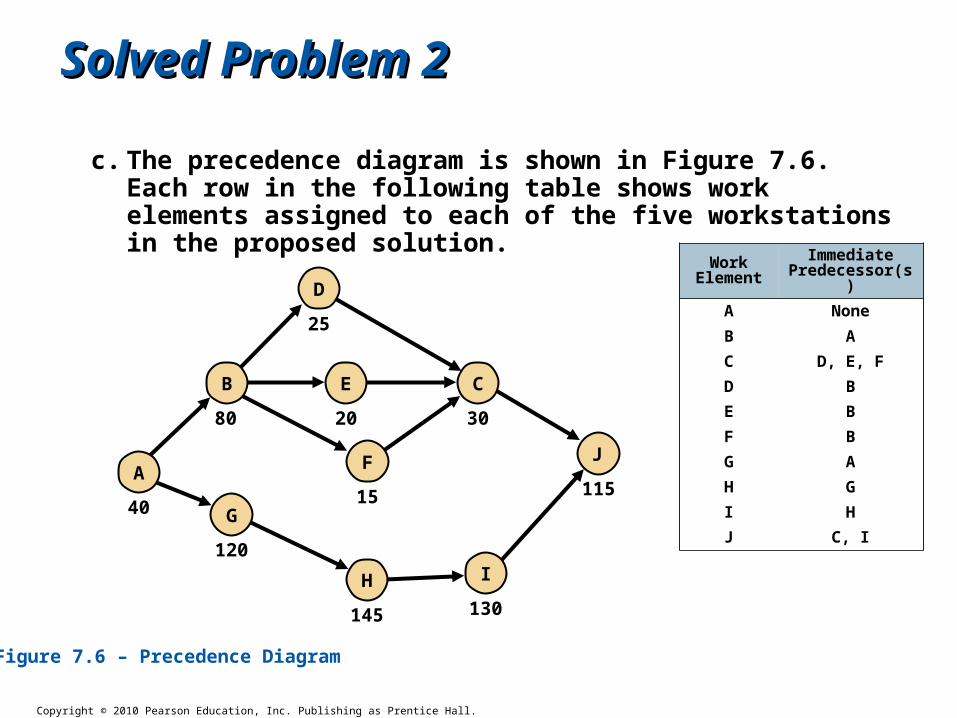
A company is setting up an assembly line to produce 192 units per 8-hour shift. The following table identifies the work elements, times, and immediate predecessors:
Work Element Time (sec) Immediate Predecessor(s)
A 40 None
B 80 A
C 30 D, E, F
D 25 B
E 20 B
F 15 B
G 120 A
H 145 G
I 130 H
J 115 C, I
Total 720
Copyright © 2010 Pearson Education, Inc. Publishing as Prentice Hall.
Solved Problem 2Solved Problem 2
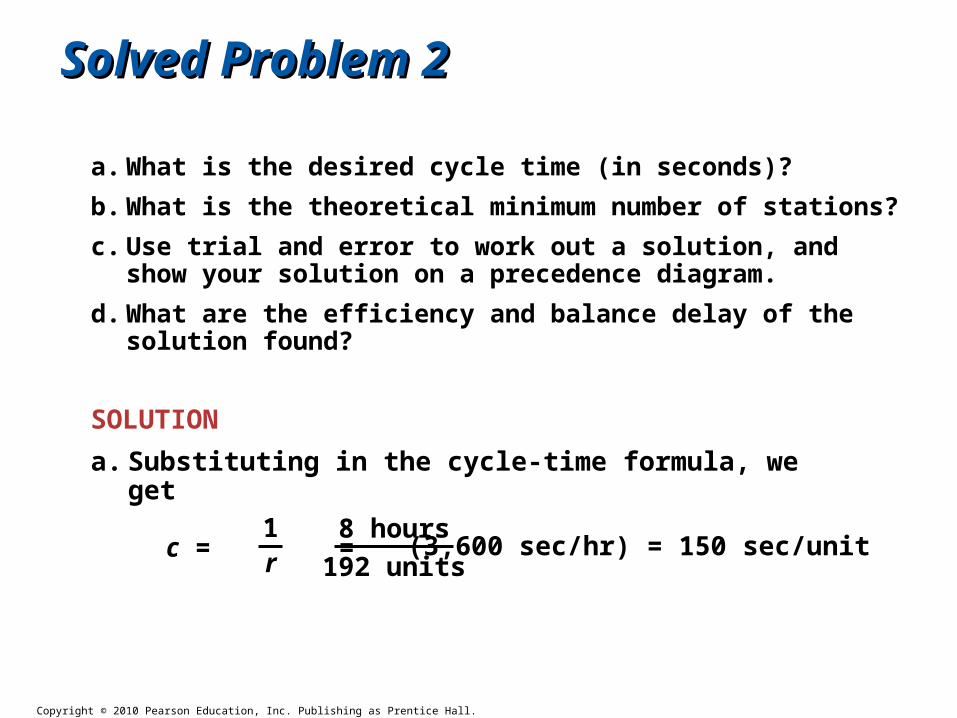
a. What is the desired cycle time (in seconds)?
b. What is the theoretical minimum number of stations?
c. Use trial and error to work out a solution, and show your solution on a precedence diagram.
d. What are the efficiency and balance delay of the solution found?
SOLUTION
a. Substituting in the cycle-time formula, we get
c = =1r
8 hours
192 units(3,600 sec/hr) = 150 sec/unit
Copyright © 2010 Pearson Education, Inc. Publishing as Prentice Hall.
Solved Problem 2Solved Problem 2
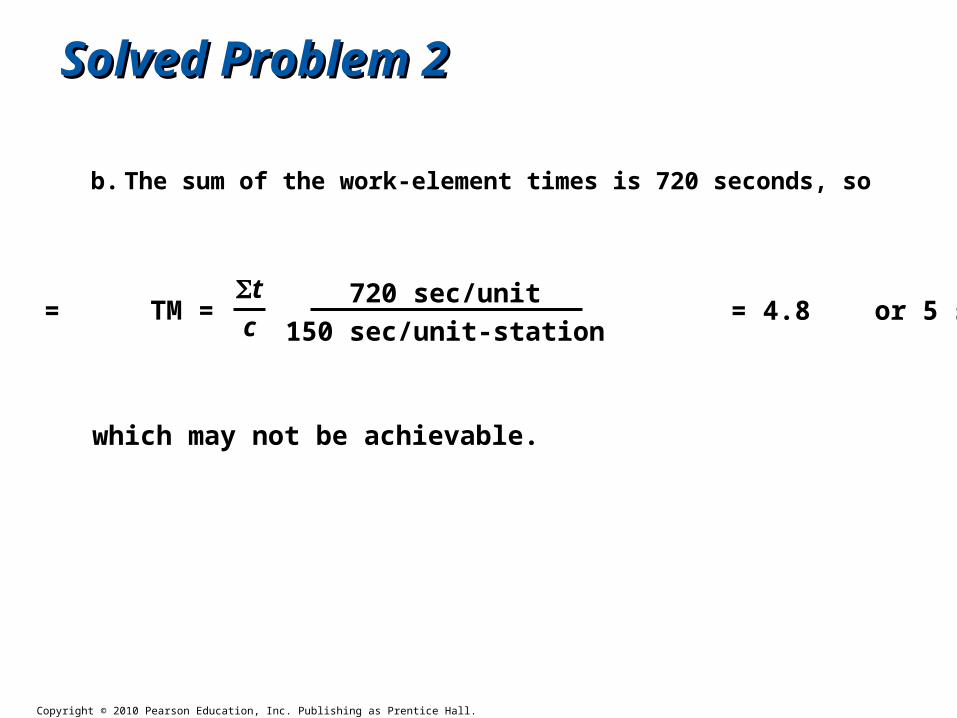
b. The sum of the work-element times is 720 seconds, so
TM =tc
= = 4.8 or 5 stations720 sec/unit
150 sec/unit-station
which may not be achievable.
Copyright © 2010 Pearson Education, Inc. Publishing as Prentice Hall.
Solved Problem 2Solved Problem 2
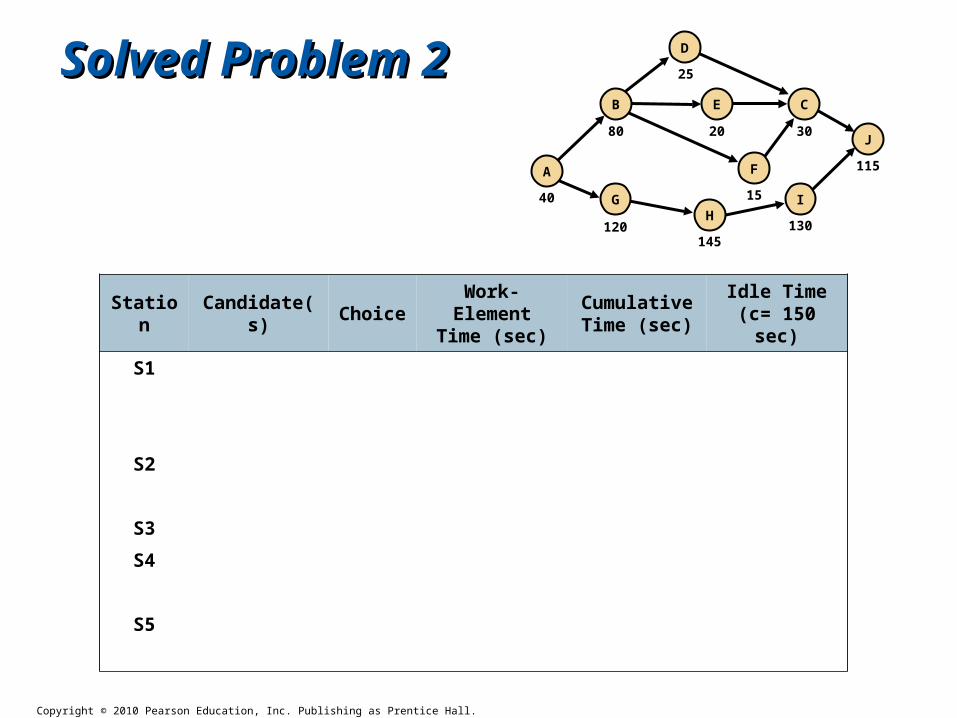
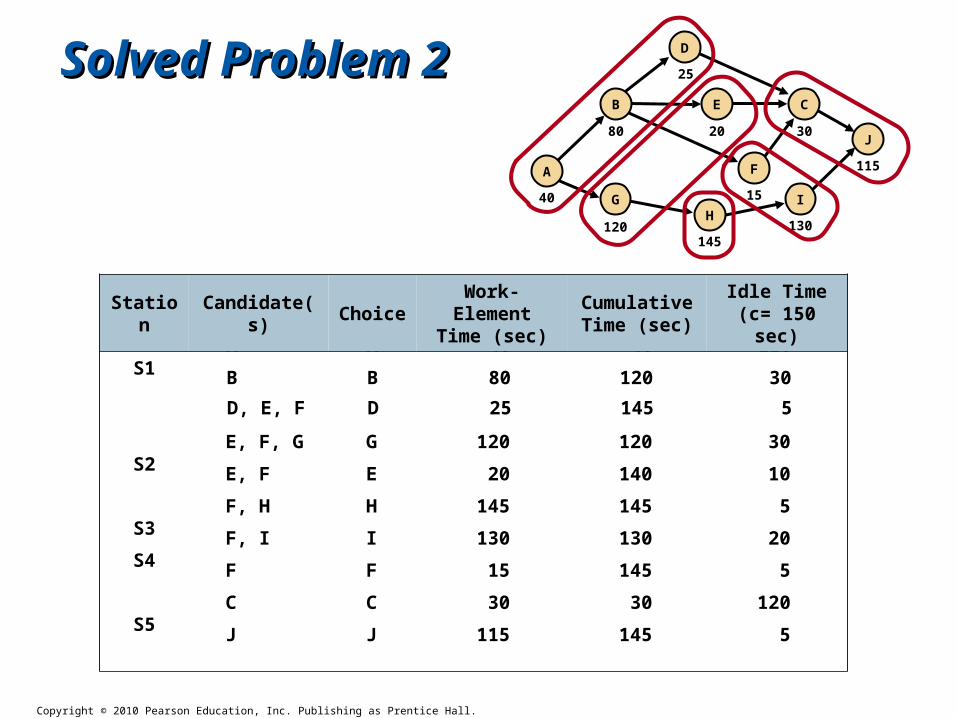
c. The precedence diagram is shown in Figure 7.6. Each row in the following table shows work elements assigned to each of the five workstations in the proposed solution.
J
115
C
30
D
25
E
20
F
15
I
130
H
145
B
80
G
120
A
40
Figure 7.6 – Precedence Diagram
Work Element
Immediate Predecessor(s)
A None
B A
C D, E, F
D B
E B
F B
G A
H G
I H
J C, I
Copyright © 2010 Pearson Education, Inc. Publishing as Prentice Hall.
Station Candidate(s) ChoiceWork-Element
Time (sec)Cumulative Time (sec)
Idle Time(c= 150 sec)
S1
S2
S3
S4
S5
Solved Problem 2Solved Problem 2
J
115
C
30
D
25
E
20
F
15 I
130H
145
B
80
G
120
A
40
Copyright © 2010 Pearson Education, Inc. Publishing as Prentice Hall.
Solved Problem 2Solved Problem 2
J
115
C
30
D
25
E
20
F
15 I
130H
145
B
80
G
120
A
40
A A 40 40 110
B B 80 120 30
D, E, F D 25 145 5
E, F, G G 120 120 30
E, F E 20 140 10
F, H H 145 145 5
F, I I 130 130 20
F F 15 145 5
C C 30 30 120
J J 115 145 5
Station Candidate(s) ChoiceWork-Element
Time (sec)Cumulative Time (sec)
Idle Time(c= 150 sec)
S1
S2
S3
S4
S5
Copyright © 2010 Pearson Education, Inc. Publishing as Prentice Hall.
Solved Problem 2Solved Problem 2
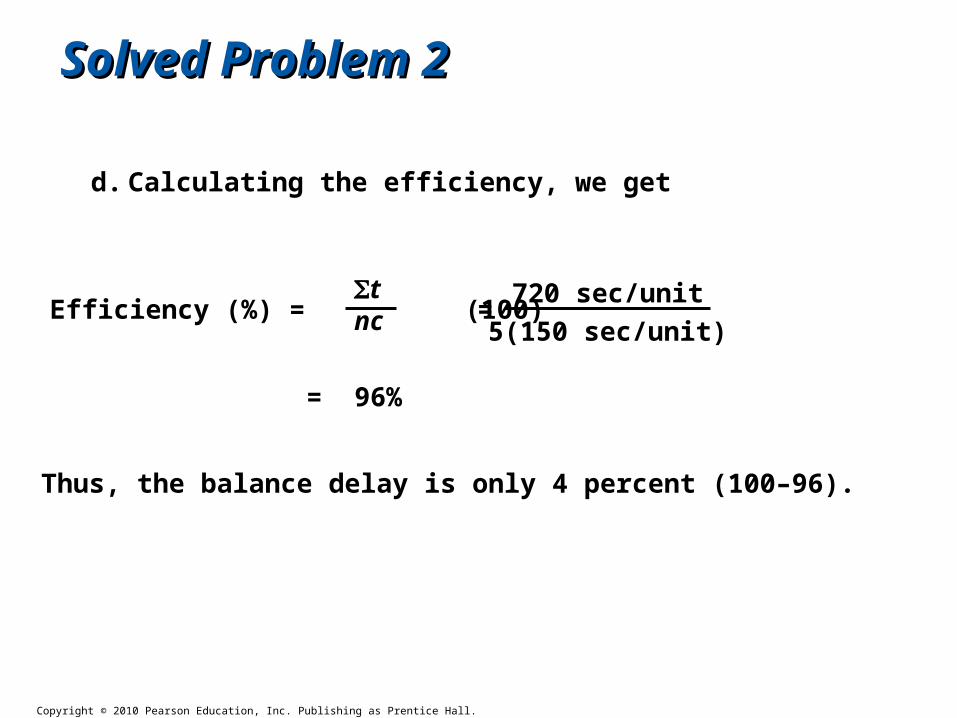
d. Calculating the efficiency, we get
Thus, the balance delay is only 4 percent (100–96).
Efficiency (%) = (100)tnc =
720 sec/unit
5(150 sec/unit)
= 96%