Embed Size (px)
Citation preview

Example Power Point Layout for Class PresentationYou can use the heading area for Talk Title or to note a key idea:
Basic Statistical Testing Exercise Designed Around the use of AVIRIS Data
Your name: Tom Wilson, WVU
An Intro or Cover Slide:
An AVIRIS image from Cuprite, Nevada
224 spectral measurements per
pixel

Suggested topics to Include
Background (Provide class with information about the data you are testing? What kind of data is it? Where did you get it? etc.)
Purpose/Objectives (What specific hypotheses will you test?)
Approach Describe how you will examine your hypothesis. What tests will you employ?
Procedures and Results Discuss the results of your statistical testing. Provide some key illustrations to illustrate your conclusions
Conclusions/Summary Summarize your main conclusion(s) on a single slide. Comment on what additional analysis might be done with the data.
References Optional in a presentation; often shown on individual slides when data sources or other comments are presented; could place on a final slide to display during question/answer period.

Background
From http://rst.gsfc.nasa.gov/Intro/Part2_24.html

Examples of AVIRIS Data
Source http://rst.gsfc.nasa.gov/Intro/Part2_24.html

Additional Examples for Background
From http://speclab.cr.usgs.gov/map.intro.html
The AVIRIS image used for the exercise was taken from the Cuprite mining district in Nevada.
This image is compiled from the hyperspectral AVIRIS data. The different colors are associated with the distribution of specific minerals across the surface.
The USGS (Calrk and Swayze, 1996) AVIRIS derived geologic interpretation of the area is shown at right.

Background (continued)
For the class exercise, AVIRIS data was
extracted from 6 bands in 4 different regions of
the Cuprite scene.
Region 1
Region 2 Region 4
Region 3The shades of gray image at right is taken from reflectance observed in Band 20 (the 0.57 micron band) of the AVIRIS data set. Note that regions 1-3 have similar shading or relatively similar reflectance, while region 4 is much brighter at this wavelength.
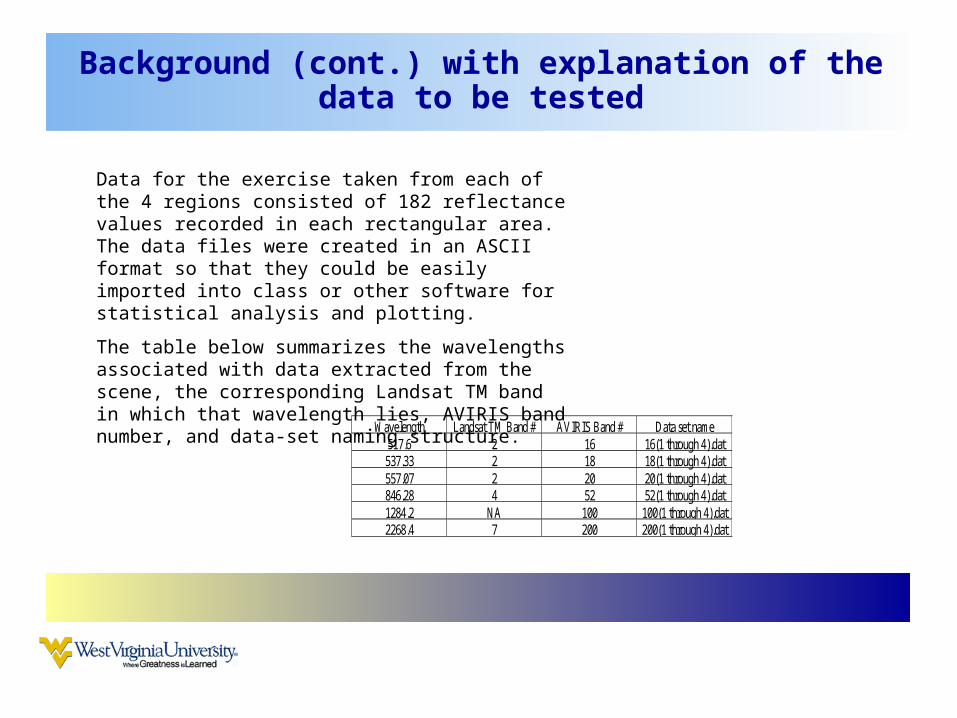
Background (cont.) with explanation of the data to be tested
Wavelength Landsat TM Band # AVIRIS Band # Data set name517.6 2 16 16(1 through 4).dat537.33 2 18 18(1 through 4).dat557.07 2 20 20(1 through 4).dat846.28 4 52 52(1 through 4).dat1284.2 NA 100 100(1 through 4).dat2268.4 7 200 200(1 through 4).dat
Data for the exercise taken from each of the 4 regions consisted of 182 reflectance values recorded in each rectangular area. The data files were created in an ASCII format so that they could be easily imported into class or other software for statistical analysis and plotting.
The table below summarizes the wavelengths associated with data extracted from the scene, the corresponding Landsat TM band in which that wavelength lies, AVIRIS band number, and data-set naming structure.

Background …..
Wavelength Landsat TM Band # AVIRIS Band # Data set name517.6 2 16 16(1 through 4).dat537.33 2 18 18(1 through 4).dat557.07 2 20 20(1 through 4).dat846.28 4 52 52(1 through 4).dat1284.2 NA 100 100(1 through 4).dat2268.4 7 200 200(1 through 4).dat
Imported ASCII data are shown at right in PsiPlot.
Identical numbers of observations (182 pixel measurements) are provided for each band.
Example data used in initial training exercise
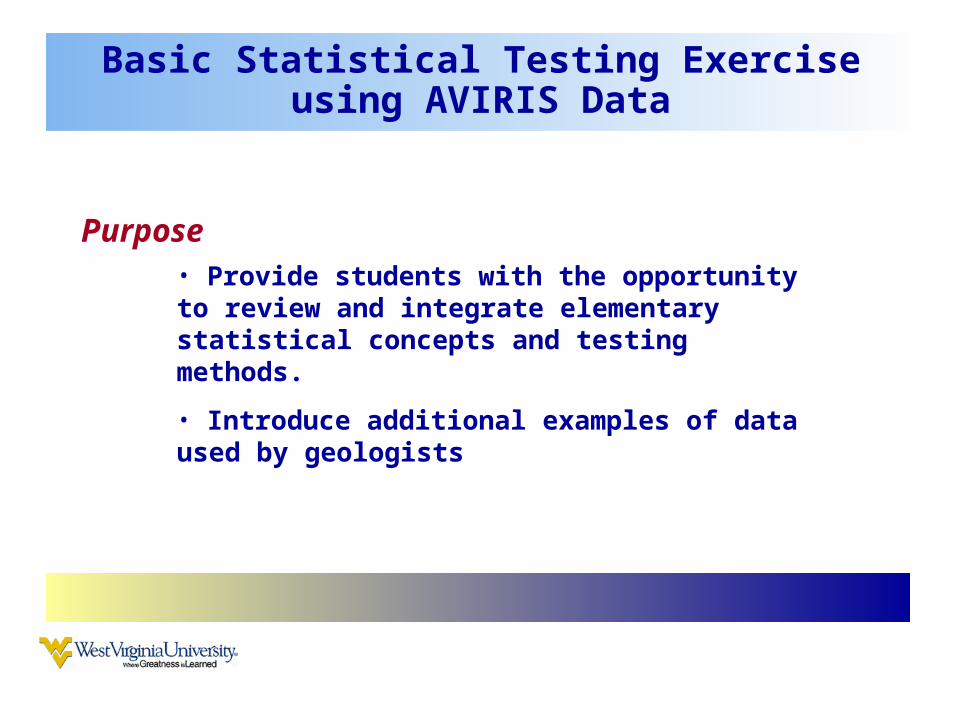
Basic Statistical Testing Exercise using AVIRIS Data
• Provide students with the opportunity to review and integrate elementary statistical concepts and testing methods.
• Introduce additional examples of data used by geologists
Purpose

Basic Statistical Testing Exercise using AVIRIS Data
Procedures/Results
Reflectance
4500 5000 5500 6000 6500 7000
Num
ber
of O
ccur
renc
es
0
20
40
60
80
100
Band 16 Reflectance
Reflectance
4500 5000 5500 6000 6500 7000
Num
ber
of O
ccur
renc
es
0
20
40
60
80
100
120
Band 20 Reflectance
t-testF-test
Avoid small text that no one can read

Basic Statistical Testing Exercise using AVIRIS Data
Procedures/Results
Reflectance Band164500 5000 5500 6000 6500
Ref
lect
ance
Ban
d20
5000
5500
6000
6500
7000
Cross plot of Band 16 and Band 20 with linear regression line
r = 0.994
A little better

Basic Statistical Testing Exercise using AVIRIS Data
Procedures/ResultsBetter yet –
Highlight derived statistics and relationships in a separate text box. It’s a little more work, but easier for the audience to see.
The regression line fit to the relationship between Band 16 and Band 200 reflectances has a slope = 0.07 and intercept of 124.3. This reveals that the range of reflectance variations in Band 200 (a thermal IR band at ~2.3 microns) are much smaller in total range than those found in Band 16 (an optical band (green) at approximately 0.5 microns).
The correlation coefficient of 0.8 between these two bands is smaller than we’ve seen between optical bands and bands separated by smaller wavelength intervals.
Reflectance Band16
4500 5000 5500 6000 6500
Re
flect
an
ce B
an
d2
00
440
460
480
500
520
540
560
580
Cross Plot of Band 16 and Band 200 with regression line

Basic Statistical Testing Exercise using AVIRIS Data
Procedures/Results Continue on additional slides to avoid too much text on a single slide
The correlation coefficient of 0.8 between these two bands is smaller than we’ve seen between optical bands and bands separated by smaller wavelength intervals.
The cross plot reveals greater scatter in values and less consistent relationship between reflectance in the IR and green bands.
Reflectance Band16
4500 5000 5500 6000 6500
Re
flect
an
ce B
an
d2
00
440
460
480
500
520
540
560
580
Cross Plot of Band 16 and Band 200 with regression line

Basic Statistical Testing Exercise using AVIRIS Data
The exercise provides an open-ended hypothesis testing experience.
The exercise is flexible and provides an appropriate learning activity and challenge to students with diverse backgrounds and experience.
The exercise provides an opportunity for students to integrate elementary statistical testing concepts using novel state-of-art geological data.
Conclusions

Basic Statistical Testing Exercise using AVIRIS Data
ReferencesAVIRIS home page, NASA Jet Propulsion Lab at http://makalu.jpl.nasa.gov/aviris.html
Clark, R.N., G.A. Swayze, and A. Gallagher, Mapping Minerals with Imaging Spectroscopy, U.S. Geological Survey, Office of Mineral Resources Bulletin 2039, pp. 141-150, 1993.
Davis, J., 2002, Statistics and Data Analysis in Geology
Swayze, G.A. R.N. Clark, S. Sutley, and A Gallagher, Ground-Truthing AVIRIS Mineral Mapping at Cuprite, Nevada, Summaries of the Third Annual JPL Airborne Geosciences Workshop, Volume 1: AVIRIS Workshop. JPL Publication 92-14, 47-49, 1992.
• ….


![[heading] - Mattias.pdf](https://img.pdfslide.us/doc/110x75/577cdf191a28ab9e78b07bec/heading-mattiaspdf.jpg)