Embed Size (px)
Citation preview

WS Action Plan 2013-14 - Kyogle C ouncil
Kyogle Council Water Supply – Action Plan Page 1 Summary In 2013-14, Kyogle Council implemented 90% of the water supply requirements of the NSW Best-Practice Management Framework and its performance has been [to be completed by Council].
Key actions from Council's Strategic Business Plan: - Insert achievements for Key Action 1 here for Kyogle Council - Insert achievements for Key Action 2 here for Kyogle Council
INDICATOR RESULT
2 COMMENT/DRIVERS ACTION
Best-Practice Management Framework
Implemented 90% of the Best-Practice Requirements
1
Implementation of the requirements demonstrates effectiveness and sustainability of water supply business. 100% implementation is required for eligibility to pay an ‘efficiency dividend’.
Prepare a new 30-year IWCM Strategy, Financial Plan & Report in accordance with the July 2014 IWCM Check List (www.water.nsw.gov.au) as the existing Strategic Business Plan is over 4 years old.
Address remaining BPM requirement: - (2c) ≥50% of residential revenue from usage charges
CHARACTERISTICS
5 Connected property density
34 per km of main
A connected property density below 30 can significantly increase the cost per property of providing services, as will also a high number of small discrete water supply schemes.
Highest ranking (1, 2)
9 Renewals expenditure
0.6%
Good
Adequate funds must be programmed for works outlined in the Asset Management Plan – page 3 of the 2013-14 NSW Performance Monitoring Report.
FOR INDICATORS 9 to 56 Where ranking is low, investigate reasons including past performance and trends, develop remedial action plan and summarise in this column.
High ranking (2, 2)
10 Employees 3.1 per 1,000 props May require
review
Lowest ranking (5, 5)
SOCIAL - CHARGES
12 Residential water usage charge
130 c/kL
Review
Benefits of strong pricing signals are shown on page 5 of the 2013-14 NSW Performance Monitoring Report.
Increase usage charge to achieve BPM requirement (2c). Median ranking (3, 4)
13 Residential access charges
$340 per assessment Review See 12 and 16.
Highest ranking (1, 1)
14 Typical residential bill
3 (TRB)
$525 per assessment
Review
TRB should be consistent with projection in the financial plan, and should achieve full cost recovery. Drivers – OMA Management Cost and Capital Expenditure.
See Footnote 3 and Indicators 12 and 43. Highest ranking (1, 1)
15 Typical developer charges
$2900 per ET Exempt (low growth)
Median ranking (3, 4)
16 Residential revenue from usage charges
41% of residential bills May require
review
≥ 50% of residential revenue should be generated through usage charges.
See 12 and 13.
Lowest ranking (5, 5)
SOCIAL – HEALTH
19 Physical quality compliance
Yes Very good
Highest ranking (1, 1)
19a
Chemical quality compliance
Yes Very good
Highest ranking (1, 1)
20 Microbiological compliance
4
Yes Very good
Critical indicator. LWUs should annually review their DWMS in accordance with NSW guidelines
4.
Highest ranking (1, 1)
1. Council needs to annually ‘roll forward’, review and update its 30-year total asset management plan (TAMP) and 30-year financial plan, review Council's TBL Performance Report and prepare an Action Plan to Council. The Action Plan is to include any actions identified in Council’s annual review of its DWMS (Indicator 20) and any section 61 Reports from the NSW Office of Water. Refer to pages 27, 28, 107 and 111 of the 2013-14 NSW Water Supply and Sewerage Performance Monitoring Report.
2. The ranking relative to similar size LWUs is shown first (Col. 2 of TBL Report) followed by the ranking relative to all LWUs (Col. 3 of TBL Report).
3. Review and comparison of the 2014-15 Typical Residential Bill (Indicator 14) with the projection in the later of your IWCM Strategy and financial plan and your Strategic Business Plan is mandatory. In addition, if both indicators 43 and 44 are negative, you must report your proposed 2015-16 typical residential bill to achieve full cost recovery.
4. Microbiological compliance (Indicator 20) is a high priority for each NSW LWU. Corrective action for non-compliance (≤97%), or any ‘boil water alerts’ must be reported in your Action Plan. Refer to pages 7, 8 and 28 of the 2013-14 NSW Water Supply and Sewerage Performance Monitoring Report (www.water.nsw.gov.au) and NSW Guidelines for drinking water quality management systems, NSW Health and NSW Office of Water, 2013.

Kyogle Council Water Supply – Action Plan Page 2
INDICATOR RESULT COMMENT/DRIVERS ACTION
SOCIAL – LEVELS OF SERVICE
25 Water quality complaints
5.2 per 1,000 props May require review
Critical indicator of customer service.
Low ranking (4, 4)
26 Service complaints 15.7 per 1,000 props
Good Key indicator of customer service.
High ranking (2, 3)
27 Average frequency of unplanned interruptions
Not reported
Key indicator of customer service, condition of network and effectiveness of operation.
30 Number of main breaks
9 per 100km of main Satisfactory
Drivers – condition and age of water mains, ground conditions.
Median ranking (3, 2)
32 Total Days Lost 1.7% May require
review
Low ranking (4, 3)
ENVIRONMENTAL
33 Average annual residential water supplied
143 kL per prop
Good
Drivers – available water supply, climate, location (Inland or coastal), pricing signals (Indicator 3), restrictions.
Highest ranking (1, 1)
34 Real losses (leakage)
30 L/c/d
Very good
Loss reduction is important where an LWU is facing drought water restrictions or the need to augment its water supply system.
Highest ranking (1, 1)
ECONOMIC
43 Economic Real Rate of Return (ERRR)
-1.4%
Review
Reflects the rate of return generated from operating activities (excluding interest income and grants). An ERRR or ROA of ≥ 0% is required for full cost recovery.
Increase 2015-16 charges to achieve full cost recovery - refer to page 13 of 2013-14 NSW Performance Monitoring Report. Also see 12, 14 and Footnote 3 on page 1.
Lowest ranking (5, 5)
44 Return on assets (ROA)
-1.6% See 43.
Lowest ranking (5, 5)
45 Net debt to equity
1%
Very good
LWUs facing significant capital investment are encouraged to make greater use of borrowings – page 14 of the 2013-14 NSW Performance Monitoring Report.
Highest ranking (1, 2)
46 Interest cover 0
Drivers – in general, an interest cover > 2 is satisfactory.
Lowest ranking (5, 5)
47 Loan payment
$17 per prop
Satisfactory
The component of TRB required to meet debt payments. Drivers – expenditure on capital works, short term loans.
Median ranking (3, 3)
49 Operating cost (OMA)
$701 per prop
May require review
Prime indicator of the financial performance of an LWU. Drivers – development density, level of treatment, management cost, topography, number of discrete schemes and economies of scale.
Review components carefully to ensure efficient operating cost.
Lowest ranking (5, 5)
51 Management cost $150 per prop
Satisfactory Typically about 40% of the OMA. Drivers – No. of employees. No. of small discrete water schemes.
Median ranking (3, 3)
52 Treatment cost $338 per prop
May require review
Drivers – type and quality of water source. Size of treatment works
Lowest ranking (5, 5)
53 Pumping cost $70 per prop
Good Drivers – topography, development density and location of water source.
High ranking (2, 3)
55 Water main cost $65 per prop
Good Drivers – age and condition of mains. Ground conditions. Development density.
High ranking (2, 2)
56 Capital expenditure
$86 per prop
An indicator of the level of investment in the business. Drivers – age and condition of assets, asset life cycle and water source.
Low ranking (4, 4)

SGE Action Plan 2013-14 - Kyogle C ouncil
Kyogle Council Sewerage – Action Plan Page 1 Summary In 2013-14, Kyogle Council implemented all the sewerage requirements of the NSW Best-Practice Management Framework and its performance has been [to be completed by Council].
Key actions from Council's Strategic Business Plan: - Insert achievements for Key Action 1 here for Kyogle Council - Insert achievements for Key Action 2 here for Kyogle Council
INDICATOR RESULT2 COMMENT/DRIVERS ACTION
Best-Practice Management Framework
Implemented all the Best Practice Requirements
1
Very good
Implementation demonstrates effectiveness and sustainability of water supply and sewerage business. 100% implementation is required for eligibility to pay an ‘efficiency dividend’.
Prepare a new 30-year IWCM Strategy, Financial Plan & Report in accordance with the July 2014 IWCM Check List (www.water.nsw.gov.au) as the existing Strategic Business Plan is over 4 years old.
CHARACTERISTICS
5 Connected property density
28 per km of main Lower than the statewide median of 38
A connected property density below about 30 can significantly increase the cost per property of providing services.
7 Renewals expenditure
0.6%
Very good
Adequate funds must be programmed for works outlined in the Asset Management Plan – page 3 of the 2013-14 NSW Performance Monitoring Report.
FOR INDICATORS 7 to 57 Where ranking is low, investigate reasons including past performance and trends, develop remedial action plan and summarise in this column.
Highest ranking (1, 2)
8 Employees 3.5 per 1,000 props May require
review
Lowest ranking (5, 5)
SOCIAL – CHARGES
12 Typical residential bill
3 (TRB)
$643 per assessment
TRB should be consistent with projection in the financial plan. Drivers – OMA Management Cost and Capital Expenditure.
Low ranking (4, 4)
13 Typical Developer Charges
$2130 per ET
Low ranking (4, 4)
14 Non-residential sewer usage charge
100c/kL May require review
Low ranking (4, 4)
SOCIAL - HEALTH
16 Sewerage coverage
87.8% May require review
Low ranking (4, 4)
17 Percent sewage treated to tertiary level
93% May require review
Low ranking (4, 4)
18 Percent of sewage volume that complied
11% Review
Key indicator of compliance with regulator.
Lowest ranking (5, 5)
19 Sewage treatment works compliant at all times
1 of 3
Key indicator of compliance with regulator.
SOCIAL – LEVELS OF SERVICE
21 Odour Complaints 1.8 per 1,000 props May require
review Critical indicator of customer service and operation of treatment works.
Lowest ranking (5, 5)
22 Service complaints 11 per 1,000 props
Good Key indicator of customer service.
High ranking (2, 3)
23a
Average Duration of Interruption
90 minutes Satisfactory
Key indicator of customer service, condition of network and effectiveness of operation.
Median ranking (3, 3)
25 Total Days Lost 1.7% May require
review
Low ranking (4, 3)
1. Council needs to annually ‘roll forward’, review and update its 30-year total asset management plan (TAMP) and 30-year financial plan, review Council's TBL Performance Report and prepare an Action Plan to Council. The Action Plan is to include any actions identified in Council’s annual review of its DWMS (Indicator 20) and any section 61 Reports from the NSW Office of Water. Refer to pages 27, 28, 107 and 111 of the 2013-14 NSW Water Supply and Sewerage Performance Monitoring Report.
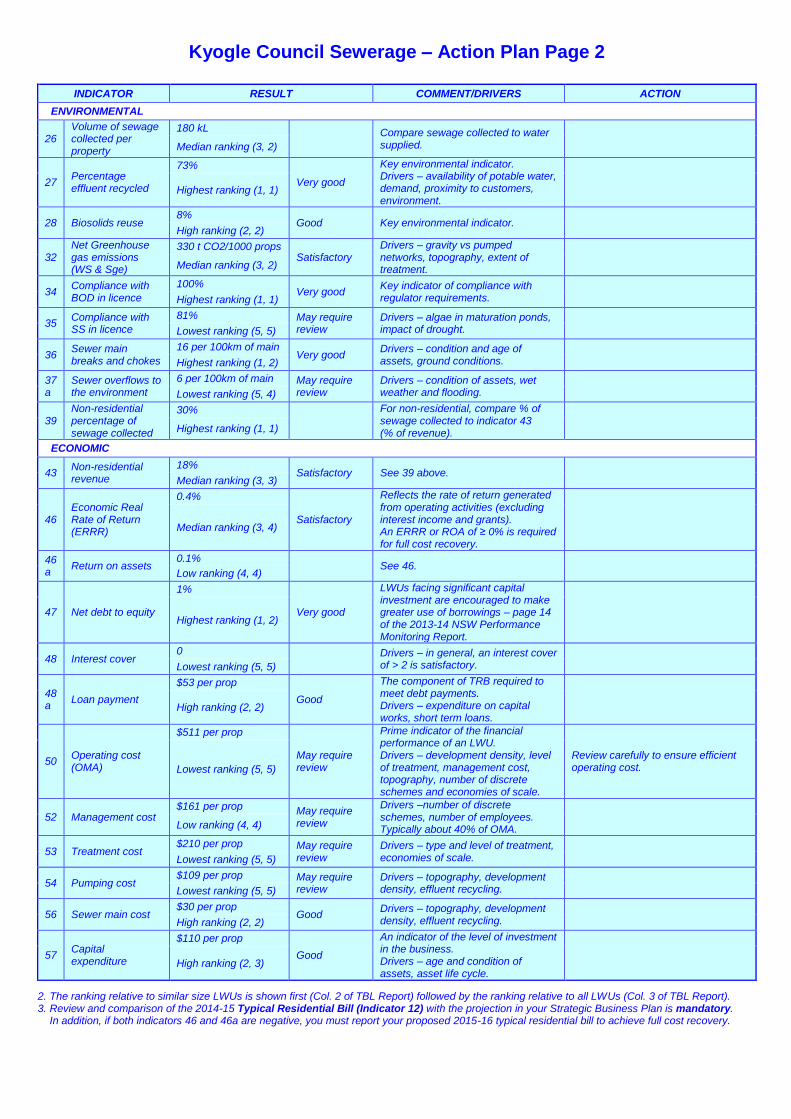
Kyogle Council Sewerage – Action Plan Page 2
INDICATOR RESULT COMMENT/DRIVERS ACTION
ENVIRONMENTAL
26 Volume of sewage collected per property
180 kL
Compare sewage collected to water supplied.
Median ranking (3, 2)
27 Percentage effluent recycled
73%
Very good
Key environmental indicator. Drivers – availability of potable water, demand, proximity to customers, environment.
Highest ranking (1, 1)
28 Biosolids reuse 8%
Good Key environmental indicator.
High ranking (2, 2)
32 Net Greenhouse gas emissions (WS & Sge)
330 t CO2/1000 props Satisfactory
Drivers – gravity vs pumped networks, topography, extent of treatment.
Median ranking (3, 2)
34 Compliance with BOD in licence
100% Very good
Key indicator of compliance with regulator requirements.
Highest ranking (1, 1)
35 Compliance with SS in licence
81% May require review
Drivers – algae in maturation ponds, impact of drought.
Lowest ranking (5, 5)
36 Sewer main breaks and chokes
16 per 100km of main Very good
Drivers – condition and age of assets, ground conditions.
Highest ranking (1, 2)
37a
Sewer overflows to the environment
6 per 100km of main May require review
Drivers – condition of assets, wet weather and flooding.
Lowest ranking (5, 4)
39 Non-residential percentage of sewage collected
30%
For non-residential, compare % of sewage collected to indicator 43 (% of revenue).
Highest ranking (1, 1)
ECONOMIC
43 Non-residential revenue
18% Satisfactory See 39 above.
Median ranking (3, 3)
46 Economic Real Rate of Return (ERRR)
0.4%
Satisfactory
Reflects the rate of return generated from operating activities (excluding interest income and grants). An ERRR or ROA of ≥ 0% is required for full cost recovery.
Median ranking (3, 4)
46a
Return on assets 0.1%
See 46.
Low ranking (4, 4)
47 Net debt to equity
1%
Very good
LWUs facing significant capital investment are encouraged to make greater use of borrowings – page 14 of the 2013-14 NSW Performance Monitoring Report.
Highest ranking (1, 2)
48 Interest cover 0
Drivers – in general, an interest cover of > 2 is satisfactory.
Lowest ranking (5, 5)
48a
Loan payment
$53 per prop
Good
The component of TRB required to meet debt payments. Drivers – expenditure on capital works, short term loans.
High ranking (2, 2)
50 Operating cost (OMA)
$511 per prop
May require review
Prime indicator of the financial performance of an LWU. Drivers – development density, level of treatment, management cost, topography, number of discrete schemes and economies of scale.
Review carefully to ensure efficient operating cost. Lowest ranking (5, 5)
52 Management cost $161 per prop May require
review
Drivers –number of discrete schemes, number of employees. Typically about 40% of OMA.
Low ranking (4, 4)
53 Treatment cost $210 per prop May require
review Drivers – type and level of treatment, economies of scale.
Lowest ranking (5, 5)
54 Pumping cost $109 per prop May require
review Drivers – topography, development density, effluent recycling.
Lowest ranking (5, 5)
56 Sewer main cost $30 per prop
Good Drivers – topography, development density, effluent recycling.
High ranking (2, 2)
57 Capital expenditure
$110 per prop
Good
An indicator of the level of investment in the business. Drivers – age and condition of assets, asset life cycle.
High ranking (2, 3)
2. The ranking relative to similar size LWUs is shown first (Col. 2 of TBL Report) followed by the ranking relative to all LWUs (Col. 3 of TBL Report). 3. Review and comparison of the 2014-15 Typical Residential Bill (Indicator 12) with the projection in your Strategic Business Plan is mandatory. In addition, if both indicators 46 and 46a are negative, you must report your proposed 2015-16 typical residential bill to achieve full cost recovery.

Kyogle Council TBL Water Supply Performance 2013-14
IMPLEMENTATION OF REQUIREMENTS OF NSW BEST-PRACTICE MANAGEMENT (BPM) FRAMEWORK
(1) Complete Current Strategic Business Plan & Financial Plan YES (3) Sound water conservation implemented
(2) (2a) Pricing - Full Cost Recovery, without significant cross subsidies Yes (4) Sound drought management implemented
(2b,2c) Pricing - Appropriate Residential Charges (5) Complete performance reporting (by 15 September)
(2d) Pricing - Appropriate Non-residential Charges Yes (6) Integrated water cycle management strategy
(2e) Pricing - DSP with Commercial Developer Charges Yes IMPLEMENTATION OF ALL REQUIREMENTS
TRIPLE BOTTOM LINE (TBL) PERFORMANCE INDICATORS LWU
NWI No.RESULT All LWUs
Statewide National
C1 1 Population served: 3700 Note 1 Note 2 Note 3 Note 4
C4 2 Number of connected properties: 1910 Number of assessments: 2010 Col 1 Col 2 Col 3 Col 4 Col 5
3 Residential connected properties (% of total) % 87 91
4 New residences connected to water supply (%) % 1.2 1 2 0.9
A3 5 Properties served per kilometre of water main Prop/km 34 32 35
6 Rainfall (% of median annual rainfall) % 64 5 5 77
W11 7 Total urban water supplied at master meters (ML) ML 610 6,800 10,280
8 Peak week to average consumption (%) % 109 1 1 152
9 Renewals expenditure (% of current replacement cost of system assets) % 0.6 2 2 0.5
10 Employees per 1000 properties per 1,000 prop 3.1 5 5 1.5
P1 Residential tariff structure for 2014-15: inclining block; independent of land value; access charge $340
P1.3 12a Residential water usage charge for 2013-14 for usage <200 kL (c/kL) c/kL (2013-14) 120 3 4 208 185
12 Residential water usage charge for 2014-15 for usage <200 kL (c/kL) c/kL (2014-15) 130 3 4 213
P3 14a Typical residential bill for 2013-14 ($/assessment) $ (2013-14) 492 1 1 550 567
14 Typical residential bill for 2014-15 ($/assessment) $ (2014-15) 525 1 1 582
15 Typical developer charge for 2014-15 ($/equivalent tenement) $ (2014-15) 2,900 3 4 5,500
F4 16 Residential revenue from usage charges (% of residential bills) % 41 5 5 73 68
F5 17 Revenue per property - water ($/property) $/prop 660 5 5 795 849
18 Water Supply Coverage (% of Urban Population with reticulated WS) % of population 87 5 5 99.6
H6 18a Risk based drinking water quality plan? Yes19 Physical compliance achieved? Note 10 Yes 1 1
19a Chemical compliance achieved? Note10 Yes 1 1
H4 19b % population with chemical compliance 100 1 1 100
20 Microbiological (E. coli) compliance achieved? Note 10 Yes 1 1
H3 20a % population with microbiological compliance % of population 100 1 1 100 100
C9 25 Water quality complaints per 1000 properties per 1,000 prop 5 4 4 3 2
C10 26 Water service complaints per 1000 properties per 1,000 prop 15 2 3 6 1
C17 27 Incidence of unplanned interruptions per 1000 properties per 1,000 prop 50 96
C15 28 Average duration of interruption (min) min 150 113
A8 30 Number of water main breaks per 100 km of water main per 100km 9 3 2 10 13
31 Drought water restrictions (% of time) % of time 0 1 1 0
32 Total days lost (%) % 1.7 4 3 2.9
W12 33 Average annual residential water supplied - STATEWIDE (kL/property) kL/prop 143 1 1 173 185
33a Average annual residential water supplied - COASTAL LWUs (kL/property) kL/prop 143 1 1 157
33b Average annual residential water supplied - INLAND LWUs (kL/property) kL/prop 263
A10 34 Real losses (leakage) (L/service connection/day) L/connection/day 30 1 1 70 79
35 Energy consumption per Megalitre (kiloWatt hours) kWh 682 4 4 620
36 Renewable energy consumption (% of total energy consumption) % 0E12 36a Net greenhouse gas emissions - WS & Sge (net tonnes CO2 - equivalents per 1000 properties) t CO2 330 3 2 370 390
42 Current replacement cost per assessment ($) $ 11,000 4 5 16,500
F17 43 Economic real rate of return - Water (%) % -1.4 5 5 1.2 1.9
44 Return on assets - Water (%) % -1.6 5 5 1.1
F22 45 Net Debt to equity - WS&Sge (%) % 1 1 2 1 11
F23 46 Interest cover - WS&Sge 0 5 5 4 2
47 Loan payment per property - Water ($) $ 17 3 3 64
F24 47b Net profit after tax - WS & Sge ($'000) $'000 -240 5 5 1180 5345
48 Operating cost (OMA) per 100km of main ($'000) $'000 2,160 5 5 1,290
F11 49 Operating cost (OMA) per property ($/prop) Note 8 $/prop 701 5 5 400 439
50 Operating cost (OMA) per kilolitre (cents) c/kL 197 4 5 126
51 Management cost ($/prop) $/prop 150 3 3 140
52 Treatment cost ($/prop) $/prop 338 5 5 58
53 Pumping cost ($/prop) $/prop 70 2 3 43
54 Energy cost ($/prop) $/prop 30 1 2 25
55 Water main cost ($/prop) $/prop 65 2 2 74
F28 56 Capital Expenditure ($/prop) $/prop 86 4 4 181 175
NOTES :
1
2
3
4
5
6
7
7.1
8
9
10
11
12
12
13
review and update their 30-year total asset management plan (TAMP) and 30-year financial plan.
Compliance with ADWG 2011 for drinking water quality is shown as "Yes" if compliance has been achieved (indicators 19, 19a & 20).
Kyogle Council has 2 fully qualified water treatment operators who meet the requirements of the National Certification Framework.
Non-residential water supplied was 34% of potable water supplied excluding non-revenue water.
Non-residential revenue was 30% of annual rates and charges, indicating fair pricing of services between the residential and non-residential sectors.
Operating cost (OMA) per property was $701, including $68 for bulk supply. Other components were: management ($150), operation ($320), maintenance ($114), energy ($30) & chemical
There were no rehabilitations. Renewals expenditure was $255,000/100km of main.
LWUs are required to annually review key projections & actions in the later of their IWCM Strategy and financial plan and their Strategic Business Plan and to annually 'roll forward',
SE
RV
ICE
LE
VE
LSC
HA
RA
CT
ER
IST
ICS
SO
CIA
LE
NV
IRO
NM
EN
TA
LE
CO
NO
MIC
EF
FIC
IEN
CY
UT
ILIT
Y
CH
AR
GE
S &
BIL
LSH
EA
LTH
Col 4 (Statewide Median) is on a % of connected properties basis- best reveals statewide performance (gives due weight to larger LWUs & reduces effect of smaller LWUs).
Col 5 (National Median) is the median value for the 67 utilities reporting water supply performance in the National Performance Report 2013-14 (www.bom.gov.au).
NA
TU
RA
L R
ES
OU
RC
E
MA
NA
GE
ME
NT
WATER SUPPLY SYSTEM - Kyogle Council serves a population of 3,700 (1,910 connected properties). Water is drawn from the Clarence River to supply Kyogle, Bonalbo and Woodenbong. Council has
1 storage dam (total capacity 45 ML). The water supply network comprises 2 conventional treatment works (3.3 ML/d), 5 service reservoirs (6 ML), 5 pumping stations, 3 ML/d delivery capacity into the
distribution system, 26 km of transfer and trunk mains and 45 km of reticulation. 82% of the water supply is fully treated and the remainder is a disinfected non-potable supply for outdoor uses.
PERFORMANCE - Kyogle Council achieved 90% implementation of the NSW BPM requirements. The 2014-15 typical residential bill was $525 which was close to the statewide median of $582 (Indicator
14). However, the economic real rate of return was negative (Indicator 43). The operating cost (OMA) per property was $701 which was well above the statewide median of $400 (Indicator 49). Water
quality complaints were above the statewide median of 3 (Indicator 25). Compliance was achieved for microbiological water quality (100% of the population, 1 of 1 zones compliant), chemical water quality
and physical water quality. There were no failures of the chlorination system or the treatment system. Kyogle Council reported no water supply public health incidents. Current replacement cost of system
assets was $22M ($11,000 per assessment). Cash and investments were $0M, debt was $0.3M and revenue was $1.3M (excluding capital works grants).
YESC
As Kyogle Council's strategic business plan and financial plan are over 4 years old, it needs to prepare a 30-year IWCM Strategy and financial plan in accordance
2014-15 Non-residential Tariff: Access Charge based on Service Connection Size: 40mm: $1360, Inclining Block; Usage up to 200 kL, Usage Charge is 130 c/kL; Usage > 200 kL = 180
RANKING
Col 2 rankings are on a % of LWUs basis - best reveals performance compared to similar sized LWUs (ie. Col 1 is compared with LWUs with 1,501 to 3,000).
BPM Framework - Council needs to implement Appropriate Residential Charges (50% from usage charges) (2c).
with the July 2014 IWCM Check List (www.water.nsw.gov.au).
Col 3 rankings are on a % of LWUs basis - best reveals performance compared to all LWUs (ie. Col 1 is compared with all LWUs).
FIN
AN
CE
1,501 to
3,000
90%
YES
YES
YES
MEDIANS
12
13
12

Kyogle Council TBL Water Supply Performance (page 2) 2013-14
(Results shown for 10 years together with 2013-14 Statewide Median and Top 20%)
RESIDENTIAL USE/REVENUE FROM USAGE
COST RECOVERY
WATER QUALITY/CUSTOMER SERVICE
RELIABILITY
EFFICIENCY
NOTES:
1. Costs are in Jan 2014$ except for graphs 12 and 14, which are in Jan 2015$.
2. Microbiological water quality compliance 1999-00 to 2003-04 was on the basis of 1996 NHMRC/ARMCANZ Australian State Median for all years
Drinking Water Guidelines for E. coli; from 2004-05 to 2010-11 compliance was on the basis of the 2004 NHMRC/NRMMC Top 20% for 2013-14 ×Australian Drinking Water Guidelines (ADWG) and for 2011-12 to 2013-14 compliance was on the basis of the 2011 ADWG.
3. Indicators 33 and 33c - Green shading of bars shows % of time Drought Water Restrictions applied in each year: 0 - 30% 30-50% >50% of time
4. Indicator 33c - Yellow bars show Peak Week Water Supplied for comparison with Peak Day Water Supplied shown in green.
LEGEND
0
50
100
150
200
250
04/05 06/07 08/09 10/11 12/13
(kL/
a/P
rope
rty)
33. Average annual residential water supplied (W12)
0
50
100
150
200
250
300
05/06 07/08 09/10 11/12 13/14
(Res
iden
tial W
ater
Usa
ge C
harg
e c/
kL)
12. Water usage charge (P1.3)
0.0
0.5
1.0
1.5
2.0
2.5
3.0
3.5
4.0
4.5
04/05 06/07 08/09 10/11 12/13
(Num
ber p
er 1
000
prop
ertie
s)
10. Employees
0
100
200
300
400
500
600
700
05/06 07/08 09/10 11/12 13/14
($/A
sses
smen
t)
14. Typical residential bill (P3)
0
20
40
60
80
100
120
140
160
180
04/05 06/07 08/09 10/11 12/13
(min
)
28. Average duration of interruptions (C15)
0
20
40
60
80
100
04/05 06/07 08/09 10/11 12/13
(%)
20. Microbiological water quality compliance
0
1
2
3
4
5
6
7
8
04/05 06/07 08/09 10/11 12/13
(Num
ber p
er 1
,000
pro
pert
ies)
25. Water quality complaints (C9)
0
10
20
30
40
50
60
70
04/05 06/07 08/09 10/11 12/13
(Num
ber p
er 1
000
prop
ertie
s)
27. Average frequency of unplanned interruption (C17)
0
2
4
6
8
10
12
14
16
04/05 06/07 08/09 10/11 12/13
(Num
ber p
er 1
00km
of M
ain)
30. Main breaks (A8)
0
100
200
300
400
500
600
700
800
04/05 06/07 08/09 10/11 12/13
($/p
rope
rty)
49. Operating cost OMA (F11)
0
20
40
60
80
100
120
140
160
180
200
04/05 06/07 08/09 10/11 12/13
($/p
rope
rty)
51. Management cost
0.0
0.5
1.0
1.5
2.0
2.5
04/05 06/07 08/09 10/11 12/13
(kL/
d/P
rope
rty)
33c. Peak day water supplied Yellow bars show peak week for comparison - see note 4
0
10
20
30
40
50
60
70
80
90
100
04/05 06/07 08/09 10/11 12/13
(%)
16. Residential Revenue from Usage (F4)
0
5
10
15
20
25
30
35
04/05 06/07 08/09 10/11 12/13
(Nu
mb
er
pe
r 1
,00
0 p
rop
ert
ies)
26. Water service complaints (C10)
-10.0
-8.0
-6.0
-4.0
-2.0
0.0
2.0
4.0
6.0
04/05 06/07 08/09 10/11 12/13
(%)
43. Economic real rate of return (F17)

Kyogle Council TBL Sewerage Performance 2013-14
IMPLEMENTATION OF REQUIREMENTS OF NSW BEST-PRACTICE MANAGEMENT (BPM) FRAMEWORK
(1) Complete current strategic business plan & financial plan YES (2e) Pricing - DSP with commercial developer charges(2) (2a) Pricing - Full Cost Recovery without significant cross subsidies Yes (2f) Pricing - Liquid trade waste approvals & policy
(2b) Pricing - Appropriate Residential Charges Yes (3) Complete performance reporting (by 15 September)
(2c) Pricing - Appropriate Non-Residential Charges Yes (4) Integrated water cycle management strategy
(2d) Pricing - Appropriate Trade Waste Fees and Charges Yes IMPLEMENTATION OF ALL REQUIREMENTS
TRIPLE BOTTOM LINE (TBL) PERFORMANCE INDICATORSNo. LWU
C5 1 Population served: 3,600RESULT
All LWUsStatewide National
C8 2 Number of connected properties: 1,710 Number of assessments: 1,800 Note 1 Note 2 Note 3 Note 4
C6 3 Number of residential connected properties: 1,530 Col 1 Col 2 Col 3 Col 4 Col 5
4 New residences connected to sewerage (%) % 0.8 2 3 1.0
A6 5 Properties served per kilometre of main Prop/km 28 38 41
W18 6 Volume of sewage collected (ML) ML 307 4,600 5,723
7 Renewals expenditure (% of current replacement cost of system assets) % 0.6 1 2 0.5
8 Employees per 1000 properties per 1,000 prop 3.5 5 5 1.6
P4 Description of residential tariff structure: access charge/prop; independent of land value
P4.1 11a Residential access charge for 2013-14 ($/assessment) $ 2013-14 625 5 4 625 573
11 Residential access charge for 2014-15 ($/assessment) $ 2014-15 643 4 4 669
P6 12a Typical residential bill for 2013-14 ($/assessment) $ 2013-14 625 5 4 625 683
12 Typical residential bill for 2014-15 ($/assessment) $ 2014-15 643 4 4 669
13 Typical developer charge for 2014-15 ($/equivalent tenement) $ 2014-15 2,130 4 4 5,100
14 Non-residential sewer usage charge (c/kL) c/kL 100 4 4 136
F6 15 Revenue per property - Sge ($) $ 680 2 3 846 938
16 Sewerage Coverage (% of Urban Population with Reticulated Sge Service) % 87.0 4 4 97.9
E3 17 Percent of sewage treated to a tertiary level (%) % 93 4 4 98 91
E4 18 Percent of sewage volume treated that was compliant (%) % 96 3 3 100 100
E5 19 Number of sewage treatment works compliant at all times 1 of 3
21 Odour complaints per 1000 properties per 1,000 prop 1.8 5 5 1.0
C11 22 Service complaints - sewerage per 1000 properties per 1,000 prop 11 2 3 8 1
C16 23a Average sewerage interruption (minutes) min 90 3 3 109 105
25 Total days lost (%) % 1.7 4 3 2.9
W19 26 Volume of sewage collected per property (kL) kL 180 3 2 221 204
W26 26a Total recycled water supplied (ML) ML 210 1 3 630 1,638
W27 27 Recycled water (% of effluent recycled) % 73 1 1 12 17
E8 28 Biosolids reuse (%) % 8 2 2 100 100
30 Energy consumption - sewerage (kWh/ML) kWh 430 2 2 770
31 Renewable energy consumption (% of total energy consumption) % 0 1 1 0
E12 32 Net greenhouse gas emissions - WS & Sge (net tonnes CO2 equivalents per 1000 properties) 330 3 2 370 390
33 90th
Percentile licence limits for effluent discharge:
34 Compliance with BOD in licence (%) % 100 1 1 100
35 Compliance with SS in licence (%) % 96 4 4 100
A14 36 Sewer main breaks and chokes (per 100 km of main) per 100km main 16 1 2 37 20
37a Sewer overflows (per 100 km of main) per 100km main 6 5 4 13
E13 37b Sewer overflows reported to environmental regulator (per 100km of main) 0.0 1 1 0.8 0.4
39 Non res & trade waste % of total sge volume % 30 1 1 21
4243 Revenue from non-residential plus trade waste charges (% of total revenue) % 18 3 3 18
44 Revenue from trade waste charges (% of total revenue) % 2.5 1 2 2.0
F18 46 Economic real rate of return - Sge (%) % 0.4 3 4 1.5 2.6
46a Return on assets - Sge (%) % 0.1 4 4 1.3
48a Loan payment per property - Sge ($) $ 53 2 2 90
F24 48b Net profit after tax - WS & Sge ($'000) $'000 -237 5 5 1180 5,345
49 Operating cost (OMA) per 100 km of main ($'000) $'000 1,410 5 3 1,730
F12 50 Operating cost (OMA) per property ($) (Note 9) $ 511 5 5 430 405
51 Operating cost (OMA) per kL (cents) c/kL 284 5 5 206
52 Management cost per property ($) $ 161 4 4 161
53 Treatment cost per property ($) $ 210 5 5 155
54 Pumping cost per property ($) $ 109 5 5 68
55 Energy cost per property ($) $ 33 3 2 42
56 Sewer main cost per property ($) $ 30 2 2 47
F29 57 Capital Expenditure per property - Sewerage ($) $ 110 2 3 193 227
NOTES :
1
2
3
4
5
6
7
7
8
9
10
11
11
Operating cost (OMA)/property was $511. Components were: management ($161), operation ($276), maintenance ($30), energy ($33) and chemical ($11).
Kyogle Council rehabilitations included 1.6% of its sewerage mains and 0.1% of its service connections. Renewals expenditure was $300,000/100km of main.
As Kyogle Council's strategic business plan and financial plan are over 4 years old, it needs to prepare a 30-year IWCM Strategy and financial plan in accordance
review and update their 30-year total asset management plan (TAMP) and 30-year financial plan.
with the July 2014 IWCM Check List (www.water.nsw.gov.au).
Non-residential access charge - $254, proportional to square of size of service connection. Sewer usage charge - 100 c/kL.
Non-residential and trade waste volume was 30% of total sewage collected.
Non-residential revenue was 18% of revenue from access, usage & trade waste charges, indicating fair pricing of services between the residential and non-residential sectors.
Compliance with Total N in Licence was 100%. Compliance with Total P in Licence was 100%.
NA
TU
RA
L R
ES
OU
RC
E
MA
NA
GE
ME
NT
UT
ILIT
YE
NV
IRO
NM
EN
TA
L
EN
VIR
ON
ME
NT
AL
PE
RF
OR
MA
NC
E
SO
CIA
L
Col 5 (National Median) is the median value for the 66 utilities reporting sewerage performance in the National Performance Report 2013-14 (www.bom.gov.au).
Col 3 rankings are on a % of LWUs basis - best reveals performance compared to all LWUs (ie. Col 1 is compared with all LWUs). - see attachment.
EC
ON
OM
IC
FIN
AN
CE
EF
FIC
IEN
CY
Col 2 rankings are on a % of LWUs basis - best reveals performance compared to similar sized LWUs (ie. Col 1 is compared with LWUs with 1,500 to 3,000).
SE
RV
ICE
LEV
ELS
Col 4 (Statewide Median) is on a % of connected properties basis- best reveals statewide performance (gives due weight to larger LWUs & reduces effect of smaller LWUs).
LWUs are required to annually review key projections & actions in the later of their IWCM Strategy and financial plan and their Strategic Business Plan and to annually 'roll forward',
NWI
1,500 to
3,000
RANKING
CH
AR
AC
TE
RIS
TIC
SH
EA
LTH
CH
AR
GE
S &
BIL
LS
Yes
YES
YESC
100%
SEWERAGE SYSTEM - Kyogle Council serves a population of 3,600 (1,710 connected properties) and has 3 sewage treatment works providing advanced secondary treatment. The system
comprises 4,362 EP treatment capacity (Intermittent Extended Aeration (Activated Sludge), Trickling Filter and Oxidation Pond), 9 pumping stations (13 ML/d), 10 km of rising mains and 52 km of
gravity trunk mains and reticulation. 73% of effluent was recycled (Indicator 27) and the treated effluent is discharged to land and river.
PERFORMANCE - Residential growth for 2013-14 was 0.8% which is similar to the statewide median. Kyogle Council achieved 100% implementation of the NSW BPM requirements. The 2014-15
typical residential bill was $643 which was close to the statewide median of $669 (Indicator 12). The economic real rate of return was 0.4% which was less than the statewide median (Indicator 46).
The operating cost per property (OMA) was $511 which was above the statewide median of $430 (Indicator 50). Sewage odour complaints were above the statewide median of 1 (Indicator 21). Kyogle
Council reported no public health incidents. Council did not comply with the SS requirements of the environmental regulator for effluent discharge. The current replacement cost of system assets was
$29M ($16,200 per assessment), cash and investments were $1M, debt was $1M and revenue was $1.2M (excluding capital works grants).
Yes
MEDIANS
11
11

Kyogle Council TBL Sewerage Performance (page 2) 2013-14
(Results shown for 10 years together with 2013-14 Statewide Median and Top 20%)
COST RECOVERY
COMPLIANCE
CUSTOMER SERVICE/RELIABILITY
ENVIRONMENT
EFFICIENCY
NOTES:
1. Costs are in Jan 2014$ except for graphs 12 and 14, which are in Jan 2015$. LEGEND
State Median for all years
Top 20% for 2013-14 ×
0.0
0.5
1.0
1.5
2.0
2.5
3.0
3.5
4.0
4.5
5.0
04/05 06/07 08/09 10/11 12/13
(per
100
0 pr
oper
ties)
8. Employees
0
100
200
300
05/06 07/08 09/10 11/12 13/14
(c /
kL)
14. Non-residential Sewer Usage Charge
0
100
200
300
400
500
600
700
800
05/06 07/08 09/10 11/12 13/14
($/
asse
ssm
ent)
12. Typical residential bill (P6)
0
20
40
60
80
100
04/05 06/07 08/09 10/11 12/13
(%)
27. Recycled water (W27)
-1
0
1
2
3
4
5
6
7
8
9
10
11
12
13
14
15
04/05 06/07 08/09 10/11 12/13
(%)
46. Economic real rate of return (F18)
0
20
40
60
80
100
04/05 06/07 08/09 10/11 12/13
(%)
34. Compliance with BOD in licence
0
20
40
60
80
100
04/05 06/07 08/09 10/11 12/13
(%
) 35. Compliance with SS in licence
0
10
20
30
40
50
60
04/05 06/07 08/09 10/11 12/13
(per
100
km o
f mai
n)
36. Sewer main breaks and chokes (A12)
0
10
20
30
40
50
60
04/05 06/07 08/09 10/11 12/13
(per
100km
of
main
)
37a. Sewer overflows per 100km of main
0.0
0.5
1.0
1.5
2.0
2.5
3.0
3.5
4.0
4.5
5.0
04/05 06/07 08/09 10/11 12/13
(per
100
0 pr
oper
ties)
21. Odour complaints
0
100
200
300
400
500
600
04/05 06/07 08/09 10/11 12/13
($)
50. Operating cost (OMA) per property (F12)
0
20
40
60
80
100
120
140
160
180
04/05 06/07 08/09 10/11 12/13
($)
52. Management cost per property
0
61
122
183
244
305
366
427
489
04/05 06/07 08/09 10/11 12/13
(ton
nes)
32. Net Greenhouse gas emissions WS & SGE (E12)
0
20
40
60
80
100
04/05 06/07 08/09 10/11 12/13
(%)
28. Biosolids reuse (E8)
0
10
20
30
40
50
60
70
80
90
100
04/05 06/07 08/09 10/11 12/13
(%)
18. % Sewage treated that complied (E4)